Systems Report 2016 - Gas Networks · Ireland Transmission System 06 Systems eme et . ... of high...
72
gasnetworks.ie Systems Performance Report 2016
Transcript of Systems Report 2016 - Gas Networks · Ireland Transmission System 06 Systems eme et . ... of high...

gasnetworks.ie
SystemsPerformance Report 2016


1 Executive Summary 02
2 Introduction 04
3 Transmission System 083.1 Total length of pipe in transmission system 103.2 Total number of Connections 11
4 Transmission system data 124.1 Throughput 134.2 Demand change 154.3 System efficiency 164.4 Transmission unaccounted for gas 184.5 Shrinkage and balancing 204.6 Carbon usage/emissions 214.7 Storage 224.8 Capacity bookings 234.9. Entry capacity booking processing 244.10 Performance standards 25
5 GasPointRegistrationOffice(GPRO) 265.1 Overview of GPRO 27
6 Achievement of Capital Programme 306.1 Reinforcement 316.2 Refurbishment 316.3 Interconnectors 316.4 New supply 31
7 Transmission Gas Safety 327.1 High level safety statistics 327.2 Third party damage 347.3 Update on the Safety Case 347.4 Update on Natural Gas Emergency Manager Activities 35
8 Code of Operations Obligations 368.1 Systems availability 378.2 NDM Change of Shipper processing 378.3 Invoice circulation 388.4 Meter reading access rates 388.5 Meter data services 398.6 Provision of shrinkage gas quantity/costs estimates 408.7 Maintenance days interruptions 40
9 Distribution System 429.1 Distribution system data 429.2 Distribution UAG 439.3 Total number of connections (by category) 449.4 Total length of pipe in the distribution system 449.5 Achievement of distribution capital programme 459. 6 Reinforcement 469.7 New connections during year (by category) 479.8 Update on new towns receiving gas 48
10 Distribution Gas Safety 5010.1 Overview of gas safety 5010.2 High level safety objectives 5110.3 High level distribution safety statistics 5310.4 Public reported escapes 5410.5 Distribution safety performance 5410.6 Promoting public awareness of gas safety 5410.7 Addressing gas meter tampering 54
11 Conclusion 56
12 Appendices 5812.1 Glossary of Terms 5912.2 Tables used for Chart Graphics 6012.3 List of Figures 6712.4 List of Tables 68
Contents
Gas Networks Ireland 01

The Gas Networks Ireland Performance Report has been published annually since 2008. In 2015, the report format was changed, the original combined Performance Report has been replaced with the introduction of two specific reports: • A Systems Performance Report; and • A Customer Performance Report.
The Systems Performance Report provides an overview of how both the natural gas transmission and distribution networks have operated during 2016 in relation to all systems activities.
Executive Summary
01.
Systems Performance Report 201602

In 2016 Gas Networks Ireland continued to build and operate a modern and safe gas network. The business maintained a strong safety record and successfully completed planned work programmes.
Gas demand increased by 10% in 2016 compared to 2015; this can be attributed to economic growth factors and further requirements from the power generation sector during the period. The Corrib gas field came on stream in late 2015 adding a third entry point to the system, further enhancing Ireland’s energy security and providing additional capacity in the network to meet growing demand. The Corrib entry point has also changed the operation of the system, necessitating variable flows.
Natural gas is the most environmentally friendly fossil fuel; it is a clean, secure, flexible, adaptable fuel which can play a key role in the transition of the Irish economy to a low carbon future, capable of meeting Ireland’s future energy needs. As the economy continues to recover, connections to the network have increased and gas demand is forecast to grow in the shorter term. However, climate change policies and technological advances in renewable technology and storage will present Gas Networks Ireland with long term demand challenges that need to be planned and prepared for in the immediate term.
Gas Networks Ireland endeavours to operate and maintain an efficient system by investing in replacement and maintenance of the pipeline assets through capital programmes and growing the network to facilitate new connections and towns, so that it can continue to deliver a safe, secure and cost effective energy and offset the market demand challenges. In 2016, the connection of Listowel to the natural gas network was announced, work continued on the connection of Nenagh and Wexford towns.
Gas demand increased by 10% in 2016 compared to 2015
Gas Networks Ireland 03

The Gas Networks Ireland System Performance Report meets the licence conditions pertaining to “Overall standards and performance” of the four licences held by Gas Networks Ireland, granted by the Commission for Energy Regulation (CER);• Distribution System Owner Licence;• Distribution System Operator (DSO) Licence;• Transmission System Owner Licence; and• Transmission System Operator (TSO) Licence.
Introduction
02.
Systems Performance Report 201604

Gas Networks Ireland is responsible for developing, maintaining and operating the gas transmission and distribution systems. The Gas Networks Ireland system connects the Republic of Ireland (RoI) to Scotland, Northern Ireland (NI) and the Isle of Man (IoM). Gas Networks Ireland does not purchase, trade or sell gas to customers; it transports the gas on behalf of suppliers and shippers who purchase the gas from the wholesale gas market, and in turn use the transportation services of Gas Networks Ireland to deliver gas to over 26,000 businesses and almost 654,000 homes throughout Ireland. The Gas Networks Ireland system includes infrastructure in RoI regulated by the CER, NI regulated by the Utility Regulator (UR) and South West Scotland regulated by Ofgem. The natural gas network is differentiated by prevailing pressures:• high pressure transmission infrastructure which operates above 16 barg (the
total length of transmission pipeline is 2,427km); and• distribution infrastructure which operates below 16 barg (the total length of
distribution pipeline is 11,527km)
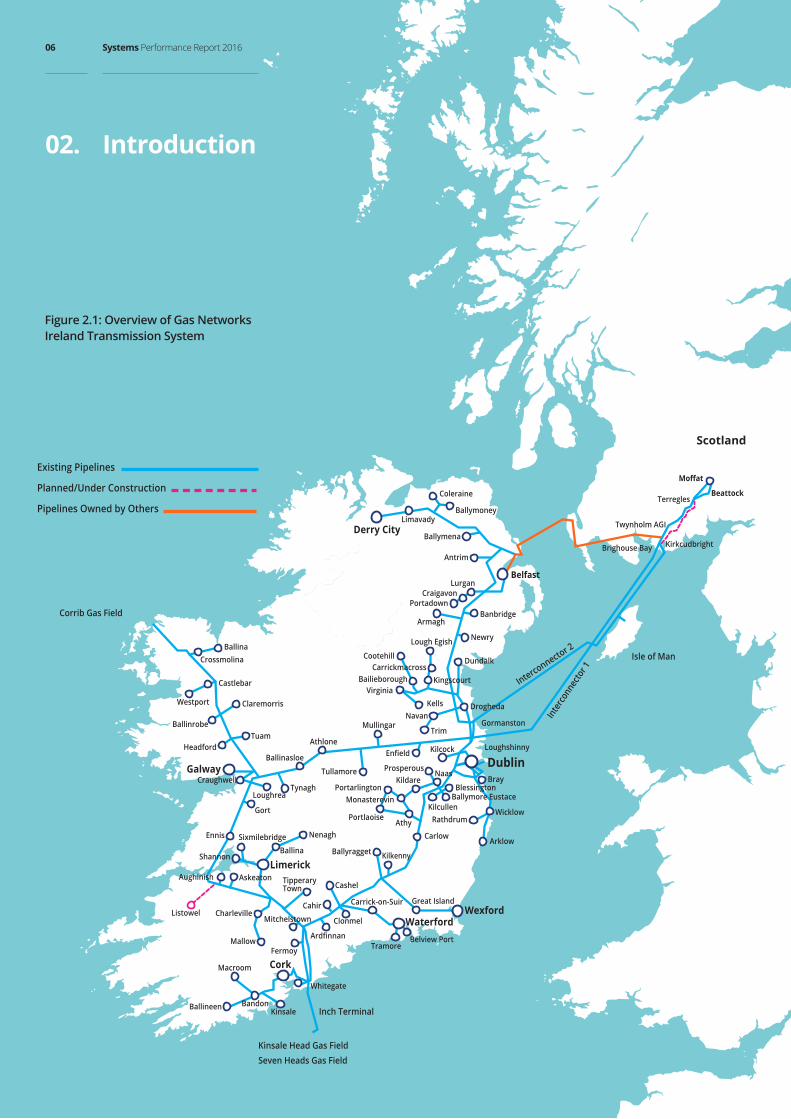
The transmission system is detailed in Figure 2.1 overleaf.
Deliver gas to over 26,000 businesses and almost 654,000 homes throughout Ireland
Gas Networks Ireland 05
Corrib Gas Field
Scotland
Isle of Man
Kinsale Head Gas FieldSeven Heads Gas Field
Castlebar
Westport Claremorris
Ballinrobe
Headford
LoughreaTynagh
Gort
Galway
Tuam
Ballinasloe
Athlone
Tullamore
Mullingar
Kilcock
Virginia
CarrickmacrossCootehill
Newry
Banbridge
Lurgan
Dundalk
Drogheda
Gormanston
Loughshinny
CrossmolinaBallina
Limerick
Cork
Nenagh
Craughwell
Trim
NavanKells
Bailieborough Kingscourt
Lough Egish
Armagh
PortadownCraigavon
Interconnector 2
Inte
rcon
necto
r 1
Antrim
Moffat
Beattock
Twynholm AGI
Terregles
Brighouse Bay KirkcudbrightBallymena
Limavady
Coleraine
Ballymoney
Enfield
Ennis
BallinaShannon
AskeatonAughinish
Sixmilebridge
Mitchelstown
Cahir
Fermoy
Charleville
Mallow
KinsaleBandonBallineen
Macroom
Whitegate
Inch Terminal
Belfast
Derry City
Tramore
Carrick-on-Suir
Kilkenny
Great Island
CarlowAthy
Kildare
KilcullenMonasterevin
NaasProsperous
Ballymore Eustace
Portlaoise
Ballyragget
Portarlington
Arklow
Wicklow
BrayBlessington
Rathdrum
Clonmel
Ardfinnan
Tipperary Town Cashel
Dublin
WaterfordWexford
Belview Port
Listowel
Existing Pipelines
Planned/Under Construction
Pipelines Owned by Others
Introduction02.
Figure 2.1: Overview of Gas Networks Ireland Transmission System
Systems Performance Report 201606

Natural gas is transported to 680,000 customers through a network of 13,954km pipelines, 24 hours a day, 365 days a year. Gas Networks Ireland is responsible for connecting all customers to the network, regardless of their supplier. The company manages a 24 hour gas emergency service, handling over 17,000 call-outs a year.
Through the Gas Networks Ireland Connections Policy, Gas Networks Ireland continually brings the benefits of natural gas to new towns. In 2016, construction work on gas to Nenagh and Wexford town continued and the network extension to include Listowel was also announced.
Natural gas is a clean, efficient and cost effective fuel. Natural gas is actively promoted by Gas Networks Ireland as a fuel of choice for homes, businesses and industry. The organisation is keen to see greater utilisation of the natural gas network and explore opportunities to expand the network where viable. There is considerable emphasis on investing in new business areas such as natural gas vehicles and renewable gas.
Natural gas is actively promoted by Gas Networks Ireland as a fuel of choice for homes, businesses and industry
Gas Networks Ireland 07

This report satisfies condition 17 of the Transmission System Operator Licence and condition 13 of the Transmission System Owner Licence. Gas Network Ireland’s primary responsibility is to transport gas from entry to exit points on the network, on behalf of customers, while ensuring that the network is operated safely and efficiently.
Transmission System
03.
Systems Performance Report 201608
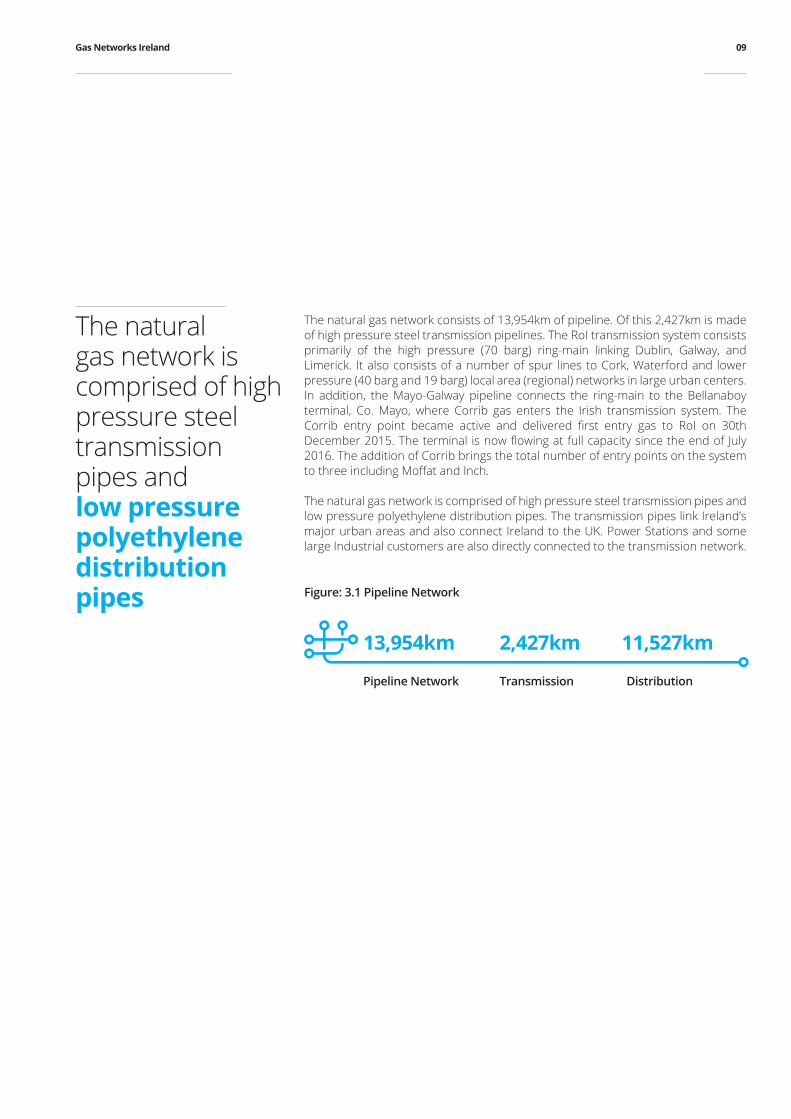
The natural gas network consists of 13,954km of pipeline. Of this 2,427km is made of high pressure steel transmission pipelines. The RoI transmission system consists primarily of the high pressure (70 barg) ring-main linking Dublin, Galway, and Limerick. It also consists of a number of spur lines to Cork, Waterford and lower pressure (40 barg and 19 barg) local area (regional) networks in large urban centers. In addition, the Mayo-Galway pipeline connects the ring-main to the Bellanaboy terminal, Co. Mayo, where Corrib gas enters the Irish transmission system. The Corrib entry point became active and delivered first entry gas to RoI on 30th December 2015. The terminal is now flowing at full capacity since the end of July 2016. The addition of Corrib brings the total number of entry points on the system to three including Moffat and Inch.
The natural gas network is comprised of high pressure steel transmission pipes and low pressure polyethylene distribution pipes. The transmission pipes link Ireland’s major urban areas and also connect Ireland to the UK. Power Stations and some large Industrial customers are also directly connected to the transmission network.
Figure: 3.1 Pipeline Network
The natural gas network is comprised of high pressure steel transmission pipes and low pressure polyethylene distribution pipes
13,954km Pipeline Network
2,427km Transmission
11,527km Distribution
Gas Networks Ireland 09
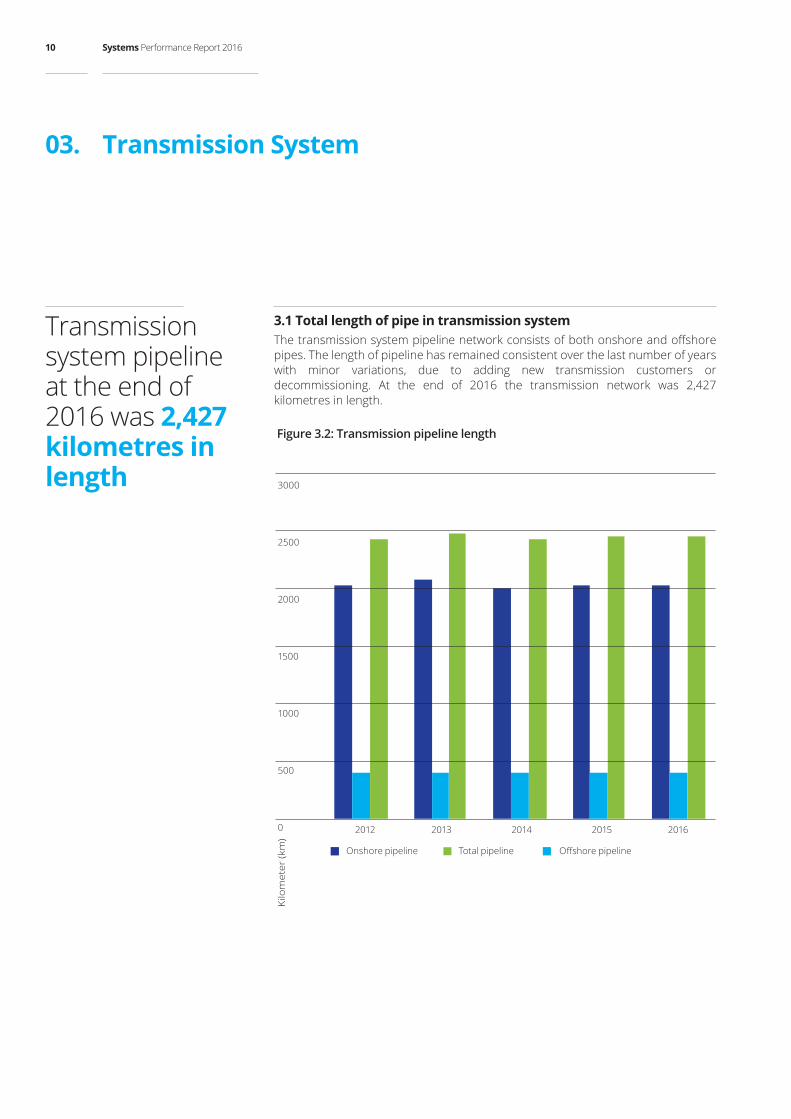
3.1 Total length of pipe in transmission systemThe transmission system pipeline network consists of both onshore and offshore pipes. The length of pipeline has remained consistent over the last number of years with minor variations, due to adding new transmission customers or decommissioning. At the end of 2016 the transmission network was 2,427 kilometres in length.
Figure 3.2: Transmission pipeline length
2012 2013 2014 2015 2016
Kilo
met
er (k
m)
Onshore pipeline Offshore pipeline Total pipeline
0
500
1000
1500
2000
2500
3000
Transmission System03.
Transmission system pipeline at the end of 2016 was 2,427 kilometres in length
Systems Performance Report 201610
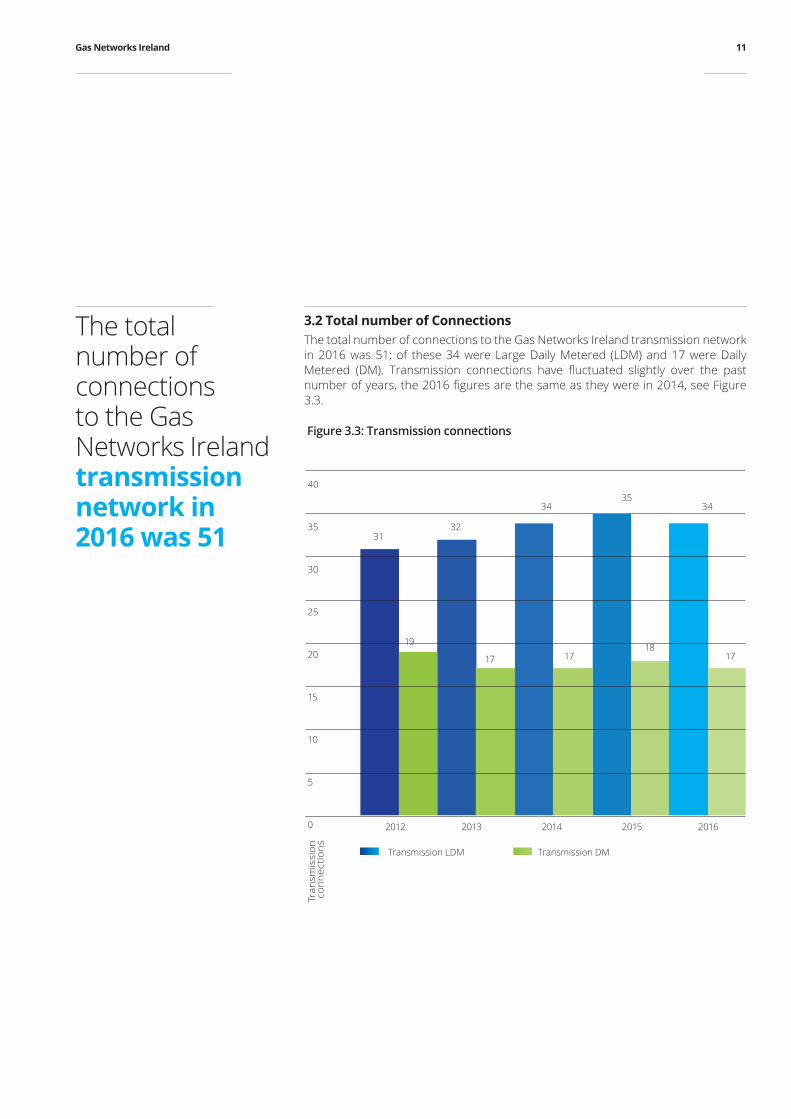
3.2 Total number of ConnectionsThe total number of connections to the Gas Networks Ireland transmission network in 2016 was 51; of these 34 were Large Daily Metered (LDM) and 17 were Daily Metered (DM). Transmission connections have fluctuated slightly over the past number of years, the 2016 figures are the same as they were in 2014, see Figure 3.3.
Figure 3.3: Transmission connections
2012 2013 2014 2015 2016 0
5
10
15
20
25
30
35
40
Tran
smis
sio
n co
nn
ectio
ns
31 32
34 35
34
19
17 17 18
17
Transmission LDM Transmission DM
The total number of connections to the Gas Networks Ireland transmission network in 2016 was 51
Gas Networks Ireland 11

Managing the flow of gas from the entry points to the end consumer is a sophisticated 24-hour operation. It involves continuous monitoring of gas flows, temperatures and system pressures through a Supervisory Control and Data Acquisition (SCADA) system for both transmission and distribution networks. SCADA uses process data telemetered from all the operational sites and installations to monitor and operate the entire gas network. In addition to the SCADA system, Gas Networks Ireland utilises a number of additional systems to assist with the operation of both the transmission and distribution networks. These include the Geographical Information System (GIS), Maximo work management system, SafePermit for non routine operations, permits to work and on-line access to Gas Networks Ireland IT infrastructure and systems.
Transmission System Data
04.
Systems Performance Report 201612

The transmission network is operated by Grid Control which is a 24/7 manned control room consisting of 12 Grid Controllers. The Grid Controllers are responsible for operational and commercial function. The operational element of the control room is facilitated by SCADA to safely and efficiently operate the network including system flows, temperatures, pressures and alarm management. The commercial aspect of gas transportation is facilitated by the Gas Transportation Management System (GTMS) through which the Grid Controllers ensure supply-demand balance. This is achieved through management of the daily nomination and allocation process, ensuring that the correct volume of gas is transported at all times to meet shipper, customer and system requirements.
4.1 ThroughputSystem throughput is the total physical volume of natural gas transported through the Irish gas network by Gas Networks Ireland. The total gas transported in the calendar year 2016 was 55,110 GWh, which represents an increase of c.10% from 50,192 GWh in 2015. This includes 64 GWh of fuel gas transported for NI which was burned at Beattock Compressor Station. Gas transported for RoI Power-Generation in 2016 increased by 21% in comparison to 2015 figures. A summary of the gas throughput from 2012 to 2016 is illustrated in Table 4.3 and Figure 4.1.
55,110 Total gas transported (GWh)
151 Daily average gas transported (GWh)
225 Peak day gas transported (GWh)
The transmission network is operated by Grid Control which is a 24/7 manned control room consisting of 12 Grid Controllers
Gas Networks Ireland 13

Figure 4.1: System throughput
10000 50
100
150
200
250
20000
30000
40000
50000
60000
Total gas transported (GWh) Daily average transported (GWh)
Peak day transported (GWh)
2012 2013 2014 2015 2016 0 0
Figure 4.2: System throughput per entry point (Calendar Year 2016)
Inch Moffat Corrib
6%
40%54%
Transmission System Data04.
Gas transported for RoI Power-Generation in 2016 displayed an increase of 21% in comparison to 2015figures
Systems Performance Report 201614

4.2 Demand changeDemand is the total amount of gas physically off-taken from the gas network in the RoI each year. Figure 4.3 reflects the demand for gas in 2016 which has increased by 10% on the 2015 demand. The increase has been experienced across all sections of the gas market including power generation, LDM, NDM and DM:• Power Gen Increase of 21% mainly due to Moyle Electricity I/C operating on
reduced capacity and downtime of the East West I/C;• LDM & DM Continued growth in the Industrial and Commercial (I & C) sector with
a17% increase in annual demand; and • NDM Marginal increase of 3% on 2015 demand.
Figure 4.3: Demand change
2012 2013 2014 2015 2016
GW
h
47000
48000
49000
50000
51000
52000
53000
54000
55000
56000
Trend Demand
The demand for gas in 2016 increased by 10% on the 2015 demand
Gas Networks Ireland 15
4.3Systemefficiency(a) DeliveryIn October 2015, as part of the introduction of the EU Network Balancing Code, an Operational Balancing Account (OBA) was introduced at all Interconnection Points (IP) entry points. This is a result of allocations now being equal to nominations, as opposed to the actual metering in normal operating conditions. The OBA has added flexibility in delivering the total nominations each day. This has daily and cumulative limits for each IP as agreed by the network operators.
The amendment to the EU Network Code in October 2015 saw the removal of the requirement for shippers to maintain a Zero Imbalance Position (ZIP)1. This has resulted in higher variability in entry-exit nominations at the Moffat IP. Large upward and downward nomination movements late in the gas day are now much more frequent. The development of the enhanced functionality of Virtual Reverse Flow (VRF) as an interruptible product on GTMS has also resulted in entry nominations diverging from the physical metered volumes at IPs. This has created increased difficulty in compressor management in achieving end-of-day entry nominations at the Moffat IP. Each compressor station has a minimum required flow of gas for operation. If the required flow of gas is lower than the minimum, recycling2 may be used. If the gas flow is too low to accommodate recycling, then batching3 will be used. Batching of compressors in Scotland is now a daily operation which can impact balancing end of day nominated quantities. At the Inch entry point, low hourly flows have at times led to difficulties in achieving the end of day quantities nominated by shippers. Low hourly flows are a result of shipper/producer requirements. Providing entry gas at low flow at Inch, required recycling of the flow for the safe and economical running of Midleton compressors.
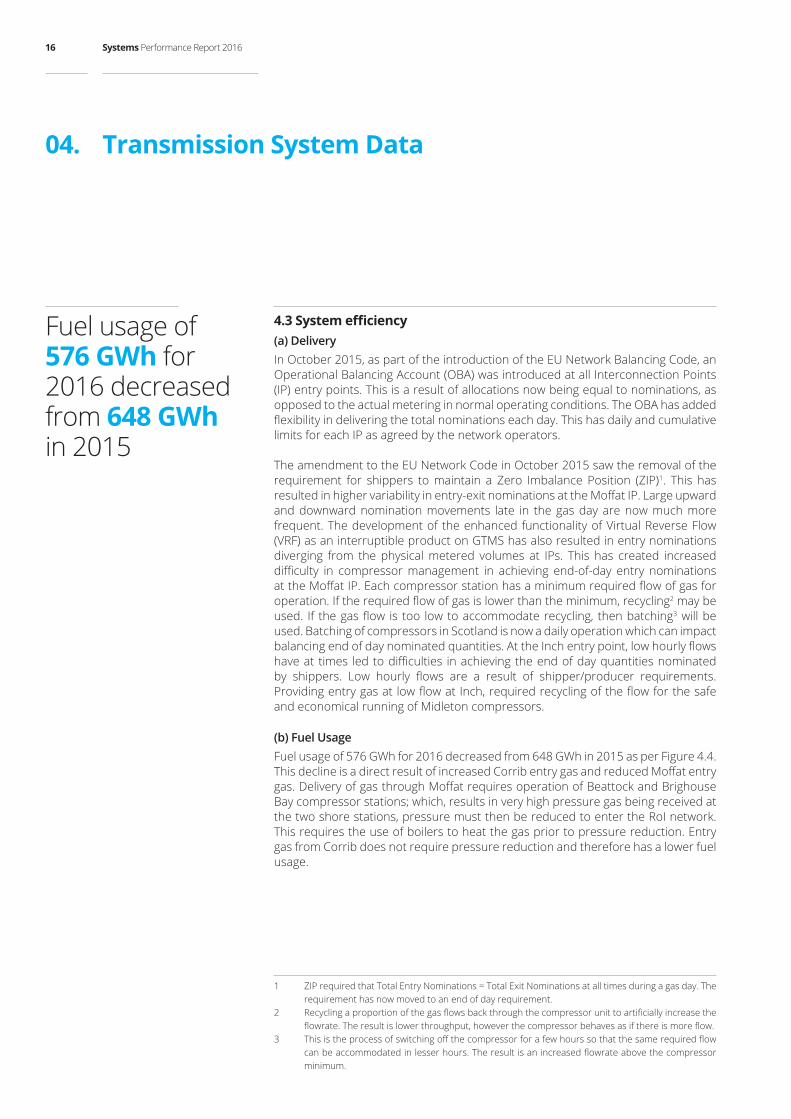
(b) Fuel Usage Fuel usage of 576 GWh for 2016 decreased from 648 GWh in 2015 as per Figure 4.4. This decline is a direct result of increased Corrib entry gas and reduced Moffat entry gas. Delivery of gas through Moffat requires operation of Beattock and Brighouse Bay compressor stations; which, results in very high pressure gas being received at the two shore stations, pressure must then be reduced to enter the RoI network. This requires the use of boilers to heat the gas prior to pressure reduction. Entry gas from Corrib does not require pressure reduction and therefore has a lower fuel usage.
1 ZIP required that Total Entry Nominations = Total Exit Nominations at all times during a gas day. The requirement has now moved to an end of day requirement.
2 Recycling a proportion of the gas flows back through the compressor unit to artificially increase the flowrate. The result is lower throughput, however the compressor behaves as if there is more flow.
3 This is the process of switching off the compressor for a few hours so that the same required flow can be accommodated in lesser hours. The result is an increased flowrate above the compressor minimum.
Transmission System Data04.
Fuel usage of 576 GWh for 2016 decreased from 648 GWh in 2015
Systems Performance Report 201616

(c) Meter Read VerificationTransmission meter read verifications give an indication of the number of transmission connected gas points that require meter reading adjustments as a result of failed meter reading validation4. Figure 4.5 shows that 1.9% of all transmission site-metering validation checks carried out in 2016 resulted in adjustments (i.e. approximately 25 transmission site-metering adjustments performed out of 1,308 metering validation checks in 2016). Adjustments are required to ensure accurate reading when a meter is out of tolerance, configured incorrectly or replaced.
Adjustments increased in 2016 by 0.6% on the previous year. This resulted from a review of consumption patterns of all fiscal metering sites; both transmission and distribution. Gas Networks Ireland has increased the frequency of and introduced additional, validation checks which has resulted in an increased number of adjustments identified in 2016, ensuring more accurate end user allocations.
4 Adjustments typically arise as a result of (i) a communications failure – e.g. a site telemetry failure resulting in advances in the site meter not properly communicated to GTMS via SCADA. (ii) an issue with the meter correction equipment on site.
Figure 4.4: Fuel usage
2012 2013 2014 2015 2016
GW
h
852 829 818
648 576
Trend
0
200
400
600
800
1000
Fuel usage
1.9% of all transmission site-metering validation checks carried out in 2016 resulted in adjustments
Gas Networks Ireland 17

4.4 Transmission unaccounted for gas Unaccounted for Gas (UAG)5 means natural gas which is lost or otherwise unaccounted for in the transportation system or any localised part thereof. Figure 4.6 relates to transmission UAG6 as a percentage of the overall system throughput.
UAG is dependent on a number of factors including the following;• Gas Measurement – The received gas at the three entry points differs in terms
of its composition and energy value. This leads to measurement uncertainties in terms of the fixed gas component values on fiscal metering flow computers; and
• Operations and maintenance – venting of gas, purging of pipelines, meters, gas chromatographs and gas leakage.
Gas Networks Ireland has maintenance and calibration policies in place for all meters and instrumentation to ensure measurement accuracy of gas entering and exiting the system. Gas Networks Ireland’s general pipeline and Above Ground Installation (AGI) maintenance policies seek to prevent leakage and minimise venting of gas.
5 Volume as a % of total gas6 Transmission UAG is calculated as Entry (Stock Gas + Metered Entry) Minus Exit (Metered Exit +
Shrinkage + Own Use Gas)
Figure 4.5: Meter read verification
2012 2013 2014 2015 2016
%
1.57
1.25 1.32 1.31
1.91
0
0.5
1
1.5
2
2.5
Adjustments KPI <2%
Transmission System Data04.
Gas Networks Ireland has maintenance and calibration policies in place for all meters and instrumentation to ensure the accuracy of measurement of gas entering and exiting the system
Systems Performance Report 201618

The reduction in UAG in 2016 is a result of increased metering verification checks conducted to ensure more accurate gas accounting. UAG is measured in “Gas Year” (October-September), and therefore the calendar year value may be different.
Figure 4.6: Transmission UAG (% throughput)
2012 2013 2014 2015 2016
Calendar year%
0
0.1
0.2
0.3
Throughput
Figure 4.7: Transmission UAG (energy - GWh)
2012 2013 2014 2015 2016
GW
h
0
50
100
150
200
Energy (GWh) Calendar year
The reduction in UAG in 2016 is a result of increased metering verificationchecks being carried out to ensure more accurate gas accounting
Gas Networks Ireland 19

4.5 Shrinkage and balancing“Shrinkage Gas” means own use gas and/or natural gas required to replace “Unaccounted for Gas” (UAG) and gas used for fuel within the network. Table 4.9 shows Shrinkage Gas attributed to the RoI system as a percentage of throughput stood at 0.8% in 2016, this is illustrated in Figure 4.8.
The reduction in fuel gas usage; as previously outlined, is due to the reduction in the use of the interconnectors and Scottish compressor stations since the full capacity of the Corrib entry point is being utilised. Fuel gas is used to run the compressor stations and network installations.
A balancing action means buying or selling gas as required to match the amount of gas entering and leaving the system. Smaller more frequent balancing actions are now being utilised to foster liquidity at Irish Balancing Point (IBP) market. In addition, shipper behaviour in terms of nomination imbalances has greatly contributed to the significant increase in balancing actions needed to maintain sufficient line-pack7 for network service and operational safety.
7 Natural gas occupying all pressurised sections of the pipeline network
Figure 4.8: Shrinkage as % of throughput
2012 2013 2014 2015 2016
%
0
0.2
0.4
0.6
0.8
1
1.2
1.4
1.6
1.8
Shrinkage
Transmission System Data04.
Shrinkage Gas attributed to the RoI system as a percentage of throughput stood at 0.8% in 2016
Systems Performance Report 201620

Table 4.1: System balancing actionsAction 2012 2013 2014 2015 2016
System balancing actions 20 22 35 32 120Shipper imbalance as % of total flow8 0.4% 0.22 0.39% 0.24% 0.54%
4.6 Carbon usage/emissionsGas Networks Ireland is committed to managing its impact on the environment. Transmission system activities such as the operation of compressors affect the environment and the organisation recognises its responsibility to manage and minimise this impact. As part of its commitment to sustainable environmental and energy practices, Gas Networks Ireland has documented environmental and energy policies9. The environmental policy addresses the key areas of climate change, biodiversity, waste, resource use and procurement. The energy policy specifically addresses issues of energy performance and energy efficiency.
Gas compressors are used by Gas Networks Ireland to move gas through and around the transmission system. As a participant in the European Emission Trading Scheme (ETS) Gas Networks Ireland has an emissions allowance for CO2 emissions. Gas Networks Ireland is committed to monitoring and reducing emissions from these compressors. Gas Networks Ireland is also required to comply with environmental legislation in respect of the compressors, such as noise monitoring and mitigation. In order to meet legal obligations, it is essential to develop and maintain a
8 This relates to overall system throughput, i.e. section 4 that is RoI 2016 Total Gas Transported of 55,110 GWh.
9 Environment and Energy Policies
Figure 4.9: System balancing actions
2012 2013 2014 2015 2016 0
20
40
60
80
100
120
140
20 22
35 32
120
Balancing actions
Gas Networks Ireland is committed to managing its impact on the environment
Gas Networks Ireland 21

robust strategy for operations, maintenance, upgrading and replacement of the compressors. This is being achieved through the Capital Programme; further details of which is provided in section 6.
Carbon usage is a measurement of the tonnes of carbon emissions produced at each of the compressor stations based on fuel gas consumption. Emissions reduce with lower throughput but increase when subject to high flow variation (e.g. intra-day peaks). This variation refers to where the compressors are forced to operate outside their most efficient operating range.
There are a number of factors that influenced the emissions levels in 2016. The decrease in CO2 emissions form the Gas Network Ireland compressor stations above is due to a large proportion of RoI gas coming from Corrib. Compression associated with Corrib is not operated by Gas Networks Ireland and therefore is not included above. The number of units running, power generation demand variation in the 37.5 barg network, suction and discharge pressures on the network, all contribute to the amount of CO2 emitted by the stations. The demand changes for the various compressor sites is shown in Table 4.10.
4.7 StorageThe Kinsale storage facility is operated by PSE Kinsale Energy Limited using the depleted Southwest Kinsale gas field. The storage operations at the Kinsale facility are expected to cease in 2017 as the operator begins the extraction of ‘cushion gas’ prior to full decommissioning.
Figure 4.10: Compressor Station carbon emissions
2012 2013 2014 2015 2016
Tonn
es Midleton Beattock Brighouse
0
10000
20000
30000
40000
50000
60000
70000
Transmission System Data04.
Systems Performance Report 201622

4.8 Capacity bookingsGas Networks Ireland transports natural gas around the country on behalf of licensed natural gas shippers. These shippers are required to reserve capacity (space) in the natural gas network to guarantee a secure supply to each of their customers. Exit capacity reflects the amount of capacity booked by shippers on the transmission system. The amount of space reserved by shippers for each customer on the distribution network is referred to as the Supply Point Capacity (SPC). On the 31st of December 2016, 247 GWh was the total exit capacity booked for Power, DM, I & C, NDM and Shrinkage. This is shown in Table 4.12 and illustrated in Figure 4.11.
• Power - from 2011 to 2013, capacity bookings decreased mainly due to increased wind generation, the position of gas in the Single Electricity Market (SEM) and depressed coal prices. Since 2014, power capacity bookings have increased mainly due to increased power demand. However, bookings are still less than 2012 levels. 2016 was a strong year for power, largely due to higher electricity demand and the EWIC interconnector behaviour (moving from mostly importing to exporting).
• LDM - bookings have increased since 2012 due to the removal of secondary transfers (October 2013), increased load from large energy users, New Town anchor load connections and the economic recovery.
• NDM - bookings have decreased overall mainly due to increased energy efficiency.
On the 31st of December 2016, 114 GWh was the total SPC for Power, DM, NDM I & C and Residential customers as shown in Table 4.12 and illustrated in Figure 4.12.
Figure 4.11: Exit capacity bookings
2012 2013 2014 2015 2016
Power DM I & C NDM Shrinkage
0
20,000,000
40,000,000
60,000,000
80,000,000
100,000,000
120,000,000
140,000,000
On the 31st of December 2016, 247 GWh was the total exit capacity booked for Power, DM, I & C, NDM and Shrinkage
Gas Networks Ireland 23
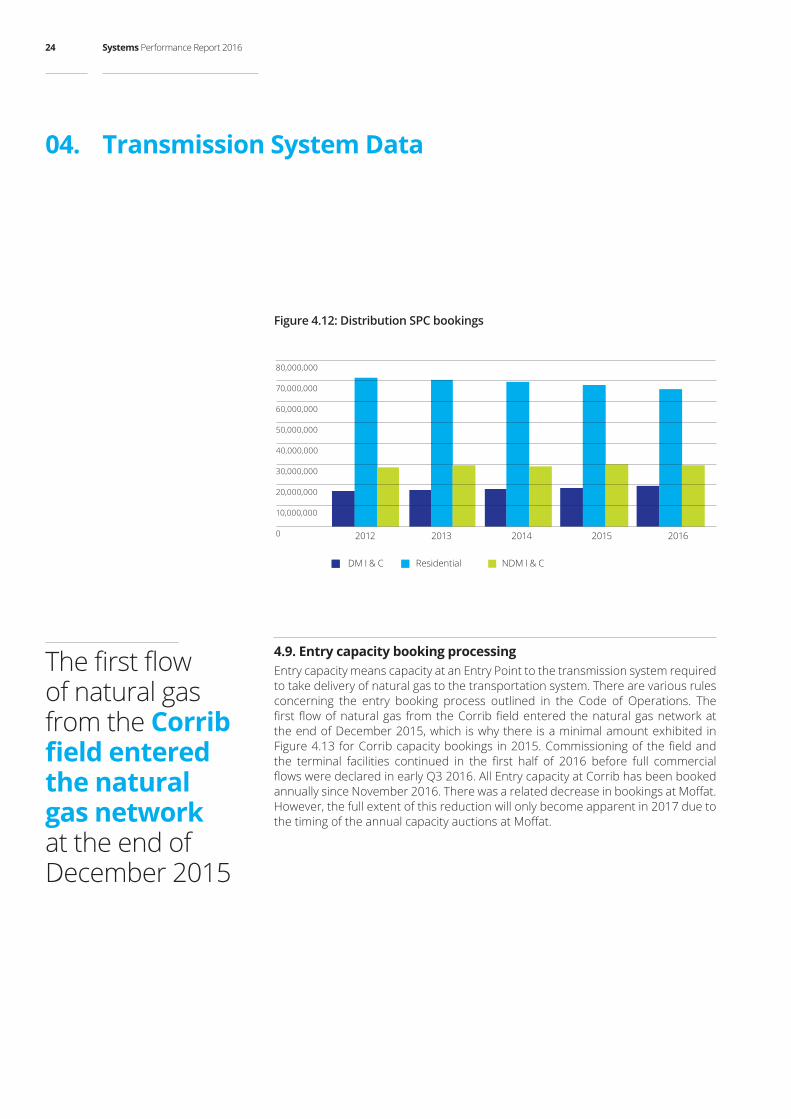
4.9. Entry capacity booking processingEntry capacity means capacity at an Entry Point to the transmission system required to take delivery of natural gas to the transportation system. There are various rules concerning the entry booking process outlined in the Code of Operations. The first flow of natural gas from the Corrib field entered the natural gas network at the end of December 2015, which is why there is a minimal amount exhibited in Figure 4.13 for Corrib capacity bookings in 2015. Commissioning of the field and the terminal facilities continued in the first half of 2016 before full commercial flows were declared in early Q3 2016. All Entry capacity at Corrib has been booked annually since November 2016. There was a related decrease in bookings at Moffat. However, the full extent of this reduction will only become apparent in 2017 due to the timing of the annual capacity auctions at Moffat.
Figure 4.12: Distribution SPC bookings
2012 2013 2014 2015 2016
DM I & C Residential NDM I & C
0
10,000,000
20,000,000
30,000,000
40,000,000
50,000,000
60,000,000
80,000,000
70,000,000
Transmission System Data04.
The first flow of natural gas from the Corrib fieldenteredthe natural gas network at the end of December 2015
Systems Performance Report 201624
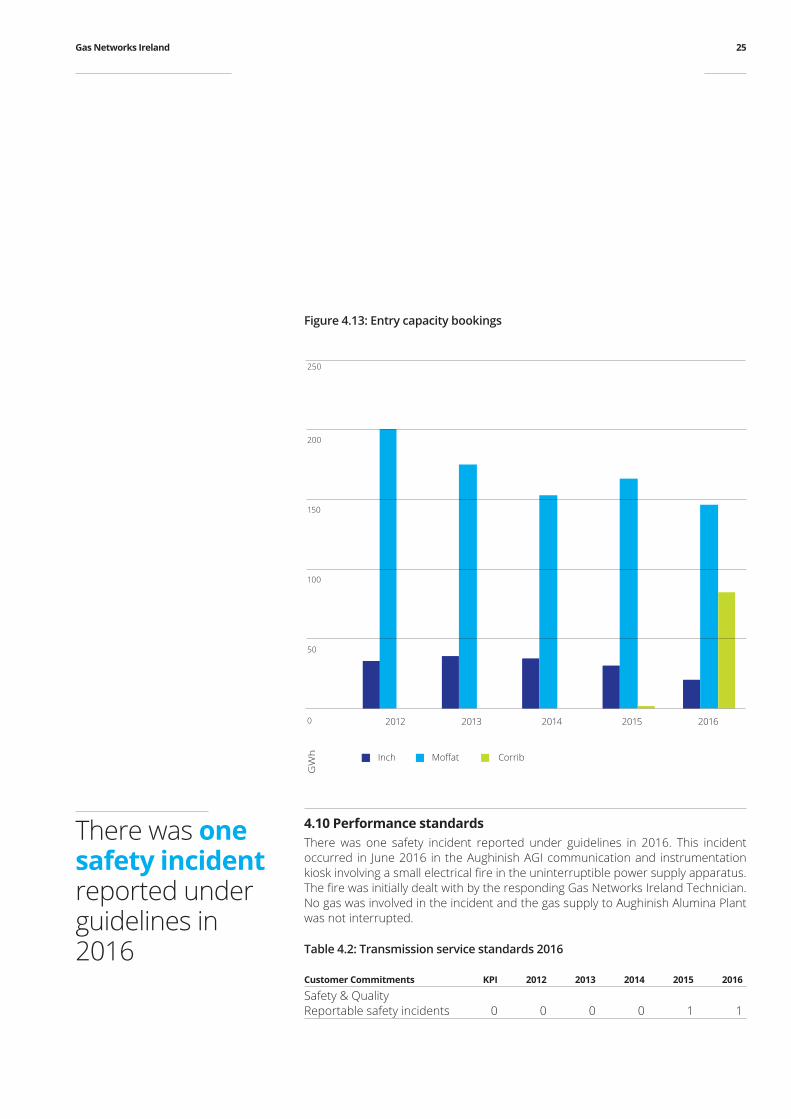
4.10 Performance standardsThere was one safety incident reported under guidelines in 2016. This incident occurred in June 2016 in the Aughinish AGI communication and instrumentation kiosk involving a small electrical fire in the uninterruptible power supply apparatus. The fire was initially dealt with by the responding Gas Networks Ireland Technician. No gas was involved in the incident and the gas supply to Aughinish Alumina Plant was not interrupted.
Table 4.2: Transmission service standards 2016
Customer Commitments KPI 2012 2013 2014 2015 2016
Safety & QualityReportable safety incidents 0 0 0 0 1 1
Figure 4.13: Entry capacity bookings
2012 2013 2014 2015 2016
Inch Moffat Corrib
GW
h
0
50
100
150
200
250
There was one safety incident reported under guidelines in 2016
Gas Networks Ireland 25

9,530 Gas Points registered in 2016
680,155 Total Gas Points
93,435 Change of Shippers in 2016
1,872 Gas Points de-registered in 2016
Gas Point Registration Office(GPRO)
05.
Systems Performance Report 201626

5.1 Overview of GPROThe function of the GPRO is to maintain a register for each Gas Point through which a natural gas customer is supplied; this includes registrations and de-registrations.
The GPRO manages the Change of Shipper (CoS), process within Gas Networks Ireland. This process is essential in order to facilitate an open market and enable supply competition, by allowing customers to change from one shipper to another. The GPRO is responsible for all supply point ownership transfers within the Gas Point Register.
The GPRO provides information and reports to the CER and industry on historic activity; it processes corrections and amendments and it maintains the I & C listing, the vulnerable customer list and the priority customer list10.
The total number of gas points registered on the 31st of December 2016 was 680,155. This was a 0.9% increase in the number registered on the same date in 2015. The total number of new Gas Points registered during the year 2016 was 9,530. There were 1,872 Gas Points deregistered during the year. The criteria for de-registration of GPRNs that were tariff exempt is that they are locked, no end-user assigned and that no consumption is recorded at the premises for 18 months. If a meter is not in use for more than two months the supplier does not pay capacity charges. Meters de-registered in 2016, had not been in use for over two months and therefore, there was no charge to suppliers.
Shippers have been focused on getting existing gas customers to switch suppliers. Ireland has one of the most active markets for customer switching in Europe. The retail energy providers invest heavily in the advertising and marketing of incentives such as cheaper rates and bundle offers. However, there was a 14% decline in this activity in 2016 when compared to 2015. Many factors can influence switching behaviour; such as consumer sentiment and inertia, points of differentiation between the suppliers, recruitment and retention campaigns.
10 Vulnerable customers
The function of the GPRO is to maintain a register for each Gas Point through which a natural gas customer is supplied; this includes registrations and de-registrations
Gas Networks Ireland 27
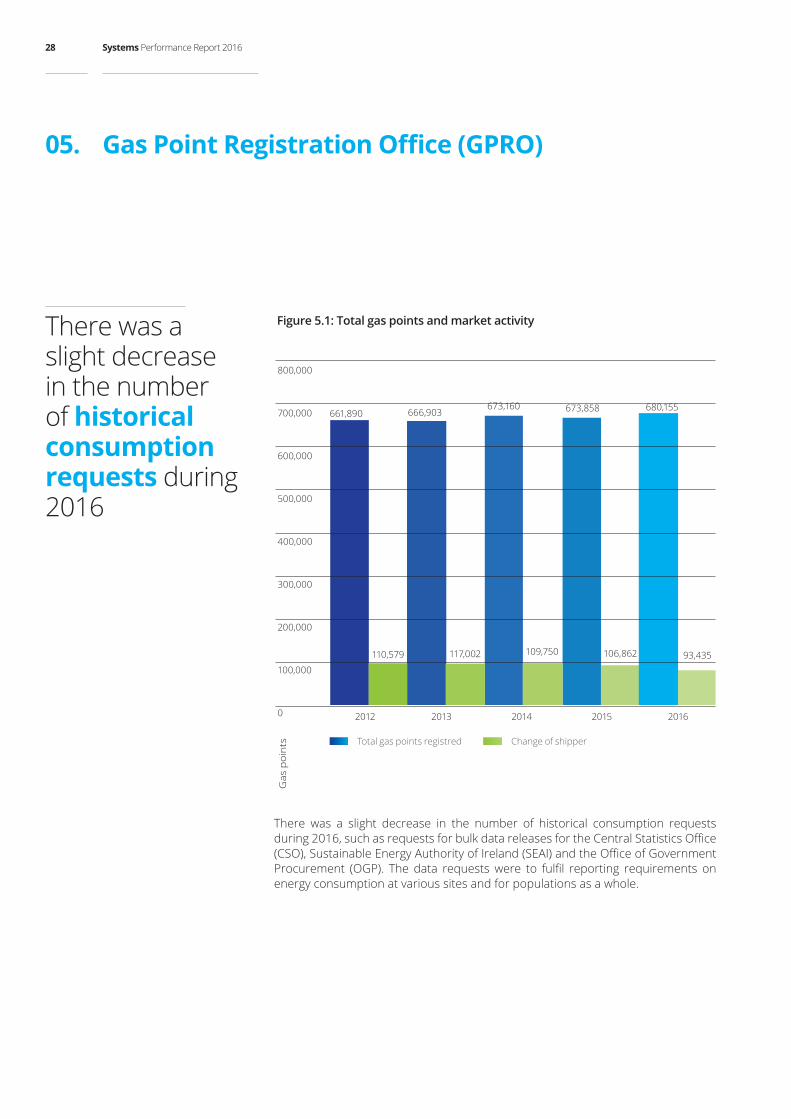
There was a slight decrease in the number of historical consumption requests during 2016, such as requests for bulk data releases for the Central Statistics Office (CSO), Sustainable Energy Authority of Ireland (SEAI) and the Office of Government Procurement (OGP). The data requests were to fulfil reporting requirements on energy consumption at various sites and for populations as a whole.
GasPointRegistrationOffice(GPRO)05.
Figure 5.1: Total gas points and market activity
2012 2013 2014 2015 2016
661,890 666,903 673,160 673,858 680,155
110,579 117,002 109,750 106,862 93,435
Gas
po
ints
Total gas points registred Change of shipper
0
100,000
200,000
300,000
400,000
500,000
600,000
700,000
800,000
There was a slight decrease in the number of historical consumption requests during 2016
Systems Performance Report 201628
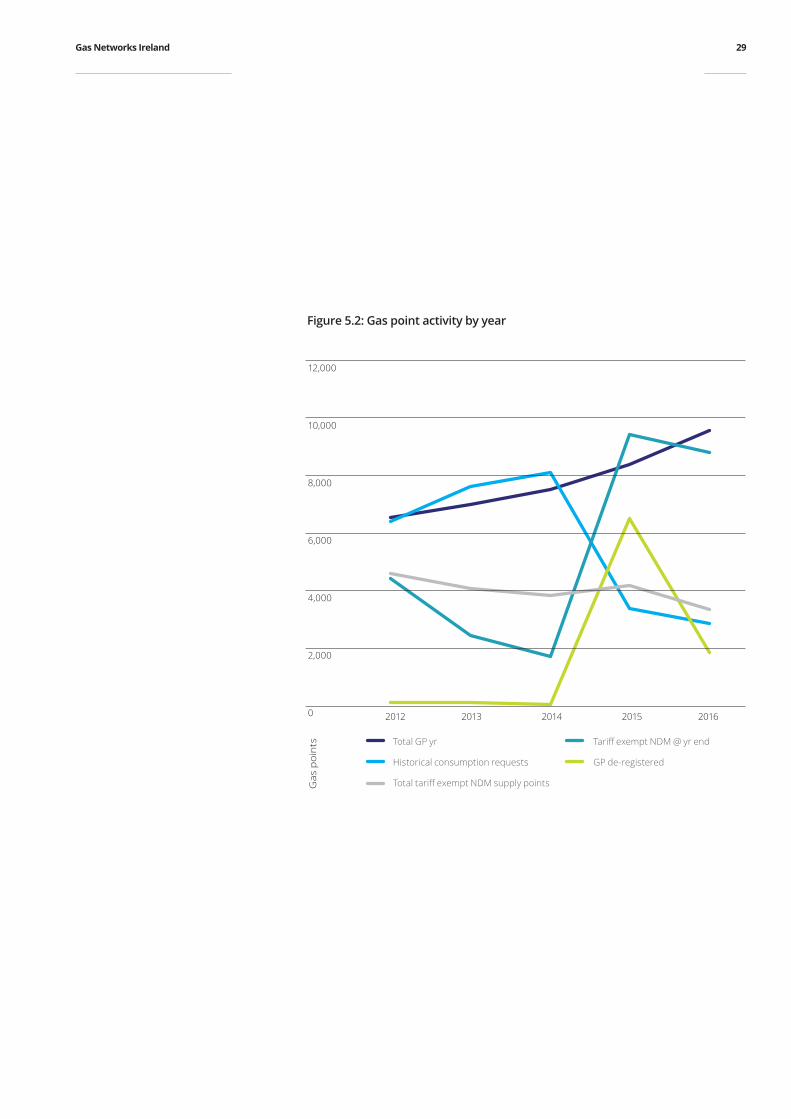
Figure 5.2: Gas point activity by year
2012 2013 2014 2015 2016
Gas
po
ints
Total GP yr Tariff exempt NDM @ yr end
Historical consumption requests GP de-registered
Total tariff exempt NDM supply points
0
2,000
4,000
6,000
8,000
10,000
12,000
Gas Networks Ireland 29

As part of the Price Control (allowed revenues) process, the CER and Gas Networks Ireland agree a 5 year programme of capital works for the transmission network. Gas Networks Ireland is currently in its third regulatory Price Control Period (PC3), which runs from October 2012 to October 2017. The programme includes works relating to reinforcement, refurbishment and new supply. Additional works outside of the programme can be undertaken in the period if proposed by Gas Networks Ireland and agreed by the CER. Gas Networks Ireland continues to work with stakeholders to extend the natural gas network to new towns. Gas Networks Ireland welcomes new sources of gas supply and remains willing to discuss prospective projects with project promoters.
Achievement of Capital Programme
06.
Systems Performance Report 201630
6.1 ReinforcementReinforcement programmes are carried out to increase the capacity of the network in response to increased demand. Examples of reinforcement projects include upgrades to increase the capacity of an Above Ground Installation (AGI) or major pipeline projects, such as the Cluden to Brighouse Bay Pipeline; where the twinning of the existing pipeline will increase overall network capacity. In 2016, there were two reinforcement projects progressed, these consisted of two AGI capacity upgrades and one pipeline project.
6.2 RefurbishmentRefurbishment programmes involve the upgrading or replacing of certain network assets due to the age or condition of the existing asset. Examples of refurbishment projects include:• replacement of inefficient and aging boilers at AGI locations with reliable and
more efficient units;• upgrading works to bring pressure reduction sites into compliance with the
ATEX11 directive; and• installation of attenuation measures to limit noise emissions in the vicinity of
pressure reduction sites.
There were a total of 157 refurbishment projects at various stages from design through to commissioning and operation carried out during 2016, many of these were across multiple locations.
6.3 InterconnectorsThis programme involves the refurbishment and upgrading of assets on the onshore Scotland network which is connected to the onshore Ireland gas network via two sub-sea interconnectors. These projects primarily involve works on the two compressor station sites at Beattock and Brighouse Bay in Scotland. Examples of these projects include:• upgrade works to the turbine air intake equipment at Brighouse Bay to improve
reliability and replace equipment approaching obsolescence;• replacement of ancillary equipment, supporting turbine operation at Beattock,
which was approaching end-of-life or obsolescence;• installation of a station recycle valve at Beattock Compressor Station and
connecting same to the station control system; and• service exchange of the turbine core of a compressor unit at Beattock Compressor
Station.
6.4 New supplyConstruction and commissioning of the Drumbannon AGI is complete.
11 The ATEX directive consists of two EU directives describing what equipment and work environment is allowed in an environment with an explosive atmosphere
Reinforcement programmes are carried out to increase the capacity of the network in response to increased demand
Gas Networks Ireland 31

7.1 High level safety statisticsThis section of the report is an extract from quarterly reports submitted to the CER under the natural gas safety regulatory framework (the ‘Framework’). All information has been provided to the best ability of Gas Networks Ireland at the time of submission to the CER. The report includes Key Performance Indicator (KPI) measures and statistics that have been under continuous monitoring during 2016. The purpose of the KPIs is to identify opportunities for improvement and to ensure the network continues to be managed in a safe manner.
The reference number (ref: 1 – 5) denotes metrics grouping under the Key Safety Regulatory Objectives.
Transmission Gas Safety
07.
Systems Performance Report 201632
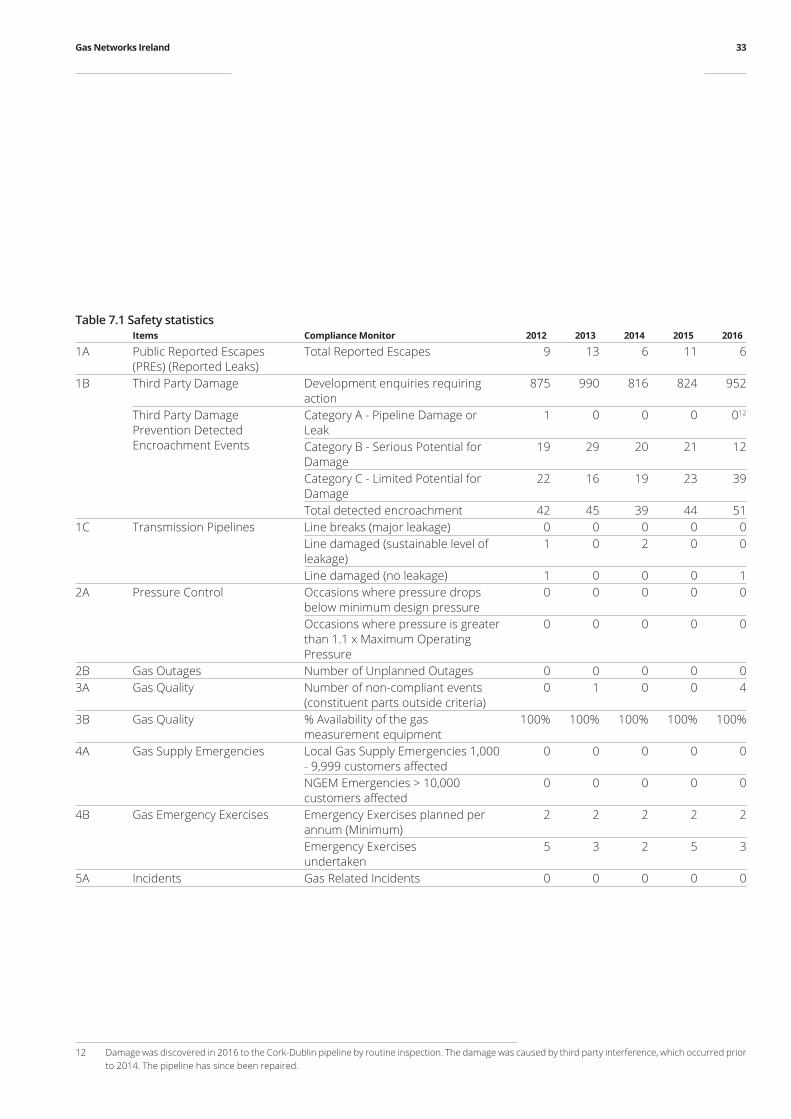
Table 7.1 Safety statisticsItems Compliance Monitor 2012 2013 2014 2015 2016
1A Public Reported Escapes (PREs) (Reported Leaks)
Total Reported Escapes 9 13 6 11 6
1B Third Party Damage Development enquiries requiring action
875 990 816 824 952
Third Party Damage Prevention Detected Encroachment Events
Category A - Pipeline Damage or Leak
1 0 0 0 012
Category B - Serious Potential for Damage
19 29 20 21 12
Category C - Limited Potential for Damage
22 16 19 23 39
Total detected encroachment 42 45 39 44 511C Transmission Pipelines Line breaks (major leakage) 0 0 0 0 0
Line damaged (sustainable level of leakage)
1 0 2 0 0
Line damaged (no leakage) 1 0 0 0 12A Pressure Control Occasions where pressure drops
below minimum design pressure0 0 0 0 0
Occasions where pressure is greater than 1.1 x Maximum Operating Pressure
0 0 0 0 0
2B Gas Outages Number of Unplanned Outages 0 0 0 0 03A Gas Quality Number of non-compliant events
(constituent parts outside criteria)0 1 0 0 4
3B Gas Quality % Availability of the gas measurement equipment
100% 100% 100% 100% 100%
4A Gas Supply Emergencies Local Gas Supply Emergencies 1,000 - 9,999 customers affected
0 0 0 0 0
NGEM Emergencies > 10,000 customers affected
0 0 0 0 0
4B Gas Emergency Exercises Emergency Exercises planned per annum (Minimum)
2 2 2 2 2
Emergency Exercisesundertaken
5 3 2 5 3
5A Incidents Gas Related Incidents 0 0 0 0 0
12 Damage was discovered in 2016 to the Cork-Dublin pipeline by routine inspection. The damage was caused by third party interference, which occurred prior to 2014. The pipeline has since been repaired.
Gas Networks Ireland 33

7.2 Third party damage Third Party Development works enquiries which potentially impacted on the transmission network and required intervention from Gas Networks Ireland, increased slightly from 824 in 2015, to 952 in 2016.
There were 51 encroachments (instances of unauthorised excavation in the pipeline wayleave) detected in 2016, which is an increase on the 44 detected in 2015 and an increase on the 39 detected in 2014. The increase in the 2016 figures were largely due to the reclassification of unsupervised ditch cleaning activities. Since 2011, Gas Networks Ireland has classified transmission pipeline encroachments in line with the United Kingdom Onshore Pipeline-Operators Association (UKOPA) model, these include: • Category A: Pipeline leak or damage;• Category B: Potential for damage; and• Category C: Limited or minimal potential for damage.
Category A is the most severe and includes actual damage to a transmission pipeline, wrap or sleeve. There were no Category A encroachments in 2016, 2015 or 2014, however, one instance of damage was discovered in 2016 to the Cork-Dublin pipeline by routine inspection. The damage was caused by third party interference, which occurred prior to 2014. The pipeline has since been repaired. Categories B and C relate to a level of potential damage and are differentiated by the actual activity and method carried out in the vicinity of the pipeline. Category B encroachments are deemed to have serious potential for damage while Category C have limited potential for damage. Gas Networks Ireland reviews each encroachment and monitors trends closely.
7.3 Update on the Safety CaseGas Networks Ireland fully complies with the Gas Safety Framework. The Gas Networks Ireland Transmission System Safety Case demonstrates the safety management arrangements in place for the network.
Within the Safety Case Framework a quarterly KPI report is submitted to the CER for review (see section 7.1). A number of updates to the Safety Case have been made since 2009 and have been accepted by the CER. The CER accepted the Gas Networks Ireland Transmission System Safety Case on the 1st August, 2015, which remains the current accepted Safety Case as of 31st December 2016. The Safety Case demonstrates the arrangements that are in place for:• the safe control and operation of the transmission system;• the management of the life cycle of the assets including design, construction,
commissioning, maintenance and repair, reinforcement and renewal, and decommissioning and abandonment;
• ensuring that staff meet the required standards of qualification and competence;• emergency preparedness;• ensuring that gas transported in the network meets required standards for gas
composition and quality;
952 Development enquiries
51 Detected encroachments
Transmission Gas Safety07.
Systems Performance Report 201634

• hazard assessment and mitigation of the risks to a level that is as low as is reasonably practicable associated with the transportation of gas;
• compliance with relevant standards and codes of practice; and• cooperation with third parties.
The primary change to the Transmission Safety Case in 2015 was Gas Networks Ireland becoming a legal entity. Under the Framework, Gas Networks Ireland is required to conduct a full independent audit of its Safety Case every five years to ensure that the safety case remains a ‘living document’ within the organisation and fully reflects the current safety operating measures and practices. This review will be due in 2020.
7.4 Update on Natural Gas Emergency Manager ActivitiesThe CER is responsible for the appointment of the National Gas Emergency Manager (NGEM) in accordance with the Gas (Interim) (Regulation) Act 2002, as amended. Gas Networks Ireland is the NGEM as per the appointment by the CER in 2008. The Natural Gas Emergency Plan (NGEP) is the industry procedure for managing a network gas emergency and provides details on the role of the NGEM. The NGEP is prepared by Gas Networks Ireland pursuant to the direction of the CER and is subject to approval by the CER in accordance with its statutory functions. Revision 4 of the NGEP was approved by the CER on 19th February 2016. The NGEP is tested on an annual basis and the 2016 emergency exercise was carried out on 7th December 2016.
Gas Networks Ireland is the National Gas Emergency Manager
Gas Networks Ireland 35
The Code of Operations governs the relationship between the Transporter and the shippers on the transportation (transmission and distribution) network. By signing Framework Agreements, shippers accept the terms of the Code of Operations. In February 2005, the CER approved the implementation of a new Code of Operations (the Code) which governs the rules for both the transmission and the distribution network. These rules became effective on 1st April 2005. The latest version of the Code (Version 5.01) was published in March 201713. The Code is comprised of sections outlining the general principles of the Code, regulatory compliance, the capacity arrangements (both entry and exit), the nomination and allocation arrangements, balancing, shipper registration, gas specification and quality, as well as the various sections on congestion management, legal and general.
13 http://www.gasnetworks.ie/en-IE/Gas-Industry/Services-for-Suppliers/codeofoperations/
Code of Operations Obligations
08.
Systems Performance Report 201636

8.1 Systems availabilityGrid Control is responsible for monitoring the GTMS and managing the daily nomination and allocation process, ensuring that the correct volume of gas is being transported at all times to meet shippers’ and customers’ requirements. The performance standard for the GTMS system availability is 99.8%, this target has been consistently achieved over the years and in 2016 the system was available 99.98% of the time.
8.2NDMChangeofShipper(CoS)processingThe CoS process governs the recording of a change of registration of NDM Supply Points between shippers on the Gas Point Register. A number of performance targets have been set in terms of processing requests for change of shipper and entry and exit capacity booking requests. These are outlined in Table 8.3. The performance target has been consistently achieved over the past five years.
Figure 8.1: System availability
2012 2013 2014 2015 2016
99.98 99.98 99.95
99.96 99.98
GTMS availability KPI %
99.7
99.75
99.8
99.85
99.9
99.95
100
The performance standard for the GTMS system availability is 99.8%
Gas Networks Ireland 37
8.3 Invoice circulationThe trading and settlements team in Gas Networks Ireland generates and issues transportation invoices for all shippers on a monthly basis. The invoices are for transmission and distribution capacity and commodity charges. The team also issue shippers a letter each year regarding the pricing mechanism on the shrinkage contract and is responsible for the disbursement of account invoices and credit notes. The performance targets for invoices is to issue by the 12th day of the month, this has been achieved 100% of the time. The KPI for providing shippers with the shrinkage pricing mechanism is prior to the October billing date. This too has been at 100% as illustrated in Table 8.5.
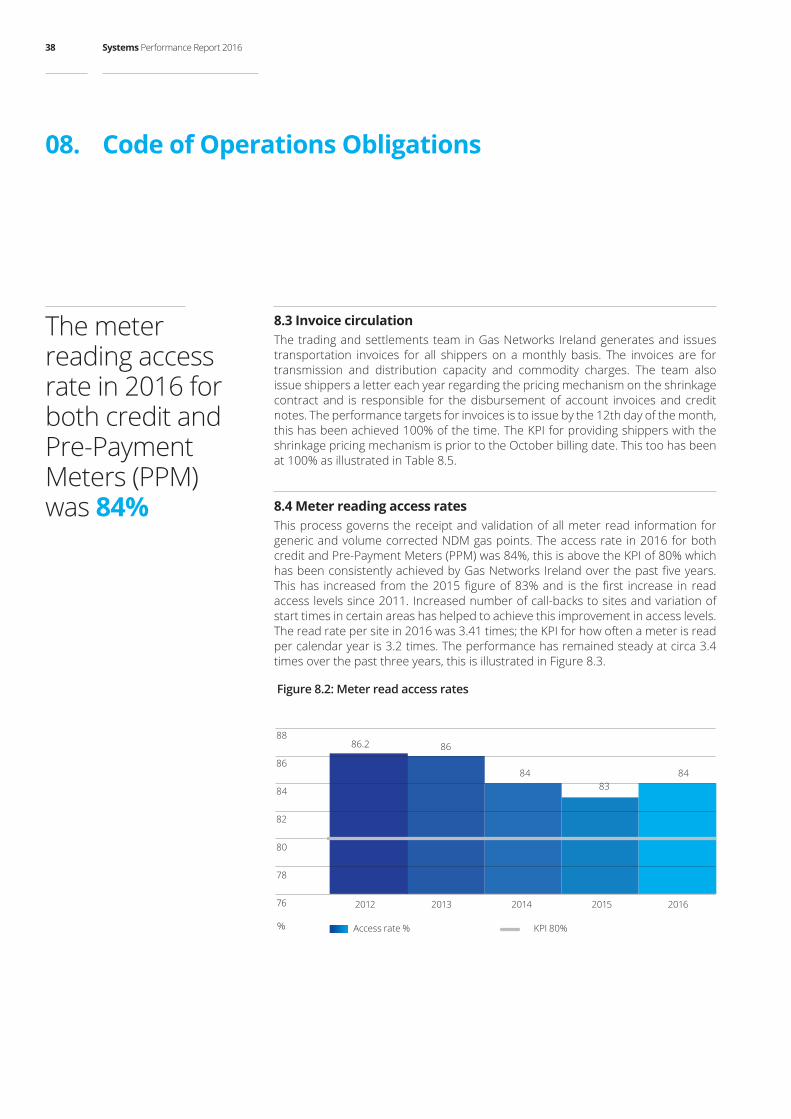
8.4 Meter reading access ratesThis process governs the receipt and validation of all meter read information for generic and volume corrected NDM gas points. The access rate in 2016 for both credit and Pre-Payment Meters (PPM) was 84%, this is above the KPI of 80% which has been consistently achieved by Gas Networks Ireland over the past five years. This has increased from the 2015 figure of 83% and is the first increase in read access levels since 2011. Increased number of call-backs to sites and variation of start times in certain areas has helped to achieve this improvement in access levels. The read rate per site in 2016 was 3.41 times; the KPI for how often a meter is read per calendar year is 3.2 times. The performance has remained steady at circa 3.4 times over the past three years, this is illustrated in Figure 8.3.
Figure 8.2: Meter read access rates
2012 2013 2014 2015 2016
%
86.2 86
84 83
84
76
78
80
82
84
86
88
Access rate % KPI 80%
Code of Operations Obligations08.
The meter reading access rate in 2016 for both credit and Pre-Payment Meters (PPM) was 84%
Systems Performance Report 201638

8.5 Meter data servicesIn conjunction with the Code of Operations, procedures are in place that govern forecasting of demand at gas points and determining allocations by the transporter for the reconciliation process. The KPI for accuracy of forecasting, allocation and reconciliation is 80% accuracy depending on the kWh. The accuracy rate has steadily improved for PPM meters in 2016.
Figure 8.3: Meter read rate
2012 2013 2014 2015 2016
Read
per
yea
r
3.05
3.1
3.15
3.2
3.25
3.3
3.35
3.4
3.45
3.5 3.47
3.42 3.41 3.4 3.41
Read rate KPI (3.2)
Table 8.1: Meter data services Meter data services KPI 2012 2013 2014 2015 2016
Forecasting, Allocation and Reconciliation (FAR)13 – Domestic Reconciliation (PPM14 Meters - 12 month Rolling)
80% within accuracy of 1,250 kWh
N/A N/A 99.37% 94.58% 99.39%
Forecasting, Allocation and Reconciliation (FAR) – Domestic Reconciliation (Credit Meters - 12 month Rolling)
80% within accuracy of 1,250 kWh
92.43% 94% 89.54% 99.56% 91.25%
Forecasting, Allocation and Reconciliation (FAR) – I & C Reconciliation15
80% within accuracy of 4,500 kWh
74.54% 74% 74.98% 76.51% 75.76%
13 http://www.gasnetworks.ie/en-IE/Gas-Industry/Services-for-Suppliers/Capacity-registerFAR/14 PPM figures were not reported from 2011-201315 The I & C band ranges between 73,000 kWh and 5,500,000 kWh so range of reconciliation accuracy can vary significantly given the wide range of annual
volumes consumed at these sites.
Gas Networks Ireland 39
8.6 Provision of shrinkage gas quantity/costs estimates“Shrinkage gas” is used to operate the system (own use gas) and to replace gas which is lost or unaccounted for. The Transporter buys shrinkage gas to ensure the safe and efficient operation of the system and enters into one or more contracts for shrinkage gas.
The transporter recovers the cost of shrinkage gas for the transmission system from shippers (by reference to throughput). For distribution shippers that are not subject to an additional Network Code charge for shrinkage, there is a distribution shrinkage factor included in the tariff. Shrinkage charges are paid by shippers based on throughput (their entry and exit allocations).
Imbalance charges are paid to or by shippers depending on whether they have positive or negative imbalances. Overrun charges are charges payable by shippers where their allocations exceed their relevant active capacity on a day. Similar to transmission, distribution shrinkage charges are paid by shippers based on throughput (their entry and exit allocations).
8.7 Maintenance days interruptionsGas Networks Ireland operates, maintains and repairs the transportation system in accordance with the provisions of the Code16. Maintenance days are days nominated by Gas Networks Ireland where part of the transportation system may be subject to maintenance. During maintenance days, natural gas available for offtake from that part of the transportation system may be reduced. The maintenance programme is planned in advance with the input of shippers. From time to time additional unscheduled maintenance may need to be conducted due to unforeseen circumstances as considered necessary in order to ensure the operational integrity and security of the transportation system. Notice will be given to each affected shipper as soon as is reasonably practicable, recognising that such maintenance is unscheduled.
In 2016, the Corrib entry point was commissioned and during this period a number of constraints (Gas Networks Ireland determined) and curtailments (Shell E & P Ireland Limited (SEPIL) determined) occurred. These were implemented by both SEPIL and Gas Networks Ireland as illustrated in the Table 8.7.
16 Part G, section 5, Code of Operations
Code of Operations Obligations08.
Gas Networks Ireland operates, maintains and repairs the transportation system in accordance with the provisions of the Code of Operations
Systems Performance Report 201640

Gas Networks Ireland constrained the Corrib flow the most in June 2016, this was during the period when the flows and pressure were being brought up to the system’s capacity. The constraint was imposed as increased gas flow was causing specialist commissioning filters to block, which was the main reason for imposing the constraint. The constraint was lifted when a steady state was achieved.
In 2016 gas injection into Kinsale Energy Limited wells reduced dramatically in line with their programme to cease gas production. In previous years the summer injection period had been used to carry out key maintenance and upgrade works at Middleton compressor station. However, in Quarter 3, 2016, the entry point at Inch was constrained to facilitate the installation of a new station control system for approximately 2 weeks.
The 2016 in-line inspection programme was extensive and the Loughcarrig Lodge to Midleton pipeline section required a short period (approx. 8 hours) of flow control through the Inch Entry point. This work was coordinated to coincide with the station control system upgrade work.
The Moffat entry point was available throughout all of 2016.
The Moffatentry point was available throughout all of 2016
Gas Networks Ireland 41

9.1 Distribution system dataIn the DM (I & C) sector gas demand was up by circa 5.8%, compared to 2015. The key factor in terms of increased gas demand within the DM (I & C) sector is economic growth; an increase in new connections is also having an impact. The DM (I & C) sector as a whole witnessed an increase of 1.0% in connections.
In the NDM sector gas demand is sensitive to weather and demand. However despite the fact that 2016 was about 3% warmer than 2015, on a Degree Day (DD) basis, gas demand in 2016 was up by approximately 2.4% on the previous year. In the NDM (I & C) sub-sector, growth was driven by the increase in economic activity. In the Residential NDM sub-sector, there was growth of 1.1% in gas demand, due to an increase in new connections. Table 9.1 illustrates the distribution system data.
Distribution System
09.
Systems Performance Report 201642
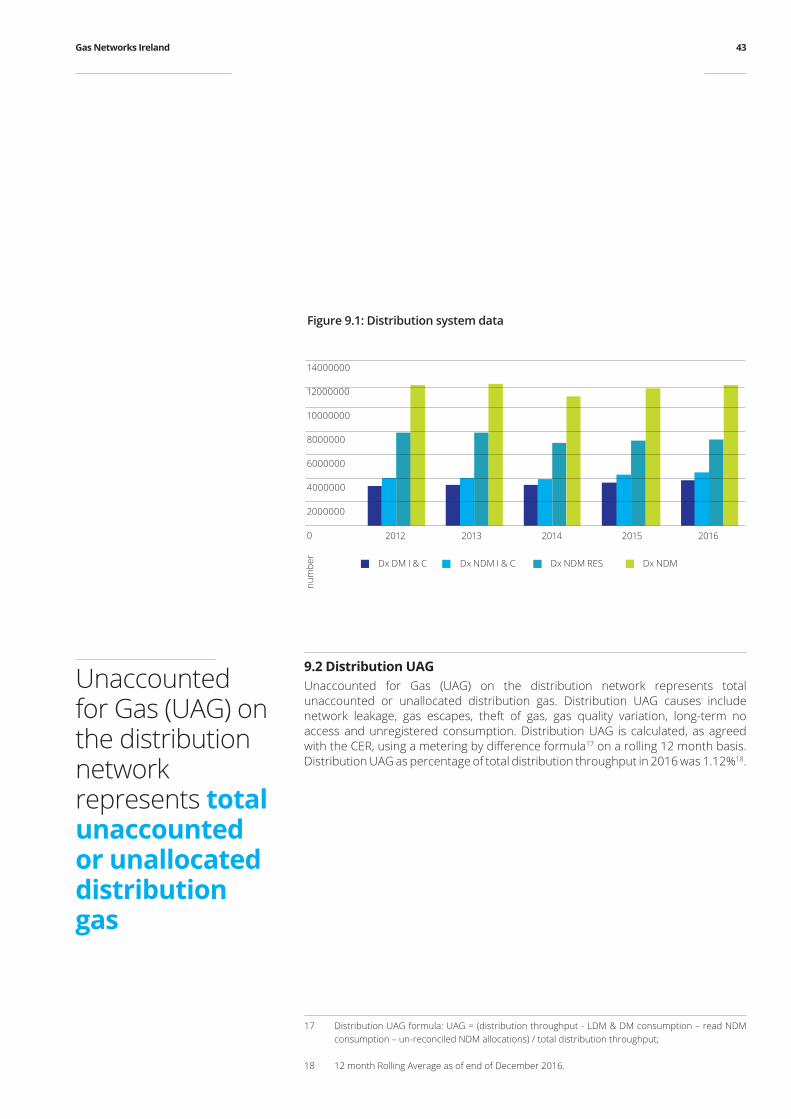
9.2 Distribution UAGUnaccounted for Gas (UAG) on the distribution network represents total unaccounted or unallocated distribution gas. Distribution UAG causes include network leakage, gas escapes, theft of gas, gas quality variation, long-term no access and unregistered consumption. Distribution UAG is calculated, as agreed with the CER, using a metering by difference formula17 on a rolling 12 month basis. Distribution UAG as percentage of total distribution throughput in 2016 was 1.12%18.
17 Distribution UAG formula: UAG = (distribution throughput - LDM & DM consumption – read NDM consumption – un-reconciled NDM allocations) / total distribution throughput;
18 12 month Rolling Average as of end of December 2016.
Figure 9.1: Distribution system data
2012 2013 2014 2015 2016
num
ber
Dx DM I & C Dx NDM I & C Dx NDM RES Dx NDM
0
2000000
4000000
6000000
8000000
10000000
12000000
14000000
Unaccounted for Gas (UAG) on the distribution network represents total unaccounted or unallocated distribution gas
Gas Networks Ireland 43

9.3Totalnumberofconnections(bycategory)The total number of distribution connections in 2016, stands at 675,228. This is up by 1.1% on 2015. The largest increase was in the DM (I & C) sector experiencing a rise of 2.8% from 2015, see Table 9.2.
9.4 Total length of pipe in the distribution systemThe distribution network operates in two tiers; a medium pressure and a low pressure. The distribution network is predominantly polyethylene distribution pipelines. As residents and business premises are added to the network, the length of pipe in the distribution network grows. The length of the distribution network at the end of 2016 is measured at 11,527 km. This has been growing incrementally in the last five years.
Figure 9.2: Connections by category
2012 2013 2014 2015 2016
MW
h
0
100000
200000
300000
400000
500000
600000
700000
800000
Dx DM I & C Dx NDM I & C Dx NDM RES Dx Total
Distribution System09.
The length of the distribution network at the end of 2016 is measured at 11,527 km
Systems Performance Report 201644

9.5 Achievement of distribution capital programmeAs part of the Price Control process, the CER and Gas Networks Ireland agree a 5 year programme of capital works for the distribution network. Gas Networks Ireland is currently in its third regulatory Price Control Period (PC3), from October 2012 to October 2017. The programme includes works relating to reinforcement, refurbishment and new supply. This includes new connections and servicing increased demand at existing connections. Additional works outside of the programme can be undertaken in the period if proposed by Gas Networks Ireland and agreed by the CER, e.g. the connection of a new town. Examples of projects undertaken as part of the distribution capital programme are:• replacement of meters at domestic locations and I & C locations, which are 20
years old or older;• remediation works required at bridge crossings over watercourses on the
distribution network;• removal of metallic mains from the distribution network and replacement with
polyethylene mains; and• upgrading works to bring distribution installations sites into compliance with the
ATEX Directive.
Illustrated overleaf are some 2016 high volume programmes; the percentage of completion represents the percentage scope completed for the project versus the target for PC3.
Figure 9.3: Distribution system length (km)
2012 2013 2014 2015 2016
11131
11218
11288
11339
11527
Length (km) trend length
10900
11000
11100
11200
11300
11400
11500
11600
km
As part of the Price Control process, the CER and Gas Networks Ireland agree a 5 year programme of capital works for the distribution network
Gas Networks Ireland 45

Figure 9.4: Distribution capital programmes
Distribution capital programmes
Status as of end of 2016
G4 Domestic Meter Replacement
Replacement ongoing86% CompleteProgramme to run to end of PC3 in 2017
I & C Meter Replacement PC2
Replacement ongoing99% completeFinish date Q3 2017
PE in Porches
Design and construction ongoing93% completeTo run until the end of PC3
I & C Meter Replacement
Replacement ongoing96% complete
Finish date Q3 2017
Dx bridge crossings
Design and construction ongoing88% complete
Dublin metallic mains
Complete - all known metallic mains and services removed
Dx ATEX Compliance
Design and construction ongoing55% completeTo run until the end of PC3 in 2017
9. 6 ReinforcementThe reinforcement works completed in 2016 are listed below:• Barrow Street; • Kincora Avenue; • Ormond Road; • Willie Nolan Road; • Phoenix Park Phase 2; • Wolfe Tone Street, Kilkenny; • Shangan Gardens, Ballymun; • Dublin Road, Maynooth; • Green Road, Blackrock; • Newbridge;• Dublin Road, Bray;• Bellevue Park; • Woodhazel Terrace, Ballymun; and• Thormanby Road, Howth.
Distribution System09.
Systems Performance Report 201646
Design work has commenced on the following projects which are scheduled for construction in 2017:• Catherine Street, Waterford (construction commenced);• Gracedieu Road / Summerhill, Waterford (construction commenced);• Brackenstown, Swords (construction commenced);• Cleaboy/Hazelbourne, DRI Waterford (construction commenced);• Jamestown Business Park, Kylemore;• Leopardstown Grove, Stillorgan;• Carlow IT;• Ludford Drive, Ballinteer;• Prosperous, Clane;• Lennox Street, Portobello;• Annamoe Park, Cabra;• Ballincollig, Cork;• Kingscourt, Cavan;• Carpenterstown Road;• Kimmage Road Lower;• Priory Avenue, Stillorgan;• James St, Dublin 8; and • Grange Castle Business Park.
9.7Newconnectionsduringyear(bycategory)Gas Networks Ireland has seen an upward trajectory in connection numbers since 2012 as shown in Figure 9.5. The focus for Gas Networks Ireland in 2015 and 2016 has been to regain market share and focus sales and marketing activities on the sectors showing strongest recovery. As a result, new housing and large I & C sectors have increased in connection numbers and gas volumes, while mature housing and Small and Medium Enterprises (SMEs) have largely remained flat.
Over the last few years gas has seen increased competition from solar, electric heat pumps, biomass and Liquefied Petroleum Gas (LPG). Gas Networks Ireland has sought to preserve the utilisation of its network in the face of competition from these technologies. Sales and marketing activity has increased significantly relative to growth in each sector. The sales team interact with industry, architects and consultants to illustrate the benefits of gas and its applications and to promote natural gas as part of the solution in meeting Part L of the building regulations.
As a result Gas Networks Ireland has been positioning gas to take advantage of increased activity in new housing and improved economic growth which was confirmed recently with the publication of recent CSO figures19. This shows planning permissions granted for dwelling units in 2016 was up 26% compared with 2015. Increased activity in the I & C sector is evidenced by the level of Gross Domestic Product (GDP) growth and the significant increase in manufacturing exports.
19 CSO Planning Permission
Gas Networks Ireland has seen an upward trajectory in connection numbers since 2012
Gas Networks Ireland 47

Figure 9.5: New connections by category20
9.8 Update on new towns receiving gasGas Networks Ireland continually brings the benefits of natural gas to new customers and new towns. The Connections Policy is a Gas Networks Ireland document and is approved by the CER. The Connections Policy facilitates high level objectives that encourage the connection of new customers, offers transparency around charges, treats connections consistently and minimises the impact on tariffs. The more customers that are connected to the gas network, the more throughput on the system, which in turn reduces the tariffs for the benefit of all gas customers.
Gas Networks Ireland actively promotes natural gas as a fuel of choice for homes, businesses and industry, encourages greater utilisation of the natural gas network and looks for opportunities to expand the network where economically viable. Construction on connecting Nenagh town to the natural gas network commenced in October 2015. Water and waste water infrastructure are being delivered as part of the Ervia multi-utility project in Nenagh town centre; a collaboration between Irish Water and Gas Networks Ireland. Developing water and gas infrastructures as one project reduces costs and minimises disruption, avoiding the need for a second major construction project in the town at a later date. On completion, which is expected to be late 2017, Nenagh will have a future-proofed infrastructure that will benefit the town, its people and its businesses for many decades to come.
20 There is often a time lag from when a new connection order is received to when it is installed. To ensure that the numbers reported are for connections only rather than a mix of orders and connections there was an adjustment to new connections reporting in 2015. This is to ensure consistency across the business units that record connections. Note: there is a variation in reported figures in pre-2015 performance reports.
2012 2013 2014 2015 2016 0
1000
2000
3000
4000
5000
6000
Mature housing New Housing I & C
Distribution System09.
Gas Networks Ireland continually brings the benefitsofnatural gas to new customers and new towns
Systems Performance Report 201648
The first phase to extend the network from Great Island, Co. Wexford commenced in July 2015. The 40km feeder main bringing natural gas to Wexford town became operational early in 2016, with the major anchor loads commencing gas off-take by mid-year. The initial town network development, which is also a multi-utility project, commenced on the 19th October 2016. This stage also involves the site investigations required for the planning of subsequent expansion, which is expected to commence in late 2017, or early 2018.
Towns connected to the gas network have a significant competitive advantage compared to those that are not. The benefits include economic opportunities, efficiencies and lower emissions that are associated with gas. It was announced in October 2016 that Listowel in Co. Kerry will be the latest town to be connected to the natural gas network. Construction work on the feeder main to Listowel will commence in summer 2017.
As a low carbon fuel with low energy costs, natural gas is appealing to multi-national organisations. Cities and towns that have natural gas infrastructure are attractive for Foreign Direct Investment (FDI), and can benefit through direct employment and investment in the local economy. The natural gas network developed by Gas Networks Ireland has sufficient capacity to meet the gas demands of a modern Ireland competing in the global economy, contributing to Ireland’s social and economic progress.
The clear benefits of natural gas for the customer are that it is cheaper, cleaner and more reliable than other fossil fuels. It is a versatile energy source that can play a significant role in decarbonising the nation’s energy consumption. Natural gas already contributes to competitiveness being at a lower cost than oil for domestic consumers. It produces approximately 22% less CO2 than oil and 40% less than coal21. Natural gas provides energy security for Ireland through existing infrastructure; indigenous sources at Corrib will meet over 50% of RoI total gas requirement for a period of time. The network is connected to the UK market which has diverse gas sources, thus ensuring a robust supply of gas and liquid pricing.
21 The Irish Academy of Engineering Policy Advisory The Future of Oil and Gas, published February 2013
The clear benefits of natural gas for the customer are that it is cheaper, cleaner and more reliable than other fossil fuels
Gas Networks Ireland 49

10.1 Overview of gas safetySafety performance is a core value and top priority for Gas Networks Ireland. It underpins the company brand and its reputation of being a trusted and responsible gas infrastructure company. The network is constructed, operated and maintained to the highest international safety standards, in line with the CER policies. The primary function of the network is to transport gas from entry to exit, on behalf of all customers, while ensuring the network is operated safely and efficiently. This is achieved by the use of sophisticated information systems and Grid Controllers monitoring the system 24/7. The structure ensures that pressure is maintained within the system, alarms are responded to and escalated in a timely manner, the quality of the gas meets regulated requirements and that processes and procedures are in place to manage a natural gas emergency, should it occur.
Distribution Gas Safety
10.
Systems Performance Report 201650
Compliance with national safety legislation including implementation of “a Safety Regulatory Framework for Natural Gas” is core to the operation of the business. The Gas Networks Ireland Distribution Safety Case was accepted by the CER on the 1st August 2015 and remains the current accepted Safety Case as of 31st December 2016. It demonstrates the Gas Networks Ireland arrangements for managing the distribution network. This is delivered through adherence to well established Irish and International codes and standards, reflected through internal processes and procedures, which are detailed below:• Gas Networks Ireland’s management systems are accredited as follows:• OHSAS 18001 for safety management;• ISO 14001 for environmental management;• ISO 9001 for quality management;• ISO 55001 for asset management; and• ISO 50001 for energy management.
The safety and asset management systems received their accreditation in 2015. • Gas Networks Ireland has an excellent record in meeting all its safety statutory
and regulatory obligations. Its average response time to 17,428 gas public reported escapes (PREs) in 2016 was 28 minutes, well within its target of 1 hour.
• Gas Networks Ireland is committed to ensuring that all gas technical and operational personnel have the necessary levels of experience, knowledge and skills appropriate to their range of duties.
10.2 High level safety objectivesThe key safety regulatory objectives are outlined below:
1. Minimising the Risk of Loss of ContainmentGas undertakings are required to demonstrate that they have suitable management systems and procedures in place for managing the risks that lead to, and arise from, loss of gas containment events.
2. Maintaining Safe System Operating Pressure Gas undertakings are required to demonstrate that they have suitable management systems in place; for managing the risks that can result in dangerously high, or low gas operating pressure in the pipeline system(s).
3. Minimising the Risk of Injecting Gas of Non-Conforming Quality Gas emergency incidents can arise due to gas of inappropriate quality being injected into the system. Gas undertakings are required to demonstrate that they have suitable management systems in place; for gas quality monitoring and managing the risks associated with the quality of gas that is injected into the system.
“A Safety Regulatory Framework for Natural Gas” is core to the operation of the business
Gas Networks Ireland 51
4. Providing an Efficient and Coordinated Response to Gas Emergencies Gas emergency events can and do occur for a variety of reasons including the actions of third parties. For example, Gas Networks Ireland is required to demonstrate that it has suitable arrangements in place for: (i) managing the response to ‘localised’ gas emergencies; and (ii) undertaking the role of National Gas Emergency Manager (NGEM) during ‘network’ gas emergencies. Additionally, all natural gas undertakings are required to demonstrate that they have suitable arrangements in place for responding to the requirements of the NGEM, in the event of large-scale ‘network’ gas emergencies being declared by the NGEM.
5. Minimising the Safety Risks Associated with the Utilisation of Gas The Framework provides for a comprehensive regime relating to the regulation of gas installers. The key aim of this regime is that all categories of ‘gas works’ designated by the CER are only undertaken by competent gas installers, who are registered, and subject to ongoing regulation and inspection, by the Gas Safety Supervisory Body appointed by the CER.
6. Promoting Public Awareness of Gas Safety The Framework places duties and obligations on both individual gas undertakings and the industry generally for the promotion of gas safety awareness. This involves a combination of both individual and co-ordinated safety promotional activities by undertakings.
Gas Networks Ireland submits quarterly reports to the CER under the gas safety regulatory framework. The report includes measures and statistics that have been under continuous monitoring and improvement during the reported period of 2016.
Distribution Gas Safety10.
The Framework provides for a comprehensive regime relating to the regulation of gas installers
Systems Performance Report 201652

10.3 High level distribution safety statistics
Table 10.1: High level gas safety statisticsRef Subject High Level KPI 2012 2013 2014 2015 2016
1A Public Reported Escapes22 Number of External Leaks Detected 2605 2797 3538 3811 3691Number of Internal Leaks Detected 4660 4806 4480 5007 4214
1C Third Party Damage No. of Main Damages 48 59 68 84 93No. of Service Damages 404 408 457 395 426
1D Gas in Buildings Number of ‘Gas in Buildings’ events (i.e. all gas ingress from external infrastructure)
2 1 3 0 1
Evacuations No. of Gas Networks Ireland initiated evacuations
0 1 5 2 1
2B Gas Outages > 15 Customer affected 1 1 0 1 1> 100 Customer affected 1 1 0 2 2
4A Gas Supply Emergencies Local Gas Supply Emergencies 1,000 – 9,999 customers affected
0 0 0 0 0
NGEM Emergencies - >10,000 customers affected
0 0 0 0 0
4B Public Reported Escapes % attended within one hour 99.90 99.90 99.88 99.90 99.895A Incidents
(Occurring on Gas Network) Reportable under Gas Legislation 1 1 0 0 0
Incidents(Occurring on Gas Network)
Reportable under CER Guidelines 1 2 3 6 4
5B Incidents(Occurring on Customer installations)
Reportable under Gas Legislation 0 2 20
0
Incidents(Occurring on Customer installations)
Reportable under CER Guidelines 1 3 6 7 3
5C Non Gas related incidents Number of Non Gas related incidents attended by Gas Networks Ireland
1 0 2 3 3
6A Emergency Reports Total no. of calls received via the 24-hour emergency telephone number (1850 20 50 50)
29504 30672 30519 19198 23919
6B Third Party Damage Total enquiries to 1850 427 747 (inward communication)
3442 3437 2706 2106 1772
Total enquiries to distribution DBYD23 email/post/fax/calls (inward communication)
4533 4631 4700 5029 5723
Total inward enquiries 7975 8068 7406 7135 74956C Carbon Monoxide Helpline No. of Carbon Monoxide (CO) related
calls received via the CO Helpline (1850 79 79 79)
1845 1792 1718 1294 1158
22 In 2016 Gas Networks Ireland responded to 17,428 PREs. In many cases there is no trace of gas. The figures illustrated in Table 10.1 are the actual number of leaks detected.
23 Dial before your dig
Gas Networks Ireland 53

10.4 Public reported escapesThere were 17,428 Public Reported Escapes (PREs) related to leaks on the Gas Networks Ireland distribution network in 2016. This is a decrease from the 19,449 PREs reported in 2015. In approximately 54% of these cases, no trace of gas was found. In the vast majority of cases where gas was detected, the leaks were minor in nature and were repaired by Gas Networks Ireland technicians using standard reactive maintenance and repair methods.
10.5 Distribution safety performanceThere was a consistently high safety distribution performance over the year 2016, a brief summary is outlined below:• 1 gas in building events; • 3 unplanned outages in 2016; and• 0 gas supply emergencies.
10.6 Promoting public awareness of gas safety The total number of calls received via the 24-hour emergency telephone number (1850 20 50 50) in 2016 was 23,919 which was an increase on the 2015 figure of 19,198. The number of incoming enquiries received for “Dial-Before-You-Dig” enquiry phone line has decreased from 2,106 in 2015, to 1,772 in 2016, as enquiries increasingly arrive by email.
Gas Networks Ireland launched a new carbon monoxide campaign in the latter quarter of 2014, this continued into 2015 and 2016. Other initiatives include Carbon Monoxide Awareness Week in September of each year.
10.7 Addressing gas meter tamperingEstablished in 2013/14, Gas Networks Ireland’s Revenue Protection Unit is tasked with the detection and prevention of gas theft and unauthorised interference with gas metering equipment and pipework. The Revenue Protection Unit also raises awareness of the dangers of gas meter tampering and the associated risk to life through targeted media campaigns, including radio, print media, bill inserts, and door drops.
The Revenue Protection Unit investigated 714 suspected cases of meter tampering in 2016, of which 393 were confirmed as tampered. In each of these cases, the meters were exchanged and made safe.
Distribution Gas Safety10.
There were 17,428 Public Reported Escapes (PREs) related to leaks on the Gas Networks Ireland distribution network in 2016
Systems Performance Report 201654

During 2016, the CER approved a new process whereby Gas Networks Ireland can disconnect customers where a tampered meter has been confirmed and the customer fails to take the required steps to resolve the issue (i.e. reimburse Gas Networks Ireland for the cost of a damaged meter and provide a Registered Gas Installer (RGI) cert). This process commenced in August 2016 and is being monitored for 12 months to determine its effectiveness. Gas Networks Ireland also has powers under the Energy (Miscellaneous Provisions) Act 1995, to prosecute individuals in the District Courts for unlawful interference with a gas meter. 14 prosecutions were initiated during 2016 with various penalties imposed. Successful prosecutions are publicised to highlight the dangers of gas meter tampering and the potential consequences for the individual i.e. a criminal conviction. Criminal convictions of this sort are intended to act as a deterrent to others who may be considering tampering with their gas meter.
Gas Networks Ireland 55
Gas Networks Ireland continued to deliver on key asset programmes and essential services to shippers and customers in 2016. There was growth experienced in distribution connections and in overall gas demand across the various sectors. While Corrib gas was commissioned the end of 2015, it did not become fully operational until July 2016.
Conclusion
11.
Systems Performance Report 201656

The introduction of a new entry point at Corrib, enhanced VRF and the introduction of EU network code updates has increased the complexity of the operation of the natural gas system, resulting in higher variability in entry-exit nominations in 2016. Forecasts such as the Network Development Plan are used by Gas Networks Ireland to prepare and respond to variations, which may be environmental, policy, market or system related.
The safety, integrity and performance of the network remained the focus of Gas Networks Ireland in 2016. Gas Networks Ireland has achieved its targets across all measures. Gas Networks Ireland remains committed to delivering to the highest standards, ensuring that gas is used to power homes, businesses and essential services throughout Ireland, 365 days a year, regardless of the weather and demand challenges that are placed on the system.
The safety, integrity and performance of the network remained the focus of Gas Networks Ireland in 2016
Gas Networks Ireland 57

Appendices
12.
Systems Performance Report 201658
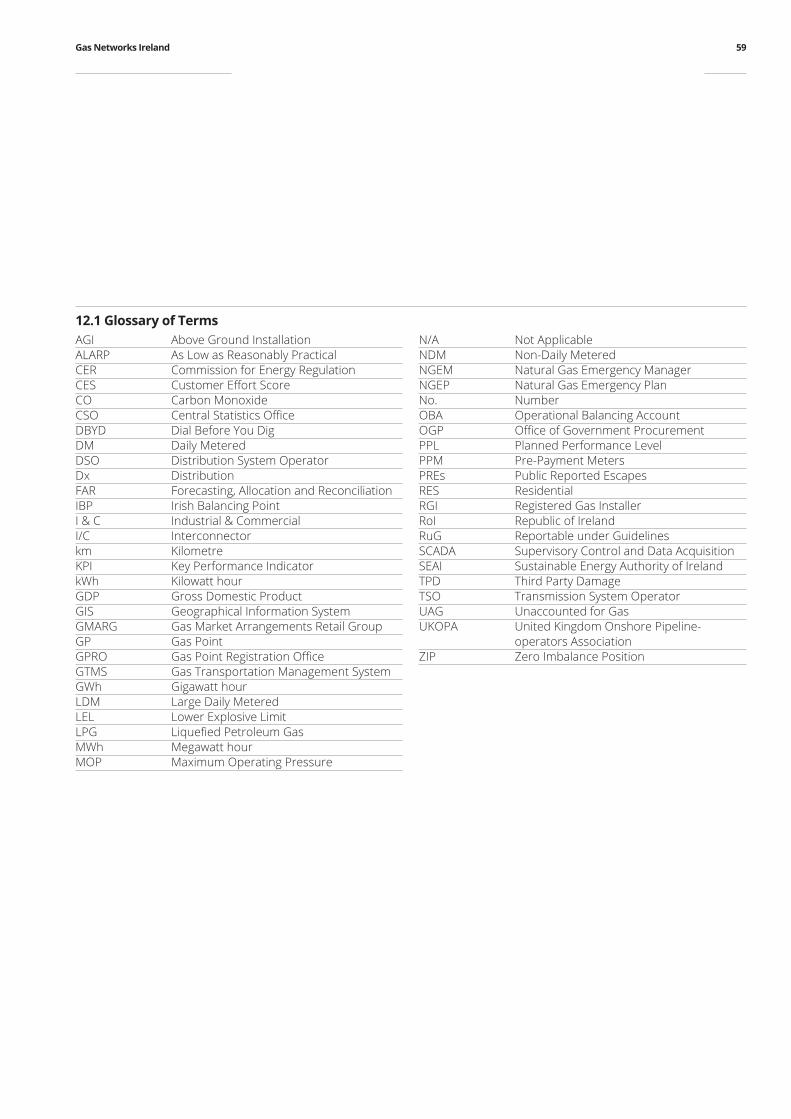
12.1 Glossary of TermsAGI Above Ground InstallationALARP As Low as Reasonably Practical CER Commission for Energy RegulationCES Customer Effort Score CO Carbon MonoxideCSO Central Statistics Office DBYD Dial Before You DigDM Daily MeteredDSO Distribution System OperatorDx DistributionFAR Forecasting, Allocation and ReconciliationIBP Irish Balancing Point I & C Industrial & CommercialI/C Interconnector km KilometreKPI Key Performance IndicatorkWh Kilowatt hourGDP Gross Domestic Product GIS Geographical Information System GMARG Gas Market Arrangements Retail GroupGP Gas PointGPRO Gas Point Registration OfficeGTMS Gas Transportation Management SystemGWh Gigawatt hourLDM Large Daily Metered LEL Lower Explosive LimitLPG Liquefied Petroleum Gas MWh Megawatt hourMOP Maximum Operating Pressure
N/A Not ApplicableNDM Non-Daily MeteredNGEM Natural Gas Emergency ManagerNGEP Natural Gas Emergency PlanNo. NumberOBA Operational Balancing Account OGP Office of Government Procurement PPL Planned Performance LevelPPM Pre-Payment Meters PREs Public Reported Escapes RES ResidentialRGI Registered Gas InstallerRoI Republic of IrelandRuG Reportable under Guidelines SCADA Supervisory Control and Data AcquisitionSEAI Sustainable Energy Authority of IrelandTPD Third Party DamageTSO Transmission System OperatorUAG Unaccounted for GasUKOPA United Kingdom Onshore Pipeline-
operators Association ZIP Zero Imbalance Position
Gas Networks Ireland 59

12.2 Tables used for Chart Graphics
Table 3.1: Transmission pipeline length (km)2012 2013 2014 2015 2016
Length of Onshore Pipeline 2005 2055 2000 2021 2015Decommissioned 25 25 30 32 32Length of Offshore Pipeline 412 412 412 412 412Decommissioned 0 0 0 0 0Total Length of Pipeline 2417 2467 2412 2433 2,427 Total Decommissioned 25 25 30 32 32
Table 3.2: Transmission connectionsCategory 31/12/12 31/12/13 31/12/14 31/12/15 31/16
Transmission LDM 31 32 34 35 34Transmission DM 19 17 17 18 17
Table 4.3: System throughput2012 2013 2014 2015 2016
Total Gas Transported (GWh) 53,541 51,922 50,163 50,192 55,109Daily Average Transported (GWh) 146 144 137 138 151Peak Day Transported (GWh) 217 221 189 204 225
Table 4.4: System throughput per entry point (Calendar Year 2016)2016 %
Inch (GWh) 3434.5 6Moffat (GWh) 21942.6 40Corrib (GWh) 29476.4 54
Appendices12.
Systems Performance Report 201660

Table 4.5: Demand change2012 2013 2014 2015 2016
Demand (GWh) 53,453 51,763 50,151 50,025 55,180Change (GWh) -1,286 -1,690 -1,612 -126 5,155Change (%) -2.38 -3.3 -3.2 -0.3 9.3
Table 4.6: Fuel usage2012 2013 2014 2015 2016
Fuel usage 852GWh 829 GWh 818 GWh 648 GWh 576 GWh
Table 4.7: Meter read verification
KPI2012
Actual2013
Actual2014
Actual2015
Actual2016
Actual
Metering Data Validation <2% of sites 1.57% 1.25% 1.32% 1.31% 1.91%
Table 4.8: Transmission Unaccounted for gas (UAG)UAG 2012 2013 2014 2015 2016
Throughput % +0.020 +0.123 +0.009 +0.229 +0.16Energy (GWh) +12.4 +82.3 +6.1 +153.2 +121
Table 4.9: Shrinkage2012 2013 2014 2015 2016
Shrinkage as a % of throughput 1.58 1.2 1.3 1.2 0.8
Table 4.10: Compressor stations carbon emissions
Compression Site2012
(tonnes)2013
(tonnes)2014
(tonnes)2015
(tonnes)2016
(tonnes)
Midleton 9,707 8,116 6,536 9,204 11,534Beattock 44,012 43,186 40,257 38,269 31,321Brighouse 58,896 57,302 60,783 57,740 27,114
Gas Networks Ireland 61
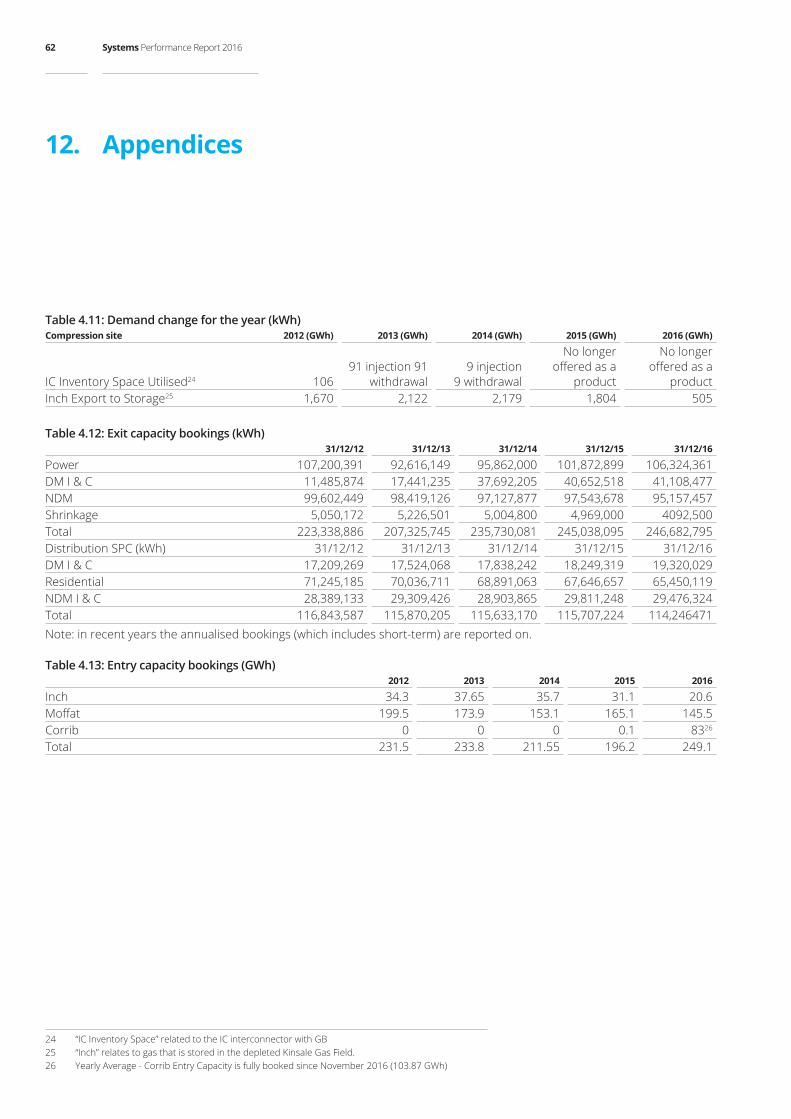
Table 4.11: Demand change for the year (kWh)Compression site 2012(GWh) 2013(GWh) 2014(GWh) 2015(GWh) 2016(GWh)
IC Inventory Space Utilised24 10691 injection 91
withdrawal9 injection
9 withdrawal
No longer offered as a
product
No longer offered as a
productInch Export to Storage25 1,670 2,122 2,179 1,804 505
Table 4.12: Exit capacity bookings (kWh)31/12/12 31/12/13 31/12/14 31/12/15 31/12/16
Power 107,200,391 92,616,149 95,862,000 101,872,899 106,324,361DM I & C 11,485,874 17,441,235 37,692,205 40,652,518 41,108,477NDM 99,602,449 98,419,126 97,127,877 97,543,678 95,157,457Shrinkage 5,050,172 5,226,501 5,004,800 4,969,000 4092,500Total 223,338,886 207,325,745 235,730,081 245,038,095 246,682,795Distribution SPC (kWh) 31/12/12 31/12/13 31/12/14 31/12/15 31/12/16DM I & C 17,209,269 17,524,068 17,838,242 18,249,319 19,320,029Residential 71,245,185 70,036,711 68,891,063 67,646,657 65,450,119NDM I & C 28,389,133 29,309,426 28,903,865 29,811,248 29,476,324Total 116,843,587 115,870,205 115,633,170 115,707,224 114,246471Note: in recent years the annualised bookings (which includes short-term) are reported on.
Table 4.13: Entry capacity bookings (GWh)2012 2013 2014 2015 2016
Inch 34.3 37.65 35.7 31.1 20.6Moffat 199.5 173.9 153.1 165.1 145.5Corrib 0 0 0 0.1 8326
Total 231.5 233.8 211.55 196.2 249.1
24 “IC Inventory Space” related to the IC interconnector with GB25 “Inch” relates to gas that is stored in the depleted Kinsale Gas Field.26 Yearly Average - Corrib Entry Capacity is fully booked since November 2016 (103.87 GWh)
Appendices12.
Systems Performance Report 201662
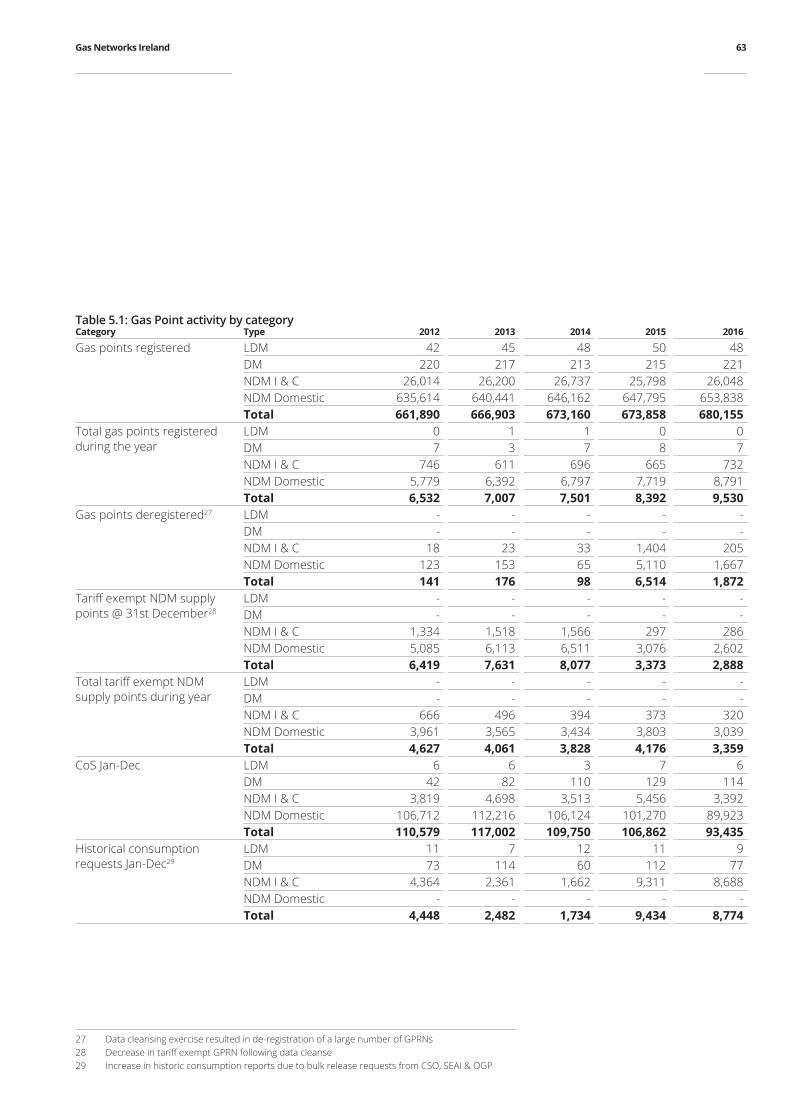
Table 5.1: Gas Point activity by categoryCategory Type 2012 2013 2014 2015 2016
Gas points registered LDM 42 45 48 50 48DM 220 217 213 215 221NDM I & C 26,014 26,200 26,737 25,798 26,048NDM Domestic 635,614 640,441 646,162 647,795 653,838Total 661,890 666,903 673,160 673,858 680,155
Total gas points registered during the year
LDM 0 1 1 0 0DM 7 3 7 8 7NDM I & C 746 611 696 665 732NDM Domestic 5,779 6,392 6,797 7,719 8,791Total 6,532 7,007 7,501 8,392 9,530
Gas points deregistered27 LDM - - - - -DM - - - - -NDM I & C 18 23 33 1,404 205NDM Domestic 123 153 65 5,110 1,667Total 141 176 98 6,514 1,872
Tariff exempt NDM supply points @ 31st December28
LDM - - - - -DM - - - - -NDM I & C 1,334 1,518 1,566 297 286NDM Domestic 5,085 6,113 6,511 3,076 2,602Total 6,419 7,631 8,077 3,373 2,888
Total tariff exempt NDM supply points during year
LDM - - - - -DM - - - - -NDM I & C 666 496 394 373 320NDM Domestic 3,961 3,565 3,434 3,803 3,039Total 4,627 4,061 3,828 4,176 3,359
CoS Jan-Dec LDM 6 6 3 7 6DM 42 82 110 129 114NDM I & C 3,819 4,698 3,513 5,456 3,392NDM Domestic 106,712 112,216 106,124 101,270 89,923Total 110,579 117,002 109,750 106,862 93,435
Historical consumption requests Jan-Dec29
LDM 11 7 12 11 9DM 73 114 60 112 77NDM I & C 4,364 2,361 1,662 9,311 8,688NDM Domestic - - - - -Total 4,448 2,482 1,734 9,434 8,774
27 Data cleansing exercise resulted in de-registration of a large number of GPRNs28 Decrease in tariff exempt GPRN following data cleanse29 Increase in historic consumption reports due to bulk release requests from CSO, SEAI & OGP
Gas Networks Ireland 63

Table 6.1: Achievement of capital programme
Reinforcement Design Construction ongoing Construction CompleteCommissioned and in
operation
AGI Capacity Upgrades 1Cluden to Brighouse Bay Pipeline
Refurbishment Design Construction ongoing Construction CompleteCommissioned and in
operation
Ballough bypassAGI boiler replacement 1 4AGI water bath replacement 0 1 1 1AGI site instrumentation 20 2 6ATEX Compliance 79 9Noise Attenuation 0 3Pipe Support Remediation 11 0 18
Interconnectors Design Construction ongoing Construction CompleteCommissioned and in
operation
Brighouse Bay turbine air intakesBrighouse Bay fuel gas skid upgradeBeattock turbine ancillary equipment upgradeBeattock volume controlBeattock odorant plant upgradeBeattock Unit C Service Exchange
New Supply Design Construction ongoing Construction CompleteCommissioned and in
operation
Drumbannon AGIMaydown AGI
Table 8.2: Systems availabilityCommunications & instrumentation KPI 2012 2013 2014 2015 2016
GTMS System availability 99.8% 99.98% 99.98% 99.95% 99.96% 99.98%
Appendices12.
Systems Performance Report 201664
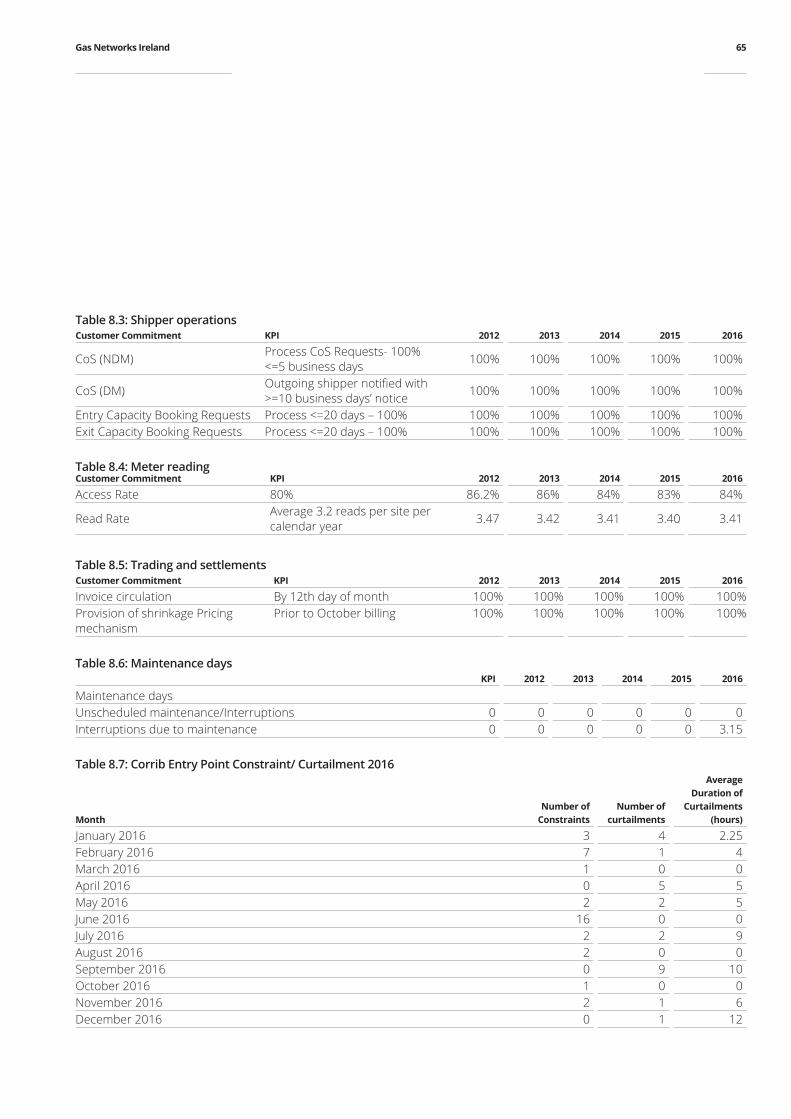
Table 8.3: Shipper operationsCustomer Commitment KPI 2012 2013 2014 2015 2016
CoS (NDM) Process CoS Requests- 100% <=5 business days 100% 100% 100% 100% 100%
CoS (DM) Outgoing shipper notified with >=10 business days’ notice 100% 100% 100% 100% 100%
Entry Capacity Booking Requests Process <=20 days – 100% 100% 100% 100% 100% 100%Exit Capacity Booking Requests Process <=20 days – 100% 100% 100% 100% 100% 100%
Table 8.4: Meter readingCustomer Commitment KPI 2012 2013 2014 2015 2016
Access Rate 80% 86.2% 86% 84% 83% 84%
Read Rate Average 3.2 reads per site per calendar year 3.47 3.42 3.41 3.40 3.41
Table 8.5: Trading and settlementsCustomer Commitment KPI 2012 2013 2014 2015 2016
Invoice circulation By 12th day of month 100% 100% 100% 100% 100%Provision of shrinkage Pricing mechanism
Prior to October billing 100% 100% 100% 100% 100%
Table 8.6: Maintenance daysKPI 2012 2013 2014 2015 2016
Maintenance daysUnscheduled maintenance/Interruptions 0 0 0 0 0 0Interruptions due to maintenance 0 0 0 0 0 3.15
Table 8.7: Corrib Entry Point Constraint/ Curtailment 2016
MonthNumber of
ConstraintsNumber of
curtailments
Average Duration of
Curtailments (hours)
January 2016 3 4 2.25February 2016 7 1 4March 2016 1 0 0April 2016 0 5 5May 2016 2 2 5June 2016 16 0 0July 2016 2 2 9August 2016 2 0 0September 2016 0 9 10October 2016 1 0 0November 2016 2 1 6December 2016 0 1 12
Gas Networks Ireland 65
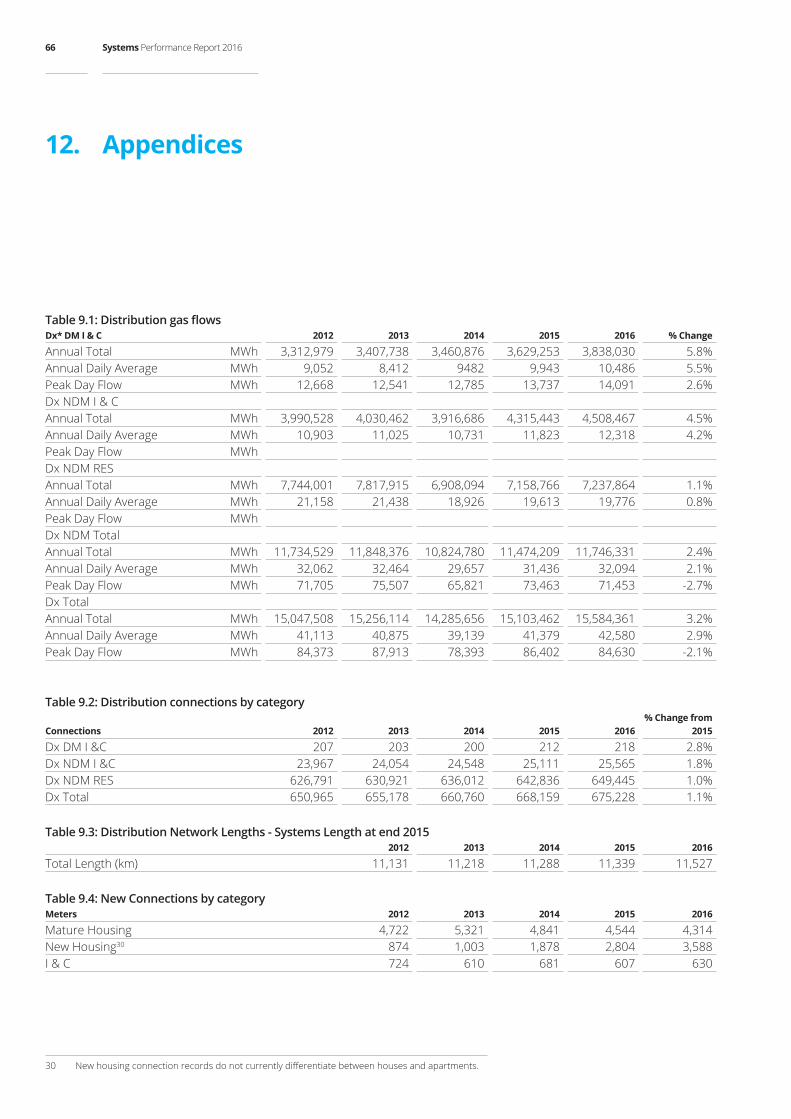
Table 9.1: Distribution gas flowsDx* DM I & C 2012 2013 2014 2015 2016 % Change
Annual Total MWh 3,312,979 3,407,738 3,460,876 3,629,253 3,838,030 5.8%Annual Daily Average MWh 9,052 8,412 9482 9,943 10,486 5.5%Peak Day Flow MWh 12,668 12,541 12,785 13,737 14,091 2.6%Dx NDM I & CAnnual Total MWh 3,990,528 4,030,462 3,916,686 4,315,443 4,508,467 4.5%Annual Daily Average MWh 10,903 11,025 10,731 11,823 12,318 4.2%Peak Day Flow MWh Dx NDM RES Annual Total MWh 7,744,001 7,817,915 6,908,094 7,158,766 7,237,864 1.1%Annual Daily Average MWh 21,158 21,438 18,926 19,613 19,776 0.8%Peak Day Flow MWh Dx NDM TotalAnnual Total MWh 11,734,529 11,848,376 10,824,780 11,474,209 11,746,331 2.4%Annual Daily Average MWh 32,062 32,464 29,657 31,436 32,094 2.1%Peak Day Flow MWh 71,705 75,507 65,821 73,463 71,453 -2.7%Dx TotalAnnual Total MWh 15,047,508 15,256,114 14,285,656 15,103,462 15,584,361 3.2%Annual Daily Average MWh 41,113 40,875 39,139 41,379 42,580 2.9%Peak Day Flow MWh 84,373 87,913 78,393 86,402 84,630 -2.1%
Table 9.2: Distribution connections by category
Connections 2012 2013 2014 2015 2016% Change from
2015
Dx DM I &C 207 203 200 212 218 2.8%Dx NDM I &C 23,967 24,054 24,548 25,111 25,565 1.8%Dx NDM RES 626,791 630,921 636,012 642,836 649,445 1.0%Dx Total 650,965 655,178 660,760 668,159 675,228 1.1%
Table 9.3: Distribution Network Lengths - Systems Length at end 20152012 2013 2014 2015 2016
Total Length (km) 11,131 11,218 11,288 11,339 11,527
Table 9.4: New Connections by categoryMeters 2012 2013 2014 2015 2016
Mature Housing 4,722 5,321 4,841 4,544 4,314New Housing30 874 1,003 1,878 2,804 3,588I & C 724 610 681 607 630
30 New housing connection records do not currently differentiate between houses and apartments.
Appendices12.
Systems Performance Report 201666

12.3 List of FiguresFigure 2.1: Overview of Gas Networks Ireland Transmission SystemFigure 3.1: Pipeline Network (RoI)Figure 3.2: Transmission pipeline lengthFigure 3.3: Transmission connections Figure 4.1: System throughputFigure 4.2: System throughput per entry point (Calendar Year 2016)Figure 4.3: Demand changeFigure 4.4: Fuel usageFigure 4.5: Meter read verificationFigure 4.6: UAG (% Throughput)Figure 4.7: UAG (Energy)Figure 4.8: Shrinkage as % of throughputFigure 4.9: System balancing actionsFigure 4.10: Compressor station carbon emissionsFigure 4.11: Exit capacity bookingsFigure 4.13: Distribution SPCFigure 4.14: Entry capacity bookingsFigure 5.1: Total gas points and market activityFigure 5.2: GP activity by yearFigure 8.1: System availabilityFigure 8.2: Meter read access ratesFigure 8.3: Meter read rateFigure 9.1: Distribution system dataFigure 9.2: Connections by categoryFigure 9.3: Distribution system length (km)Figure 9.4: Distribution capital programmesFigure 9.5: New connections by category
Gas Networks Ireland 67

12.4 List of TablesTable 3.1: Transmission pipeline length (Km)Table 3.2: Transmission connectionsTable 4.1: System balancing actionsTable 4.2: Transmission service standards 2016Table 4.3: System throughputTable 4.4: System Throughput per entry point (Calendar Year 2016)Table 4.5: Demand changeTable 4.6: Fuel usageTable 4.7: Meter read verificationTable 4.8: Transmission unaccounted for gasTable 4.9: ShrinkageTable 4.10: Compressor stations carbon emissionsTable 4.11: Demand change for the year (kWh)Table 4.12: Exit capacity bookingsTable 4.13: Entry capacity bookingsTable 5.1: Gas Point activity by category Table 5.1: Gas Point activity by category Table 6.1: Achievement of capital programmeTable 7.1: Safety statisticsTable 8.1: Meter data servicesTable 8.2: Systems availabilityTable 8.3: Shipper operationsTable 8.4: Meter readingTable 8.5: Trading and settlementsTable 8.6: Maintenance daysTable 9.1: Distribution gas flowsTable 9.2: Distribution connections by categoryTable 9.3: Distribution network lengths - systems length at end 2016Table 10.1: High level gas safety statistics
Appendices12.
Systems Performance Report 201668

ww
w.s
ourc
edes
ign.
ie