System-friendly wind power - diw.de · At 30% penetration, the value factor of wind falls to 0.5...
37
System-friendly wind power BELEC | 28 May 2015 | [email protected] Lion Hirth (neon) Simon Müller (IEA)
Transcript of System-friendly wind power - diw.de · At 30% penetration, the value factor of wind falls to 0.5...

System-friendly wind power
BELEC | 28 May 2015 | [email protected]
Lion Hirth (neon)
Simon Müller (IEA)
Seeking advice on power markets? Neon Neue Energieökonomik is a Berlin-based boutique consulting firm for energy economics. Neon conducts model-based studies of power markets, provides electricity price forecasts, and organizes workshops. www.neon-energie.com

The wind and solar powervalue drop

Lion Hirth 4
For economics, it matters when electricity is produced
German day-ahead spot price. 13-17 March 2014. On Sunday morning, the instantaneous wind penetration rate exceeded 50%.

Lion Hirth 5
Value factor: the relative price of wind power
Wind in Germany
Base price(€/MWh)
Wind Revenue(€/MWh)
Value Factor(1)
2001 24 25* 1.02
... ... ... ...
2014 35 30 .86
Simple average
of all hours of the year
Wind-weighted average
Ratio of these two

Lion Hirth 6
?
Value Factor =Market value /
base price
Each dot representsone year
Source: updated from Hirth (2013). Based on German day-ahead spot-price data 2001 – 2014
The wind and solar value drop
The relative value of electricity from wind and solar power is reduced as their market share grows.
2014
2014

Lion Hirth 7
Capacity (MW)
Variable cost(€/MWh)
LoadResidual load(net load)
20 GW Wind
30
€/M
Wh
Market-clearing price
CHPNuclear
Lignite Hardcoal
Combinedcycle
(naturalgas)
Opencycle
Reduced price
Source: updated from Hirth (2013)
The mechanics behind the value drop
Magnitude of the drop:
(i) amount of wind generation
(ii) shape of the merit-order curve
(iii) other factors

Lion Hirth 8
The value drop continues: model results
The value factor of solar power decreases from 1.3 at low penetration to 0.6 at 15% market share: (4.6 points per point market share).
Source: updated from Hirth (2013): Market value Source: updated from Hirth (2013): Market value
Wind power Solar power
50% drop-4.6 per %
The value factor of wind power decreases from 1.1 at low penetration to 0.65 at 30% market share (1.5 points per point market share).

Lion Hirth 9
Solar generation is concentrated in very few hours
Solar generation is concentrated in fewer hours than wind power. The fundamental reason is earth’s rotation: at night, the sun never shines.
Source: updated from Hirth (2013): Market value Source: updated from Hirth (2013): Market value of solar
Wind vs. solar: market value
Solar power‘s market value is higher than wind powers‘s at low penetration, but drops quicker.
Cumulative distribution

Lion Hirth 10
The value drop continues: model results
The value drop jeopardized...
… profitability
… phase-out of support schemes
… decarbonization of the power system
… renewables targets
... which is bad news for ...
… investors in renewables
… finance ministers
… the climate
… the renewable industry
0.5 – 0.8
The wind value factor falls to 0.5 to 0.8 at 30% penetration.
Source: updated from Hirth (2013): Market value
Wind power
CO2 price between 0 – 100 €/t, Flexible ancillary services provision, Zero / double interconnector capacity, Flexible CHP plants, Zero / double storage capacity, Double fuel price, ...

Lion Hirth 11
Source: updated from Hirth (2013): Market value
Literature review: consistent with model results
Country
Journal
Implicit value factor estimates

Lion Hirth 12
At 30% penetration, the value factor of wind falls to 0.5 – 0.8 of the base price. In Germany, it has already fallen from 1.02 to 0.89 as penetration increased from 2% to 8%. The value drop jeopardizes power system decarbonization and transformation.
Different methodologies – robust finding: value drops
Market data EMMA model results Literature review

“Advanced” wind power

Lion Hirth 14
Wind turbine technology has changed dramatically during the past years...• higher towers
• lower specific rating (W/m²)
• increased capacity factors
• “advanced wind turbines“
... with potentially large effect on power systems and markets.• higher capacity credit
• reduced grid expansion requirements
• impact on optimal thermal mix
• reduced storage & flexibility requirements
• less forecast errors
• higher market value
... relative togenerator
hig
her
to
wer
The silent revolution: new wind turbine technology

Lion Hirth 15
The silent revolution: new wind turbine technology
Wiser & Bolinger (2014)
Fraunhofer IWES (2013)
Specific rating in the U.S.
Specific rating in Germany
Wind turbine technology has changed dramatically during the past years...• higher towers
• lower specific rating (W/m²)
• increased capacity factors
• “advanced wind turbines“
... with potentially large effect on power systems and markets.• higher capacity credit
• reduced grid expansion requirements
• impact on optimal thermal mix
• reduced storage & flexibility requirements
• less forecast errors
• higher market value
Lion Hirth 16
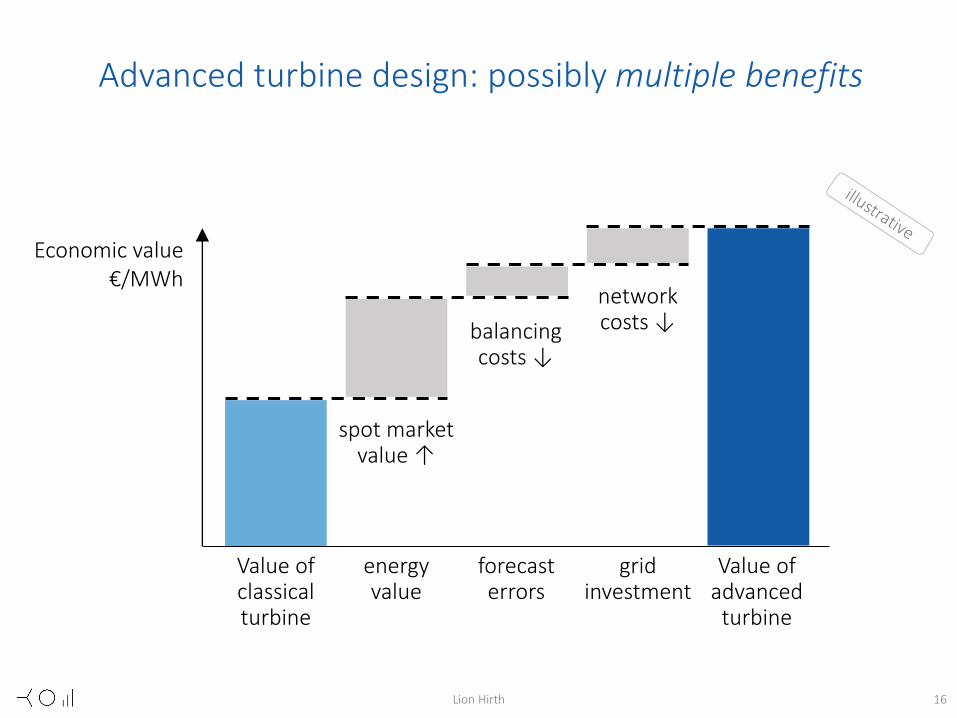
Advanced turbine design: possibly multiple benefits
Value ofclassical turbine
Economic value€/MWh
Value of advanced
turbine
spot market value ↑
networkcosts ↓balancing
costs ↓
energy value
forecast errors
grid investment
Lion Hirth 17
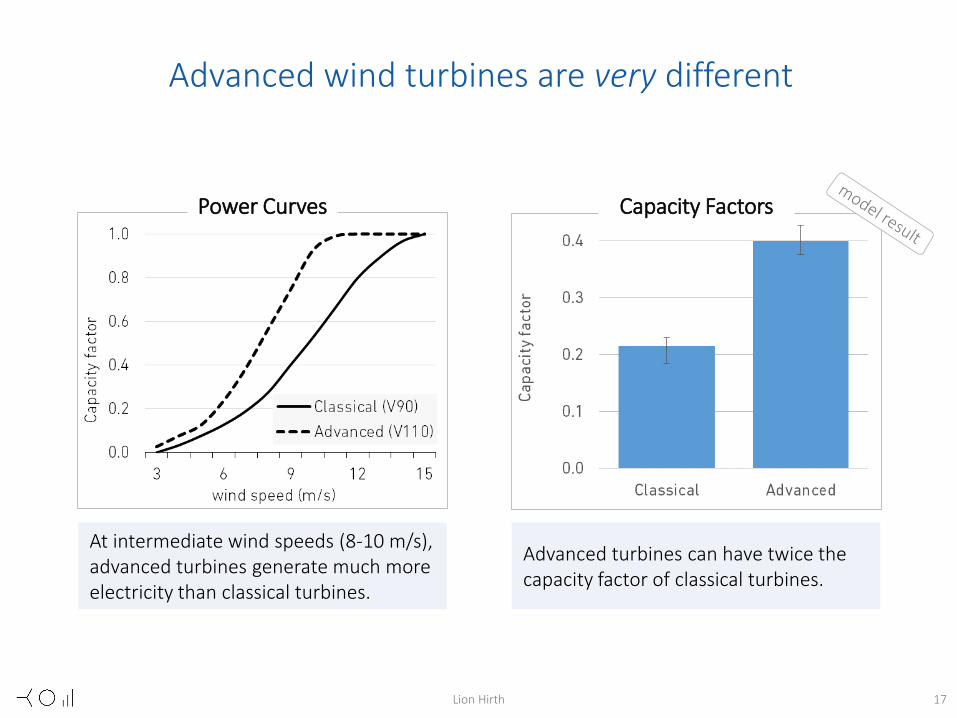
Advanced wind turbines are very different
At intermediate wind speeds (8-10 m/s), advanced turbines generate much more electricity than classical turbines.
Power Curves Capacity Factors
Advanced turbines can have twice the capacity factor of classical turbines.

Lion Hirth 18
Much smoother generation profile
Less fluctuations of output...
Hourly generation Duration curves
... and more evenly distribution. (Both figures assume the yearly amount of electricity generated.)

Does advanced wind powerhelp mitigating the value drop?

Objective: minimize total system costs• capital costs• fuel and CO2 costs• fixed and and variable O&M costs• ... of power plants, storage, interconnectors
Decision variables• hourly plant dispatch and trade of electricity• investment in plants, storage, interconnectors
Constraints• energy balance• capacity constraints• volume constraints of storage• balancing reserve requirement• CHP generation• (no unit commitment)
Resolution• temporal: hours• spatial: bidding areas (countries) – no load flow• technologies: eleven plant types
Input data• wind, solar and load data from the same year• existing plant stack
Economic assumptions• price-inelastic demand• no market power
Equilibrium• short-/mid-/long-term equilibrium (“one year”)• no transition path (“up to 2030”)
Implementation• linear program• GAMS / cplex
Open source
The Electricity Market Model EMMANumerical partial-equilibrium model of the European interconnected power market

Lion Hirth 21
Major result: market value strongly increases
13 percentage-points (22%): large delta at high penetration
Classical turbines: stronger seasonal correlation with load
Land-based wind power from system-friendly turbines is 22% more valuable than wind power from classical turbines (at 30% penetration).
Delta becomes significant at 15% penetration
Penetration (always) in energy terms
Wind value factor
Lion Hirth 22
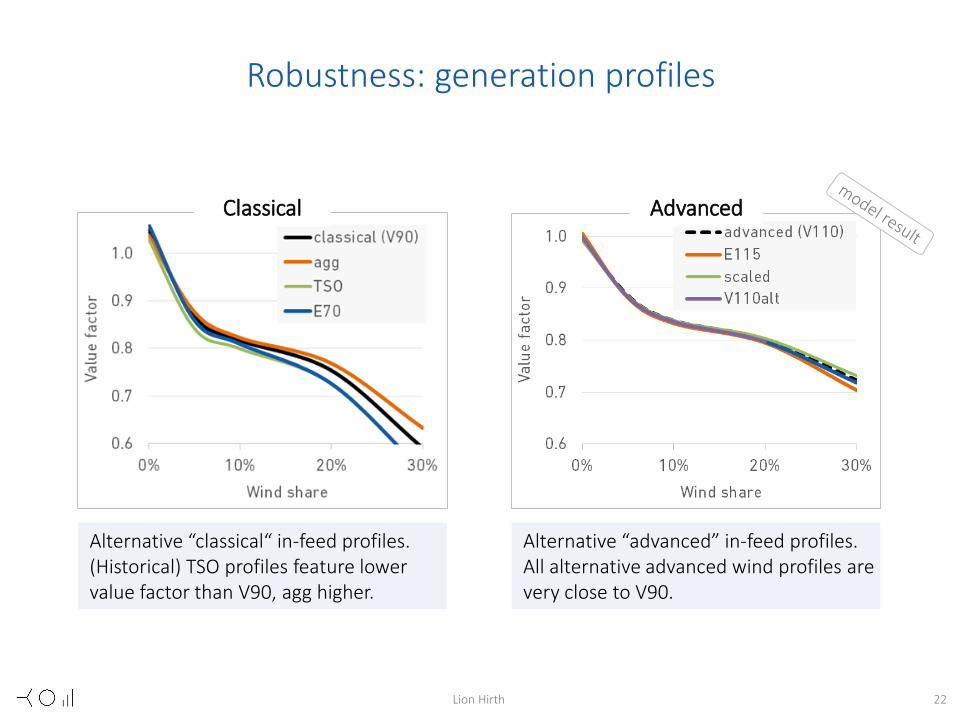
Robustness: generation profiles
Alternative “classical“ in-feed profiles. (Historical) TSO profiles feature lower value factor than V90, agg higher.
Alternative “advanced” in-feed profiles. All alternative advanced wind profiles are very close to V90.
Classical Advanced
Lion Hirth 23
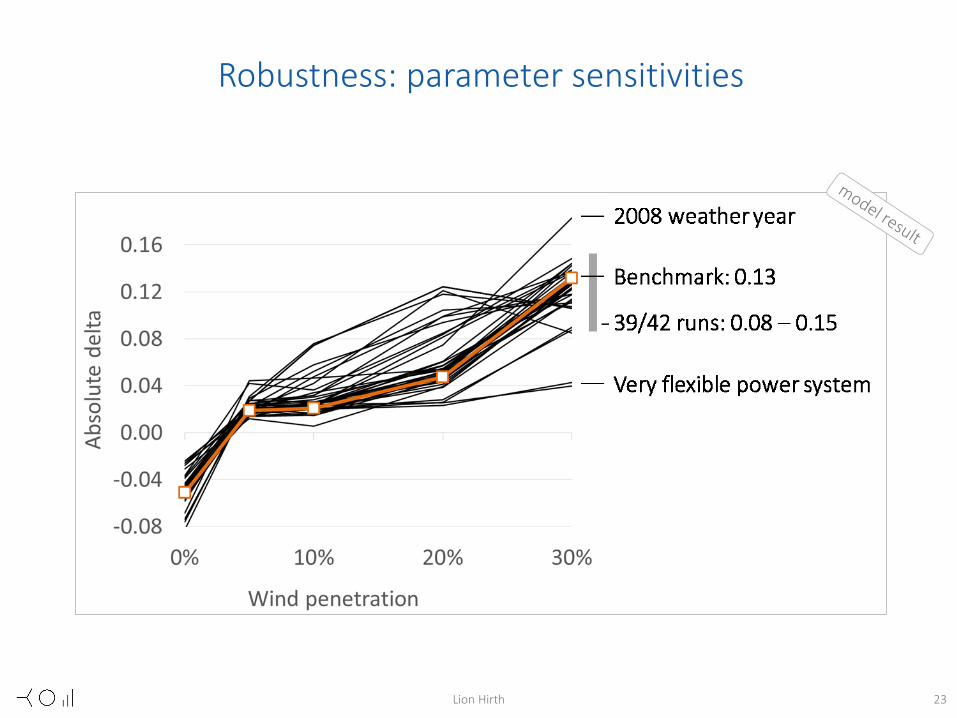
Robustness: parameter sensitivities

Lion Hirth 24
Wind-friendly system vs. system-friendly wind
The impact of advanced turbine design is large compared to other integration options (mitigation measures).
Joint impact is smaller than the sum of individual impacts, advanced wind and power system flexibility are substitutes.
Comparing options Combining options
Lion Hirth 25
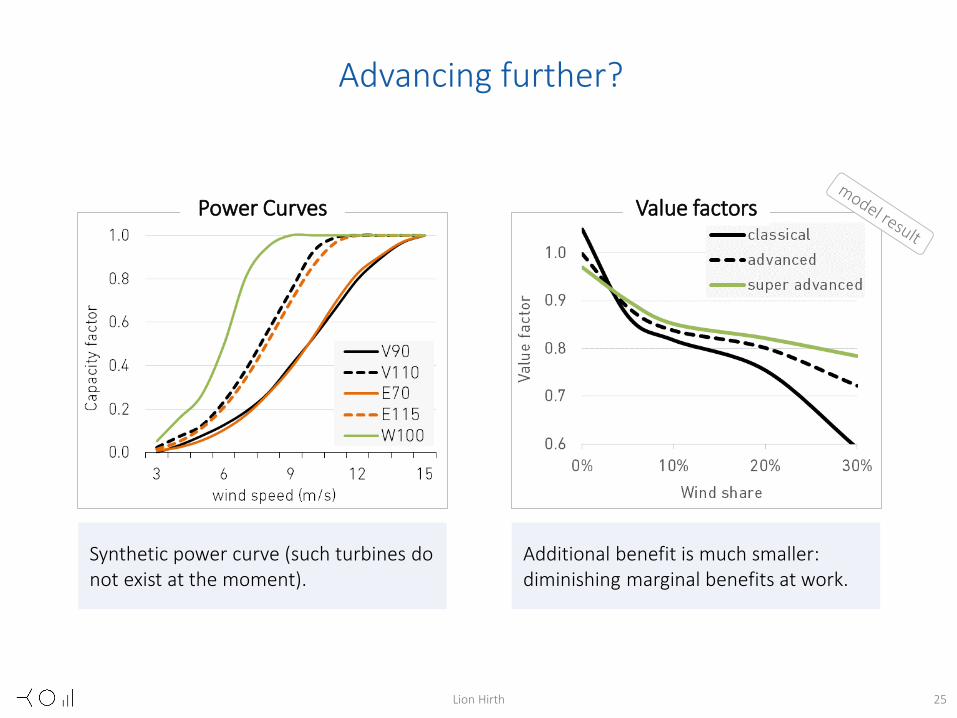
Advancing further?
Synthetic power curve (such turbines do not exist at the moment).
Additional benefit is much smaller: diminishing marginal benefits at work.
Power Curves Value factors

Lion Hirth 26
The optimal amount of wind power
At same LEC levels, advanced wind power would be deployed up to 50% more in energy terms.
The negative impact at high price levels isdriven by investments in nuclear power and/or CCS.
As a function of cost reduction As a function of CO2 price

Further benefits

Lion Hirth 28
Value ofclassical turbine
Economic value€/MWh
Value of advanced
turbine
spot market value ↑
networkcosts ↓balancing
costs ↓
energy value
forecast errors
grid investment

Lion Hirth 29
Reduced forecast errors
With advanced wind power, large forecast errors occure less frequently, potentially reducing balancing reserves and costs (at the same penetration rate).

Lion Hirth 30
per capacity per energy
classical design advanced design
Grid connection 70 – 150 €/kW 2 – 6 €/MWh 1 – 3 €/MWh
Grid expansion 50 – 200 €/kW 2 – 8 €/MWh 1 – 4 €/MWh
Total 120 – 315 €/kW 5 – 13 €/MWh 2 – 7 €/MWh
Reduced grid costs
With advanced wind power, grid costs are estimated to be reduced by 2-7 €/MWh. This estimate isbased on literature values and subject to significant uncertainty.
Lion Hirth 31
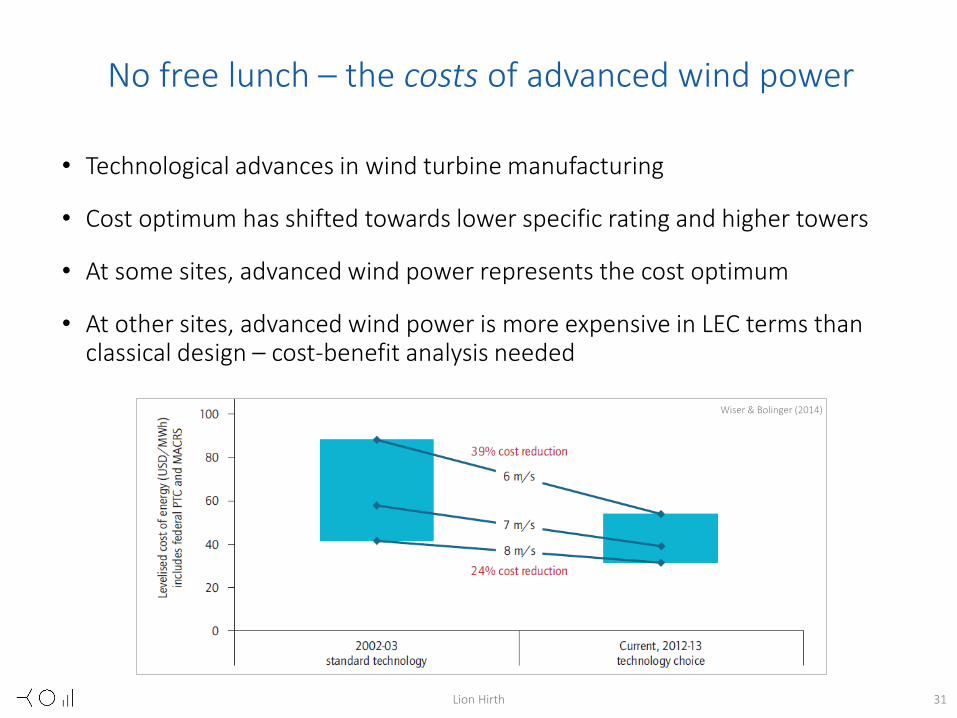
No free lunch – the costs of advanced wind power
• Technological advances in wind turbine manufacturing
• Cost optimum has shifted towards lower specific rating and higher towers
• At some sites, advanced wind power represents the cost optimum
• At other sites, advanced wind power is more expensive in LEC terms than classical design – cost-benefit analysis needed
Wiser & Bolinger (2014)

What about advanced solar?
Lion Hirth 33
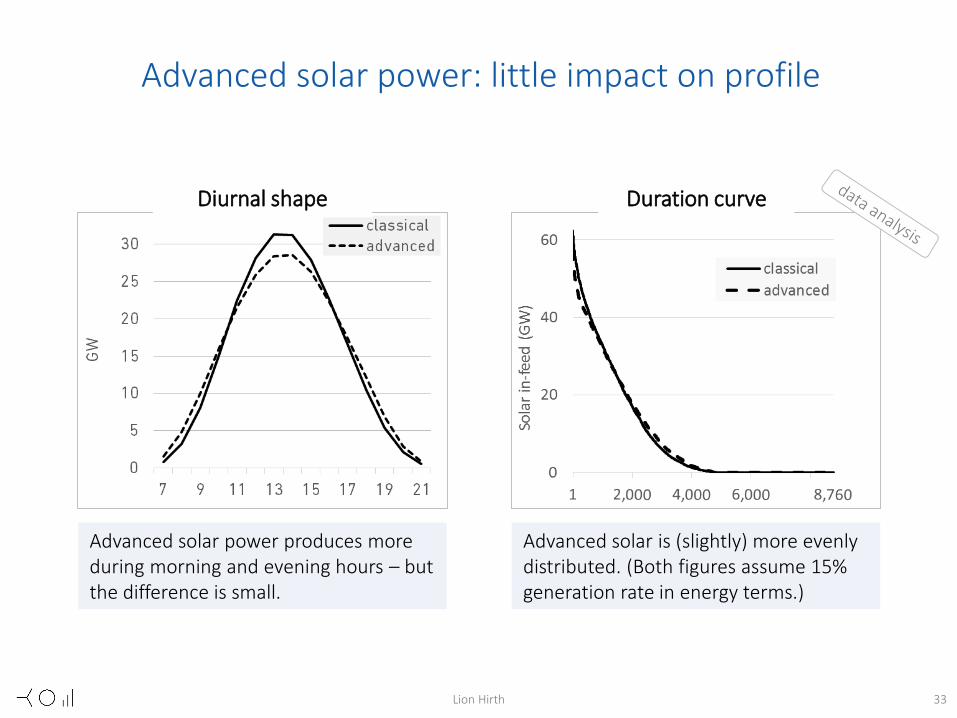
Advanced solar power: little impact on profile
Advanced solar power produces more during morning and evening hours – but the difference is small.
Advanced solar is (slightly) more evenly distributed. (Both figures assume 15% generation rate in energy terms.)
Diurnal shape Duration curve

Lion Hirth 34
... and (very) little impact on value
The benefits of east- and west- oriented solar modules is small: At 15% penetration, the benefit is only seven percent.
3 percentage-points (7%): small delta

Lion Hirth 35
Summary
The “silent revolution“ is changing the design of wind turbines significantly
• higher towers
• lower specific rating
• more constant power generation
This potentially improves the economics of wind power (€/MWh)
• higher spot market value
• reduced balancing costs
• reduced grid costs
We find a 22% spot market value increase at a wind penetration rate of 30%
• benefit increases with penetration
• large relative to other integration options
• robust with respect to parameter assumptions
Lion Hirth 36
Conclusions
For policy...
The economic value of electricity from wind power depends on turbine design.Policy frameworks for renewables should seek to incentivizes highest net value,
not (only) lowest LCOE.
Pricing mechanisms for balancing and grids should reflect true costs.
Price signals to investors should include all benefits of advanced wind power.
For modelers...
The long-term energy value of wind power at high penetration levels is higher than we believed.
Scaling-up empirical wind generation time series underestimates value.
Advanced wind turbines probably reduce the need for grid connection capacity.
Modelled grid expansion costs for integration of wind power may overstate the incremental grid needs.


![May 11, 2014: a Record P roduction from[Wind + PV] in Germany](https://static.fdocuments.in/doc/165x107/5681691a550346895de03967/may-11-2014-a-record-p-roduction-fromwind-pv-in-germany.jpg)