
Synthesis and Validation of Flight Control for UAV€¦ · Synthesis and Validation of Flight...
189
Synthesis and Validation of Flight Control for UAV A DISSERTATION SUBMITTED TO THE FACULTY OF THE GRADUATE SCHOOL OF THE UNIVERSITY OF MINNESOTA BY Yew Chai Paw IN PARTIAL FULFILLMENT OF THE REQUIREMENTS FOR THE DEGREE OF DOCTOR OF PHILOSOPHY Gary J. Balas December 2009
Transcript of Synthesis and Validation of Flight Control for UAV€¦ · Synthesis and Validation of Flight...

Synthesis and Validation of Flight Control for UAV
A DISSERTATION
SUBMITTED TO THE FACULTY OF THE GRADUATE SCHOOL
OF THE UNIVERSITY OF MINNESOTA
BY
Yew Chai Paw
IN PARTIAL FULFILLMENT OF THE REQUIREMENTS
FOR THE DEGREE OF
DOCTOR OF PHILOSOPHY
Gary J. Balas
December 2009

c© Yew Chai Paw 2009
All Rights Reserved

Acknowledgements
I would like to express my deepest gratitude to my advisor, Professor Gary Balas for his
guidance, helps and precious advices in shaping my research work and exposure gained.
I am grateful and appreciate his constant supports and initiatives for the UAV research
group that make my research possible. His enthusiasm in research and sense of humor have
never fail to surprise me. I am really delighted and never regret the tough decision I made
four years ago to come to bitter cold Minnesota to work under him.
I am also grateful to Professor Demoz Gebre-Egziabher who shares his insights and
experiences in sensor fusion. I always enjoyed having discussions with him in various re-
search areas. Thanks to my other committee members, Professor Tryphoon Georgiou (I
have gathered quite a number of life philosophies from him after attending 3 of his courses)
and Professor William Garrard (who happens to be my undergraduate and master theses
advisor’s advisor) for their constructive advices and criticism.
Thanks to the past and present residents of Control and Dynamics Lab who make it
a wonderful place for research with a lot of interactions and activities that kept everyone
going days and nights throughout the years. Special thanks to Rohit who has helped and
taught me embedded software programming, Abhijit who volunteered to drive the flight
test team many early weekend mornings and Balint who always give me valuable advices.
Contributions from the UAV team members have been critical to my research progress.
Thanks to the RC pilots, Brian, Christopher, James, Andrew and Troy, for their professional
flying skills that saved the UAV from numerous crashes during the flight test, to Tom for
his endless help in the ground control software. 4 years stay in Minneapolis would not
be great without the colleagues that turned to great caring friends like Arnar, Guijin and
Troy. Troy has been an awesome buddy who always help me to reach out and feel home in
i

Minnesota.
I would also like to thanks my company colleagues, Zhou Min, Lim Kok Yong, Peter
Seah, Boyd Loh and Alvin Teng, who took over my job responsibilities and continue to help
me one way or another while I am on study leave. I am grateful to my previous lab head,
Dr Ho Quan Wai and Dr Cheng Wei Ping for their advices, supports and helps in getting
the postgraduate scholarship. Thanks to my bachelor and master thesis advisor, Professor
Eicher Low, who has been helping and guiding me all these years towards my PhD dream,
not forgetting to mention his important influence on my decision to choose Professor Balas
as my PhD advisor.
My gratitude to my sponsor company, DSO National Laboratories, for awarding me the
postgraduate scholarship and in giving me the opportunity to fulfill my dream of overseas
PhD study. I appreciate the great financial support over the years that makes my study
life and overseas stay easier than my peers.
Finally, thanks to my parents for their constant supports while I am away from them
these four years.
ii

Success begins with a fellow’s will.
It’s all in the state of mind.
Life’s battles don’t always go
To the stronger or faster man,
But sooner or later, the man who wins
Is the man who thinks he can!
‘The Victor’ ∼ C W Longenecker
iii

Abstract
Unmanned Aerial Vehicles (UAVs) are widely used worldwide for a board range of civil
and military applications. There continues to be a growing demand for reliable and low
cost UAV systems. This is especially true for small-size mini UAV systems where majority
of systems are still deployed as prototypes due to their lack of reliability. Improvement in
the modeling, testing and flight control for the small UAVs would increase their reliability
during autonomous flight.
The traditional approach used in manned aircraft and large UAV system synthesizing,
implementing and validating the flight control system to achieve desired objectives is time
consuming and resource intensive. This thesis aims to provide an integrated framework
with systematic procedures to synthesize and validate flight controllers. This will help in
the certification of UAV system and provide rapid development cycle from simulation to
real system flight testing. The effectiveness of the approach is demonstrated by applying
the developed framework on a small UAV system that was developed at the University of
Minnesota.
The thesis is divided into four main parts. The first part is mathematical modeling of
the UAV nonlinear simulation model using first principle theory. Flight test system iden-
tification technique is used to extract model and model uncertainty parameters to update
the nonlinear simulation model. The nonlinear simulation model developed must be able
to simulate the actual UAV flight dynamics accurately for real-time simulation and robust
control design purposes. Therefore it is important to include model uncertainties into the
nonlinear simulation model developed, especially in small UAV system where its dynamics
is less well understood than the full-size aircraft. The second part of the work provides
the approach and procedures for uncertainty modeling into the nonlinear simulation model
such that realization of linear uncertain model is possible.
The third part of work describes the flight control design and architecture used in the
iv

UAV autopilot system. Classical and model-based control synthesis approaches are pre-
sented for roll angle tracking controller to demonstrate the controller synthesis approaches
and practical controller implementation issues on the embedded flight computer system.
The last part of work blends in all the previous works into the integrated framework for
testing and validation of the synthesized controllers. This involves software-in-the-loop,
processor-in-the-loop and flight testing of the synthesized controllers using the integrated
framework developed.
v

Contents
1 Introduction 1
1.1 Overview . . . . . . . . . . . . . . . . . . . . . . . . . . . . . . . . . . . . . 1
1.2 Challenges in UAV Flight Control Synthesis and Validation . . . . . . . . . 2
1.2.1 High Fidelity Simulation Model . . . . . . . . . . . . . . . . . . . . . 3
1.2.2 Uncertainty Modeling . . . . . . . . . . . . . . . . . . . . . . . . . . 3
1.2.3 Model Validation . . . . . . . . . . . . . . . . . . . . . . . . . . . . . 4
1.2.4 Performance Validation . . . . . . . . . . . . . . . . . . . . . . . . . 4
1.3 Integrated Framework . . . . . . . . . . . . . . . . . . . . . . . . . . . . . . 5
1.4 Research Outline: Objectives and Scope . . . . . . . . . . . . . . . . . . . . 5
1.4.1 Objective . . . . . . . . . . . . . . . . . . . . . . . . . . . . . . . . . 5
1.4.2 Scope . . . . . . . . . . . . . . . . . . . . . . . . . . . . . . . . . . . 5
1.5 Research Contribution . . . . . . . . . . . . . . . . . . . . . . . . . . . . . . 6
1.6 Organization of Dissertation . . . . . . . . . . . . . . . . . . . . . . . . . . . 6
2 Small UAV Nonlinear Simulation Model 9
2.1 UAV Platform . . . . . . . . . . . . . . . . . . . . . . . . . . . . . . . . . . 10
2.1.1 Physical Geometry . . . . . . . . . . . . . . . . . . . . . . . . . . . . 10
2.1.2 Flight Avionics System . . . . . . . . . . . . . . . . . . . . . . . . . 11
2.2 Nonlinear Simulation Model . . . . . . . . . . . . . . . . . . . . . . . . . . . 13
2.2.1 Aerodynamic Model . . . . . . . . . . . . . . . . . . . . . . . . . . . 13
2.2.2 Inertia Model . . . . . . . . . . . . . . . . . . . . . . . . . . . . . . . 17
2.2.3 Propulsion Model . . . . . . . . . . . . . . . . . . . . . . . . . . . . . 19
2.2.4 Actuator Model . . . . . . . . . . . . . . . . . . . . . . . . . . . . . . 22
vi

3 Flight Test System Identification 24
3.1 Model Structure for Parameters Identification . . . . . . . . . . . . . . . . . 24
3.1.1 Linear Decoupled Model . . . . . . . . . . . . . . . . . . . . . . . . . 26
3.1.2 Parameterized State-space Lateral Model . . . . . . . . . . . . . . . 33
3.2 Design of Experiment . . . . . . . . . . . . . . . . . . . . . . . . . . . . . . 35
3.2.1 Flight Tests . . . . . . . . . . . . . . . . . . . . . . . . . . . . . . . . 35
3.2.2 Input Signal Design . . . . . . . . . . . . . . . . . . . . . . . . . . . 35
3.2.3 Data Acquisition System . . . . . . . . . . . . . . . . . . . . . . . . 38
3.3 Flight Test Execution . . . . . . . . . . . . . . . . . . . . . . . . . . . . . . 40
3.4 Parameter Identification Technique . . . . . . . . . . . . . . . . . . . . . . . 41
3.4.1 Parameter Identification Setup . . . . . . . . . . . . . . . . . . . . . 42
3.4.2 Procedure . . . . . . . . . . . . . . . . . . . . . . . . . . . . . . . . . 43
3.5 Result . . . . . . . . . . . . . . . . . . . . . . . . . . . . . . . . . . . . . . . 45
3.5.1 Stability Derivatives . . . . . . . . . . . . . . . . . . . . . . . . . . . 47
3.5.2 Yaw and Coupled Roll-yaw Dynamics . . . . . . . . . . . . . . . . . 48
3.5.3 Control Derivatives . . . . . . . . . . . . . . . . . . . . . . . . . . . . 48
3.6 Model Verification . . . . . . . . . . . . . . . . . . . . . . . . . . . . . . . . 49
3.6.1 Time Domain Model Verification . . . . . . . . . . . . . . . . . . . . 49
3.6.2 Frequency Domain Model Verification . . . . . . . . . . . . . . . . . 49
3.7 Updating of Aerodynamic coefficients in Nonlinear Model . . . . . . . . . . 52
3.7.1 Nominal Identified Model . . . . . . . . . . . . . . . . . . . . . . . . 52
3.7.2 Aerodynamic Coefficients Computation . . . . . . . . . . . . . . . . 52
4 Uncertainty Models Modeling, Synthesis and Analysis 58
4.1 Parametric Uncertainty Modeling . . . . . . . . . . . . . . . . . . . . . . . . 59
4.1.1 Parametric Uncertainty Representation . . . . . . . . . . . . . . . . 60
4.1.2 Example . . . . . . . . . . . . . . . . . . . . . . . . . . . . . . . . . . 61
4.2 Linear Fractional Transformation . . . . . . . . . . . . . . . . . . . . . . . . 63
4.2.1 Method of LFT Model Realization . . . . . . . . . . . . . . . . . . . 65
4.2.2 ulinearize Principles and Procedure . . . . . . . . . . . . . . . . . . . 66
4.2.3 Limitations of ulinearize . . . . . . . . . . . . . . . . . . . . . . . . . 67
vii

4.2.4 Effect of Trim Point . . . . . . . . . . . . . . . . . . . . . . . . . . . 69
4.3 UAV LFT Model Realization . . . . . . . . . . . . . . . . . . . . . . . . . . 70
4.3.1 Uncertain System Worst-case Gain . . . . . . . . . . . . . . . . . . . 72
4.3.2 Accuracy of LFT Model Realization . . . . . . . . . . . . . . . . . . 73
4.3.3 Decoupled LFT model . . . . . . . . . . . . . . . . . . . . . . . . . . 76
4.4 Uncertain Model Simplification . . . . . . . . . . . . . . . . . . . . . . . . . 78
4.4.1 Uncertain Parameters Sensitivity Analysis . . . . . . . . . . . . . . . 79
4.4.2 Frequency Domain Uncertainty Representation . . . . . . . . . . . . 81
5 Flight Controller Synthesis and Implementation 90
5.1 Flight Control Architecture Overview . . . . . . . . . . . . . . . . . . . . . 91
5.2 Problem Formulation for Flight Control Synthesis . . . . . . . . . . . . . . 93
5.3 Classical Control Design . . . . . . . . . . . . . . . . . . . . . . . . . . . . . 94
5.3.1 Controller Architecture . . . . . . . . . . . . . . . . . . . . . . . . . 95
5.3.2 Controller Tuning . . . . . . . . . . . . . . . . . . . . . . . . . . . . 95
5.4 Model-based Controller Synthesis . . . . . . . . . . . . . . . . . . . . . . . . 97
5.4.1 Control Design Specifications . . . . . . . . . . . . . . . . . . . . . . 98
5.4.2 Problem Formulation and Weighting Functions Selection . . . . . . . 99
5.4.3 H∞ and µ Controller Synthesis . . . . . . . . . . . . . . . . . . . . . 104
5.5 Controller Implementation . . . . . . . . . . . . . . . . . . . . . . . . . . . . 106
5.5.1 Controller Order Reduction . . . . . . . . . . . . . . . . . . . . . . . 107
5.5.2 Controller Discretization . . . . . . . . . . . . . . . . . . . . . . . . . 108
5.5.3 Controller C Code Implementation . . . . . . . . . . . . . . . . . . . 109
5.5.4 Anti-windup Scheme . . . . . . . . . . . . . . . . . . . . . . . . . . . 110
5.6 µ Controller Synthesis and Implementation . . . . . . . . . . . . . . . . . . 111
5.6.1 Input Multiplicative Uncertainty Model . . . . . . . . . . . . . . . . 112
5.6.2 µ Controller Synthesis . . . . . . . . . . . . . . . . . . . . . . . . . . 112
5.6.3 Robust Analysis . . . . . . . . . . . . . . . . . . . . . . . . . . . . . 113
5.6.4 Controller Implementation . . . . . . . . . . . . . . . . . . . . . . . . 115
viii

6 Flight Control System Testing and Performance Validation in Integrated
Framework 117
6.1 Integrated Framework for Flight Control Development Testing . . . . . . . 118
6.1.1 Initial Design Testing . . . . . . . . . . . . . . . . . . . . . . . . . . 119
6.1.2 Software-in-the-loop Testing . . . . . . . . . . . . . . . . . . . . . . . 119
6.1.3 Processor-in-the-loop Testing . . . . . . . . . . . . . . . . . . . . . . 119
6.1.4 Flight Testing . . . . . . . . . . . . . . . . . . . . . . . . . . . . . . . 121
6.2 Processor-in-the-loop Simulator . . . . . . . . . . . . . . . . . . . . . . . . . 121
6.2.1 PIL Simulator System Setup . . . . . . . . . . . . . . . . . . . . . . 122
6.2.2 PIL System Operation Verification . . . . . . . . . . . . . . . . . . . 125
6.3 Integrated Framework Flight Control Synthesis and Validation . . . . . . . 131
6.3.1 Flight Test Validation Setup . . . . . . . . . . . . . . . . . . . . . . 131
6.3.2 Initial Design Testing . . . . . . . . . . . . . . . . . . . . . . . . . . 134
6.3.3 Software-in-the-loop Testing . . . . . . . . . . . . . . . . . . . . . . . 135
6.3.4 Processor-in-the-loop Testing . . . . . . . . . . . . . . . . . . . . . . 135
6.3.5 Flight Testing . . . . . . . . . . . . . . . . . . . . . . . . . . . . . . . 136
6.4 Applications of Integrated Framework for Performance Analysis . . . . . . . 139
7 Conclusion and Recommendations 142
7.1 Summary . . . . . . . . . . . . . . . . . . . . . . . . . . . . . . . . . . . . . 142
7.2 Recommendations . . . . . . . . . . . . . . . . . . . . . . . . . . . . . . . . 144
Bibliography 145
A Physical Parameters Data 151
A.1 Simulator Parameter Tuning . . . . . . . . . . . . . . . . . . . . . . . . . . 151
A.2 Moment of Inertia Measurement . . . . . . . . . . . . . . . . . . . . . . . . 152
A.2.1 Aircraft Moment of Inertia Measurement . . . . . . . . . . . . . . . 152
A.2.2 Propulsion Moment of Inertia Measurement . . . . . . . . . . . . . . 153
A.2.3 Summary of Moment of Inertia Data . . . . . . . . . . . . . . . . . . 155
A.3 Propeller Characteristics . . . . . . . . . . . . . . . . . . . . . . . . . . . . . 156
A.4 Control Surfaces Limits . . . . . . . . . . . . . . . . . . . . . . . . . . . . . 156
ix

B Linearization Result 157
B.1 Operating Point Condition . . . . . . . . . . . . . . . . . . . . . . . . . . . 157
B.2 Full Linearized Model . . . . . . . . . . . . . . . . . . . . . . . . . . . . . . 158
B.3 Decoupled Linear Model . . . . . . . . . . . . . . . . . . . . . . . . . . . . . 159
B.4 Open Loop ID Results . . . . . . . . . . . . . . . . . . . . . . . . . . . . . . 161
B.4.1 Model 2 Parameter Identification . . . . . . . . . . . . . . . . . . . 161
B.4.2 Model 3 Parameter Identification . . . . . . . . . . . . . . . . . . . . 162
B.5 Nominal Model Computed . . . . . . . . . . . . . . . . . . . . . . . . . . . . 163
C Uncertainty Modeling 164
C.1 Aerodynamic Coefficients Parametric Uncertainty . . . . . . . . . . . . . . . 164
x

List of Tables
2.1 Summary of important aircraft geometry . . . . . . . . . . . . . . . . . . . . 11
2.2 Components in flight avionics system . . . . . . . . . . . . . . . . . . . . . . 12
2.3 Aerodynamic coefficients required for Ultrastick UAV modeling . . . . . . . 17
3.1 Desired flight operating envelope . . . . . . . . . . . . . . . . . . . . . . . . 28
3.2 Summary of estimated parameters from flight test data . . . . . . . . . . . 47
3.3 Identified models roll mode time constant . . . . . . . . . . . . . . . . . . . 47
3.4 Control derivatives ratio . . . . . . . . . . . . . . . . . . . . . . . . . . . . . 49
3.5 Relationships between dimensionless aerodynamic coefficients and dimen-
sional derivatives . . . . . . . . . . . . . . . . . . . . . . . . . . . . . . . . . 54
3.6 Dimensional and dimensionless aerodynamic coefficients . . . . . . . . . . . 56
4.1 Uncertain parameters in full and decoupled models (“-” denotes parameter
that has been eliminated) . . . . . . . . . . . . . . . . . . . . . . . . . . . . 89
5.1 UAV flight modes . . . . . . . . . . . . . . . . . . . . . . . . . . . . . . . . . 91
A.1 Aerodynamic coefficients obtained from simulator parameter tuning . . . . 151
A.2 Moment of inertia data . . . . . . . . . . . . . . . . . . . . . . . . . . . . . . 155
A.3 Propeller performance data for APC 12 x 8E propeller . . . . . . . . . . . . 156
A.4 Control surfaces saturation limits . . . . . . . . . . . . . . . . . . . . . . . . 156
B.1 Trim operating point condition . . . . . . . . . . . . . . . . . . . . . . . . . 157
B.2 Nominal model with upper and lower bounds . . . . . . . . . . . . . . . . . 163
C.1 Aerodynamic coefficients nominal, lower and upper bound values . . . . . . 164
xi

C.2 List of parameters with its nominal, lower and upper bound values . . . . . 166
C.3 ∆ matrix of LFT realization using ulinearize . . . . . . . . . . . . . . . . . 168
C.4 ∆ matrix of worst-case gain condition at 5 rad/s . . . . . . . . . . . . . . . 169
xii

List of Figures
1.1 Integrated framework for flight control development . . . . . . . . . . . . . 2
1.2 Overview of dissertation . . . . . . . . . . . . . . . . . . . . . . . . . . . . . 8
2.1 Research testbed: Ultra Stick 25E RC plane . . . . . . . . . . . . . . . . . . 10
2.2 Flight avionics system architecture layout . . . . . . . . . . . . . . . . . . . 12
2.3 Simplified layout of Aerosim nonlinear 6-DOF aircraft model . . . . . . . . 13
2.4 Forces and moments in aircraft body axis . . . . . . . . . . . . . . . . . . . 14
2.5 Simulator parameter tuning process . . . . . . . . . . . . . . . . . . . . . . 18
2.6 Setup for simulator parameter tuning . . . . . . . . . . . . . . . . . . . . . . 18
2.7 Motor power output . . . . . . . . . . . . . . . . . . . . . . . . . . . . . . . 20
2.8 Propeller performance for APC 12 x 8 propeller . . . . . . . . . . . . . . . . 22
2.9 Propulsion system verification at static flight condition . . . . . . . . . . . . 23
3.1 Procedures involved to update aerodynamic coefficients . . . . . . . . . . . 25
3.2 Procedures for deriving linear decoupled models . . . . . . . . . . . . . . . . 27
3.3 Comparison of linear and nonlinear model output responses . . . . . . . . . 29
3.4 Comparison of full linear and decoupled linear model output responses . . . 32
3.5 Open-loop experimental flight test responses . . . . . . . . . . . . . . . . . . 36
3.6 Control input signals for parameter identification . . . . . . . . . . . . . . . 37
3.7 Data acquisition system for open-loop parameter identification . . . . . . . 39
3.8 Flight test procedures for open-loop parameter identification . . . . . . . . 40
3.9 Schematic for output error parameter identification . . . . . . . . . . . . . . 42
3.10 SIDPAC parameter estimation process . . . . . . . . . . . . . . . . . . . . 44
3.11 Flight test data for model 1 parameter identification . . . . . . . . . . . . . 45
xiii

3.12 Model 1 parameter identification . . . . . . . . . . . . . . . . . . . . . . . . 46
3.13 Time domain verification of identified models . . . . . . . . . . . . . . . . . 50
3.14 FFT of input and output flight test data used in model validation . . . . . 51
3.15 Frequency domain model verification . . . . . . . . . . . . . . . . . . . . . . 51
3.16 Bode magnitude plot of identified models . . . . . . . . . . . . . . . . . . . 53
3.17 Comparison of updated nonlinear model with augmented identified model . 57
3.18 Comparison of updated nonlinear model with flight test data . . . . . . . . 57
4.1 Simulink diagram for nominal system . . . . . . . . . . . . . . . . . . . . . . 61
4.2 Simulink model with real parametric uncertainties . . . . . . . . . . . . . . 62
4.3 Uncertain nonlinear simulation model Monte-Carlo runs . . . . . . . . . . . 63
4.4 General LFT representation for robust control synthesis and analysis . . . . 64
4.5 M-∆ interconnection . . . . . . . . . . . . . . . . . . . . . . . . . . . . . . . 64
4.6 M -∆ structure with M partitioned . . . . . . . . . . . . . . . . . . . . . . . 65
4.7 Creating linearization input and output at the USS System block (Equation
4.1) . . . . . . . . . . . . . . . . . . . . . . . . . . . . . . . . . . . . . . . . 67
4.8 Flow chart of ulinearize function procedure . . . . . . . . . . . . . . . . . . 68
4.9 Procedure in obtaining operating point for ulinearize . . . . . . . . . . . . . 70
4.10 M matrix dimension obtained for UAV LFT model . . . . . . . . . . . . . . 72
4.11 Worst-case gain analysis of full UAV LFT model . . . . . . . . . . . . . . . 73
4.12 Setup for comparing accuracy of LFT model with uncertain nonlinear simu-
lation model . . . . . . . . . . . . . . . . . . . . . . . . . . . . . . . . . . . . 74
4.13 Frequency domain comparison for LFT model realization accuracy . . . . . 75
4.14 Time domain comparison for LFT model realization accuracy . . . . . . . . 76
4.15 Full model vs decoupled model comparison . . . . . . . . . . . . . . . . . . 78
4.16 Parametric uncertainties sensitivity across frequency . . . . . . . . . . . . . 81
4.17 Worst-case gain analysis for different number of parametric uncertainty re-
duction . . . . . . . . . . . . . . . . . . . . . . . . . . . . . . . . . . . . . . 82
4.18 Complex plane uncertainty region and disc overbound . . . . . . . . . . . . 84
4.19 Relationship between lateral LFT model and flight test identified models . . 87
xiv

4.20 Input multiplicative uncertainty bounds for lateral LFT model and flight test
identified models . . . . . . . . . . . . . . . . . . . . . . . . . . . . . . . . . 88
5.1 UAV flight control architecture for autonomous cruise flight . . . . . . . . . 92
5.2 Roll and pitch angle PID controllers . . . . . . . . . . . . . . . . . . . . . . 96
5.3 Tracking performance of roll and pitch angle PID controllers . . . . . . . . 98
5.4 System interconnection for H∞ controller synthesis . . . . . . . . . . . . . . 100
5.5 Configuration for H∞ controller synthesis . . . . . . . . . . . . . . . . . . . 104
5.6 Configuration for µ controller synthesis . . . . . . . . . . . . . . . . . . . . . 105
5.7 Controller implementation process . . . . . . . . . . . . . . . . . . . . . . . 107
5.8 Anti-windup implementation . . . . . . . . . . . . . . . . . . . . . . . . . . 111
5.9 Lateral UAV model with input multiplicative uncertainty . . . . . . . . . . 112
5.10 50 random sampled lateral models . . . . . . . . . . . . . . . . . . . . . . . 113
5.11 Input multiplicative uncertainty model overbound weights . . . . . . . . . . 114
5.12 Hankel singular value plot of the 31 states µ controller . . . . . . . . . . . . 115
5.13 Bode diagram of original and reduced order controller . . . . . . . . . . . . 116
5.14 Robust stability and performance analysis . . . . . . . . . . . . . . . . . . . 116
6.1 Integrated framework for flight control development testing . . . . . . . . . 119
6.2 Flight control development testing architecture: Initial design, software-in-
the-loop and processor-in-the-loop testing . . . . . . . . . . . . . . . . . . . 120
6.3 Overview of PIL simulation concept . . . . . . . . . . . . . . . . . . . . . . 122
6.4 PIL simulator Simulink block architecture . . . . . . . . . . . . . . . . . . . 123
6.5 PIL simulator hardware system setup . . . . . . . . . . . . . . . . . . . . . 124
6.6 PIL simulator setup . . . . . . . . . . . . . . . . . . . . . . . . . . . . . . . 125
6.7 Sensor and attitude solution outputs in PIL simulator . . . . . . . . . . . . 126
6.8 Comparison of nonlinear simulation model and AHRS algorithm angular
rates and Euler angles . . . . . . . . . . . . . . . . . . . . . . . . . . . . . . 127
6.9 Control signal flow diagram . . . . . . . . . . . . . . . . . . . . . . . . . . . 128
6.10 Verification of control signals in PIL simulator . . . . . . . . . . . . . . . . 129
6.11 Time delay measurement in PIL simulator . . . . . . . . . . . . . . . . . . . 130
xv

6.12 Normal and filtered φ doublet commands . . . . . . . . . . . . . . . . . . . 132
6.13 Time history of φref used for validation experiment . . . . . . . . . . . . . . 133
6.14 φ angle tracking for initial design testing . . . . . . . . . . . . . . . . . . . . 134
6.15 φ angle tracking for SIL testing . . . . . . . . . . . . . . . . . . . . . . . . . 135
6.16 Parametric uncertainty values of closed-loop system at worst-case gain con-
dition . . . . . . . . . . . . . . . . . . . . . . . . . . . . . . . . . . . . . . . 137
6.17 φ angle tracking for PIL testing . . . . . . . . . . . . . . . . . . . . . . . . . 137
6.18 φ angle tracking for flight testing . . . . . . . . . . . . . . . . . . . . . . . . 138
6.19 Robust analysis of H∞ controllers with γ of 1.0 and 1.6 . . . . . . . . . . . 140
6.20 SIL and flight test result of H∞ controllers . . . . . . . . . . . . . . . . . . 141
A.1 Description of compound pendulum method setup . . . . . . . . . . . . . . 152
A.2 Setup for aircraft moment of inertia measurement . . . . . . . . . . . . . . . 153
A.3 Bifilar pendulum system setup . . . . . . . . . . . . . . . . . . . . . . . . . 155
B.1 Flight test data for model 2 parameter identification . . . . . . . . . . . . . 161
B.2 Model 2 parameter identification . . . . . . . . . . . . . . . . . . . . . . . . 161
B.3 Flight test data for model 3 parameter identification . . . . . . . . . . . . . 162
B.4 Model 3 parameter identification . . . . . . . . . . . . . . . . . . . . . . . . 162
C.1 Simulink model with real parametric uncertainties for dimensionless roll mo-
ment coefficient . . . . . . . . . . . . . . . . . . . . . . . . . . . . . . . . . . 165
C.2 Simulink model for angular acceleration kinematics . . . . . . . . . . . . . . 167
xvi

List of Symbols
S Vehicle wing reference area (m2)
b Vehicle wing span (m)
g Gravitational acceleration (m/s2)
c Vehicle wing chord (m)
m Vehicle gross takeoff weight (kg)
p, q, r Vehicle body angular rates (rad/s)
ax, ay, az Vehicle body linear accelerations (m/s2)
hx, hy, hz Vehicle body earth magnetic field (Gauss)
Va Vehicle airspeed (m/s)
h Vehicle barometric altitude (m)
ve, vn, vu GPS velocities in ENU frame (m/s)
u, v, w Vehicle body linear velocities (m/s)
lon, lat, alt GPS positions in geodetic frame using WGS84 (deg, deg, m)
X, Y, Z Forces acting on vehicle body x, y and z direction (N)
L,M,N Moments acting on vehicle body x, y and z direction (Nm)
φ, θ, ψ Vehicle body attitude angles (rad)
q Dynamic pressure (Pa)
T Thrust of propulsion system (N)
CX , CY , CZ Aerodynamic force coefficients in x, y and z direction (N)
cl, cm, cn Aerodynamic moment coefficients in x, y and z direction
α, β Vehicle angle of attack and sideslip angle (rad)
Ixx, Iyy, Izz, Ixz Vehicle moment of inertia (kgm2)
Ip Propulsion system moment of inertia (kgm2)
ωp Propeller rotation speed (rad/s)
δa, δe, δT , δr Aileron, elevator, throttle and rudder control input (rad)
xvii

Acronyms
UAV Unmanned aerial vehicle
COTS Commercial off-the-shelf
RC Radio-Controlled
IMU Inertia measurement unit
GPS Global positioning system
ENU Local east, north, up
eCos Embedded configurable operating system
PWM Pulse-width modulated
RPM Revolutions per minute
SIDPAC System identification program for aircraft
FFT Fast fourier transform
LFT Linear Fractional Transformation
USS Uncertain state-space
AOA Angle of attack
LTI Linear Time Invariant
SISO Single input single output
MIMO Multiple input multiple output
PID Proportional-integral-derivative
SIL Software-in-the-loop
PIL Processor-in-the-loop
AHRS Attitude and heading reference system
RTWT Real-time window target
UDP User datagram protocol
DOF Degrees of freedom
xviii

Chapter 1
Introduction
1.1 Overview
Unmanned Aerial Vehicles (UAVs) are widely used worldwide for a board range of civil and
military applications. There continues to be a growing demand for reliable and low cost
UAV systems. This is especially true for small-size, mini UAV systems (less than 2 meters
wing span) where majority of systems are still deployed as prototypes due to their lack
of reliability. Improvement in the modeling, testing and flight control for the small UAVs
would increase their reliability during autonomous flight.
The traditional approach used in manned aircraft and large UAV system synthesizing,
implementing and validating the flight control system to achieve desired objectives is time
consuming and resource intensive. Applying the same techniques to small UAVs is not
productive. To reduce cost and time to market, small UAV systems make use of low cost
commercial-off-the-shelf autopilots [1]. Most of these autopilots use classical Propotional-
integral-derivative (PID) controllers where ad-hoc methods are used to tune the controller
gains in flight. This methodology is time consuming and high risk. The flight test ap-
proach to tuning controller has limitations in performance optimality and robustness. To
increase the speed of the development cycle, simulation through flight test and improve
system reliability and robustness of the flight control system, it is important to develop
an integrated framework to the flight control design process with a set of design tools that
enables control engineer to rapidly synthesize, implement, analyze and validate a candidate
1

controller design using iterative development cycles.
Numerous researchers have made the case for an integrated framework in recent years
[2–7]. The central paradigm is a model-based development environment for the UAV where
different design tools and techniques can be formulated, deployed and applied. The different
processes in model-based flight control development (shown in Figure 1.1) are tightly-
coupled and the development process will severely hindered if each process is tackled as a
separate problem. Hence flight control design must be look at in the context of dynamic
modeling, control and model analysis, simulation, control design, real-time implementation,
software and hardware-in-the-loop simulation and flight testing.
Figure 1.1: Integrated framework for flight control development
1.2 Challenges in UAV Flight Control Synthesis and Valida-
tion
The task of flight control synthesis and validation involves multi-disciplinary fields that pose
challenges in research and development. Many of these challenges identified are the focus of
2

ongoing research. The ability to gain a comprehensive insight into the underlying principles
and problems will allow us to focus on the algorithmic steps and intricacies involved in the
problem. This allows us to build on past and recent research advancements to accelerate
our research progress.
1.2.1 High Fidelity Simulation Model
Development of accurate high fidelity simulation model to represent actual flight mechanics
requires an in depth understanding of the system dynamics. Three standard approaches
to flight dynamic simulation model development are analytical, wind-tunnel and flight test
technique. Each approach can be used to complement one another during different phase of
model development. A comprehensive model built using all the available complex system
behavior does not necessary provide a good model as this might have many redundant
parameters, making it too complicated for its intended purpose. A good simulation model
should have fidelity required within a specific tolerance with minimum number of param-
eters. The resulting model is simple, easy to construct, validate and use. Development
of these simple, accurate models requires a good understand of flight dynamics and ex-
perience in using adequate number of suitable parameters to model the system through
suitable experiments. This systematic approach is still quite lacking for small UAV system
development.
1.2.2 Uncertainty Modeling
Mathematical models are used to describe the behavior of complex physical system. These
models are only an approximation of the real system. Model uncertainty accounts for actual
system response using the model developed. Hence it is important to include uncertainty
during the model development to provide a confidence level as well as a bound on predicting
the actual system response. Uncertainty modeling is especially crucial in the model devel-
opment for small UAV since their aerodynamics data are less well understood than full-size
aircraft. In addition, small UAVs are generally more sensitive to wind gust disturbance
which are difficult to model. Low cost sensors used onboard result in significant sensor
data errors and measurement noise. These are a few of the practical reasons to incorporate
3

uncertainty modeling in the UAV model development.
Incorporating uncertainty modeling leads to the issue of deciding the best approach
for deriving and representing model uncertainty (stochastic or deterministic), its practical
implementation and its integration into the nonlinear and linear model development. There
is no standard approach in the representation for uncertainty modeling due to it being
problem dependent problem.
1.2.3 Model Validation
Model validation is a necessary step to gain confidence or reject a model based on the input
and output experiment data obtained from the system. It is never possible to validate a
model on the basis of a finite number of experiments. However, the model can be invalidated
by experimental data [8]. Hence model development and validation are closely coupled and
integrally related to experimental data.
The fundamental principle used in many model validation techniques is to compare
and evaluate the residue between simulated model data and experiment validation data.
Different model validation methods result in different non-unique validated model sets.
Also, the technique of model validation depends on the uncertainty modeling approach,
model and uncertainty assumptions, this dependency makes the task of model validation
even harder.
1.2.4 Performance Validation
The objective in flight control system development is to formulate control design specifi-
cations from system performance requirements with the end goal of achieving these per-
formance requirements at the end of development cycle. A validated UAV model for flight
control synthesis allows simple and straight forward techniques to validate closed-loop sys-
tem performance. The presence of model uncertainty resulted from actual physical system
approximation affects the robustness of designed controller performance as well as the
validation methodology. Therefore it is important to relate the interplay between model
uncertainty, model validation and control system performance robustness in closed-loop
performance validation, which is a similar problem faced in model validation.
4

1.3 Integrated Framework
An integrated framework to flight control synthesis and validation merges different design
and analysis tools with the linear and nonlinear simulation models that allows for an it-
erative controller laws design and validation environment. At the same time, the linear
and nonlinear models used for controller design and validation are being updated as part
of the development cycle. The parallel effort of redesigning and validating of the flight
control laws and the models are used for controller synthesis and validation facilitate rapid
controller design, analysis and implementation process with the latest updated models.
1.4 Research Outline: Objectives and Scope
1.4.1 Objective
The primary objectives of this thesis are to demonstrate and implement an integrated
framework for synthesis and validation of flight controllers using a small UAV testbed. It
combines theoretical design tools and experimental procedures.
1.4.2 Scope
The scope of the thesis is the development process of an integrated framework for syn-
thesis and validation of UAV flight controller using a small commercial off-the-shelf radio-
controlled airplane integrated with flight avionics system.
Nonlinear modeling of the UAV system is done using first principle theory in Mat-
lab/Simulink environment with experiments carried out for obtaining physical model pa-
rameters. In the flight dynamics modeling, flight test system identification process is con-
ducted to update and verify the lateral model developed used for flight control synthesis
and validation. Parametric uncertainties due to the modeling process are modeled into the
nonlinear simulation model developed. The uncertain nonlinear simulation model is further
linearized to uncertain linear model for the purpose of flight control synthesis and analysis.
Flight control synthesis is carried out to design lateral-directional axis roll angle con-
troller with the uncertain linear model to meet the design specifications. Both classical
5

and modern control design approach are used for the controller synthesis. The controllers
obtained are implemented on embedded flight computer system for controller testings.
Software and processor-in-the-loop testing environments are developed for the flight
control development testing. The developed framework provides an incremental and sys-
tematic approach of testing the synthesized controllers before putting the controllers on the
UAV for flight tests. With the developed integrated framework, the designed controller,
model and model uncertainty developed are validated.
1.5 Research Contribution
The contributions of this thesis are as follows:
• Systematic procedures for parametric uncertainty modeling in nonlinear simulation
models with realization of uncertain linear model.
• Approach for uncertain model simplification.
• Approach for nonlinear simulation model aerodynamic coefficients update using flight
test parameter identification results.
• Integrated framework and environment for development of flight control synthesis and
validation.
1.6 Organization of Dissertation
The disseration is organized as follows. The introduction, objective and scope of the re-
search is given in Chapter 1. Chapter 2 develops the nonlinear simulation model of the ex-
perimental UAV system. Chapter 3 covers the flight test system identification experiments,
system identification flight test procedures, parameter identification techniques and gives
the results of the identification used to update the nonlinear simulation model. Chapter
4 describes the approach to uncertainty modeling for inclusion into the nonlinear simu-
lation model. Procedures for performing linear uncertain model realization and analysis
are also discussed. In Chapter 5, flight control synthesis and controller implementation on
6

the embedded flight computer is presented. Chapter 6 provides model and flight control
performance validation for the UAV system using both simulation tools and flight testing
methods. The conclusion and future recommendations for the research are given in Chapter
7.
7

Fig
ure
1.2:
Ove
rvie
wof
diss
erta
tion
8

Chapter 2
Small UAV Nonlinear Simulation
Model
Aircraft fight dynamics models are used extensively for simulation analysis, flight control
law algorithms implementation and extraction of low-order model for flight control synthe-
sis. This has the benefits of lowering the cost and risk associated with design and operation
of the aircraft system. Modeling, simulation analysis and flight testing of full-size aircraft
are very well established and documented over the past few decades. However, limited
literature is available regarding the detail modeling, simulation and analysis of small UAV
systems [9]. It is expected that the use of high fidelity simulation model in small UAV sys-
tems development will bring similar benefits in lowering the cost and risk involved during
the system development cycle.
For a simulation model to be useful, it should be able to predict the actual system
response accurately. However, a mathematical model is just an approximation of the actual
physical system. Hence there will be uncertainty in predicting the actual system response
using the model developed. Therefore it is important to include model uncertainty in the
simulation model. Uncertainty modeling is even more crucial in small UAV modeling since
small UAV flight dynamics is less well understood than full-size aircraft.
This chapter describes the development of the nonlinear UAV simulation model from
first principle using forces and moments equations. The major difficulty faced in the model
development is in accurate determination of the model’s physical parameters. Experiments
9

conducted to obtain these physical parameters are covered. The nonlinear simulation model
developed in this chapter provides the basic foundation for the integrated framework ap-
proach.
2.1 UAV Platform
2.1.1 Physical Geometry
The aircraft chosen for the research is a commercial off-the-shelf (COTS) Radio-Controlled
(RC) plane UltraStick 25E (shown in Figure 2.1). The plane has a conventional horizontal
and vertical tail with rudder and elevator control surfaces. The aircraft uses a symmetrical
airfoil wing and has both aileron and flap control surfaces. All the control surfaces are
actuated by Hitec servos. The propulsion system is made up of a 600 watts E-Flite electric
outrunner motor driving an APC 12 x 6 propeller. A summary of important physical
parameters is provided in Table 2.1.
Figure 2.1: Research testbed: Ultra Stick 25E RC plane
10

Parameter Description Value and Units
A wing reference area 0.32 m2
b wing span 1.2 m
c wing chord 0.3 m
m gross take off weight 1.9 kg
Table 2.1: Summary of important aircraft geometry
2.1.2 Flight Avionics System
The RC plane is instrumented with a suite of flight avionics for the flight control develop-
ment research. Figure 2.2 shows the architecture of the flight avionics system and Table 2.2
gives a listing of the individual component in the avionics system. The IMU/GPS sensor
provides the following measurement data:
• Angular rates: p (deg/s), q (deg/s) and r (deg/s)
• Accelerations: ax (g), ay (g) and az (g)
• Magnetic fields: Hx (gauss), Hy (gauss) and Hz (gauss)
• Airspeed and barometric altitude: Vs (m/s) and h (m)
• GPS velocities (ENU format) and positions: ve (cm/s) , vn (cm/s), vu (cm/s) and
px (10−7deg), py (10−7deg), pz (m).
The flight computer runs the eCos (embedded configurable operating system) [10] real-time
operating system. Sensor data are acquired into the flight computer and attitude determi-
nation is done using a 7 states Kalman Filter [11]. At the same time, the flight computer
also executes flight control algorithms and outputs Pulse-Width Modulated (PWM) signals
to control the servo actuators and sends telemetry data information to the data modem and
datalogger through serial communication port for flight test data collection. Dual channels
datalogger is used to record both raw sensor data (at 50 Hz) and flight control data (at
20 Hz). The flight test data is also sent to ground control station for real-time health
11

monitoring during flight testing. A failsafe switch board is used as a safety precaution to
switch flight computer commands back to manual pilot commands if necessary.
Figure 2.2: Flight avionics system architecture layout
Component Module
Flight computer Phytec MPC 555 microcontroller [12]
IMU/GPS sensor Crossbow Micronav sensor [13]
Data Modem Maxstream 900 Mhz modem [14]
RC telemetry Spektrum DX-7 2.4 Ghz RC system [15]
Failsafe switch RxMux board [16]
Datalogger Antilog RS232 serial datalogger [17]
Table 2.2: Components in flight avionics system
12

2.2 Nonlinear Simulation Model
This section describes development of the nonlinear UAV flight dynamics model using
Matlab/Simulink environment. Simulink modeling of the UAV model is adapted from
Aerosonde UAV Simulink model provided by AeroSim Blockset from Unmanned Dynamics
[18]. The AeroSim Blockset is a Matlab/Simulink library block that provides standard
aircraft model components for rapid development of nonlinear 6-DOF aircraft dynamic
models. Beside aircraft dynamics model blocks, the blockset also provides environment
and earth models. Figure 2.3 shows a simplified layout of the nonlinear aircraft model
block diagram from AeroSim Blockset [19].
Figure 2.3: Simplified layout of Aerosim nonlinear 6-DOF aircraft model
Modification to the aerodynamics, propulsion and inertia Aerosonde UAV Simulink
blocks had been performed and experiments have to be carried out to get the required phys-
ical aircraft parameters. The equation of motion, earth and atmosphere Simulink blocks are
not modified since they are independent of the aircraft platform used. Actuator dynamics
are also modeled into the simulation model to account for the actuator characteristics.
2.2.1 Aerodynamic Model
The dynamic model of an aircraft is commonly described by a six degrees of freedom
equations which are derived from the X, Y and Z forces and L, M and N moment equations
13

[20]. Figure 2.4 shows the forces and moments description in the aircraft body axis.
Figure 2.4: Forces and moments in aircraft body axis
2.2.1.1 Force Equations
The summation of the forces in body x, y and z axis gives linear velocity state equations [20]:
u = rv − qw +qS
mCX − gsinθ +
T
m
v = pw − ru +qS
mCY − gcosθsinφ
w = qu− pv +qS
mCZ − gcosθcosφ
where u (m/s), v (m/s) and w (m/s) are the body axis linear velocities, p (rad/s), q
(rad/s) and r (rad/s) are the body axis angular rates, φ (rad), θ (rad) and ψ (rad) are
the body attitude angles and q (Pa) is the dynamic pressure. CX , CY and CZ are the
aerodynamic force coefficients and are given by the following relationships:
CX = CLsinα− CDcosα
CZ = −CDsinα− CLcosα
CY = CYββ + CYδr
δr +b
2Va(CYpp + CYrr) (2.1)
14

where α (rad) and β (rad) are angle of attack and sideslip angle of the aircraft in the wind
axis. The forces in the body x, y and z axis are given by:
X = qSCX
Y = qSCY
Z = qSCZ
The lift (CL) and drag (CD) coefficients are functions of the non-dimensional coefficients
given by:
CL = CL0 + CLαα + CLδeδe +
c
2Va(CLαα + CLqq)
CD = CD0 + CDδeδe + CDδr
δr +(CL − CLmin)
π.e.AR
In this case, small perturbation assumption is made and only linear terms are retained in
the lift and drag coefficients and higher order terms such as α2, α3 etc are neglected.
2.2.1.2 Moment Equations
Taking a moment about the aerodynamics center of the aircraft, the angular rate equations
are given by:
p− Ixz
Ixxr =
qSb
Ixxcl − Izz − Iyy
Ixxqr +
Ixz
Ixxqp (2.2)
q =qSc
Iyycm − Ixx − Izz
Iyypr − Ixz
Iyy(p2 − r2) +
Ip
Iyyωpr (2.3)
r − Ixz
Izzp =
qSb
Izzcn − Iyy − Ixx
Izzpq − Ixz
Izzqr − Ip
Izzωpq (2.4)
where ωp (rad/s) is the propeller rotation speed, Ixx, Iyy, Izz, Ixz and Ip are the moment
of inertia coefficients for the aircraft and propulsion system respectively in kgm2 and cl, cm
15

and cn are the non-dimensional moment coefficients. These coefficients are given by:
cl = clββ + clδaδa + clδr
δr +b
2Va(clpp + clrr) (2.5)
cm = cm0 + cmαα + cmδeδe +
c
2Va(cmαα + cmqq) (2.6)
cn = cnββ + cnδa
δa + cnδrδr +
b
2Va(cnpp + cnrr) (2.7)
The moments about the body x, y and z axis are given by:
L = qSbcl
M = qSbcm
N = qSbcn
2.2.1.3 Kinematic Equations
The kinematics of the aircraft rotation motion relating the body angular rates p, q and r,
Euler angles φ, θ and ψ and aerodynamics angles α, β and γ are given by:
φ = p + tanθ(qsinφ + rcosφ)
θ = qcosφ− rsinφ
ψ =qsinφ + rcosφ
cosθ
θ = γ + αcosφ + βsinφ
2.2.1.4 Determination of Aerodynamic Coefficients
The list of aerodynamic coefficients required to model the Ultrastick UAV using the mod-
ified AeroSim Aerosonde UAV nonlinear simulation model is summarized in Table 2.3.
These coefficients can be obtained from wind tunnel testing [21], numerical computational
method [22] or flight test parameter identification. The approach used to determine these
aerodynamic coefficients is to first approximate these coefficient values using simulator
parameters tuning approach with some of the initial coefficient values set to values from
relevant work done by [23]. Subsequently, these coefficient values are refined using flight
test parameter identification.
16

Lift Force Drag Force Side Force Roll moment Pitch moment Yaw moment
CL0 CD0 CYβclβ cm0 cnβ
CLα CDδeCYδr
clδrcmα cnδr
CLα CDδrCYp clp cmδe
cnp
CLq CYr clr cmα cnr
CLmin clδacmq
Table 2.3: Aerodynamic coefficients required for Ultrastick UAV modeling
Simulator Parameter Tuning
In simulator parameter tuning, estimate of aerodynamic coefficients are obtained using
simulator flying by RC pilots using an iterative tuning process. Figure 2.5 shows the details
of the tuning process. The joystick control box used in the simulator flying is the same
radio control box used for actual flight test. Control signals are input to the nonlinear
Simulink model that contains the initial guess aerodynamics coefficients from [23]. The
outputs from the simulation model are the state responses of the vehicle which are used to
drive FlightGear [24] simulator. The FlightGear simulator provides a visualization for the
aircraft motions. Figure 2.6 shows the setup of simulator parameter tuning experiment.
Two RC pilots who have been flying the actual UAVs were tasked to fly with the
simulator setup using different flight maneuvers. Based on their flight handling experiences
with the actual UAV, the aerodynamic coefficients in the simulation model were tuned
iteratively until they felt that the simulator model had similar handling qualities as the
actual UAV flight. Appendix Table A.1 contains the aerodynamic coefficients that were
obtained from the simulator tuning. These coefficients will be used as initial estimates for
flight test parameter identification.
2.2.2 Inertia Model
The inertia model contains physical geometric information of the aircraft mass, center of
gravity and moment of inertia coefficients. The aircraft moment of inertia is described by
17

Figure 2.5: Simulator parameter tuning process
Figure 2.6: Setup for simulator parameter tuning
the moment of inertia matrix I:
I =
Ixx −Ixy −Ixz
−Iyx Iyy −Iyz
−Izx −Izy Izz
18

The Ultrastick UAV is assumed to be symmetrical about the xz plane. This simplifies the
inertia matrix with Ixy = Iyx = Ixz = Izy = 0. Hence the inertia matrix becomes:
I =
Ixx 0 −Ixz
0 Iyy 0
−Izx 0 Izz
Beside the aircraft moment of inertia matrix, propulsion system moment of inertia coef-
ficient is required. These moment of inertia coefficients are determined using pendulum
method described in Appendix A.2. The nominal, lower and upper bound values for the
moment of inertia of the aircraft and the propulsion system obtained from the experiments
are given in Appendix Table A.2.
2.2.3 Propulsion Model
The propulsion system models the interaction between electric motor and propeller dynam-
ics. The rotation speed of propeller, ωp, is used to describe the dynamics of the propulsion
system. Small UAVs (with propeller propulsion system) flight dynamics are sensitive to
the propulsion system dynamics unlike the full-size aircraft. This is due to the large torque
from the propulsion system coupling with the aircraft rigid body dynamics since the small
UAV system is being propelled by a larger propeller relative to its aircraft size. Therefore
the moment generated by the propeller is added to the total moment of the aircraft in
the simulation model. Applying the conservation of angular momentum, the propulsion
dynamics is given by:
(Imotor + Ipropeller)ωp = Tmotor − Tpropeller
where:
Imotor = moment of inertia of rotating motor body (kgm2)
Ipropeller = moment of inertia of propeller with spinner hub attachment (kgm2)
Tmotor = Output torque at motor shaft (Nm)
Tpropeller = Torque generated by propeller (Nm)
19

The moment of inertia for rotating motor body, Imotor, is included because the motor
used is an outrunner motor in which the major part of the motor mass is rotating. This
has a significant contribution to the total moment of inertia for the propulsion system, Ip
(Ip = Imotor + Ipropeller).
2.2.3.1 Propulsion Motor
The propulsion motor used is E-flite Power 25 BL Outrunner Motor [25]. The motor
performance data is obtained from a commercial software, MotorCalc [26], since it is not
available from the manufacturer. Figure 2.7 shows the plot for the relationship between
throttle stick input (δT ) and output power at the motor shaft (Po).
0 0.2 0.4 0.6 0.8 10
50
100
150
200
250
300
350
Throttle input, δT [0 to 1]
Mot
or s
haft
pow
er o
utpu
t, P
o (w
atts
)
Motor power output
Figure 2.7: Motor power output
The motor shaft torque, Tmotor (Nm), generated from the motor shaft output power Po
is given by:
Tmotor =Po
ωp
20

2.2.3.2 Propeller Characteristics
The thrust to propel the aircraft forward is generated by the rotating propeller using the
torque generated at motor output shaft. The propeller rotation speed depends on both the
input torque available and the speed of air flowing into the propeller disk. The propeller
performance is generally characterized by 3 parameters [27]:
• Advance ratio, J , given by:
J =πVa
ωpR
• Coefficient of Thrust, CT , given by
CT =Fpπ
2
4ρR4ωp2
• Coefficient of Power, CP , given by
CP =Tpπ
3
4ρR5ωp2
where R (m) is the diameter of the propeller, Fp (N) is the propeller thrust, Tp (Nm) is
the propeller torque and ρ (kgm−3) is the air density.
The performance data of the propeller used is not available from manufacturer. There-
fore, approximation is made on the propeller performance data based on experimental result
published by [28] on an APC 12 x 8 propeller. In [28], the propulsion system thrust and
torque generated were measured using a force-moment sensor in a wind tunnel with dif-
ferent propeller rotation speed and inflow airspeed. The coefficient of thrust and power
obtained were plotted against advance ratio as shown in Figure 2.8. These data (Appendix
Table A.3) are used as lookup tables in the nonlinear simulation model. This provides
the propeller thrust (Fp) and moment (Tp) at different advance ratios condition during the
simulation.
2.2.3.3 Propulsion System Verification
The propulsion system model developed and implemented in the simulation model is verified
using MotorCalc software [26]. The software program allows the specific motor, speed
controller and propeller used in the Ultrastick UAV to be selected from the database so
21

0 0.1 0.2 0.3 0.4 0.5 0.6 0.70.01
0.02
0.03
0.04
0.05
0.06
0.07
0.08
0.09
0.1
0.11
Advance ratio J
Coe
ffici
ent o
f thr
ust,
CT
Propeller coefficient of thrust
(a) Coefficient of thrust
0 0.1 0.2 0.3 0.4 0.5 0.6 0.70.025
0.03
0.035
0.04
0.045
0.05
0.055
Advance ratio J
Coe
ffici
ent o
f pow
er, C
P
Propeller coefficient of power
(b) Coefficient of power
Figure 2.8: Propeller performance for APC 12 x 8 propeller
that static and in-flight aircraft performance can be computed. A static flight condition,
with zero airspeed, is chosen for the verification. In the verification, the throttle input
to the simulation model and MotorCalc software are incrementally increased from 0 to 1
with a 0.1 step size. The propeller thrust and RPM obtained from the two system are
compared. Figure 2.9 shows the comparison plots of propeller thrust and RPM. The plots
show that the implemented propulsion system simulation model output responses have a
close matching with the MotorCalc outputs. This verifies the propulsion system simulation
model developed and the data used in our model implementation are realistic since it is
able to match the results obtained from the commercial software.
2.2.4 Actuator Model
The UAV control surfaces are driven by Hitec S3108 micro servos using Pulse-Width Mod-
ulation (PWM) signal operating at 45 Hz. The servo rotation rate is 500 deg/s at no load
condition. The time delay for the servo actuator dynamics is approximated using a single
period of PWM signal operating at 45 Hz frequency. This gives a time delay of 22 ms for the
actuator delay. The actuators rotation angle saturation limits are limited to the maximum
mechanical deflection angles of the control surfaces. These limits, given in Appendix Table
A.4, are measured from the Ultrastick UAV.
22

0 0.2 0.4 0.6 0.8 10
2
4
6
8
10
12
14
16
18
throttle [0 to 1]
Pro
pelle
r T
hrus
t (N
)
Propeller Thrust
MotorCalcSimulation model
(a) Propeller thrust
0 0.2 0.4 0.6 0.8 10
1000
2000
3000
4000
5000
6000
7000
8000
9000
throttle [0 to 1]
Pro
pelle
r R
PM
Propeller RPM
MotorCalcSimulation model
(b) Propeller RPM
Figure 2.9: Propulsion system verification at static flight condition
23

Chapter 3
Flight Test System Identification
Flight test system identification is an important process used to develop, improve model
fidelity and validate simulation models. The scope involved includes model parameters
determination, validation and design of suitable identification experiments for collecting
relevant inputs and outputs data. Aircraft parameters identification is mainly divided into
two major approaches, time domain and frequency domain identification method. Both
these two parameter identification methods have been widely used in many aircraft platform
development programs [29–32]. The time domain parameter estimation method is used
in this research since it is physically more intuitive and straight forward as the aircraft
dynamics are mostly represented using time domain state-space models.
Flight test parameter identification is used to update aerodynamics coefficients in the
nonlinear simulation model obtained from the simulator parameter tuning in Chapter 2.
This chapter describes the approach and procedures used to update the aerodynamic coef-
ficients in the nonlinear simulation model based on flight test data. This involves stability
and control derivative parameters estimation of state-space model and converting these
derivatives to dimensionless form. Figure 3.1 outlines the procedures involved.
3.1 Model Structure for Parameters Identification
The choice of an appropriate model structure is crucial for successful system identifica-
tion. This must be made based on the understanding of system identification procedures,
24

Figure 3.1: Procedures involved to update aerodynamic coefficients
knowledge of physical system to be identified and the intended use of the model [33]. The
approach taken in this thesis is not to search for the “best” model structure (which is sub-
jective) for the system identification, but to use a model structure that is suitable for the
intended application with an understanding of the advantages and disadvantages associated
with the selected model structure.
The model structure selected is a linear state-space model that is parameterized by
physically meaningful stability and control derivatives. The reason for using this model
structure is that the parameters in the state-space model are related to the nonlinear
simulation model aerodynamic coefficients. Model parameter estimation from flight test
data provides an update to the aerodynamic coefficients in the nonlinear simulation model
used in the integrated framework. Hence the selection of the fixed model structure is used
for the system identification. Furthermore, using a linear model structure in the system
identification simplifies the identification problem as compared to using a nonlinear model
structure even though the aerodynamic coefficients can be obtained directly with nonlinear
model identification. Identifiability of the aerodynamic coefficients is closely related to the
observability of each aerodynamic coefficient from the flight test data collected. Therefore,
using a nonlinear model for system identification would require a more unique flight test
input excitations and flight maneuvers which can be difficult for the RC pilots to execute.
25

3.1.1 Linear Decoupled Model
It is a common practice to decouple the linearized model into longitudinal and lateral-
directional modes to simplify the problem in most of the flight dynamics and control anal-
ysis. The assumption made for decoupling the linearized model is that the cross-coupling
effect between the two modes is negligible. This assumption is made for the Ultrastick UAV
platform for the following reasons:
• It is designed with conventional aileron, rudder and elevator control surfaces that do
not give significant cross-coupling control effects between the lateral-directional and
longitudinal modes.
• The aircraft is symmetrical about the xz plane in which the inertia cross-coupling (in
xy and xz axes) resulting to cross-coupling effects between the lateral-directional and
longitudinal modes is minimum.
• Flight test data collected from open loop UAV flights with individual control sur-
face excitations shows no significant coupling between these longitudinal and lateral-
directional modes.
To extract a linear decoupled model from the nonlinear simulation model, the nonlinear
model is first linearized about trim operating point. This gives a linear model that contains
the longitudinal, lateral-directional and other coupling modes. Next, the linearized model
is decoupled into longitudinal and lateral-directional modes by extracting the states that
are relevant in each of the modes. Figure 3.2 shows the procedures for deriving linear
decoupled models from the nonlinear simulation model.
3.1.1.1 Linearization of Nonlinear Model
Linear models of the Ultrastick UAV are obtained through numerical linearization of the
nonlinear simulation model at trim operating point. The trim operating point is obtained
from trimming the aircraft at a desired flight operating envelop. Table 3.1 gives the desired
flight operating envelope for the UAV. The flight operating envelope is chosen based on the
open loop flight test data with the Ultrastick UAV flying in a cruise flight condition. The
26

Figure 3.2: Procedures for deriving linear decoupled models
trim operating point obtained from trimming at desired flight operating envelope is given
in Appendix Table B.1. The linearized state-space model obtained from the numerical
linearization is given by:
xf = Afxf + Bfuf
yf = Cfxf + Dfuf (3.1)
xf is the state vector given by [u v w φ θ ψ p q r h ω]T where (u, v, w) are the body
axis velocities in (m/s), (φ, θ, ψ) are the Euler angles in (rad), (p, q, r) are body axis angular
rates in (rad/s), h is the altitude in (m) and ωp is the propeller rotation speed in (rad/s).
uf is the control input vector consists of aileron, elevator, throttle and rudder control inputs
27

in (rad) given by [δe δa δT δr]T . The output vector yf is [Va β α φ θ ψ h]T where Va
is the airspeed in (m/s), β is the sideslip angle in (rad) and α is angle of attack in (rad).
Airspeed (m/s) Altitude (m) Throttle (%)
16 ∼ 18 90 ∼ 110 45 ∼ 60
Table 3.1: Desired flight operating envelope
The details of Af , Bf , Cf and Df matrices obtained are given in Appendix B.2. The
output variables Va, β and α are related to the body axis velocity u, v and w with the
following relationships:
α = tan−1(w
u
)(3.2)
β = sin−1
(v
Va
)(3.3)
Va =√
u2 + v2 + w2 (3.4)
Doublet signals are applied to the elevator and rudder control input (Figure 3.3(f))
to the nonlinear simulation model and the linearized model obtained. This is to compare
the matching of the linear model obtained with the nonlinear simulation model. Figure 3.3
shows the time history comparisons of the airspeed, AOA, roll angle, pitch angle and sideslip
angle output responses between the linear model obtained and the nonlinear simulation
model. All the output responses from the linear and nonlinear model have a good match.
This shows that the linear model obtained represents the nonlinear simulation model well
at this given trim operating point.
3.1.1.2 Decoupling of Linearized Model
The longitudinal and lateral model of the UAV are obtained by decoupling the full linear
model in Equation 3.1 through extracting control and stability derivatives from the full
linear model that are relevant to each of the mode. The longitudinal model comprises
of the body axis x and z direction velocities (u, w), pitch angular rate q, pitch angle θ,
28

0 5 10 1515
15.5
16
16.5
17
17.5
18
Va (
m/s
)
Airspeed
time (s)
NonlinearLinear
(a) Airspeed
0 5 10 150
0.5
1
1.5
2
2.5
3
α (d
eg)
Angle of attack
time (s)
NonlinearLinear
(b) Angle of attack
0 5 10 15−30
−25
−20
−15
−10
−5
0
5
10
φ (d
eg)
Roll angle
time (s)
NonlinearLinear
(c) Roll angle
0 5 10 15−8
−6
−4
−2
0
2
4
6
8
10
θ (d
eg)
Pitch angle
time (s)
NonlinearLinear
(d) Pitch angle
0 5 10 15−2.5
−2
−1.5
−1
−0.5
0
0.5
1
β (d
eg)
Sideslip angle
time (s)
NonlinearLinear
(e) Sideslip angle
0 5 10 15−0.2
−0.15
−0.1
−0.05
0
0.05
0.1
0.15
0.2
δ a , δ e [−
1 to
1]
Control input
time (s)
δa
δe
(f) Control input
Figure 3.3: Comparison of linear and nonlinear model output responses
29

altitude h and propeller angular rotation ωp state. Control inputs for the longitudinal
model are elevator (δe) and throttle (δT ) control. The measurement output variables for
the longitudinal model are airspeed Va, angle of attack α, pitch rate q, pitch angle θ and
altitude h. Equation 3.5 gives the state-space description for the longitudinal model.
xlon = Alonxlon + Blonulon
ylon = Clonxlon + Dlonulon (3.5)
where
xlon = [ u w q θ h ω ]T
ulon = [ δe δT ]T
ylon = [ Va α q θ h ]T
The lateral model comprises of the body axis y direction velocity v, roll and yaw angular
rate (p, r) and roll and yaw angle (φ, ψ). Control inputs for the lateral model are aileron
(δa) and rudder (δr) control. The measurement output variables for the lateral model are
sideslip angle β, roll and yaw angular rate (p, r), roll and yaw angle (φ, ψ). The lateral
state-space model is given in Equation 3.6. The details of the matrices in the longitudinal
and lateral model are given in Appendix B.3.
xlat = Alatxlat + Blatulat
ylat = Clatxlat + Dlatulat (3.6)
where
xlat = [ v p r φ ψ ]T
ulat = [ δa δr ]T
ylat = [ β p r φ ψ ]T
Elevator control input (δe in Figure 3.4(f)) is applied to the linear decoupled longitudinal
model in Equation 3.5 to obtain airspeed (Va), angle of attack (α) and pitch angle (θ) output
responses while aileron control input (δa in Figure 3.4(f)) is applied to the linear decoupled
lateral model in Equation 3.6 to obtain roll (φ) and yaw angle (ψ) output responses. The
collective linear decoupled model output responses (Va, α, θ, φ, ψ) from the longitudinal
30

and lateral models are compared with the full linear model in Equation 3.1 with the same
elevator and aileron control input in Figure 3.4(f). Figure 3.4 shows the comparison plots
between the full linear model and the decoupled models. The plots show that the decoupled
linear models (longitudinal and lateral model) output responses match the full linear model
well. This shows that the full linear model can be decoupled into longitudinal and lateral
model and still provide similar output responses without degradation due to decoupling.
This validates the assumption that the cross-coupling effect between the longitudinal and
lateral-directional modes is negligible and the full linear model can be decoupled into these
two modes.
31

0 2 4 6 8 1013
14
15
16
17
18
19
20
time (s)
Va (
m/s
)
Airspeed
Full linear modelDecoupled linear model
(a) Airspeed
0 2 4 6 8 10−6
−4
−2
0
2
4
6
8
time (s)
α (d
eg)
Angle of attack
Full linear modelDecoupled linear model
(b) Angle of attack
0 2 4 6 8 10−60
−50
−40
−30
−20
−10
0
10
time (s)
φ (d
eg)
Roll angle
Full linear modelDecoupled linear model
(c) Roll angle
0 2 4 6 8 10−10
−5
0
5
10
15
20
25
30
35
time (s)
θ (d
eg)
Pitch angle
Full linear modelDecoupled linear model
(d) Pitch angle
0 2 4 6 8 10−20
−15
−10
−5
0
5
time (s)
ψ (
deg)
Yaw angle
Full linear modelDecoupled linear model
(e) Yaw angle
0 2 4 6 8 10−1
−0.8
−0.6
−0.4
−0.2
0
0.2
0.4
0.6
0.8
1
time (s)
δ e, δa [−
1 to
1]
Control input
δe
δa
(f) Control input
Figure 3.4: Comparison of full linear and decoupled linear model output responses
32
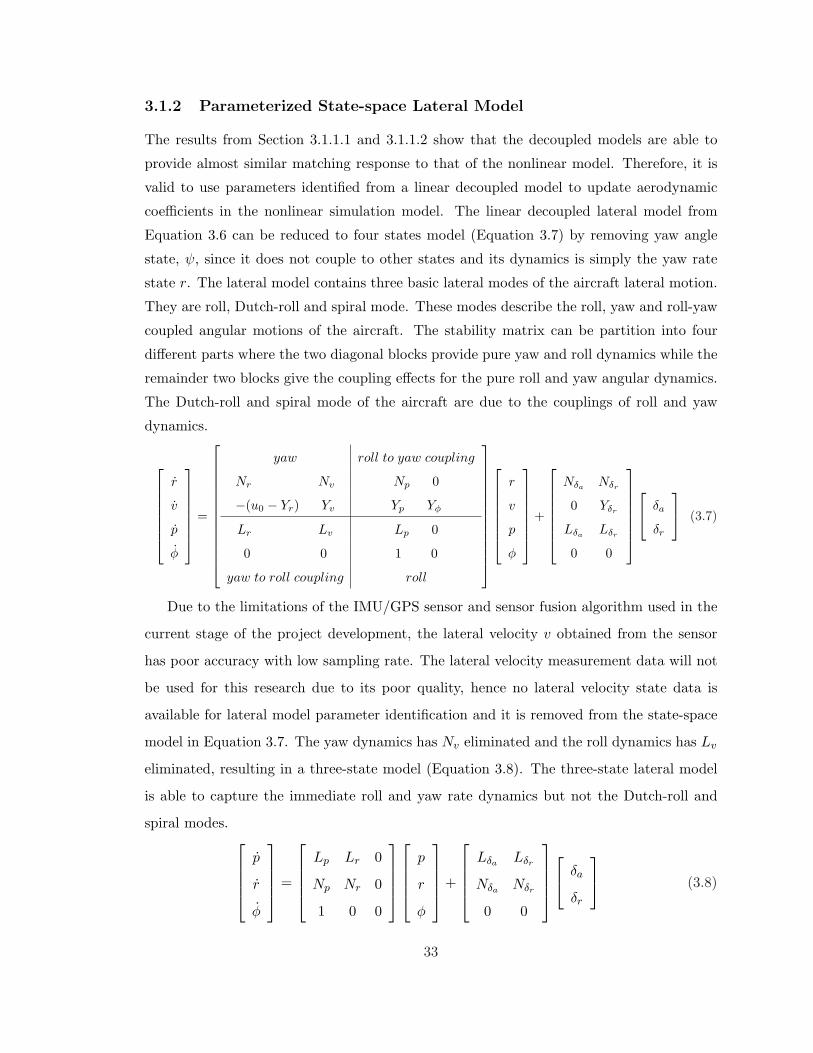
3.1.2 Parameterized State-space Lateral Model
The results from Section 3.1.1.1 and 3.1.1.2 show that the decoupled models are able to
provide almost similar matching response to that of the nonlinear model. Therefore, it is
valid to use parameters identified from a linear decoupled model to update aerodynamic
coefficients in the nonlinear simulation model. The linear decoupled lateral model from
Equation 3.6 can be reduced to four states model (Equation 3.7) by removing yaw angle
state, ψ, since it does not couple to other states and its dynamics is simply the yaw rate
state r. The lateral model contains three basic lateral modes of the aircraft lateral motion.
They are roll, Dutch-roll and spiral mode. These modes describe the roll, yaw and roll-yaw
coupled angular motions of the aircraft. The stability matrix can be partition into four
different parts where the two diagonal blocks provide pure yaw and roll dynamics while the
remainder two blocks give the coupling effects for the pure roll and yaw angular dynamics.
The Dutch-roll and spiral mode of the aircraft are due to the couplings of roll and yaw
dynamics.
r
v
p
φ
=
yaw roll to yaw coupling
Nr Nv Np 0
−(u0 − Yr) Yv Yp Yφ
Lr Lv Lp 0
0 0 1 0
yaw to roll coupling roll
r
v
p
φ
+
Nδa Nδr
0 Yδr
Lδa Lδr
0 0
δa
δr
(3.7)
Due to the limitations of the IMU/GPS sensor and sensor fusion algorithm used in the
current stage of the project development, the lateral velocity v obtained from the sensor
has poor accuracy with low sampling rate. The lateral velocity measurement data will not
be used for this research due to its poor quality, hence no lateral velocity state data is
available for lateral model parameter identification and it is removed from the state-space
model in Equation 3.7. The yaw dynamics has Nv eliminated and the roll dynamics has Lv
eliminated, resulting in a three-state model (Equation 3.8). The three-state lateral model
is able to capture the immediate roll and yaw rate dynamics but not the Dutch-roll and
spiral modes.
p
r
φ
=
Lp Lr 0
Np Nr 0
1 0 0
p
r
φ
+
Lδa Lδr
Nδa Nδr
0 0
δa
δr
(3.8)
33

For flight test parameter identification, the three-state model is further reduced to a
two-state model since the roll angle dynamics φ is simply equal to the roll rate p and is
eliminated from the three-state model. The final form of the parameterized state-space
model used for parameter identification is given by:
p
r
=
Lp Lr
Np Nr
p
r
+
Lδa Lδr
Nδa Nδr
δa
δr
(3.9)
Using a two-state lateral model for parameter identification has its drawbacks. The effect
on the two-state lateral model fidelity will be addressed and subsequently, its impact on
aerodynamic coefficients updating will be analyzed.
3.1.2.1 Limitations of Two State Lateral Model Structure
The plots in Figure 3.5 show the open loop experimental flight test responses of the Ultra-
stick UAV with separate doublet signal excitation applied to the aileron and rudder control
inputs at trim flight condition. The aircraft has a primary roll rate motion (roll mode) and
a small yaw rate coupled motion with aileron doublet input (Figure 3.5(a)). The coupled
yaw rate is in the opposite direction of the roll motion, which is commonly known as adverse
yaw rate effect. The aircraft shows primary yaw rate motion first and subsequently, a large
roll and yaw rate oscillations are observed with rudder control input (Figure 3.5(b)), even
though there is no aileron control input applied. This is due to aircraft sideslipping with
the rudder control input. The whole sequence of oscillations is Dutch-roll motion, which
corresponds to coupled motion between the roll and yaw rate. In summary,
• The two-state model is able to capture the dynamics (roll mode and adverse yaw
rate) due to aileron control input. Hence, good parameter estimates, Lp, Lδa and
Nδa , should be obtained with aileron perturbation input.
• The two-state model can only capture the primary yaw rate response and not the
complete Dutch-roll mode response with rudder control input. This will result in
poor parameter estimates of Lδr , Lδr , Lr and Np which are related to the rudder
control input coupling mode. Parameter estimates for Nr and Nδr should be accurate
since they are primary associated with yaw motion.
34

• To be able to capture all the three lateral modes, the lateral velocity state v has to be
included in the state-space model. This is the limitation for the proposed two-state
lateral model structure.
3.2 Design of Experiment
The task of collecting “good data” is crucial to parameter identification. The term “good
data” implies that the data collected contains information on the aircraft dynamics within
the operating range of interest. Thus the parameter identification can extract accurate
parameter estimates. Therefore, it is important to design and conduct appropriate flight
test experiments to collect data for parameter identification. The design of experiment
consists of two different aspects which are associated with flight tests, input signal design
and data acquisition.
3.2.1 Flight Tests
The objective of flight tests is to identify parameters in the reduced lateral model in Equa-
tion 3.9 at a trim, straight and leveled flight condition operating under cruise flight condition
given in Table 3.1. The parameters to identify consist of roll and yaw rate stability deriva-
tives and aileron and rudder control derivatives. To identify these parameters, aileron and
rudder control inputs have to be applied to excite the lateral dynamics. Based on knowledge
of aircraft flight dynamics, an aileron control input will result in bank-to-bank roll motion
while rudder control input will result in Dutch-roll motion. An aileron or rudder control
input will cause the aircraft to roll. However, the aileron control input will produce a larger
roll rate response when compared to a rudder control input. The aileron control and rudder
control inputs are applied in a separate time window during the flight maneuvers to capture
the different dynamics produced by these two lateral control inputs.
3.2.2 Input Signal Design
The control input signals for parameter identification have to be designed to excite the
aircraft dynamics in the frequency range of interest. In addition, practical constraints have
35

(a) Aileron control input
(b) Rudder control input
Figure 3.5: Open-loop experimental flight test responses
36

to be imposed on the feasibility of the excitation signals for flight testing. In the open-
loop identification experiment, control input excitations are executed by RC pilot using the
RC joystick box from the ground within visual range from the aircraft. This imposed a
constraint on the type and frequency of control input signal that can be generated. The
input signal design described is not based on an optimal input design approach such as
in [34] but rather based on practical flight test constraints.
The doublet excitation signal (Figure 3.6(a)) has been widely used in aircraft system
identification due to its simplicity in design and its ease of execution. It is a symmetrical
signal pulse obtained by applying control input stick abruptly in each of the opposite
direction and holding fixed for a period of 4t and returning back to neutral stick position.
The design variable for the doublet input signal design is the period 4t. The period
is selected such that the dominant frequency of the input signal is close to the frequency
range of interest (ωm) for the aircraft dynamics to be excited. This is approximated by [31]:
4t =2.3ωm
(3.10)
The amplitude of the doublet input is selected such that the aircraft dynamic response is
large enough to provide good signal-to-noise response data to capture the flight dynamics
but not too large for the aircraft to get out of its operating regime of interest in which the
parameters identified are assumed to be constant.
(a) Doublet control input (b) 3-2-1-1 control input
Figure 3.6: Control input signals for parameter identification
A multistep 3-2-1-1 signal is used (Figure 3.6(b)) to increase the frequency range of
37

input signal excitation. The 3-2-1-1 input is similar to doublet signal except that it has two
more pulses of different widths. The 3, 2 and 1 represent the ratio of period 4t used in the
multistep signal where the 3 and 1 signal give the upper and lower frequency bounds for the
range of input frequencies excitation. The advantage of using 3-2-1-1 signal is it provides a
richer frequency excitation signal than the doublet signal. However, this requires a longer
flight maneuver time which can be a constraint during flight test execution.
3.2.3 Data Acquisition System
The data acquisition system measures and records sensor measurement time history data
for parameter identification. Figure 3.7 shows the schematic layout of the data acquisition
system. The IMU/GPS sensor data (refer to Section 2.1.2) is sampled at 50 Hz. The
control input signals acquired from the RC receiver to control the servo actuators are also
sampled at 50 Hz. The data are recorded on first channel of the dual channels datalogger.
The IMU/GPS sensor does not output attitude angles (φ, θ and ψ) data, hence the flight
computer is used to perform real-time attitude determination. The attitude angles com-
puted are datalogged on second channel of the datalogger at 20 Hz. The attitude angles are
recorded at a lower sampling rate due to the limitation of the flight computer in outputting
the data through the second serial port at a high data rate. Important flight condition data
such as airspeed and altitude information are sent in real-time to the ground monitoring
station through wireless data modem during flight test. This provides real-time informa-
tion for monitoring the flight test to ensure that it is conducted at the required operating
condition.
The sampling of measurement data at 50 Hz imposed a limit on the frequency range
for parameter identification without falling into aliasing problem where higher frequencies
signal distort the lower frequencies data. From Nyquist-Shannon sampling theorem, aliasing
can be avoided by limiting the frequency range to be below the Nyquist frequency, which
is half of the sampling frequency. The IMU/GPS sensor limits the maximum data output
rate to 50 Hz. The Nyquist frequency provides a theoretical maximum frequency without
aliasing problem. For good engineering practice, a lower limit on the useful measured data
frequency range is adopted. The limit is set to be 1/4 of the sampling frequency of 12.5
38

Hz.
Figure 3.7: Data acquisition system for open-loop parameter identification
39

3.3 Flight Test Execution
Open-loop parameter identification flight tests are executed with an RC pilot. First, the
aircraft is flown to the required trim operating condition (in Table 3.1). Before the start
of each maneuver for a given trim flight condition, a 2 to 3 seconds steady flight is main-
tained before executing the required control inputs excitation for the maneuver. After the
completion of control inputs execution, sufficient time is given for the aircraft to response
so that the natural dynamics of aircraft can be captured by the sensor. The procedures for
the open-loop parameter identification flight testing is summarized in Figure 3.8.
Figure 3.8: Flight test procedures for open-loop parameter identification
In bank-to-bank roll maneuver, a doublet/3-2-1-1 control input signal is applied to the
aileron control to give an approximate ± 10 degrees variation in roll angle from the trim
position. During the maneuver, the RC pilot has to maintain the longitudinal trim of
the aircraft using the throttle and elevator control inputs. For the Dutch roll maneuver,
doublet/3-2-1-1 signal is applied to the rudder control stick to give an approximate ± 15
degrees variation in heading angle from the trim position while the longitudinal trim is
maintained using throttle and elevator control inputs. Each flight maneuver is repeated for
at least 4 times to collect sufficient data for parameter identification and validation.
The main difficulty facing the RC pilot executing the control inputs excitation is to
maintain longitudinal trim of the aircraft during the maneuvers. Timing the inputs precisely
while commanding roll and yaw angle to the required perturbation angles from the trim
position at the same time using only visual contact on the small aircraft can be challenging.
40

3.4 Parameter Identification Technique
The method used for parameter identification is output error method. This method itera-
tively adjusts the parameter estimates in order to minimize the difference between measured
flight test data and output response of the estimated model in each of the iteration. Since
its introduction in 1960s, output error method is the most widely applied time-domain
flight test parameter estimation method [31]. In recent years, maximum likelihood param-
eter estimation method has been one of the most popular methods used for minimization
of residual error. The reason for its popularity is due to its desirable statistical properties
such as asymptotically unbiased and consistent estimates. This is very useful for flight test
parameter identification since flight test data contains measurement errors [35].
The maximum likelihood parameter estimation method finds the best parameter es-
timate for the model by maximizing a likelihood function. The likelihood function for a
sequence of measurement ZN = [z1 z2 : : : zn]T with unknown parameter vector x is given
by equation:
L(Z|x) =1
[(2π)n|R|]0.5exp
{−1
2[zi − hi(x)]T R−1[zi − hi(x)]
}(3.11)
The likelihood function represents the probability density function of the measured variable
ZN and not x parameter. The main objective is to maximize L(Z|x) with the selection of
x parameter. Maximization of the likelihood function to obtain the maximum likelihood
estimate leads to a minimization of a weighted least-square function on the residual given
by:
f(x) =12
N∑
i=1
[zi − hi(x)]T R−1[zi − hi(x)] (3.12)
Details of the derivations are not given but can be found in [31, 32, 35]. This leads to
a nonlinear optimization problem due to the nonlinear connection between the parameter
estimates and model outputs. Figure 3.9 shows the schematic of the maximum likelihood
parameter identification.
The software toolbox SIDPAC (System IDentification Programs for AirCraft) devel-
oped in [32] is used for the maximum likelihood parameter identification of the lateral UAV
model. In the problem formulation, the assumption of no process noise is made. Since
41

process noise is neglected, the state can be computed deterministically by direct numerical
integration. Hence it is important to perform flight tests on days with calm air so that the
process noise is negligible.
Figure 3.9: Schematic for output error parameter identification
3.4.1 Parameter Identification Setup
The maximum likelihood parameter estimation is done using SIDPAC Matlab script file.
Figure 3.10 shows the flow diagram of SIDPAC parameter estimation process for the
parameter identification setup. The details of the estimation process and setup are as
follows:
• The parameterized state-space model in Equation 3.9 provides the model structure
with unknown parameters to be identified.
• The initial guess of the parameter estimates have to be provided. These values can-
not be arbitrary since output error maximum likelihood method is sensitive to initial
guess value. Using initial guess values that are far from the minimum optimization
cost function value will result in a longer iteration cycle time for convergence. The
initial guess values used are from the result obtained from simulator parameter tun-
42

ing in Section 2.2.1.4. They provide a good initial guess values for the parameter
identification.
• Convergence criteria have to be provided as pass/fail criteria to determine if the
parameter estimates have converged to give a solution that maximized the likelihood
function. The convergence criteria are:
1. Negligible change of cost of likelihood function
2. Negligible change of parameter estimate value
3. Negligible change of parameter estimate covariance value
4. Absolute value of the cost gradient
Once the convergence criteria have been satisfied (optimization has converged to a
solution), this will give the converged parameter estimates and covariance solution.
• A modified Newton-Raphson method performs the optimization of likelihood function
using both the residual of the difference between flight data and model output response
and the sensitivity of the output response to the change in parameter estimates.
• Numerical integration (Runge-Kutta method) and partial derivative (central finite
difference method) approaches are used to compute the output estimates and sensi-
tivities. The initial condition used for parameter identification is the first value of the
flight data time history.
3.4.2 Procedure
Parameter estimation of the lateral model is performed in three steps based on the under-
standing of the lateral mode dynamics and the two-state lateral model structure limitations
discussed in Section 3.1.2. The 3 steps are:
• Step 1: Identification of primary yaw dynamics based on short data time history (be-
fore the Dutch-roll mode starts) with rudder control input excitation. The parameters
to be identified are Nr and Nδr .
43

Figure 3.10: SIDPAC parameter estimation process
• Step 2: Identification of the primary roll and roll to yaw coupling dynamics with
aileron control input excitation. The coefficients Nr and Nδr previously identified are
used in the model. The parameters to be identified are Lp, Np, Lδa and Nδa .
• Step 3: Identification of yaw to roll coupling dynamics using a longer time history
data with rudder control input excitation with the rest of the identified parameters
from Step 1 and 2. The parameters to be identified are Lr and Lδr .
44

3.5 Result
Flight test data was collected with RC pilot providing doublet and 3-2-1-1 input excitation
with period 4t of approximately 0.6 seconds. Figure 3.11 shows the first set of flight test
data used for parameter identification. This set of data is used to illustrate the 3 steps used
for the parameter estimation procedure.
0 0.2 0.4 0.6 0.8 1 1.2−200
0
200Roll rate
p (d
eg/s
)
0 0.2 0.4 0.6 0.8 1 1.2−50
0
50Yaw rate
r (d
eg/s
)
0 0.2 0.4 0.6 0.8 1 1.2−1
0
1
time(s)
Con
trol
stic
k [−
1 to
1]
Control input
AileronRudder
(a) Aileron control input excitation
0 0.5 1 1.5−50
0
50Roll rate
p (d
eg/s
)
0 0.5 1 1.5−100
0
100Yaw rate
r (d
eg/s
)0 0.5 1 1.5
−1
0
1
time(s)C
ontr
ol s
tick
[−1
to 1
]
Control input
AileronRudder
(b) Rudder control input excitation
Figure 3.11: Flight test data for model 1 parameter identification
• Step 1:
Step 1 uses the rudder input excitation with short time history data of yaw rate
to identify the primary yaw dynamics. Figure 3.12(a) shows the matching of the
identification result. The parameters obtained are:
Nr = -8.48 s−1, Nδr = -17.5 s−2
• Step 2:
Step 2 uses the aileron input excitation with roll and yaw rate responses to identify the
primary roll and roll to yaw coupling dynamics. Figure 3.12(b) shows the matching
of the identification result. The parameters obtained are:
Lp = -12.0 s−1, Np = 0.294 s−1, Lδa = 58.1 s−2, Nδa = -6.58 s−2
45

• Step 3:
Step 3 uses the full time history rudder input excitation with roll and yaw rate
responses to identify the yaw to roll coupling dynamics. Figure 3.12(c) shows the
matching of the identification result. The parameters obtained are:
Lr = 12.7 s−1, Lδr = 13.6 s−2
0 0.05 0.1 0.15 0.2 0.25 0.3 0.35 0.4−10
0
10
20
30
40
50yaw rate, r
time (s)
r (d
eg/s
)
Flight dataID Model
(a) Step 1
0 0.2 0.4 0.6 0.8 1−100
0
100
200Roll rate, p
time (s)
p (d
eg/s
)
0 0.2 0.4 0.6 0.8 1−40
−20
0
20
40yaw rate, r
time (s)
r (d
eg/s
)
Flight dataID model
(b) Step 2
0 0.5 1 1.5−40
−20
0
20
40Roll rate, p
time (s)
p (d
eg/s
)
Flight dataID model
0 0.5 1 1.5−100
−50
0
50
100yaw rate, r
time (s)
r (d
eg/s
)
(c) Step 3
Figure 3.12: Model 1 parameter identification
The same parameter estimation procedure is being applied to two other sets of flight
test data and the plots for the parameter estimation can be found in Appendix B.4. Table
3.2 gives a summary of parameters estimation results for the three sets of data.
46

Derivatives ID model 1 ID model 2 ID model 3
Lp(s−1) -12.0 -12.8 -11.1
Lr(s−1) 12.7 14.4 8.62
Np(s−1) 0.294 -0.448 0.687
Nr(s−1) -8.48 -6.08 -4.62
Lδa(s−2) 58.1 61.4 43.3
Lδr(s−2) 13.6 12.4 8.99
Nδa(s−2) -6.58 -3.67 -4.76
Nδr(s−2) -17.5 -15.0 -11.9
Table 3.2: Summary of estimated parameters from flight test data
ID Model 1 ID Model 2 ID model 3
τroll (s) 0.083 0.078 0.090
Table 3.3: Identified models roll mode time constant
3.5.1 Stability Derivatives
3.5.1.1 Primary Roll Dynamics
The aircraft primary roll mode is captured by the Lp derivative. This gives the time
constant for the pure roll mode, τroll (s), of the aircraft [20]:
τroll = − 1Lp
(3.13)
The time constants of the three identified models are calculated using the identified models
in Table 3.2. This is given in Table 3.3. The three identified models roll mode time constants
are close to each other. Results published on the similar small-scale UAVs in [36] have roll
mode time constants of 0.10, 0.06 and 0.09 seconds. This is very similar to our results
obtained. This shows that the primary roll mode is well captured and identified from the
flight test system identification. It is essential to identify Lp parameter accurately because
it is an important parameter in the lateral model dynamics for the roll angle controller
synthesis.
47

3.5.2 Yaw and Coupled Roll-yaw Dynamics
The primary yaw mode dynamics is described by Nr parameter and the identified values
in Table 3.2 show that the three identified values are reasonably close and have the correct
negative sign. The negative sign in Nr means that a positive yaw rate produces a positive
side force on the vertical tail. This produces a negative yawing moment and opposes the
yaw rate motion, which provides yaw damping for the aircraft.
The Lr parameter captures the aircraft roll to yaw coupling dynamics. A close agree-
ment of the identified Lr values is obtained from the three identified models (in Table 3.2)
and this will provide a reasonably good description of the roll to yaw coupling dynamics
from the identified models. On the other hand, the Np parameter which captures the air-
craft yaw to roll coupling dynamics has a large variation. This poor matching of the three
Np values obtained from the flight test identification in Table 3.2 indicates that the yaw
to roll dynamics is not well captured. Part of the reason for this poor matching is the
due to the limitation of the two-state model structure used in the lateral-directional mode
identification described in Section 3.1.2.1.
3.5.3 Control Derivatives
The Lδa, Lδr, Nδa and Nδr control derivatives identified provide a measure of input sen-
sitivities of the aileron and rudder control to the roll (L) and yaw (N) moment of the
aircraft. The ratio of Lδa to Lδr and Nδr to Nδa provide the relative magnitude of each
control derivative to the roll and yaw moment. Table 3.4 contains these ratios derived from
the three identified models in Table 3.2.
The relative magnitude of Lδa to Lδr contribution to the aircraft roll moment (4 : 1 from
Table 3.4) makes sense as the aircraft primary roll moment is obtained from aileron control
input and smaller roll moment is obtained with rudder input. A ratio of approximately
0.2 for Lδr/Lδa from the three identified models in Table 3.4 indicates good consistency
of roll control derivatives identified from aileron and rudder inputs. However, for the yaw
moment, the ratios of Nδa to Nδr have a variation between 0.25 to 0.40 (Table 3.4). This
indicates that the yaw control derivatives identified have poor matching result within the
three identified models.
48

ID Model 1 ID Model 2 ID model 3LδrLδa
0.234 0.202 0.208NδaNδr
0.376 0.245 0.400
Table 3.4: Control derivatives ratio
3.6 Model Verification
3.6.1 Time Domain Model Verification
Time domain verification of the three identified models is performed by comparing the
identified models with a longer time history flight test data not used in the parameter
estimation process. The time history plots of the identified models were obtained using the
measured control inputs from the model verification data. Figure 3.13 shows the comparison
plots for the identified models and verification data. With aileron control input (Figure
3.13(a)), the identified models show good matching in the roll rate response and poor
matching in the coupled yaw rate response. The good matching of the roll rate response
with aileron control input is due to good parameter identification results for Lp, Lr and Lδa
parameters. The poor yaw rate response matching in the time domain validation is due to
poor Np and Nδa parameter identification results described in Section 3.5.
With rudder control input (Figure 3.13(b)), again, the roll rate response from the iden-
tified model shows good matching with the flight test data but not the yaw rate response.
However, during the initial short time period when the rudder control input is applied, the
yaw rate response from the identified models are able to match the flight test data well.
However when the Dutch-roll mode kicks in, the identified models responses are not able
to match the flight test data results. Again, this is mainly due to the limitation of the
two-state state-space model used.
3.6.2 Frequency Domain Model Verification
The same set of validation data used in the time domain verification (Figure 3.13) is used
for frequency domain model verification. Discrete Fourier transform is used to transform
the time domain verification data to frequency domain. In the frequency domain model
49

0 1 2 3 4 5 6 7 8 9−200
−100
0
100
200
p (d
eg/s
)
0 1 2 3 4 5 6 7 8 9
−40
−20
0
20
r (d
eg/s
)
0 1 2 3 4 5 6 7 8 9−1
−0.5
0
0.5
1
cont
rol i
nput
[−1
to 1
]
time (s)
ID model 1ID model 2ID model 3flight data
Ail stickRud stick
(a) Aileron control input
0 1 2 3 4 5 6 7
−50
0
50
100
p (d
eg/s
)
0 1 2 3 4 5 6 7−150
−100
−50
0
50
100
r (d
eg/s
)
ID model 1ID model 2ID model 3flight data
0 1 2 3 4 5 6 7 8
−0.5
0
0.5
cont
rol i
nput
[−1
to 1
]
time (s)
Ail stickRud stick
(b) Rudder control input
Figure 3.13: Time domain verification of identified models
verification analysis, the relevant frequency range of interest is limited by the control input
signals excitation frequency and data sampling rate. Since a data sampling rate of 50 Hz
is used, frequency domain data above 79 rad/s is not useful for the verification analysis
(cutoff frequency is selected to be 1/4 of the data sampling rate). In addition, the frequency
response of the validation data is representative of the aircraft dynamics within the range
of control input excitation frequencies.
Figure 3.14 shows the FFT plots for the input and output data sets used in the the
model validation. In Figure 3.14(a), the FFT of roll rate output response is plotted together
with aileron control input signal applied. In Figure 3.14(b), the FFT of yaw rate output
response is plotted together with rudder control input signal applied. The two plots in
Figure 3.14 show a good matching magnitude across the frequencies for the control input
signals to excite the aircraft angular rate dynamics within the same frequencies range. The
aileron and rudder control input excitation frequency range, ωR, are approximately between
1 to 8 rad/s in both of the plots in Figures 3.14(a) and 3.14(b). The frequency domain
model verification is only valid within the ωR frequency range.
Figure 3.15 shows frequency response plots of the identified models with the verification
50

100
101
0
10
20
30
40
50
60
70
Freq (rad/s)
AB
S M
agni
tude
FFT of roll rate output and aileron input
p output
δa input
ωR
(a) Aileron input excitation
100
101
0
20
40
60
80
100
120
140
160
180
200
Freq (rad/s)
AB
S M
agni
tude
FFT of yaw rate output and rudder input
r output
δr input
ωR
(b) Rudder input excitation
Figure 3.14: FFT of input and output flight test data used in model validation
101
0
5
10
15
20
Mag
nitu
de (
dB)
Roll rate
Frequency (rad/sec)
101
−25
−20
−15
−10
−5
0
5
10
Mag
nitu
de (
dB)
Yaw rate
Frequency (rad/sec)
ID model 1
ID model 2
ID model 3
Flight test data
ωR
ωR
(a) Aileron input excitation
101
−15
−10
−5
0
5
10
15
Mag
nitu
de (
dB)
Roll rate
Frequency (rad/sec)
101
−10
0
10
20
Mag
nitu
de (
dB)
Yaw rate
Frequency (rad/sec)
ID model 1
ID model 2
ID model 3
Flight test data
ωR
ωR
(b) Rudder input excitation
Figure 3.15: Frequency domain model verification
data for both aileron and rudder control input excitations. The frequency range of interest
is limited to be within the input excitation frequency range (ωR) specified in the plots. The
plots show consistent result with the time domain verification where the identified models
have a good matching with the roll rate response with aileron control input but not with
the rudder control input.
51

3.7 Updating of Aerodynamic coefficients in Nonlinear Model
The lateral state-space model identified is used to update the lateral aerodynamic coeffi-
cients in the nonlinear simulation model. This section will show the approach and proce-
dure used to update the dimensionless aerodynamic coefficients in the nonlinear simulation
model.
3.7.1 Nominal Identified Model
From Section 3.5, the three different flight test data sets produce three different identified
models. However, only one of the identified models can be used to update the nonlinear
simulation model. The approach taken is to compute a nominal model and an overbound
from the three identified models to update the nonlinear simulation model. The overbound
uses a combination of the computed nominal model and real parameter variation from the
nominal model which will be covered in uncertainty modeling in Chapter 4.2.
The nominal model is obtained by using the mid-point value between the minimum
and maximum value for each of the identified derivatives in the three identified models.
Appendix B.5 Table B.2 presents the nominal model parameters with upper and lower
bound values. Figure 3.16 shows the Bode magnitude plot for the nominal model with the
three identified models. The plot shows that the nominal model frequency response lies
between the three identified models frequency response. This has the benefit of reducing
the size of the uncertainty bounds from the nominal model.
3.7.2 Aerodynamic Coefficients Computation
The nonlinear aerodynamic equations for side force, roll and yaw moment from Section
2.2.1 are given by Equations 2.1, 2.5 and 2.7:
CY = CYββ + CYδr
δr +b
2Va(CYpp + CYrr) (3.14)
cl = clββ + clδaδa + clδr
δr +b
2Va(clpp + clrr) (3.15)
cn = cnββ + cnδa
δa + cnδrδr +
b
2Va(cnpp + cnrr) (3.16)
52

−20
−15
−10
−5
0
5
10
15
From: δa
To:
p
100
101
−25
−20
−15
−10
−5
0
5
10
To:
r
From: δr
100
101
Identified models
Frequency (rad/sec)
Mag
nitu
de (
dB)
ID model 1
ID model 2
ID model 3
Nominal model
Figure 3.16: Bode magnitude plot of identified models
where CYp , CYr , clp , clr , cnp and cnr are dynamic aerodynamic coefficients and CYβ, CYδr
, clβ ,
clδr, clδa
, cnβ, cnδr
and cnδaare static aerodynamic coefficients. The dynamic aerodynamic
coefficients, unlike the static aerodynamic coefficients, cannot be obtained from static wind
tunnel testing. They account for dampings in the aircraft dynamics and are commonly
known as damping coefficients. Flight test system identification is usually used to obtain
these dynamic coefficients through excitation of the aircraft dynamic modes.
The aerodynamic coefficients are the dimensionless forms of the stability and control
derivatives in the state-space model in Equation 3.7. Hence the aerodynamic coefficients
can be computed by removing the dimensional dependent of the identified parameters. The
relationships for dimensionless computation of the aerodynamic coefficients from the identi-
fied stability and control derivatives are given in Table 3.5. In this thesis, the aerodynamic
coefficients related to β and CY derivatives will not be updated using flight test identifica-
tion results due to the limitation of the two-state state-space model used. Hence only the
identified stability and control derivatives are used to update the aerodynamic coefficients
(clp , clr , cnp , cnr , clδr, clδa
, cnδrand cnδa
) while the rest of the aerodynamic coefficients (CYp ,
53

CYr , CYβ, CYδr
, cnβand clβ ) are kept at the values obtained from the simulator parameter
tuning (Appendix Table A.1).
Roll moment clβ clδa clδr clp clr
IxxLβ
qSbIxxLδa
qSbIxxLδr
qSb2Ixxu0Lp
qSb22Ixxu0Lr
qSb2
Yaw moment cnβcnδa
cnδrcnp cnr
IzzNβ
qSbIzzNδa
qSbIzzNδr
qSb2Izzu0Np
qSb22Izzu0Nr
qSb2
Side force CYβCYδr
CYp CYr
YβmqS
YδrmqS
2mu0Yp
qSb2mu0Yr
qSb
Table 3.5: Relationships between dimensionless aerodynamic coefficients and dimensional
derivatives
The four-state lateral model in Equation 3.7 uses lateral velocity state v instead of β
state. However, under small angle approximation about the trim point, approximation can
be made between v and β from relationship given in Equation 3.3:
β = sin−1
(v
Va
)
= tan−1
(v
u0
)
For small β angle, β ≈ v/u0. Since u0 is constant, β = v/u0. Replacing v and v in Equation
3.7 with β and β, the 4 states lateral model with β state is given by:
r
β
p
φ
=
Nr Nβ Np 0
−(1− Yr
u0
)Yβ
u0
Yp
u0
g cos θ0
u0
Lr Lβ Lp 0
0 0 1 0
r
β
p
φ
+
Nδa Nδr
0 Yδru0
Lδa Lδr
0 0
δa
δr
(3.17)
54

where Yβ = Yvu0, Lβ = Lvu0 and Nβ = Nvu0. Equation 3.7 and 3.17 are equivalent to
each other under small β angle approximation. Equation 3.7 is preferred over Equation
3.17 in controller design, parameter estimation and implementation since v measurement
is available from the IMU/GPS sensor but not the β angle. Equation 3.17 is derived
because its parameters are directly related to the dimensionless aerodynamic coefficients in
Equations 3.14, 3.15 and 3.16 which are being updated.
Dimensionless aerodynamic coefficients (coefficients in bold, Table 3.5) are computed
using derivatives from the computed nominal identified model. Control and stability deriva-
tives (derivatives in bold) in Equation 3.17 are computed from aerodynamic coefficients
obtained from simulator parameter tuning. Table 3.6 gives the results of the computation.
The aerodynamic coefficients are updated using identified state-space model parameters
to provide the nonlinear simulation model with the same dynamic response similar to the
identified state-space model that captures the real aircraft dynamics from system identi-
fication flight testing. Comparison of the output responses from the updated nonlinear
model against the identified state-space model used for updating the nonlinear simulation
model will provide verification on accuracy of this approach. Figure 3.17 shows the roll and
yaw rate output response comparisons of the updated nonlinear model with the four-state
parameterized state-space model (augmented ID model) from Equation 3.17. The aileron
and rudder control inputs used are from the validation data in Figure 3.13. The plots show
that the updated nonlinear model responses have very good matching with the parameter-
ized state-space model that was being used to update the aerodynamic coefficients. This
verifies the proposed approach used to update the aerodynamic coefficients to the nonlin-
ear model works well. Figure 3.18 shows the comparison of the updated nonlinear model
with the flight test validation data from Figure 3.13. The updated nonlinear model and
the validation flight test data responses are very similar to the time verification plots in
Figure 3.13. This is expected since the updated nonlinear model has its aerodynamic coef-
ficients computed from the identified state-space models. Hence for the nonlinear model to
predict the actual UAV flight dynamics, it is important to get good flight test parameter
identification result.
55

Derivatives from identification Aerodynamic coefficients computed
Lp −1.28× 101 clp −4.43× 10⁻¹
Lr 1.44× 101 clr 4.99× 10⁻¹
Np −4.48× 10⁻¹ cnp −2.81× 10⁻²
Nr −6.08 cnr −3.82× 10⁻¹
Lδa 6.14× 101 clδa7.94× 10−2
Lδr 1.24× 101 clδr1.60× 10−2
Nδa −3.67 cnδa−8.60× 10⁻³
Nδr −1.50× 101 cnδr−3.52× 10⁻²
Derivatives computed Aerodynamic coefficients from simulator tuning
Yβ −2.38× 101 Cyβ−8.30× 10⁻¹
Lβ −3.09× 101 Clβ −4.00× 10⁻²
Nβ 1.47× 101 Cnβ3.44× 10⁻²
Yp 0.00 CYp 0.00
Yr 0.00 CYr 0.00
Yδr 1.26× 101 CYδr1.91× 10−1
Table 3.6: Dimensional and dimensionless aerodynamic coefficients
56

0 1 2 3 4 5 6 7−200
−100
0
100
200
roll ratep
(deg
/s)
0 1 2 3 4 5 6 7
−40
−20
0
20
40
60
yaw rate
r (d
eg/s
)
time (s)
Updated nonlinear modelAugmented ID model
(a) Aileron input excitation
0 1 2 3 4 5 6 7
−50
0
50
100roll rate
p (d
eg/s
)
0 1 2 3 4 5 6 7
−50
0
50
yaw rate
r (d
eg/s
)
time (s)
Updated nonlinear modelAugmented ID model
(b) Rudder input excitation
Figure 3.17: Comparison of updated nonlinear model with augmented identified model
0 1 2 3 4 5 6 7−200
−100
0
100
200
roll rate
p (d
eg/s
)
0 1 2 3 4 5 6 7
−40
−20
0
20
40
60
yaw rate
r (d
eg/s
)
time (s)
Updated nonlinear modelFlight test data
(a) Aileron input excitation
0 1 2 3 4 5 6 7−100
−50
0
50
100roll rate
p (d
eg/s
)
0 1 2 3 4 5 6 7−150
−100
−50
0
50
100yaw rate
r (d
eg/s
)
time (s)
Updated nonlinear modelFlight test data
(b) Rudder input excitation
Figure 3.18: Comparison of updated nonlinear model with flight test data
57

Chapter 4
Uncertainty Models Modeling,
Synthesis and Analysis
The nonlinear UAV simulation model developed in Chapter 2 is only useful if it is able to
predict the actual vehicle flight dynamics response accurately. However, modeling is an
approximation of the actual physical system and this results in uncertainty predicting the
actual system response using the model developed. Hence it is important to include model
uncertainty in the nonlinear simulation model so that it gives a confidence level as well as
a bound in predicting the actual system response.
The model uncertainty description formulation for robust control problems are generally
classified in two categories, structured and unstructured uncertainty [37]. The parametric
uncertainty is a structured uncertainty model where the model and its order are known.
The only unknown is in the value of the parameter, which is uncertain. The parametric
uncertainty model structure is important as it provides parameter variations associated
with the physical parameters of the system model. Therefore a systematic procedure is
needed for accurate uncertainty modeling of real parameter variation. However, parametric
uncertainty structure can be extremely complicated for practical interest. This is because
uncertainties associated with the system physical parameters can enter into the model as
nonlinear multivariate functions that are difficult to separate into nominal and uncertain
components [38]. On the other hand, the unstructured uncertainty are used to model
dynamics of uncertainty which are not known or neglected and is usually quantified using
58
frequency bounding functions to characterize the level of uncertainty to be considered over
various frequency ranges of interest.
The uncertain linear model order and structure used in controller synthesis are im-
portant because using a conservative uncertain model can result in poor closed-loop per-
formance. Similarly using a uncertain model with complicated uncertainty structure may
result in high order controller obtained from the controller synthesis process. Analysis of
the model uncertainty can help to reduce uncertainty model order and complexity with
minimum effect in the controller synthesis.
This chapter provides a systematic approach to modeling and inclusion of modeling
errors into the nonlinear simulation model. To use the uncertain nonlinear model for ro-
bust control design and analysis with existing linear design and analysis tools, uncertain
linear model need to be extracted from the uncertain nonlinear simulation model. A new
approach for uncertain linear model realization from uncertain nonlinear simulation model
is presented. This approach provides a physically meaningful Linear Fractional Transfor-
mation (LFT) model. The LFT model realization approach is applied to the nonlinear
UAV simulation model. An approach to simplification of the LFT is also presented using
the realized UAV LFT model.
4.1 Parametric Uncertainty Modeling
The physical parameters determined from various experiments (Chapter 2 and 3) for the
nonlinear UAV modeling contain uncertainties due to imprecise nature of experimentation
and limitation of physical system modeling. Estimated physical parameters are modeled
as real parameter uncertainties with each parameter described by a nominal value and a
lower and upper bound. A systematic approach is used to include these parameters into
the nonlinear simulation model. The resulting uncertain nonlinear simulation model is used
subsequently in linearization process for deriving uncertain linear model.
59

4.1.1 Parametric Uncertainty Representation
A parametric uncertainty set P4 for an uncertain parameter P bounded within a region
bounded by [Pmin, Pmax] can be expressed in the form:
P4 = P (1 + WP δ) (4.1)
where P is the nominal parameter value, δ is any real scalar satisfying |δ| ≤ 1 and WP is
the relative uncertainty (weight) used to scale δ to norm size of 1 given by:
WP =Pmax − Pmin
Pmax + Pmin
4.1.1.1 Parametric Uncertainty Implementation Procedure
Parametric uncertainty is included into the Simulink model via a multiplicative or inverse
multiplicative uncertainty structure using the USS System (Uncertain State-Space) block
from Robust Control Toolbox [39]. The details of the implementation is illustrated using
a simple example. This procedure is used to include parametric uncertainties in the UAV
nonlinear simulation model.
In this example, consider a system with two inputs u1,2, single output y and three real
parametric uncertainties a∆, b∆ and c∆ given by the equation:
y =[(
a∆
b∆
)u1 + c∆
]u2
where
amin ≤ a∆ ≤ amax
bmin ≤ b∆ ≤ bmax
cmin ≤ c∆ ≤ cmax
The nominal system implemented using Simulink blocks is shown in Figure 4.1.
With parametric uncertainties, parameters a∆ and c∆ are expressed as multiplicative
60

Figure 4.1: Simulink diagram for nominal system
uncertainty while 1/b∆ is expressed as inverse multiplicative uncertainty given by:
a∆ = a(1 + raδ)
1b∆
=(
1b
)(1
1 + rbδ
)(4.2)
c∆ = c(1 + rcδ)
where
• a, b and c are the nominal values of the uncertain parameters.
• ra, rb and rc are weights used to scale δ to norm size of 1.
• δ is defined as real scalar satisfying −1 ≤ δ ≤ 1.
Each raδ, rbδ and rcδ is modeled as a USS System Simulink block with a ureal (Uncertain
real parameter object in Robust Control Toolbox) object that has a zero nominal value and
a weighted range of real value variation from (k − kmin)/k to (kmax − k)/k where k = a, b
and c. The c∆ parameter is relocated before output y so that the uncertain parameter has
multiplication with the input signal u2. The reason for this modification will be explained
in section 4.2.3. Figure 4.2 shows the Simulink diagram with the parametric uncertainties
implemented.
4.1.2 Example
This section will illustrate an example of implementing parametric uncertainty into the
nonlinear UAV simulation model using the aerodynamic coefficients obtained from flight test
61

Figure 4.2: Simulink model with real parametric uncertainties
parameter identification in Section 3.5. Using the relationships for aerodynamic coefficients
computation in Section 3.7, the aerodynamic coefficients computed from the nominal model
with lower and upper bound values are given in Appendix Table C.1.These aerodynamic
coefficients with parametric uncertainties are modeled in the nonlinear simulation model
using the described technique in Section 4.1. An example of the actual Ultrastick UAV
nonlinear Simulink model block diagram implemented with parametric uncertainties, the
dimensionless roll moment coefficient (cl) equation, is given in Appendix C.1.
With the parametric uncertainties implemented into the nonlinear simulation model, a
verification is done to check the updated uncertain nonlinear simulation model produces
output responses that overbound the set of responses from the flight test identified models
that are used for updating the nonlinear simulation model. In the setup, 100 simulation
runs are performed with random sampling of the parametric uncertainties in each of the
run. A single doublet input signal is applied to both aileron and rudder control inputs to
excite the uncertain nonlinear simulation model from the trim condition used in Section
3.7. Figure 4.3 shows the roll and yaw rate responses obtained from 100 simulation runs (in
grey - -) from the uncertain nonlinear simulation model. In addition, three additional sim-
ulations are performed with the parametric uncertainty set to the aerodynamic coefficients
obtained from identified models 1 to 3. The plot in Figure 4.3 shows that the range of
roll and yaw rate time response variations with parametric uncertainty perturbations from
the uncertain nonlinear simulation model covers the set of output responses from the three
identified models. The implemented parametric uncertainties in the nonlinear simulation
model provides an accurate description of the system output responses that contain the
three flight test identified models responses.
62

0.5 1 1.5 2 2.5 3 3.5 4 4.5 5−200
−100
0
100
200
p (d
eg/s
)
0.5 1 1.5 2 2.5 3 3.5 4 4.5 5−100
−50
0
50
100
r (d
eg/s
)
time (s)
NominalID Model 1ID Model 2ID Model 3100 sampled runs
Figure 4.3: Uncertain nonlinear simulation model Monte-Carlo runs
4.2 Linear Fractional Transformation
The uncertain nonlinear simulation model describes a wide variation of dynamic behavior
with multiple sources of parametric uncertainty perturbation. To use this model for robust
control design and analysis with existing design and analysis tools from robust control the-
ory, the uncertain nonlinear model needs to be linearized with the parametric uncertainties
included in a Linear Fractional Transformation (LFT) model representation (Figure 4.4).
This is the most general form for H∞ controller synthesis and robustness analysis using
structured singular value. This section introduces new software tools to linearize the un-
certain nonlinear simulation model developed for obtaining a physically meaningful LFT
model.
The LFT is a matrix function that is a very powerful approach to realization of an
uncertain model which separates what is known from what is unknown in a feedback-like
connection. This is comparable to the realization of a state-space system where it provides
63

Figure 4.4: General LFT representation for robust control synthesis and analysis
an easier manipulation and computation of a linear system, except that the LFT model
is capable of handling an uncertain system. For example, consider the uncertain system
shown in Figure 4.5, where M represents the known part of the uncertain system and ∆
represents the uncertainty in the uncertain system, it can be written as an upper LFT:
y = Fu(M, ∆)
= (M22 + M21∆(I −M11∆)−1M12)u
where M matrix is compatibly partitioned with the ∆ matrix for a given input and output
signals of the system. The matrix M can be partitioned into smaller sub-matrices (as shown
Figure 4.5: M-∆ interconnection
in Figure 4.6) according to the following input and output state equations:
x = Ax + B1w + B2u
z = C1x + D11w + D12u
y = C2x + D21w + D22u
64

The M matrix above is partitioned to:
M11 =
A B1
C1 D11
M12 =
B2
D12
M21 =[
C2 D21
]
M22 = D22
Figure 4.6: M -∆ structure with M partitioned
4.2.1 Method of LFT Model Realization
A realization of the LFT model involves the extraction or derivation of the M and ∆
matrices from the uncertain nonlinear simulation model. Various papers [38, 40–45] have
been published to address the topic for the LFT model realization. However, this area
of research still remain as an open and unsolved problem as the key issue of the LFT
modeling still remain in getting a minimum size ∆ description for the system. None of
the methods presented is able to guarantee a model with an unique minimum-order LFT
model and this problem is not part of this research work. The main focus is to provide
a systematic approach for LFT model realization that exploits on the advantage of the
integrated framework in Matlab/Simulink environment.
65

An LFRT toolbox in [46,47] is a toolbox that works with Matlab/Simulink environment
and requires uncertain Simulink blocks to be modeled using a special Simulink block object
representations. This requires additional effort to convert the existing uncertain nonlinear
simulation models into the Linear Fractional Representation (LFR) object representation.
The approach taken here is similar, though uses the existing uncertain nonlinear simula-
tion model and the tools from the Matlab Robust Control Toolbox for the LFT model
realization. The principle of this method is based on linearization of the uncertain nonlin-
ear Simulink model which is very similar to the approach taken by [48–50] and the block
linearize commands in Simulink. This method of LFT model realization from the uncertain
nonlinear model is called ulinearize.
4.2.2 ulinearize Principles and Procedure
The ulinearize procedure performs linearization of an uncertain nonlinear Simulink model
at a specific operating point. The inputs to ulinearize are the name of the uncertain
nonlinear Simulink model that is to be linearized and an operating point object in which
the linearization is to be performed. This procedure relies on the Matlab linearize function
used for linearizing nonlinear Simulink model.
The ulinearize function performs the following:
• Finds all the USS System blocks in the Simulink model and creates an input and
output for the linearization by breaking the loop associated with the USS blocks.
The output of the USS System block will be an input for the linearization and the
input to the USS System block will be the linearization output (shown in Figure 4.7).
• Finds and creates input and output linearization Input-Output (IO) objects which
associates an input signal with each of the inport block and output signal with each
of the outport block.
• Creates a block diagonal ∆ matrix with each uncertainty object on the diagonal of
∆ matrix and associates each of the input and output linearization IO that has been
66

Figure 4.7: Creating linearization input and output at the USS System block (Equation
4.1)
created.
• Linearizes of all the IO blocks that have been created previously for the linearization
using the specified operation point object. This will generate a state-space model
that contains all the inputs and outputs of the IO.
• Connects the ∆ matrix and state-space model obtained from linearization via a linear
fractional transformation to generate an uncertain linear system.
A flow chart for the ulinearize function procedure is given in Figure 4.8.
4.2.3 Limitations of ulinearize
Linearization of the uncertain nonlinear model is a simple and intuitive approach for LFT
realization to generate physically meaningful LFT representations of the uncertain system.
A drawback of this approach is that it tends to produce ∆ matrix with many repeated
parametric uncertain parameters. This is due to each of the uncertainty is “pulled-out”
and modeled individually even if they are the same parametric uncertainty that appear
in multiple locations in the nonlinear simulation model. Although this can be avoided by
smart manipulation of the modeling block diagrams, it becomes difficult with very complex
system. Unnecessary repeated uncertain parameters are undesirable as they increase the
computation effort required for robust analysis and may lead to a more conservative analysis
results.
67

Figure 4.8: Flow chart of ulinearize function procedure
The parametric uncertainties in the nonlinear simulation model have to be implemented
using either a multiplicative or an inverse multiplicative uncertainty that has a multiplica-
tion with an input signal. Any constant uncertainty has to be manipulated so that it has
a multiplication with an input signal. Linearization of the uncertain nonlinear simulation
model requires breaking of the loop associated with the USS block to form an input/output
pair for linearization. During the linearization, an exogenous signal is required from the
input to output point of the linearization so that the transfer function seen by the uncertain
parameter can be computed. Hence, for a constant uncertainty block that is not multiplied
with an input signal, the numerical linearization will not work and no input to output trans-
fer function relationship can be obtained. This will result in the constant block uncertain
parameter not showing up in the LFT model realization. The LFRT toolbox from [46] has
the same limitation since it makes use of Matlab linmod function for linearization in the
LFT model realization.
68

In addition, even if an input multiplication signal is available at the USS System block,
the input signal must be non-zero. This may seem trivial but it can happen when the input
signal to the USS System block is from a state variable signal that has been trimmed to
zero with zero initial condition. However this problem can be easily overcome by setting a
very small initial condition on the state (10−5 times of an unit value of the state variable)
so that the linearization will be performed correctly. The trimmed state variable will not
significantly differ from a perfect zero initial condition.
4.2.4 Effect of Trim Point
In the realization of LFT model using ulinearize, numerical linearization of uncertain non-
linear model is performed using specific operating point (as shown in Figure 4.9). To find
the operating point, a trim operating condition is first obtained through trimming of the
nominal nonlinear model at the desired trim operating condition. Subsequently, the struc-
ture of the operating point for the nonlinear simulation model is created. With the trim
operating condition and the structure of the operating point, the operating point object for
the trim condition is created for the LFT realization. Hence, any perturbation of uncer-
tainties in the nonlinear model will affect the trim point and operating point and this can
be important as it affects the validity of the LFT model obtained using this approach.
69

Figure 4.9: Procedure in obtaining operating point for ulinearize
4.3 UAV LFT Model Realization
A comprehensive list of parametric uncertainties are modeled into the LFT model realiza-
tion. The list of parametric uncertainties (in Appendix Table C.2) included in the nonlinear
UAV simulation model are based on the following experimental data:
• Moment of inertia data (Appendix Table A.2)
• Flight test identified aerodynamics coefficients (Appendix Table C.1)
• Simulator tuned aerodynamics coefficients (Appendix Table A.1) with ±5 % uncer-
tainty variation from these values.
• Propulsion system coefficients (Appendix Table A.3) with ±5 % uncertainty variation
from these values.
70

The ulinearize algorithm is applied to the nonlinear simulation model with parametric
uncertainties using trim operating point condition in Appendix Table B.1. In the uncertain
linearization setup, the angular rate velocity integrator initial condition (refer to Appendix
Figure C.2) is set to a very small numerical value (10−9) so that angular rates p, q and
r are not zero. This is important since these angular rates are fed back to the input of
moment of inertia uncertainty blocks. As previously discussed, a zero input to a USS block
will result in a zero input and give a zero input to output linearization relationship. This
will result in the parametric uncertainties not showing up in the realized LFT model.
Another modification was made to Simulink derivative block linearization time constant
to a large number (1030) instead of using the default value of ∞. This change was made
to the α derivative block from which the derivative of α signal is obtained. The α signal
is used as the input to the CLα and cmα parametric uncertainty blocks. The reason for
this modification is that if the linearization time constant is infinity, this will cause the α
signal to be zero and no CLα and cmα parametric uncertainty will be extracted from the
uncertain linearization. Using a large non-infinity time constant is able to get around this
problem. The drawback of using a non-infinity linearization time constant is that the LFT
model has an additional state contributed by the derivative block. However, this does not
affect the overall linearized system dynamics and can be simply eliminated from the LFT
model.
A LFT model with a M matrix of size 66 x 63 (Figure 4.10) and a diagonal ∆ matrix of
size 46 x 46 (Appendix Table C.3) were obtained. The reason why the diagonal ∆ matrix
has such a large dimension (46) much higher than the total number of different parametric
uncertainties (34) is because CLminD, Ixx, Iyy, Izz and Ixz parameters were used in multiple
locations in the nonlinear simulation model. The ulinearize realization treats each of them
as a separate individual uncertainty leading to repetition of same uncertain parameter. The
state equations for the realized LFT model are given by:
xf = Afxf + B1fwf + B2f
uf
zf = C1fxf + D11f
wf + D12fuf
yf = C2fxf + D21f
wf + D22fuf
71

Figure 4.10: M matrix dimension obtained for UAV LFT model
4.3.1 Uncertain System Worst-case Gain
The LFT model obtained represents an uncertain system with the known part grouped
into M matrix and uncertain part in a ∆ matrix with a feedback interconnection structure
as shown in Figure 4.5. The gain of the uncertain system depends on the values of the
uncertainty in the ∆ matrix. An important question to asked about the system gain
resulted from uncertainties variation is “What is the maximum gain of the system over all
allowable values of the uncertainties in the ∆ matrix?” The maximum gain and associated
uncertainty perturbations can be used as the worst-case gain condition for a closed-loop
uncertain system stability analysis. The determination of the maximum gain of uncertain
system over all allowable uncertainty perturbations is known as worst-case gain analysis.
The objective of the worst-case gain analysis is to find the values of the uncertain parameters
that give the worst-case (maximum) gain of the system. The measure of the size for the
maximum gain is the maximum singular value of the system over the frequency response,
which is the H∞ norm.
A worst-case gain analysis was performed on the open-loop LFT model to find the
worst-case gain condition over the frequency range of interest, which is between 1 to 30
rad/s using wcgain function from Robust Control Toolbox. A pointwise worst-case gain
computation was performed. Figure 4.11 shows the result of the worst-case gain bounds
72

across the frequency. The exact worst-case gain condition can be assumed to be given by
either the lower or upper bound value since these two bounds are almost the same. The
maximum singular value at each frequency point for the nominal system is also plotted to
show the deviation of worst-case gain condition from the nominal system due to uncertain
parameters variation in the LFT model. The worst-case gain result obtained here are used
to evaluate the LFT model realization accuracy in next section.
100
101
0
5
10
15
20
Max
imum
sin
gula
r va
lue
(dB
)
Worst−case gain
Frequency (rad/sec)
NominalWorse−case gain: Lower boundWorse−case gain: Upper bound
Figure 4.11: Worst-case gain analysis of full UAV LFT model
4.3.2 Accuracy of LFT Model Realization
The accuracy of the LFT model obtained is evaluated by comparing its output responses
with the uncertain nonlinear simulation model responses. A same set of parametric un-
certainty perturbations (δi) is applied to both the LFT model and the uncertain nonlinear
simulation model and the output responses of the two systems are compared. Since this
comparison involves a linear model (LFT model) and a nonlinear model, there will be dif-
ferences in the output responses due to the trim solution. To eliminate the effect of the
linearization in the comparison, a different approach shown in Figure 4.12 is taken.
In this approach, a nonlinear model is first obtained from the uncertain nonlinear simu-
73

Figure 4.12: Setup for comparing accuracy of LFT model with uncertain nonlinear simula-
tion model
lation model with the parametric uncertainties fixed to the set of uncertainty perturbation
δi. Next, a different trim operating condition is obtained from the perturbed nonlinear
model using the same desired trim operating condition before linearizing the model since
uncertainty perturbation changes the trim condition which has been discussed in Section
4.2.4. The perturbed linear model obtained is used for comparison with the linear model
(LFT) obtained by fixing the ∆ matrix to the same set of parametric uncertainties δi.
The approach of using the linearized model instead of the nonlinear model for compar-
ison is only valid if the linearized model is able to represent the nonlinear model well and
this has been verified in Section 3.1.1.1. An advantage of using the ulinearize for the LFT
realization is shown here as it is easy to relate the physical parametric uncertainties in the
LFT model and the uncertain nonlinear simulation model. This allows easy comparison
between the models.
The set of uncertain perturbation δi chosen is based on the the worst-case gain analysis in
Section 4.3.1. This is to ensure a worst-case uncertainty perturbation condition is applied to
drive the uncertain system to the worst-case condition for testing the validity and accuracy
of the LFT model realization approach. The set of worst-case uncertainties (Appendix
Table C.4) at 5 rad/s is chosen for this analysis so that it is consistent with the flight test
identification data collect at this frequency range that was used to update the uncertain
74

nonlinear model.
Figures 4.13 and 4.14 show the frequency and time response comparisons for angle of
attack, sideslip, roll and pitch angle outputs from linear (LFT) model and linear (Perturbed)
model using the same set of worst-case gain uncertainty variation δi condition. For the time
response simulation, doublet signals are applied to elevator, aileron and rudder control
inputs. In each of the plots, the nominal system response is include as a baseline reference.
Figures 4.13 and 4.14 shows that the linear (Perturbed) model and linear (LFT) model
responses are well matched. Hence the uncertain LFT model is able to predict the response
of the uncertain nonlinear simulation under the worst-case gain condition and this shows
that ulinearize is able to provide an accurate LFT model realization from the uncertain
nonlinear simulation model.
100
101
−30
−28
−26
−24
−22
−20
−18
Mag
nitu
de (
dB)
α from δe
100
101
−30
−20
−10
0
θ from δe
100
101
−20
−10
0
10
Frequency (rad/s)
Mag
nitu
de (
dB)
φ from δa
100
101
−40
−30
−20
−10
0
Frequency (rad/s)
β from δr
NominalLinear model (LFT)Linear model (Perturbed)
Figure 4.13: Frequency domain comparison for LFT model realization accuracy
75

0 2 4 6 8 10
−10
−5
0θ
(deg
)
Pitch angle
0 5 10
−10
−5
0
5
10
β (d
eg)
Sideslip angle
0 2 4 6 8 10−1.5
−1
−0.5
0
0.5
1
α (deg)
time (s)
AOA
0 5 10−40
−20
0
20
40
60
φ (d
eg)
time (s)
Roll angle
Linear model (LFT)Linear Model (Perturbed)nominal
Figure 4.14: Time domain comparison for LFT model realization accuracy
4.3.3 Decoupled LFT model
In Section 3.1.1.1, negligible cross-coupling assumption has been made and verified for de-
coupling linearized aircraft dynamics into longitudinal and lateral-directional modes. How-
ever, with the presence of parametric uncertainties, the validity of this assumption may not
hold.
The LFT model obtained from ulinearize in the previous section contains both longi-
tudinal and lateral-directional modes. To decouple the LFT model into longitudinal and
lateral-directional modes, the same approach to decoupling used in Section 3.1.1.2 is used.
This is done by extracting the relevant columns and rows required by each mode from Af ,
B1f, B2f
, C1f, D12f
, C2f, D21f
and D22fmatrices (Figure 4.10) of the LFT model. For
76

the input w and output z to the diagonal ∆ matrix, full size D11fmatrix is used since it is
not known how each of these uncertainties is relevant to each of the mode and there might
be cross-coupling contribution by these uncertainties.
To reduce any redundant uncertain parameters in the decoupled longitudinal and lateral
models ∆ matrices, each uncertain parameter of the decoupled uncertain longitudinal and
lateral models is evaluated to check if it could be eliminated. This is similar to model
reduction process where states that have insignificant effect to the overall system can be
eliminated and simplified to a lower order system. Uncertain parameters with strong cross-
couplings will not be eliminated in this process. The simplification of the uncertain model
is done using the simplify function from the Robust Control Toolbox.
The longitudinal model obtained is:
xlon = Alonxlon + B1lonwlon + B2lon
ulon
zlon = C1lonxlon + D11lon
wlon + D12lonulon
ylon = C2lonxlon + D21lon
wlon + D22lonulon
and the lateral model obtained is:
xlat = Alatxlat + B1latwlat + B2lat
ulat
zlat = C1latxlat + D11lat
wlat + D12latulat (4.3)
ylat = C2latxlat + D21lat
wlat + D22latulat
Table 4.1 shows the details of the uncertain parameters that have been removed or
retained in each of the decoupled models. The dimension of the diagonal uncertain matrix
obtained from the decoupled models after simplification is much smaller than the initial full
∆ matrix that was used. In the longitudinal model, 21 of the uncertainties, which are mainly
related to the roll and yaw moment, have been eliminated. A similar result is obtained for
the lateral model where 22 of the uncertainties eliminated are mainly from pitch moment
and lift force. Intuitively, this is understandable since most of the uncertainties eliminated
from longitudinal model are related to the lateral mode and vice versa for uncertainties
that are eliminated from the lateral model.
Using the worst-case gain analysis result from Section 4.3.1, uncertainties variations
77

for worst-case gain condition in Appendix Table C.4 are applied to the full and decou-
pled models. A comparison between the full and decoupled model responses at worst-case
gain condition using angle of attack, sideslip, roll and pitch angle output responses was
performed. Figure 4.15 shows that the two systems output responses are nearly identical.
This shows that uncertainty perturbations do not induce a significant cross-coupling effects
to the coupled and decoupled models output responses at this operating point with the
given size of worst-case gain parametric uncertainties used.
0 5 10
−10
−5
0
θ (d
eg)
Pitch angle
0 5 10
−10
−5
0
5
10
β (d
eg)
Sideslip angle
0 5 10−1.5
−1
−0.5
0
0.5
1
α (d
eg)
time (s)
AOA
0 5 10−40
−20
0
20
40
60
φ (d
eg)
time (s)
Roll angle
Full modelDecoupled model
Figure 4.15: Full model vs decoupled model comparison
4.4 Uncertain Model Simplification
The LFT model realization from the previous section consists of detailed and accurate model
description of the uncertain nonlinear model at specific operating point. To apply this
78

uncertain model for controller synthesis, a simple representation of the model uncertainty
is desirable so that the synthesized controller obtained will not be too conservative [21].
Two model uncertainty simplification approaches are presented and applied to the lateral
LFT model. The simplified LFT model obtained is used for controller synthesis in the next
chapter.
4.4.1 Uncertain Parameters Sensitivity Analysis
A sensitivity analysis of the parameter uncertainties in the LFT model can help to identify
which of the uncertain parameters will result in a significant different output response from
the nominal system response. This analysis can help to reduce the number of parametric
uncertainties in the LFT model since less sensitive uncertain parameters can be eliminated
with minimum effect on the system response. The sensitivity of the uncertain parameters
is determined using worst-case analysis described previously in Section 4.3.1.
From the decoupled lateral LFT model in Equation 4.3, a two-state lateral LFT model
is extracted. This LFT model is of the same form as the parameterized state-space model
used for parameter identification in Equation 3.8, except that it has addition w input and
z output to a block diagonal uncertainty matrix. The two-state lateral LFT model is given
by:
xlat2s = Alat2sxlat2s + B1lat2swlat2s + B2lat2s
ulat2s
zlat2s = C1lat2sxlat2s + D11lat2s
wlat2s + D12lat2sulat2s (4.4)
ylat2s = C2lat2sxlat2s + D21lat2s
wlat2s + D22lat2sulat2s
wlat2s = diag{δlati }zlat2s ∀ i = 1 to 18 and − 1 ≤ δlat
i ≤ 1
where
xlat2s =
p
r
ulat2s =
δa
δr
ylat2s =
p
r
δlat1 = clδa∆
δlat2 = clδr∆
δlat3 = clp∆ δlat
4 = clr∆
δlat5 = cnδa∆
δlat6 = cnδr∆
δlat7 = cnp∆ δlat
8 = cnr∆
δlat9,10 = Ixx∆ δlat
11,12,13,14 = Ixz∆ δlat15,16 = Iyy∆ δlat
17,18 = Izz∆
79

This can be written in a compact LFT form of:
Glat2s∆= Fu(Mlat2s,∆lat2s) (4.5)
with
Mlat2s =
Alat2s B1lat2sB2lat2s
C1lat2sD11lat2s
D12lat2s
C2lat2sD21lat2s
D22lat2s
and ∆lat2s = diag
{δlati
}∀ i = 1 to 18
The lateral LFT model has a total of 18 uncertain parameters, of which 6 of them are
repeated. Applying the worst-case gain analysis, the sensitivity for each of the uncertain
parameters contribution to the worst-case gain is computed at each frequency point across
the frequency range. Figure 4.16 shows the sensitivity values obtained from the worst-
case gain analysis of the lateral LFT model for each of the uncertain parameter across
the frequency range. The plot in Figure 4.16 shows that three of the different parametric
uncertainties, Ixz∆ (δlat11,12,13,14), Iyy∆ (δlat
15,16) and clδr∆(δlat
2 ), have very small sensitivity
values. This means that these uncertain parameters have very little contribution to the
worst-case gain and removing them (setting them to be zero) will not affect the worst-
case gain of the lateral LFT model significantly. Hence δlat2,11,12,13,14,15,16 are set to zero
and Figure 4.17 shows the result of the worst-case gain for the lateral LFT model with
δlat2,11,12,13,14,15,16 set to zero. The worst case gain obtained is very close to the full uncertain
lateral LFT model with little reduction in the worst-case gain due to simplification of the
uncertain model. The tradeoff of simplifying and removing the parametric uncertainties
from the uncertain lateral model can be clearly seen from Figure 4.17 where the worst-
case gain decreases from upper bound of full uncertain model (no parametric uncertainty
removed) to a minimum bound given by the maximum singular value of the nominal model
(all parametric uncertainties are removed). However, over simplification of the uncertain
model by removing too many of sensitive uncertainties is not desirable as this will decrease
the fidelity of the simplified uncertain model in predicting and representing the actual effect
of uncertainty in the LFT model.
80

100
101
0
5
10
15
20
25
30
35Parametric uncertainty sensitivity
Frequency (rad/s)
Sen
sitiv
ity
δlat
1
δlat2
δlat3
δlat4
δlat5
δlat6
δlat7
δlat8
δlat9,10
δlat11,12,13,14
δlat15,16
δlat17,18
Figure 4.16: Parametric uncertainties sensitivity across frequency
4.4.2 Frequency Domain Uncertainty Representation
Beside using elimination method to simplify the LFT model based on uncertain parameters
sensitivity analysis, another approach for simplifying the LFT model is to approximate the
parametric uncertainties with an unmodeled Linear Time-Invariant (LTI) dynamic uncer-
tainty. This is done by overbounding the real uncertainty perturbation of -1 ≤ ∆ ≤ 1 with
a single complex perturbation of |∆(jω)| ≤ 1. The disadvantage of this approach is that the
uncertainty model may be more conservative as the complex uncertainty perturbation in-
cludes possible plants that might not be in the original set of plants from the real parametric
uncertainty model. However, if there are several real parametric uncertainties in the model,
the conservatism is often reduced by lumping these real parametric uncertainty perturba-
tions into a single complex perturbation as several real uncertainty perturbations region is
often quite “disc-shaped” which is described by a single complex uncertainty region [37].
A commonly used approach of lumping the real parametric uncertainty perturbations to-
81

100
101
7
8
9
10
11
12
13
14
15
16
17
Max
imum
sin
gula
r va
lue
(dB
)
Worst−case gain analysis
Frequency (rad/sec)
Nominal model
δlat2,11,12,13,14,15,16,17,18
= 0
δlat2,5,11,12,13,14,15,16,17,18
= 0
δlat2,5,9,10,11,12,13,14,15,16,17,18
= 0
δlat2,3,5,9,10,11,12,13,14,15,16,17,18
= 0
Full uncertain model
Figure 4.17: Worst-case gain analysis for different number of parametric uncertainty reduc-
tion
gether is to overbound the real parametric uncertainty perturbation region using a single
complex uncertainty perturbation.
4.4.2.1 Overbounding using Unmodeled Liner Time Invariant Dynamic Un-
certainty Model
The tradeoff between uncertainty conservatism and closed-loop system performance mo-
tivates the desire of deriving the tightest overbound in replacing the real parametric un-
certainties using single complex uncertainty model. This has been described by problem
statement of computing optimal uncertainty model using convex optimization in [51–53]
where frequency domain data from different measurements or plants are used for computa-
tion of tight uncertainty model bounds for robust control design purpose. The computation
of tight overbound from frequency domain data has been shown to reduce to a Linear Ma-
trix Inequalities (LMI) feasibility problem in [51] where the objective is to simultaneously
82

search for both a nominal model and uncertainty weighting bound that give optimal un-
certain model with the tightest bound on the data set.
To apply the optimal overbounding technique on the lateral model given in Equation 4.5,
a family of models is generated from the uncertain lateral model by random sampling of the
parametric uncertainties (∆lat2s) so that the family of models covers a wide range of model
responses region described by the real parametric uncertain model. Figure 4.18(a) shows a
frequency domain representation using Nyquist plot for a family of models obtained from
random sampling of the parametric uncertainties. At each of the frequency point in Figure
4.18(a), the family of models covers a complex number region due to different parametric
uncertainties variations in ∆lat2s. Figure 4.18(b) shows an example for the concept of
overbounding at ω = 1.0 rad/s frequency point (corresponds to ω = 1.0 rad/s in Figure
4.18(a)) in the complex plane. The unshaded region bounded by dashed line described the
region with all possible real parametric uncertainties variations from the nominal model
(red ‘x’) at a specific frequency point. Each of the blue ‘x’ in the unshaded region is a
random sampled model from the parametric uncertain model, and the collection of these
sampled models is a family of models. The number of random sampled models should
be large enough so that it provides a good coverage of the entire unshaded region to be
overbounded.
The red circle represents the tightest disc shape overbound that can be computed with
a given nominal model to enclose the entire unshaded region with the objective of achieving
the smallest shaded region. The shaded region represents the models that are not in the
original set of models from the real parametric uncertainty model but has been included in
the overbonding process. The addition of models in the shaded region adds conservatism to
the complex uncertainty model obtained from overbounding. The disc radius Wk gives the
optimal frequency weighting function required to tightly overbound the family of models.
The nominal model used in the lateral LFT model is obtained from the ulinearize process
and this has to be fixed as a constraint in the determination of the tightest overbound
weighting function. This is to ensure that the nominal model used is a feasible trim model
within the desired operating point. In addition, fixing the nominal model used simplifies the
optimization for getting the tightest overbound and provides physically practical uncertain
83

model in this application. Computation of the optimal overbound weighting function Wk
is solved using LMI feasibility problem at each of the frequency point [53].
(a) Nyquist plot of uncertainty regions at different frequencies
(b) Disc overbounding at ω = 1.0 rad/s frequency point
Figure 4.18: Complex plane uncertainty region and disc overbound
Consider an input multiplicative unmodeled Linear Time Invariant (LTI) dynamic un-
certain model used to cover the original set of parametric uncertain model, G∆, given
by:
G∆ = G0(I + W∆) : ‖∆‖∞ ≤ 1
where
• G0 ∈ Rn×m is the known nominal model.
84

• G∆ ∈ Rn×m has no poles on the imaginary axis.
• W ∈ Rn×n is a stable and minimum phase weighting function.
• ∆ is any stable transfer function with magnitude of less than or equal to 1 at each
frequency point.
The family of N sampled models to represent the original parametric uncertain model is
given by:
{G1, G2, . . . , GN}︸ ︷︷ ︸family of N sampled models
⊆ G∆ (4.6)
Hence the problem becomes finding an optimal overbound on the sampled family of models:
{G1, G2, . . . , GN} ⊆ G0(I + W∆), ‖∆‖∞ ≤ 1
With M frequency grid points, at each frequency grid point,
{G1(jωk), G2(jωk), . . . , GN (jωk)} ⊆ G0(jωk)(I + Wk(jωk)∆), ‖∆‖∞ ≤ 1,∀k = 1 : M (4.7)
For each of the model in the family of GN , there exist a solution for Equation 4.7 with
‖∆‖∞ ≤ 1 if and only if
G0(jωk)Wi,k(jωk)W ∗i,k(jωk)G∗
0(jωk)− [Gi(jωk)−G0(jωk)][(Gi(jωk)−G0(jωk)]∗ ≥ 0(4.8)
Applying Schur’s complement formulae to Equation 4.8, the quadratic matrix inequalities
become LMI given by: G0(jωk)Wi,k(jωk)W ∗
i,k(jωk)G∗0(jωk) G0(jωk)][(Gi(jωk)−G0(jωk)]
G0(jωk)[(Gi(jωk)−G0(jωk)]∗ I
≥ 0 (4.9)
The weighting Wi,k is chosen to be block diagonal given by:
Wi,k(jωk)W ∗i,k(jωk) =
W 21 0 0 0
0 W 22 0 0
0 0. . . 0
0 0 0 W 2n
85

The optimization to get the optimal weightings is to solve Semi-Definite Programming
(SDP) problem with objective function:
min Tr(Wi,k(jωk)W ∗i,k(jωk)) (4.10)
subject to LMI constraint in Equation 4.9 for model i = 1:N and frequency point k = 1:M.
More details on the theorem and proofs can be found in [51,53].
To get a stable and minimum phase weighting function W from the computed optimal
weighting function result from Equation 4.10, fitting is done using the optimal weights Wk
obtained across the frequency grids. This is done using fitmagfrd function from Robust
Control Toolbox where different weighting function orders can be used for the fitting. The
entire process of computing optimal frequency domain bounds and fitting them to a stable,
minimum phase weighting function is available in the Robust Control Toolbox’s ucover
function.
The overbounding approach to uncertainty model simplification using input multiplica-
tive uncertainty structure can also be applied to output multiplicative and additive uncer-
tainty structures as well. The focused in this thesis is on the multiplicative uncertainty
structure as it is found to give a less conservative overbound than for the additive uncer-
tainty structure for parametric uncertain model [21].
4.4.2.2 Verification of Uncertain Lateral Dynamics Model using Optimal Un-
certainty Overbound
The optimal overbound computation can be used to compare the size of uncertainty bounds
in different model sets. This can aid in determination if one model set overbounds the other
set or if one uncertain model has a more conservative uncertainty bound than the other.
This will be used here to determine if the lateral dynamic model identified from flight test
data in Section 3.5 is overbounded by the lateral LFT model obtained from the uncertain
nonlinear simulation model. This verification is important and useful because the lateral
LFT model should overbound all the identified models to ensure it contains the actual
flight data derived models. Validation of the flight test data is important for the robustness
analysis using the uncertain nonlinear simulation model and LFT model to be meaningful
in the integrated framework approach. Also, if the lateral LFT model has a big uncertainty
86

bound as compare to the original identified models, this indicates that the LFT model is too
conservative and more flight test data are required to update the parametric uncertainty
bounds in the nonlinear simulation model in order to tighten the uncertainty bounds.
Figure 4.19: Relationship between lateral LFT model and flight test identified models
Figure 4.19 shows the flow chart on the relationship between the lateral LFT model
and the flight test identified lateral models used to update the nonlinear simulation model.
The objective is to find out if the lateral LFT model obtained from the uncertain nonlinear
model overbounds the original set of flight test identified models. To make this comparison,
the nominal model used is the same nominal model that was obtained using averaging in
Section 3.7.1. Also, from the lateral LFT model in Equation 4.4, the uncertainties δlat9 to
δlat18 are fixed at zero so that the lateral LFT model used for comparison contains the exact
same number of states and physical parameters as the identified models. A family of 50
models are randomly sampled to represent the lateral LFT model.
The size of uncertainty region at each frequency point away from the nominal model
across the frequencies (shown in Figure 4.18(a)) is computed using the ucover function
for an input multiplicative uncertainty model structure to obtain the optimal uncertainty
weighting bounds for both the identified lateral models and the family of 50 models sampled
from the lateral LFT model. In both of the cases, the same nominal model is used for
the optimal uncertainty weighting bounds computation. Figure 4.20 shows the plot of the
optimal uncertainty bounds obtained to overbound the aileron and rudder input channels for
the identified lateral models and the family of 50 models to represent the lateral LFT model.
87

From the plot in Figure 4.20, the optimal aileron and rudder input uncertainty bounds
computed across the frequency range for the lateral LFT model is larger than the bounds
computed for the identified models. This indicates that the lateral LFT model has a larger
uncertainty region at each of the frequency point as compared to the identified models. This
means that the lateral LFT model overbounds the flight test identified models and contains
the set of models from the flight test identification. The gap between the uncertainty bounds
for the lateral LFT model and identified models indicates the conservatism of the lateral
LFT model in representing the flight test identified model sets. To reduce this gap, more
flight test data should be collected to update the nonlinear simulation model parametric
uncertainty bounds to help to tighten the gap between the LFT model and the flight test
identified models.
100
101
−15
−10
−5
0
Mag
nitu
de (
dB)
Aileron input
Frequency (rad/sec)
100
101
−10
−8
−6
−4
Mag
nitu
de (
dB)
Rudder input
Frequency (rad/sec)
LFT modelFlight test ID model
Figure 4.20: Input multiplicative uncertainty bounds for lateral LFT model and flight test
identified models
88

Full model uncertainty Physical parameter Lon model uncertainty Lat model uncertainty
δ1 CDδa- δlat
1
δ2 CDδeδlon1 -
δ3 CDδr- δlat
2
δ4 CDmin δlon2 δlat
3
δ5 CL0 δlon3 δlat
4
δ6 CLα δlon4 -
δ7 CDα δlon5 -
δ8 CLδeδlon6 -
δ9,10 CLminD δlon7,8 δlat
5,6
δ11 CLq δlon9 -
δ12 CP - -
δ13 CT δlon10 -
δ14 CYβ δlon11 δlat
7
δ15 CYδr- δlat
8
δ16 clβ δlon12 δlat
9
δ17 clδa- δlat
10
δ18 clδr- δlat
11
δ19 clp - δlat12
δ20 clr - δlat13
δ21 cm0 δlon13 -
δ22 cmα δlon14 -
δ23 cmα δlon15 -
δ24 cmδeδlon16 -
δ25 cmq δlon17 -
δ26 cnβ δlon18 δlat
14
δ27 cnδa- δlat
15
δ28 cnδr- δlat
16
δ29 cnp - δlat17
δ30 cnr - δlat18
δ31 Jmp - -
δ32,33,34 Ixx δlon19,20 δlat
19,20
δ35,36,37,38,39,40 Ixz δlon21,22,23,24 δlat
21,22,23,24
δ41,42,43 Iyy δlon25,26,27 δlat
25,26
δ44,45,46 Izz δlon28,29 δlat
27,28
Table 4.1: Uncertain parameters in full and decoupled models (“-” denotes parameter that
has been eliminated)
89

Chapter 5
Flight Controller Synthesis and
Implementation
The success of autonomous UAV operations depends on the autopilot system for its control,
guidance and navigation tasks. Flight control design without an aircraft mathematical
model is a difficult task. Flight control engineers have to perform manual tuning of the
controller gains during flight testings when no model is available. This is a dangerous
and time-consuming process and is limited to classical single-input, single-output (SISO)
controller design method. The classical controller design approach is attractive because it is
simple to apply and implement. The controller is usually designed by successive closure of
feedback loops from inner angular rate feedback loops to outer tracking loops. However, this
becomes increasingly difficult when more loops are added and requires a significant amount
of time in trial and error tuning process that may not guarantee to obtain a controller with
desired performance.
The availability of plant model permits the use of sophisticated model-based control
design methods for which the designed controller can be easily synthesized and verified in
simulation before any flight test is conducted. Robust multivariable control design tech-
niques are able to handle model uncertainties and allow multivariable controller design in
the presence of signal uncertainties. One particular robust multivariable control design
method, µ synthesis, is popular due to its ability to account for model uncertainty and
performance in the same framework. With increasing computation power of current com-
90

puters and embedded systems, this offers a viable alternative to classical controller design
method.
In this chapter, the H∞ and µ controller synthesis methods are used to design a linear,
multivariable lateral controller using the model and model uncertainty developed in previous
chapters. The focus of the controller synthesis process is the application of model-based
control design software tools as part of the integrated framework environment to provide
a systematic approach for controller synthesis. This helps to bridge the theory-engineering
gap of controller design software tools in producing controllers that are suitable for direct
implementation on the actual system.
5.1 Flight Control Architecture Overview
Autonomous operation of an UAV can be divided into different flight profiles. In any mission
scenario, the UAV will be in autonomous cruise flight phase for majority of its flight time.
In a typical cruise flight phase, the UAV will be flying at a desired cruise flight condition
and performs waypoint navigation with roll angle tracking, airspeed hold, altitude hold and
pitch hold mode engaged. The focus of the controller synthesis work in this section is to
design a roll angle tracking controller operating in a cruise flight condition with airspeed,
altitude and pitch hold modes engaged.
Flight Mode Controller used Function
Airspeed Hold Airspeed controller Tracking of desired airspeed
Altitude Hold Altitude controller Tracking of desired altitude
Pitch Hold Pitch angle controller Tracking of reference pitch angle
and provides pitch rate damping
Roll Tracking Roll angle controller Tracking of reference roll angle
and provides roll and yaw rates damping
Table 5.1: UAV flight modes
The function for each of the flight mode is summarized in Table 5.1. Figure 5.1 shows
the flight control system architecture with various controllers used in the cruise flight phase.
91

Figure 5.1: UAV flight control architecture for autonomous cruise flight
The airspeed controller works in concurrent with the altitude controller to provide tracking
of desired airspeed and altitude. To increase the desired airspeed at a fixed altitude, the
airspeed controller will command a negative pitch angle (θref ) input to the pitch angle
controller. The pitch angle controller will command the elevator control input to pitch the
aircraft nose down. However, with the aircraft nose pitching down, it will decrease the
altitude of the aircraft. In order to maintain at the same altitude, the altitude controller
has to increase the throttle control input so that the aircraft can climb back to the desired
altitude. Therefore, the increase to the throttle input will increase the airspeed of the
aircraft to the new desired airspeed required.
The altitude controller will increase the throttle control input to increase the desired
altitude at constant airspeed. However, increasing the throttle control input increases the
airspeed above the desired airspeed. Therefore, the airspeed controller will increase the
pitch angle demand of the aircraft to slow the aircraft down to the desired airspeed. With
an increase in pitch angle, the aircraft will climb to the new desired altitude required.
The advantages of controlling airspeed and altitude with pitch angle and throttle control
respectively rather than controlling airspeed by throttle control and altitude control by pitch
angle are as follows:
92

• In the event of engine failure, the aircraft will have a gentle descent in altitude without
airspeed and pitch angle controllers destabilizing the aircraft pitch axis. If the altitude
is being controlled by pitch angle command, it will pitch the aircraft nose up when the
aircraft loses altitude and the airspeed is decreasing due to the loss of engine thrust.
This will cause the aircraft to stall, leading to an uncontrollable recovery situation.
• During the cruise flight condition, it is desirable to have a higher control bandwidth
for the aircraft airspeed than the altitude. This is because the small UAV is more
sensitive to wind gust disturbance. Regulation of airspeed using elevator control
surface is faster than using the propulsion system to control the airspeed since there
is time delay in the propulsion system dynamics.
• The use of throttle control for altitude control needs a lower control bandwidth than
using throttle control for controlling the airspeed. This will result in less variation
in throttle control input used. For increase efficiency of the propulsion system and
longer flight duration, it is desirable to keep the throttle at a fixed input with minimum
variation.
5.2 Problem Formulation for Flight Control Synthesis
The flight control synthesis and validation for autonomous cruise flight in this research will
only focus on the synthesis of roll angle controller to limit the thesis work scope. However,
this will not compromise the ability to demonstrate the key concepts, approaches and
methodologies to fulfill the objectives of the research. The control synthesis problem is to
synthesize a lateral axis controller with a specific roll angle tracking and yaw rate damping
requirements. This problem formulation is chosen with the following considerations:
• In a cruise flight condition, the aircraft dynamics can be linearized and decoupled
into longitudinal and lateral-directional modes since the cross-coupling effect between
the two modes is negligible (Section 3.1.1). Based on the flight dynamics model,
large amplitude variation in the longitudinal motion can occur without perturbing
the lateral model states but large lateral motion will affect the longitudinal modes
through nonlinear coupling effects. Hence for lateral axis control synthesis problem,
93

flight test result validation will not be significantly affected by the longitudinal motion
for the flight operating region. Note that the longitudinal axis is controlled by a PID
controller.
• Synthesis of a flight control for lateral axis model poses a more challenging problem
than the longitudinal axis controller. The short-period and phugoid mode for the
longitudinal model are usually well separated with different time-scales. However, for
lateral axis dynamics, the roll and Dutch-roll mode can have almost the same time-
scale. This results in significant coupling effects that makes the lateral axis controller
synthesis problem more challenging.
The objective of the flight control design is to follow the reference roll angle commands
generated by the waypoint guidance controller during the UAV autonomous cruise flight
phase. The synthesis of waypoint guidance controller is not within the scope of the research
and it is assumed that the waypoint guidance is done primary using roll angle commands.
Initially a classical PID controller for roll and pitch angles tracking is implemented
and tuned using flight tests conducted. The pitch angle PID controller is used to provide
stabilization for the longitudinal axis during the flight testing of the synthesized robust roll
angle controller. Subsequently, the roll angle controller will be designed and implemented
using µ controller synthesis.
5.3 Classical Control Design
The standard flight control system is synthesized by successive feedback loops closure to
stabilize and control the aircraft. Usually, inner loop angular rate feedback are used to
stabilize the aircraft and proportional/integral control is used to improve performance.
This design process becomes increasingly difficult when more loops are added to the control
system. This is especially true for multivariable systems. Applying classical control design
technique with successive closure of individual loop requires a significant amount of time
in the trial and error process. Despite the amount of time spent on the design, it may not
guarantee a successful controller design or the designed controller may give poor closed-
loop performance. This motivates the use of model-based control design methods for flight
94

control system design.
This section provides a brief description for roll and pitch angle controllers designs and
implementation using PID controller. Flight tests were conducted to manual tune the PID
controllers based on Zigler-Nichols method to obtain suboptimal controllers for the cruise
flight condition.
5.3.1 Controller Architecture
The flight control architecture is presented in Figure 5.1. The PID roll and pitch angle
controllers synthesized to track reference command angles (φref , θref ) and provide damping
in the closed-loop system are shown in Figure 5.2. An anti-windup reset is used for each
integrator to keep the integrator effort small during saturation to improve the transient
flight characteristics of the design. The anti-windup reset works by setting the integrator
to zero when the output from the controller has reached its saturation limit.
5.3.2 Controller Tuning
The roll and pitch angle PID controllers are tuned during flight testing based on Zigler-
Nichols tuning approach. The tuning objective is to synthesize a stable suboptimal con-
troller with minimum emphasis on the controller optimality for good closed-loop perfor-
mance. The roll angle controller is tuned first since large amplitude variations in the lateral
axis can affect the longitudinal mode. Tuning of the pitch angle controller is easier after
the lateral axis is stabilized with the roll angle controller. The procedures for tuning and
testing the roll angle controller are:
1. Set the reference roll angle command to zero. Tune the controller to achieve a wing-
leveled flight. The aircraft is manually piloted to a wing-leveled flight before the roll
angle controller is engaged. During the controller tuning, if the wings start to oscillate
rapidly (more than 1.5 Hz), the KPφand KDφ
feedback gains are reduced. If the wings
oscillate slowly (less than 1 Hz), the KIφfeedback gain is reduced. Over a longer time
period of wing-leveled flight, if the aircraft wings do not hold its wing-leveled flight
well, the KIφfeedback gain is increased. During the tuning process of the roll angle
95

(a) Roll angle PID controller
(b) Pitch angle PID controller
Figure 5.2: Roll and pitch angle PID controllers
controller, the RC pilot needs to provide elevator, rudder and throttle control inputs
to stabilize and control the aircraft to remain at cruise flight operating condition.
2. The aircraft is manually piloted to different initial roll angle positions from wing-
leveled flight before the roll angle controller is engaged. The PID gains are tuned
again so that the roll angle controller is able to bring the aircraft back to stable wing-
leveled flight position with acceptable transient response of small roll angle overshoot
of 2 to 5 degrees and setting time of between 2 to 3 seconds.
3. The reference roll angle command is varied in real-time by the RC pilot using the
RC control box and the controller gains are tuned for dynamic reference roll angle
tracking. Figure 5.3(a) shows the roll angle tracking performance of the tuned roll
angle controller obtained.
96

Once the roll angle controller has been tuned, the pitch angle controller is tuned with
the roll angle controller loop closed and the roll angle reference command set to zero. The
tuning procedures for the pitch angle controller is similar to the roll angle controller tuning,
which are as follows:
1. Set the pitch angle reference command to zero to tune the controller during straight
and wing-leveled flight with zero pitch angle. With the roll angle controller engaged,
the aircraft is manually piloted to a straight and wing-leveled flight before the pitch
angle controller is turned on. During the controller tuning, if the aircraft starts to
have rapid pitch oscillations (more than 1.5 Hz), the KPθand KDθ
feedback gains
are reduced. If the pitch oscillations are slow (less than 1 Hz), the KIθfeedback
gain is reduced. Over a longer time period of straight and wing-leveled flight, if the
aircraft starts to pitch up or down, the KIθfeedback gain is increased. During the
tuning process with the roll and pitch angle controllers engaged, the RC pilot needs
to provide throttle control input to regulate the aircraft airspeed.
2. The aircraft is manually piloted to different initial nose up or nose down pitch angles
flight conditions before the pitch angle controller is engaged. The PID gains for the
pitch angle controller are tuned during this process so that the pitch angle controller
is able to control the aircraft back to stable leveled flight position with setting time
of between 2 to 3 seconds.
3. The reference pitch angle command is varied in real-time by the RC pilot and the
pitch angle controller gains are tuned for dynamic pitch reference command tracking.
Figure 5.3(b) shows the pitch angle tracking performance result of the tuned pitch
angle controller.
5.4 Model-based Controller Synthesis
The roll angle controller is redesigned in this section using a model-based controller synthe-
sis technique. Model-based controller synthesis approaches take advantage of the models of
the aircraft in the integrated framework for synthesis and validation of the designed con-
troller. This provides a standard procedure for controller synthesis and validation during
97

0 1 2 3 4 5 6 7 8 9 10 11−30
−20
−10
0
10
20
30
time (s)
φ (d
eg)
Roll angle tracking
φ
ref
φactual
(5 runs)
(a) Roll angle controller tracking
0 1 2 3 4 5 6 7 8 9 10 11−30
−20
−10
0
10
20
30
time (s)
θ (d
eg)
Pitch angle tracking
θ
ref
θactual
(5 runs)
(b) Pitch angle controller tracking
Figure 5.3: Tracking performance of roll and pitch angle PID controllers
the flight control development. Two model-based methods for controller synthesis, H∞ and
µ synthesis methods, from the robust control are used. The H∞ and µ synthesis techniques
are mixed-sensitivity controller design technique that allows conflicting design objectives to
optimally satisfy various design objectives through usage of different weighting functions in
the controller synthesis formulation. Hence, the selection of appropriate weighting functions
is very important for successful H∞ and µ controller designs.
5.4.1 Control Design Specifications
The selection of weighting functions for H∞ and µ controllers synthesis is based on the
desired control design specifications. The performance objectives of the roll angle controller
is to provide accurate tracking of reference roll angle commands generated by the waypoint
guidance controller and roll and yaw rate dampings in the lateral axis. These objectives
are challenging because tracking of roll angle commands will cause a yaw in the opposite
direction (adverse yaw) due to the aerodynamic coupling between the roll and yaw axes of
the aircraft, which opposes the performance objective of providing yaw rate damping during
the roll angle commands tracking. The performance criteria for the roll angle control design
are as follows:
• Track roll angle reference commands (φref ) with less than 6 degrees tracking error
98

for up to 1 rad/s bandwidth. The rise time for the roll angle tracking should be less
than 2.5 seconds.
• The yaw rate coupling should be less than 25 deg/s across all frequencies.
• The control effort should stay within the control surfaces saturation limits at all times.
• The controller should be robust and achieve desired performance objectives for all
values of the model uncertainties described in the aircraft uncertainty modeling in
Chapter 4.2.
5.4.2 Problem Formulation and Weighting Functions Selection
The roll angle control design problem is formulated as a standard signal-based H∞ controller
design problem where different design specifications are achieved simultaneously. This
reduces the control design problem to optimization problem where the norm size of the
error signals is to be kept small subjected to different external signals that affect the UAV
system.
Weighting functions are used to shape the frequency content information for the input
exogenous signals and output error signals to achieve the desired design specifications. It
helps to normalize and weight each of the requirements so that the controller synthesis
problem is well-posed. Weighting functions are also used to incorporate model uncertainty
into the controller design process. Figure 5.4 shows the control design interconnection
with the weighting functions and reference model used for the signal-based H∞ roll angle
controller synthesis. The selection of the weighting functions and reference model in the
system interconnection are described in the following sections.
5.4.2.1 UAV lateral model
The UAV lateral model used is a three states state-space model obtained from flight test
system identification as described in Section 3.1.2.
p
r
φ
=
Lp Lr 0
Np Nr 0
1 0 0
p
r
φ
+
Lδa Lδr
Nδa Nδr
0 0
δa
δr
(5.1)
99

Figure 5.4: System interconnection for H∞ controller synthesis
The control and stability parameters used in Equation 5.1 are given in Appendix Table
B.2. For H∞ controller synthesis, only the nominal value of the parameters are used.
However in the µ synthesis design technique, the parameter uncertainty values between
lower and upper bounds are used to describe uncertainty variations in the model.
5.4.2.2 Actuator model
The actuator models, ACT 1 (rudder servo actuator) and ACT 2 (aileron servo actuator),
describe the dynamics for the servo actuators used in the Ultrastick aircraft. The outputs
from the actuator model are the angular rate and angle deflections. The aileron and rudder
servo actuators are the same and are modeled by first order dynamics which mainly accounts
for actuator time lag. The actuator time lag is approximated to be 20 ms (from Section
2.2.4). Hence, the angular rate and angle deflection outputs from the actuators are described
by the transfer functions:
δa,r =50s
s + 50, δa,r =
50s + 50
100
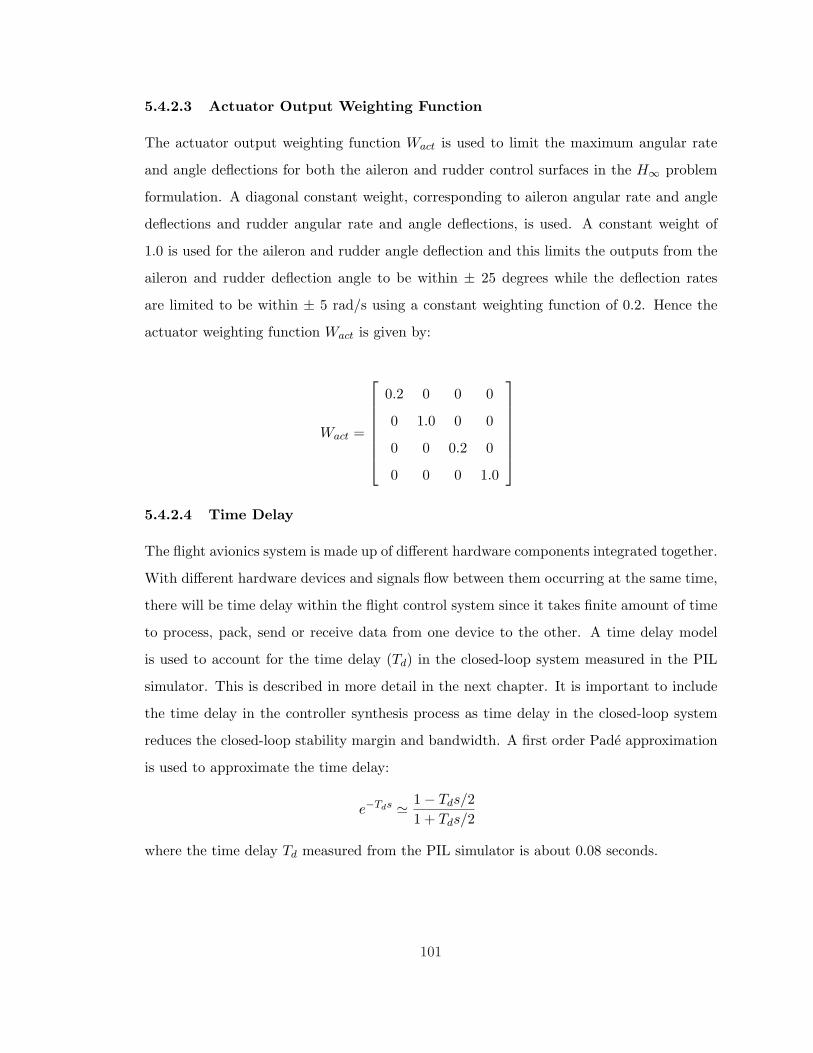
5.4.2.3 Actuator Output Weighting Function
The actuator output weighting function Wact is used to limit the maximum angular rate
and angle deflections for both the aileron and rudder control surfaces in the H∞ problem
formulation. A diagonal constant weight, corresponding to aileron angular rate and angle
deflections and rudder angular rate and angle deflections, is used. A constant weight of
1.0 is used for the aileron and rudder angle deflection and this limits the outputs from the
aileron and rudder deflection angle to be within ± 25 degrees while the deflection rates
are limited to be within ± 5 rad/s using a constant weighting function of 0.2. Hence the
actuator weighting function Wact is given by:
Wact =
0.2 0 0 0
0 1.0 0 0
0 0 0.2 0
0 0 0 1.0
5.4.2.4 Time Delay
The flight avionics system is made up of different hardware components integrated together.
With different hardware devices and signals flow between them occurring at the same time,
there will be time delay within the flight control system since it takes finite amount of time
to process, pack, send or receive data from one device to the other. A time delay model
is used to account for the time delay (Td) in the closed-loop system measured in the PIL
simulator. This is described in more detail in the next chapter. It is important to include
the time delay in the controller synthesis process as time delay in the closed-loop system
reduces the closed-loop stability margin and bandwidth. A first order Pade approximation
is used to approximate the time delay:
e−Tds ' 1− Tds/21 + Tds/2
where the time delay Td measured from the PIL simulator is about 0.08 seconds.
101

5.4.2.5 Washout Filter
The roll angle controller commands the rudder to provide yaw damping at high frequency
during the roll angle tracking maneuver. A washout filter is added to the yaw rate sensor
feedback path to aid the controller. A washout filter is simply a high pass filter that only
allows high frequencies signal to go through while attenuating low frequencies signal. The
transfer function of the washout filter is given by:
s
s + ωw
where ωw (rad/s) is the cutoff frequency that the yaw rate signal will be attenuated such
that the roll angle controller will not provide any yaw rate feedback during steady turn.
The cutoff frequency is selected as 15 rad/s.
5.4.2.6 Sensor Noise
A constant weight is used in the controller synthesis process to model the gyros noise for roll
and yaw angular rate sensor measurements fed back to the controller. The weight is selected
based on three standard deviation bound (99.7 % confidence interval) of the gyros noise.
The sensor roll and yaw gyros noise standard deviation, published in [54], is 8.73 × 10⁻²
rad/s. Therefore the three standard deviation noise bound is 0.03 rad/s. Hence the sensor
weight used is:
Wn =
0.03 0
0 0.03
5.4.2.7 Model Reference
A reference model is used to define the ideal response of the closed-loop roll angle tracking
response. The ideal response is prescribed by the specifications required by the waypoint
guidance controller which provides the reference roll angle commands. A second order
reference model is used to provide a smooth reference roll angle command for the roll angle
tracking controller. A rise time of 2.2 seconds is chosen to provide a reasonable bandwidth in
the reference roll angle command. A damping ratio of 0.75 is selected to have an overshoot
of less than 3 % in the reference roll angle command from the reference roll angle command
102

generated by the waypoint guidance controller. The second order model reference is given
by:
Mref =0.669
s2 + 1.227s + 0.669
5.4.2.8 Performance Weighting Functions
Performance weighting functions, Wp1 and Wp2, are used to shape the roll angle and
yaw angular rate tracking error responses to achieve the desired closed-loop performance
specifications. Wp1 is used to keep the mismatch between the reference roll angle command
and the actual aircraft roll angle small at low frequencies with small steady-state error. The
controller should roll-off at high frequencies since tracking of reference roll angle command
is not required at high frequencies due to the low frequency reference command signals from
the waypoint navigation controller. Large model uncertainty at high frequencies is another
reason why the performance should decrease below 1 around the loop-bandwidth. Since
the rise time of the roll angle reference command is set to 2.2 seconds using the reference
model, good tracking of the roll angle reference command signals is required from 0 to 1
rad/s. The accuracy of the AHRS roll angle attitude solution obtained is approximately ±5 degrees. Hence a steady-state reference roll angle tracking error of less than 6 degrees is
desired. The weighting function used is:
Wp1 =2.5(s + 40)
s + 10
This has a low frequency gain of 10 for up to 1 rad/s which gives a roll angle tracking error
of less than 5.7 degrees.
Wp2 is used to penalize the amplitude of the yaw angular rate with the yaw rate
reference, rref , set to zero. The weighting function used is:
Wp2 =1
0.15
The Wp2 weight is used to limit the yaw angular rate to be less than ± 25 deg/s across all
frequencies range.
103

5.4.3 H∞ and µ Controller Synthesis
This section describes H∞ and µ synthesis techniques with the system interconnection
defined in Figure 5.4 to compute H∞ and µ synthesis controllers.
5.4.3.1 H∞ Controller Synthesis
Figure 5.5: Configuration for H∞ controller synthesis
The system interconnection defined in Figure 5.4 can be put into a general feedback
design problem configuration shown in Figure 5.5. M represents the system interconnection
structure in Figure 5.4, K is the feedback controller, u is a vector of control inputs from
the controller, v is a vector of measurement signals, w is a vector of exogenous input signals
and z is a vector of errors to be kept small to meet the control design objectives.
The closed-loop transfer function from w to z is given by the linear fractional transfor-
mation:
z = Fl(M,K)w
The H∞ controller synthesis for the general configuration in Figure 5.5 is to find all stabi-
lizing controllers K which minimize
‖ Fl(M,K) ‖∞= maxω
σ(Fl(M, K)(jω))
This problem has been solved efficiently by using algorithms in [55] for a sub-optimal H∞
controller with:
‖ Fl(M,K) ‖∞< γ
by reducing the value of the γ iteratively. The optimality of the designed controller is
dependent on the minimum γ obtained in the synthesis. Therefore the suboptimal H∞
104

controller synthesis problem is to find all stabilizing controllers K with γ less than γmin
where γmin is the minimum value of ‖ Fl(P, K) ‖∞ over all stabilizing controllers K [37].
The Matlab function hinfsyn is used to compute a sub-optimal H∞ controller for the
H∞ synthesis problem describes above using γ-iteration [39]. The H∞ synthesis procedure
uses only the nominal plant model in Figure 5.4 without model uncertainty. The controller
design objective is to find a sub-optimal controller that balances the tradeoff in achiev-
ing required closed-loop performance and small state order controller that is feasible to
implement in the flight computer system.
5.4.3.2 µ Synthesis
Figure 5.6: Configuration for µ controller synthesis
The µ synthesis process differs from the H∞ controller synthesis process as it is able
to synthesize robust controllers with model uncertainty included into the synthesis process.
Figure 5.6 shows the general framework for µ synthesis. The system interconnection in
Figure 5.4 can be rearranged to match the inputs, outputs, uncertainty perturbations and
controller in this framework. M represents the system interconnection structure in Figure
5.4, K is the feedback controller, u is a vector of control inputs from the controller, v is a
vector of measurement signals, z and w are inputs and outputs to and from the uncertainty
block, d is a vector of exogenous input signals and e is a vector of errors to be kept small
to meet the control design objectives.
The µ synthesis makes use of the results from the structure singular value µ to find the
controller that minimizes a given µ condition. The details of the structure singular value
105

can be found in [56]. The µ synthesis problem is to find a controller K that minimizes [57]
infK
supω
µ(Fl(M(jω),K(jω))) (5.2)
However, calculation of the µ value is NP-hard and the minimization problem is reformu-
lated as a minimization of the upper bounds of the structured singular value that includes a
real, rational, stable, minimum phase transfer function D(jω) [58]. The synthesis problem
is rewritten to find a stabilizing controller K and a scaling matrix D that minimizes:
‖ D(jω)Fl(M(jω),K(jω))D−1(jω) ‖∞ (5.3)
The minimization problem in Equation 5.3 can be solved using alternative minimization
with K and D parameter that combines H∞ and µ synthesis. This iteration approach is
called “D-K iteration”. The details of the D-K iteration can be found in [56].
The Matlab function dksyn in the Robust Control Toolbox is used for the µ synthesis
problem for the system interconnection in Figure 5.4. The dksyn command generates a ro-
bust controller through minimizing the µ value using D-K iterations and solving a sequence
of scaled H∞ controller problems to achieve the robust performance of the closed-loop sys-
tem associated with uncertain plant model [39]. A sub-optimal µ controller, rather than an
optimal µ controller, is desired . This is because the order of the controller grows rapidly
with D-K optimization and results to a high order controller that makes the controller
implementation in the flight computer system difficult.
5.5 Controller Implementation
The controllers obtained from H∞ and µ controller synthesis procedures are continuous time
state-space controllers that are useful for testing and analysis within the Matlab/Simulink
environment. To successfully implement these controllers on the embedded flight computer
system, some important implementation issues have to be addressed. These involve simpli-
fying the high order controller to a low order controller, converting the continuous controller
to discrete-time form that is suitable for digital implementation, coding the discrete-time
controller for real-time implementation and addressing controller saturation problems. Fig-
ure 5.7 shows the flow chart for the controller implementation process.
106

Figure 5.7: Controller implementation process
5.5.1 Controller Order Reduction
The H∞ and µ controller synthesis tools tend to produce relative high order state-space
controller. The order of the controller obtained will be at least equal to the order of the
plant used for the synthesis. With the inclusion of weighting functions, this further increases
the controller order. A complex and high order controller hinders its implementation on a
low computation power flight computer system. It is necessary to perform controller order
reduction to have a simple and low order controller to reduce the computation requirement
on the embedded flight computer.
The objective of controller order reduction is to generate a lower order controller such
that the reduced order controller preserves the behavior of the original design with little
degradation of the closed-loop system stability and performance in the frequency range of
interest.
To achieve these objectives, the controller model reduction process must not signifi-
cantly change the input-output response of the controller. This is done by removing states
that are both less controllable and observable. The Hankel singular values of the system
provide a measure of both controllability and observability for each of the state at the same
time. A large Hankel singular value means that the state is both highly controllable and
observable. Therefore, the states with small Hankel singular values can be removed from
the controller state. The Hankel singular values of the controller can be computed using a
107

balance realization of the controller state-space model in which the controllability and ob-
servability Gramians are equal [37]. The balreal command from Matlab’s Control System
Toolbox is used for the balance realization computation.
Two main approaches to model reduction used are truncation and residualization. In
truncation, the states that are to be removed are simply discard. In residualization, the
states that are to be removed will have their derivatives set to zero. Subsequently, these
states are solved in terms of states that are to be retained with the control input state.
The residualization process helps to preserve steady-state gain of the controller. Hence,
controller model reduction via truncation often provides a closer match at higher frequency
range while residualization will match better at lower frequency range and steady-state [48].
For the roll angle controller, the frequency range of interest is tracking performance in
the low frequency range. Therefore the residualization method is used for controller order
reduction. The residualization can be done using modred command from Matlab’s Control
System Toolbox with the state elimination method chosen to match DC gain.
The procedure for controller order reduction is to perform a balance realization of the
controller state-space model and determine which are the states that can be reduced based
on the Hankel singular values. Next, residualization is carried out to reduce the controller
model order by removing the states with small Hankel singular values. This process is
commonly known as balanced residualization.
5.5.2 Controller Discretization
In implementation of the controller using digital flight computer system, the continuous-
time controller obtained from the reduced order controller requires discretization for digital
implementation. The discrete-time controller behaves differently from the continuous-time
controller as it samples measurement inputs and updates control outputs at equal sam-
ple time step. The control output signals are held constant until the next update. With
smaller sampling step, the discrete-time controller approximates the continuous-time con-
troller more closely. However, as the sampling time get smaller, more computation power
is required to perform more frequent controller updates. On the other hand, too large
sampling time degrades the performance of the controller because the discrete-time con-
108

troller deviates from the continuous-time controller. This can cause the closed-loop system
response to be oscillatory and unstable. Therefore the sampling time for discretization is
very important for good performance behavior of the implemented digital controller on the
flight computer system.
The update rate for the digital controller implementation is chosen to be 25 Hz and
this gives a sampling time of 0.04 seconds. The sampling rate is chosen such that it is
faster than the roll mode of the aircraft (time constant of approximately 0.08 seconds
from Section 3.5.1.1) but still keep the flight computer within a reasonable computational
load. Therefore the continuous-time controller is discretized with sampling time of 0.04
seconds using Matlab c2d command with a first-order hold method. The first-order hold
discretization method is preferred because it provides a linear interpolation between the
input sampled data and does not introduce additional time delay to the discretized system
unlike zero-order hold method which has a half-sample time delay [59].
5.5.3 Controller C Code Implementation
The synthesis and discretization of the controller in Matlab environment are performed
using double precision floating-point math. The implementation of digital controller in the
flight computer system is done easily with floating point unit since the MPC 555 flight
computer uses a 32-bits floating point processor. This is one of the main advantages of
using the MPC 555 flight computer over other fixed-point processors as it minimizes the
quantization effects and allows for easy and fast floating point math computation.
The implementation of the state-space controller with C code programming is simple
and straight forward. With the continuous-time reduced model controller obtained from
Section 5.5.1 of the form given by:
xc = Acxc + Bcuc
yc = Ccxc + Dcuc (5.4)
109

where xc contains the states of the reduced order controller and
uc =
p
rref − r
φref − φ
, yc =
δa
δr
Applying a first-order hold discretization to Equation 5.4, the discrete-time state-space
representation of the controller is given by:
xc(k + 1) = Akcxc(k) + Bk
c uc(k)
yc(k) = Ckc xc(k) + Dk
c uc(k) (5.5)
where xc(k) contains the states of the controller at k time step, Akc , Bk
c , Ckc , Dk
c are the
discrete-time state-space matrices obtained from the c2d command, and
uc(k) =
p(k)
rref (k)− r(k)
φref (k)− φ(k)
, yc =
δa(k)
δr(k)
The discrete-time state-space controller in Equation 5.5 is implemented on the flight com-
puter system using C programming language. The C code is implemented through simple
matrix multiplication and addition of the state dynamics and output equations in each of
the time step with sensor feedback inputs obtained from the sensor data packet.
5.5.4 Anti-windup Scheme
The actuator control surfaces used on the UAV have displacement limits given in Appendix
Table A.4. Control surfaces saturation occur when the control signal outputs exceed these
saturation limits. Once this happens, the flight control system command does not actuate
the control surfaces anymore and this effectively becomes an open feedback path. If the
control signal continues to applied to the state integrator in Equation 5.5, the integrator
action will keep winding up until an opposite sign error signal starts to unwind the integrator
[60]. This results in poor performance and poses stability problem for the closed-loop
system.
A simple anti-windup scheme is used for the aileron and rudder control surfaces to pre-
vent severe stability and performance degradation problems in event when control surfaces
110

saturation happen. Figure 5.8 shows the implementation of anti-windup scheme. Kδa and
Kδr are the anti-windup gains used for feeding back windup from the roll angle controller
when control outputs δa and δr exceed the actuator limits. These gains are chosen to be
large enough such that the feedback loops keep the windup small when the actuators are
saturated. The gains selected are Kδa = 0.01 and Kδr = 0.01.
Figure 5.8: Anti-windup implementation
5.6 µ Controller Synthesis and Implementation
In this section, details for the µ roll angle controller synthesis and implementation on
the flight computer are presented. The controller synthesis uses the uncertainty modeling
results in Chapter 4.2. The µ controller is tested and validated in the next chapter using
the integrated framework environment. Input multiplicative uncertainty model obtained
from overbounding the uncertain lateral model is used for the µ synthesis. Since H∞
controller synthesis follows the same controller synthesis procedures except that the model
used contains no model uncertainty, it will not be presented here.
111

5.6.1 Input Multiplicative Uncertainty Model
The lateral UAV model with input multiplicative uncertainty (Figure 5.9) used for µ con-
troller synthesis is obtained using unmodeled LTI dynamic uncertainty model overbounding
approach described in Section 4.4.2. The family of N sampled models in Equation 4.6 repre-
senting the lateral parametric uncertainty model in Equation 4.5 is obtained by 50 random
samplings of the original parametric model. Figure 5.10 shows the plot of the 50 random
sampled models. A second order weighting function is synthesized to overbound these 50
sampled models with an input multiplicative uncertainty model. Figure 5.11 shows the
Bode magnitude plot of the second order weighting function obtained from the ucover
command overbounding. The weighting functions obtained are:
Wail =0.312s2 + 10.7s + 33.3
s2 + 28.7s + 77.5, Wrud =
0.295s2 + 5.08s + 40.1s2 + 14.4s + 42.1
(5.6)
Figure 5.9: Lateral UAV model with input multiplicative uncertainty
5.6.2 µ Controller Synthesis
The µ controller is synthesized using the system interconnection defined in Figure 5.4 with
input multiplicative uncertainty models obtained in Equation 5.6. The D-K controller
synthesis gives a controller of 31 states with γ value of 0.857 and peak µ value of 0.817.
The 31 states µ controller obtained from µ synthesis has too high state order for imple-
mentation on the flight computer system and has to be reduced to a lower order controller.
Figure 5.12 shows the plot of the Hankel singular values for the 31 states µ controller. The
112

−60
−40
−20
0
20
From: δa
To:
p
100
102
−50
−40
−30
−20
−10
0
10
20
To:
r
From: δr
100
102
50 sampled models
Frequency (rad/sec)
Mag
nitu
de (
dB) nominal model
50 sampled models
Figure 5.10: 50 random sampled lateral models
plot shows that all the 31 poles are stable and a large number of states have very little
contribution to the input/output behavior of the controller. Therefore the states with state
energy less than 0.01 are eliminated.
After the states elimination, the reduced order controller has only 8 states. Figure
5.13 shows the Bode magnitude diagram of the original 31 states and the reduced 8 states
controller. In the low frequency region below 2 rad/s, the Bode magnitude plot matches
very well for the original and reduced order controller. For frequency range up to 10 rad/s,
the original and reduced order controller are almost the same, except for the yaw rate input
to rudder output channel.
5.6.3 Robust Analysis
Robust analysis is performed with the system interconnection shown in Figure 5.4 with
the original and reduced order µ controller. The UAV lateral model used in this analysis
is the real parametric uncertainty model given in Equation 4.5. Figure 5.14 shows the
113

10−1
100
101
102
−11
−10
−9
−8
−7
Mag
nitu
de (
dB)
δa input
Frequency (rad/sec)computed min bound
2nd order overbound
10−1
100
101
102
−15
−10
−5
0
Mag
nitu
de (
dB)
δr input
Frequency (rad/sec)
Figure 5.11: Input multiplicative uncertainty model overbound weights
plots for robust stability and performance analysis. Robust stability analysis result of the
full and reduced order controller in Figure 5.14 shows no significant difference between
the original 31 states controller and the reduced 8 states controller. Hence, reduction in
the controller state orders using the residualization model reduction technique for a low
order controller does not affect the closed-loop system stability with model uncertainty
perturbations. The µ values for both the original and reduced order controller are less than
0.6 in the frequency range of interest. This indicates that robust stability is achieved and
the controllers stabilizes the complete set of uncertain model.
Robust performance analysis for the full and reduced order controller shown in Figure
5.14 indicates that the reduction of controller orders does not affect the closed-loop system
performance robustness with model uncertainty perturbations. Within the frequency range
of interest, the peak µ values for the full and reduced order controller are less than 1,
indicating that the controllers achieved their desired performance with complete set of
model uncertainty perturbations. In summary, the robust analysis results show that the
114

0 5 10 15 20 25 300
1
2
3
4
5
6Hankel Singular Values (State Contributions)
State
Sta
te E
nerg
y
Stable modes
Figure 5.12: Hankel singular value plot of the 31 states µ controller
reduced order controller has similar closed-loop robustness performance as that of the full
order controller with model uncertainty perturbations. Hence the reduced order controller
preserves the same behaviors as that of the original full order controller and the reduced
order controller is used in the controller implementation.
5.6.4 Controller Implementation
For discrete-time digital controller implementation, the reduced order continuous-time µ
controller is being discretized with a sampling time of 0.04 seconds using the first order hold
method. This gives a discrete-time state-space controller with 9 by 9 Akc matrix, 9 by 3 Bk
c
matrix, 2 by 9 Ckc matrix and 2 by 3 Dk
c matrix in Equation 5.5 for C code programming
implementation. The implemented C controller will be tested in the integrated framework
developed in the next chapter.
115

−80
−60
−40
−20
0
From: p
To:
δ a
10−1
100
101
−70
−60
−50
−40
−30
−20
−10
0
To:
δ r
From: r
10−1
100
101
From: φ
10−1
100
101
Bode diagram of original and reduced controller
Frequency (rad/sec)
Mag
nitu
de (
dB)
Original
Reduced
Figure 5.13: Bode diagram of original and reduced order controller
100
101
0
0.1
0.2
0.3
0.4
0.5
0.6
0.7
0.8
0.9
µ va
lue
µ upper bound for robust analysis
Frequency (rad/s)
Robust stability: Full order controllerRobust stability: Reduced order controllerRobust performance: Full order controllerRobust performance: Reduced order controller
Figure 5.14: Robust stability and performance analysis
116

Chapter 6
Flight Control System Testing and
Performance Validation in
Integrated Framework
The proof of success in any flight control system design is achieving design specifications
with the controller implemented in flight test. Flight test validation represents the actual
assessment of whether the flight control system design meets the design requirements in
the true environment and verifies if the design requirements used are practical and achieve
the desired system objectives.
However, flight trials are resource intensive and expensive. With modern flight control
system getting more complex, there is a need to use other validation approaches to support
and augment the flight control validation process. The ability to update and improve the
accuracy of the aerodynamics and system model in a high fidelity simulation model provides
an attractive approach to augment the current flight control validation process. The use of
simulation-based testing is critical to reducing the cost and time spent in the development
of UAV systems.
Simulation-based testing helps to save time and effort prior to actual flight trials as
it helps to validate the proper operation of flight control law, software and hardware im-
plementation within the bench test environment. This helps to ensure that the flight
117

control system has high integrity and is bug free prior to flight tests. However, the suc-
cess of simulation-based validation depends on the accuracy of simulation model used in
representing the actual physical system. This clearly requires the simulation model to be
validated against the actual system for the simulation-based testing to be valid. Hence, the
main emphasis of the flight test is in the validation of the models used for simulation and
controller performance and robustness testings.
In this chapter, the flight controller developed in Chapter 5 undergoes a series of sys-
tematic performance validation testing before the synthesized controller is implemented in
the UAV system for actual flight testings. Details of the setup used for the integrated
flight control development tests, software and hardware-in-the-loop testings, are covered.
Performance validation flight tests are conducted to test the synthesized controller. Flight
test results are used to compare with the simulation-based test results.
6.1 Integrated Framework for Flight Control Development
Testing
The integrated framework for flight control development provides a systematic and pro-
gressive test environment for testing the synthesized controllers. Figure 6.1 shows the four
progressive steps involved in testing of flight controllers. In each setup steps, different as-
pects and issues of controller synthesis and implementations are tested and verified. This
provides an easy way of debugging and identifying any design or implementation issues
within the development cycle. Hence it is important to know the differences between each
of the test setups to better identify the source of the problem. For example, if good per-
formance is achieved in software-in-the-loop (SIL) testing but the same controller results
in poor performance in processor-in-the-loop (PIL) testing, the reason for the poor perfor-
mance in PIL test environment might not be due to poor controller rather a characteristics
of the PIL was not modeled correctly. For example, it might be due to a time delay issue
in the PIL testing which is absent in the SIL test setup.
During the controller testing process, the model and control design are updated iter-
atively to achieve the desired closed-loop performance objectives. This tight integration
118

between the controller synthesis and testing using the model developed provides validation
for both the synthesized controller and the model developed at the same time.
Figure 6.1: Integrated framework for flight control development testing
6.1.1 Initial Design Testing
Initial design testing is the first step used to test the synthesized controller. The discrete-
time controller (obtained from Section 5.5.2) is implemented in Simulink to validate the
closed-loop performance with the nonlinear simulation model. This testing verifies the
designed controller is able to meet the design requirements.
6.1.2 Software-in-the-loop Testing
The second step is implementation of the controller in C code as an embedded S-function
block. The controller can now be tested via SIL testing in the Matlab/Simulink environ-
ment. The purpose of the SIL testing is to validate the correctness and implementation of
the controller C code implementation.
6.1.3 Processor-in-the-loop Testing
The PIL testing is used to test the successful C code controller from SIL testing to the actual
flight computer in the third step. This provides an actual test of the implemented flight
control codes in the actual flight computer processor. In addition to the flight control code
running on the embedded processor, other software sub-modules of the autopilot system
119

Figure 6.2: Flight control development testing architecture: Initial design, software-in-the-
loop and processor-in-the-loop testing
such as attitude determination algorithm, data acquisition and telemetry communication
modules are running at the same time to form a complete functional, standalone autopilot
system. The differences between SIL and PIL testing are:
• SIL testing uses perfect attitude data (φ, θ and ψ) but the PIL testing uses attitude
data from real-time AHRS attitude determination algorithm.
• SIL testing uses exact control commands output from the flight control algorithm
to provide closed-loop control with the simulation model. In the PIL testing, the
flight computer system outputs actual PWM control signals to the servo actuators.
A counter/timer data acquisition board is used to acquire the controller commands
for closed-loop control of the simulation model.
120

• PIL testing is carried out with flight computer system and simulation model operating
in real-time with serial communication and data acquisition board interfaces. The
hardware components in the system may result in time delays associated with each
of the hardware devices or processes. However in SIL testing, no external hardware
components are involved and all the processes run on a single simulation environment
with a single clock time.
6.1.4 Flight Testing
Flight testing provides actual test of the complete flight control system and the nonlinear
simulation model in real flight environment. The exact flight control code that was used
in the PIL testing is implemented in the UAV flight computer system for flight testing.
The flight test provides dynamic response of the UAV with environmental disturbance
factors such as wind gust effect. This data is used to validate the simulation model and the
performance of the flight control system implemented.
6.2 Processor-in-the-loop Simulator
The PIL simulator provides an intermediate step to test the synthesized controller on actual
hardware target processor before the controller is put on actual flight test. This approach
offers the following advantages:
• Ability to test and identify controller implementation issues before flight testing. This
helps to determine controller implementation limitations on actual hardware system
and provides important information for controller redesign.
• Provides a real-time environment for testing synthesized controllers.
• Provides a good testbed for hardware and software system integration so that the
functionality of components can be tested at a system level. This helps ensure the
integrated system has high integrity and free of fault.
• Provides simulation environment for RC pilots and flight test engineers to prepare,
train and understand the scope of flight trial and gains confidence with the UAV
121

system.
Beside testing, debugging and validating flight control design and implementation, the
PIL simulator can be used for post-flight analysis such as validating simulation model used
with updated flight test data. Once the simulation model has been sufficiently validated,
it can be used to augment and substitute many of the flight test trials and helps to reduce
the risk and development cost for the UAV systems.
6.2.1 PIL Simulator System Setup
The PIL simulator setup is an extension of SIL setup that includes actual embedded tar-
get processor (flight computer) and flight simulator display. During the simulation, the
simulation environment outputs sensor data through a communication link to the target
processor that executes the embedded software code in real-time. The flight computer uses
the fed back sensor data to generate control signals which are sent back to the simulation
model using another communication link to control the aircraft simulation model. Hence
the software simulation and flight computer formed a closed-loop control system (as shown
in Figure 6.3).
Figure 6.3: Overview of PIL simulation concept
6.2.1.1 PIL Software System Architecture
The PIL simulation model uses the same nonlinear simulation model as in the SIL testing.
For the simulation model to execute in real-time on desktop computer, Real-Time Win-
dows Target (RTWT) toolbox is used. The RTWT software provides real-time execution
of the generated C code to run on Windows operating system. The generated C code
is able to interact with external hardware systems using the input/output (I/O) devices
122

within the desktop computer. The entire C code generation and binary executable file are
automatically generated with RTWT toolbox [61].
The I/O blocks from RTWT toolbox are added to the nonlinear aircraft simulation
model developed in Chapter 2. These I/O blocks, stream data output, stream data input
and PWM DAQ (shown in Figure 6.4), allow the simulation model to interface with the
data inputs and outputs to the flight computer and simulator. The stream data input
uses the User Datagram Protocol (UDP) to send data to the flight simulator while the
stream data output block uses serial communication protocol to send sensor data to the
flight computer. The PWM DAQ block acquires control signals from the flight computer
using a timer/counter board in the desktop computer. Figure 6.4 shows the Simulink block
diagram layout used for the auto-code generation in the PIL simulation. For auto-code
generation, a discrete sampling time has to be defined and it is set to 0.02 seconds. This is
the maximum time step size that can be used so that the PIL simulator can output sensor
data at 50 Hz, which is the same data output rate used in the actual IMU/GPS sensor.
Figure 6.4: PIL simulator Simulink block architecture
6.2.1.2 PIL Hardware System Architecture
The PIL hardware system setup is duplicate of the actual flight computer system on the
UAV except for the IMU/GPS sensor and data modem. Figure 6.5 shows the architecture
of the hardware system setup. The desktop computer runs both the RTWT simulation
123

and FlightGear flight simulator programs in real-time. The FlightGear flight simulator
receives simulation data using UDP communication at 5 Hz from the RTWT simulation.
Serial communication port 1 provides serial sensor data output at 50 Hz with 38.4 Kbps
baud rate to the MPC 555 flight computer while the timer/counter board provides servo
commands inputs to the simulator via desktop PCI bus.
The failsafe board is a multiplexer board used to switch the PWM control output signals
to the servo actuators between manual pilot and autopilot mode using the RC transmitter.
This functionality allows the PIL simulator to simulate the same scenario as in the actual
flight test where the RC pilot performs manual flight before switching to autopilot mode
during the flight to test the autopilot system. The ground control station allows monitoring
of real-time flight data from the flight computer. The flight data can be recorded for analysis
purpose. Figure 6.6 shows the PIL simulator system.
Figure 6.5: PIL simulator hardware system setup
124

(a) PIL station (b) PIL hardware system
Figure 6.6: PIL simulator setup
6.2.2 PIL System Operation Verification
The objective of the PIL simulator is to provide a realistic representation of the actual
UAV system operation. To determine how well the simulator performs and its limitations,
verification of the system operation has to be done. This verification focuses on three
important areas of the PIL system setup that are critical for its successful operation in
representing the actual system.
• Sensor output data from simulator to flight computer
• Control input data from flight computer to simulator
• Time delay of simulator closed-loop system
6.2.2.1 Verification of Sensor and Attitude Solution Data
The UAV Simulink nonlinear simulation outputs sensor data with the same packet structure
as that of actual IMU/GPS sensor unit. These data are packed and sent through serial
communication port to the flight computer which acquires the data and performs real-
time attitude determination. Figure 6.7 shows part of inertia sensor data output from the
nonlinear simulation model that are sent through serial communication port to the flight
computer system. The φ, θ and ψ euler angles from the nonlinear simulation are not sent
to the flight computer. This is because in the actual UAV system operation, these data are
not measured from the sensor but are obtained using the attitude determination algorithm.
125

In SIL testing, the inertia and Euler angles data obtained from the nonlinear simulation
model are used directly. However in PIL testing, the Euler angles are estimated using
the AHRS attitude determination algorithm and the angular rates and linear accelerations
have their biases removed. These bias estimates are obtained from the AHRS algorithm.
If the AHRS algorithm performs poorly and calculates very different Euler angles and bias
estimates, the result will be the SIL and PIL controller testing outputs being different. The
cause of this mismatch would not due to controller synthesis and implementation problem
but rather the AHRS algorithm problem.
Figure 6.7: Sensor and attitude solution outputs in PIL simulator
Figure 6.8 shows a comparison of sensor data (currently used by the flight control
algorithm) between the nonlinear simulation model output (p, q, r, φ and θ) and the flight
computer system output (p, q, r, φ and θ). The angular rates data match perfectly since no
sensor noise is used in the simulation. However, for the roll and pitch angle, there are some
differences in the estimated Euler angles given by the AHRS algorithm as compared to the
“truth” Euler angles output from the nonlinear simulation model. This slight differences in
the Euler angles will result to some slight differences to the Euler angle tracking responses
126

between the SIL and PIL results. The difference between the two has nothing to do with
the controller design or implementation. The addition of attitude determination algorithm
in the PIL testing results in additional dynamics in the PIL simulator closed-loop system
as compared to the SIL testing setup.
10 15 20 25 30 35 40
−50
0
50
p (d
eg/s
)
10 15 20 25 30 35 40
−20
0
20
q (d
eg/s
)
10 15 20 25 30 35 40
−20
0
20
time (s)
r (d
eg/s
)
Nonlinear simulation model outputAHRS output
(a) Angular rates
10 15 20 25 30 35 40−40
−20
0
20
40
60
φ (d
eg)
10 15 20 25 30 35 40−10
0
10
20
time (s)
θ (d
eg)
Nonlinear simulation model outputAHRS output
(b) Euler angles
Figure 6.8: Comparison of nonlinear simulation model and AHRS algorithm angular rates
and Euler angles
6.2.2.2 Verification of Control Input Data
The control input signals generated by the flight computer system are used to drive the
servo actuators that actuate the aerodynamic control surfaces. These control signals are
in the form of PWM signals. For control actions to control the UAV simulation model
in closed-loop, the PWM control signals have to be acquired by the timer/counter data
acquisition card (shown in Figure 6.5). It is important to ensure that the control signals
generated by the flight computer system are accurately acquired into the simulation model
for closed-loop control. Figure 6.9 shows details of the control signal flow diagram and
signal conversion in the PIL simulator. To verify that the control signals output from the
flight computer system are the same as that acquired into the simulation model, control
signals at C1 and C2 (Figure 6.9) are recorded during closed-loop PIL testing.
Figure 6.10 shows plot of two control signals, aileron and elevator control, at C1 and
C2. Note that this plot does not account for time delay between the measurement point
127

Figure 6.9: Control signal flow diagram
at C1 and C2. The time delay effect will be addressed in the next section. From the plot,
the aileron and elevator control signals at C1 and C2 matches perfectly. This verifies that
the control signals output from the flight computer system are accurately acquired into the
simulation model for closed-loop PIL testing.
6.2.2.3 PIL Simulator Closed-loop System Time Delay
The PIL simulator is made up of different hardware components integrated together. With
different hardware devices and signals flow between them occurring at the same time, there
will be time delay within the simulator since it takes finite amount of time to process,
pack, send or receive data from one device to the other. For closed-loop control in the PIL
simulator, this aggravates the time delay problem since the feedback action goes through a
daisy chain with all the devices in a loop. For example, the simulation model has to send
out sensor data to the flight computer before the flight computer can generate the required
control signals to the failsafe board and subsequently the failsafe board has to send the
control signals to the timer/counter board before the control signals are acquired back into
the simulation model for closed-loop control.
The time delay effect for a closed-loop control system is important as it reduces the
stability margin and bandwidth of the closed-loop system. In the PIL simulator setup, the
time delay effect will impose a limitation on testing of the controllers since a large time
128

20 25 30 35
−0.2
−0.1
0
0.1
δ a [−1
to 1
]
20 25 30 350.15
0.2
0.25
time (s)
δ e [−1
to 1
]
Control signal at C2Control signal at C1
Figure 6.10: Verification of control signals in PIL simulator
delay in the simulator will limit the ability to test high bandwidth controllers. Also, for
the H∞ and µ controllers that are to be tested using the PIL simulator, the time delay in
the simulator has to be included during the controller synthesis.
The time delay to be determined is the time required for a signal generated from the
simulation model to be sent to the flight computer system, process the data and sent back
to the simulation model. During the time delay measurement, the simulation model and
flight computer system are configured to execute the same simulation and flight control
routines to ensure that the simulator is using the same computation load as in normal PIL
testing. The approach used to measure the time delay is to add an addition toggle logic
in the flight control algorithm such that once it receives the toggle signal, it will send a
control signal back to the simulation model. The toggle signal used to toggle this logic in
the flight computer system is sent from the simulation model. This allows the time history
of outgoing toggling signal and incoming control signal to be measured and recorded using
a common time stamp within the simulation environment. The time delay between the
outgoing toggle signal and the incoming control signal is the closed-loop time delay for the
129

PIL simulator.
Figure 6.11 shows time history plot of the toggle signal and control signal that are
measured in the simulation environment. The time gap between the start of the toggle
signal and time where the incoming control signal changes is the time delay for the closed-
loop process. The time delay measured is approximately 0.08 seconds. The measured time
delay is associated with the total time delay of the closed-loop system. This approach
is unable to identify a time delay in each of the process. Therefore it is impossible to
know if majority of the time delay is contributed from the flight computer system hardware
components used or from the additional components, such as timer/counter board, used in
the PIL simulator.
7.92 7.94 7.96 7.98 8 8.02 8.04 8.06 8.08 8.1 8.120.3
0.4
0.5
0.6
0.7
0.8
0.9
Tog
gle
& c
ontr
ol s
igna
ls
time (s)
Control input signalToggle ouput signal
Control input signal changes
Time delayToggle ouput
signal changes
Figure 6.11: Time delay measurement in PIL simulator
It is assumed that the time delay measured from the PIL simulator is the same in the
actual UAV system. This assumption is made because it is not possible to measure the
time delay in the same way with the actual UAV system using the current instrumentation
onboard of the UAV. However, since the PIL simulator setup duplicates almost all the
hardware components used on the UAV system, it is reasonable to expect that the time
delay for the flight control system of the UAV should not be very different from the PIL
130

simulator system.
6.3 Integrated Framework Flight Control Synthesis and Val-
idation
In this section, the modeling, simulation and analysis framework developed will be inte-
grated together for validation of designed controllers. The task of controller synthesis and
validation are closely related since it is an iterative process to design and validate the de-
signed controller to achieve the required performance specifications. Different incremental
levels of controller testing and validation are performed using the integrated framework.
This will be illustrated with the µ roll angle controller from Chapter 5.
6.3.1 Flight Test Validation Setup
A well-designed validation experiment is necessary to provide a realistic and consistent set
of test conditions across different levels of controller testing within the integrated frame-
work. This helps to provide a direct and meaningful comparison for closed-loop system
performance results and gives useful information for controller redesign if necessary.
6.3.1.1 Design of Reference Command Signal
The performance objective for the roll angle controller design is to provide reference roll
angle (φref ) tracking. In this case, a filtered doublet reference roll angle is used to provide a
smooth and piecewise continuous reference roll angle tracking signal as oppose to a normal
doublet signal (φdbt). This approach is taken for practical controller testing in the actual
flight test and also for practical application of tracking a smooth reference roll angle. A
second order low pass filter, with rise time of 0.7 second and damping of 0.85, smoothes
the doublet command. The transfer function of the filter is given by:
TFφdbt→φref=
6.612s2 + 4.371s + 6.612
The amplitude of the roll angle demand is chosen to be± 20 degrees so that it remains within
the controller designed operating envelope. The period of the doublet signal is selected to
131

be 2.5 seconds so that this will provide a signal with excitation frequency content (Equation
3.10) less than the maximum frequency limit of the identified model used in the controller
design. Figure 6.12 shows the difference between normal and filtered doublet reference roll
angle commands.
1 2 3 4 5 6 7 8 9 10−25
−20
−15
−10
−5
0
5
10
15
20
25
time (s)
φ (d
eg)
Normal and filtered doublet φ command signal
φdbt
φref
Figure 6.12: Normal and filtered φ doublet commands
To ensure a consistence and repeatable reference command signal is being input during
all the tests, the φref signal profile is pre-programmed and generated by the flight computer
system. Figure 6.13 shows time history of φref signal designed for the validation experiment.
This form of φref signal profile is commonly used during UAV waypoint navigation flight.
The φref signal is divided into 3 parts:
• 0 ≤ t < 2 seconds: The φref is zero. This is to provide zero roll angle reference
tracking for the roll angle controller as well as achieving a wing-leveled flight before
the filtered doublet roll angle command is executed.
• 2 ≤ t < 9 seconds: The filtered doublet roll angle command is executed. This provides
a dynamic reference roll angle tracking for the designed controller.
• 9 ≤ t < 11 seconds: The φref is zero. This is to command the UAV back to wing-
132

leveled flight again to complete the validation experiment which the RC pilot can
easily assume manual control of the UAV at a trim position.
0 1 2 3 4 5 6 7 8 9 10 11−30
−25
−20
−15
−10
−5
0
5
10
15
20
25
time (s)
φ (d
eg)
φref
command for flight control validation
φref
doubletφref
=0 φref
=0
Figure 6.13: Time history of φref used for validation experiment
6.3.1.2 Validation Test Setup
Beside using an exact sequence of φref command for all the validation experiments, the
flight conditions and setup of the experiments have to be the same so that the controller
tracking performance can be compared between different sets of validation experiment. In
the SIL and PIL testing, this can be easily configured in the simulation setup. However, for
actual flight testing, it is not easy to have the same flight conditions. This is because there
are ambient environment factors such as wind gust disturbance that cannot be controlled
during the flight test. These environmental disturbances are difficult to include in the
SIL and PIL testing since it is not easy to measure these variables during the flight tests.
Hence, precautions are taken to conduct the flight tests with minimal deviation from the
flight conditions used in the SIL and PIL testing.
The flight conditions used in the validation experiment is given by the desired operating
condition in Table 3.1. The sequence of φref command starts when the autopilot system is
133

engaged by the RC pilot. In the autopilot mode, the PID pitch angle controller described
in Section 5.3.1 is engaged so that this helps to provide a zero pitch angle flight condition
while the roll angle controller is tracking the φref command. The only control that the RC
pilot has while the autopilot is engaged is the throttle control. This is used to regulate the
UAV airspeed so that it is able to maintain at the desired airspeed condition throughout
the flight test.
6.3.2 Initial Design Testing
The first level of controller testing is done using the discrete-time reduced order µ controller
from Section 5.6.4 implemented into the flight control Simulink block. Closed-loop Monte-
Carlo simulation runs with model uncertainty perturbations are performed. Figure 6.14
shows the φ angle tracking result obtained from 50 simulation runs. The result shows that
the designed controller is able to track the φref command well with about 0.5 seconds time
delay.
0 1 2 3 4 5 6 7 8 9 10 11−30
−20
−10
0
10
20
30
time (s)
φ (d
eg)
Initial design testing roll angle tracking
φ
ref
φactual
(50 runs)
Figure 6.14: φ angle tracking for initial design testing
134

6.3.3 Software-in-the-loop Testing
The same reduced order µ controller is implemented in C and embedded into the Matlab’s
S-function block for SIL testing. 50 Monte-Carlo simulation runs are performed with the
uncertain nonlinear simulation model. Figure 6.15 shows the result of the φ angle tracking.
The SIL φ angle tracking performance obtained is almost the same as the result obtained
from the initial design testing. The result indicates that the controller implemented in C
is correct and the implemented C code can be port to the flight computer system for PIL
testing.
0 1 2 3 4 5 6 7 8 9 10 11−30
−20
−10
0
10
20
30
time (s)
φ (d
eg)
SIL roll angle tracking
φ
ref
φactual
(50 runs)
Figure 6.15: φ angle tracking for SIL testing
6.3.4 Processor-in-the-loop Testing
The C implementation of the controller successfully tested in the SIL testing was complied
with the full autopilot program code and uploaded into the MPC 555 flight computer system
for PIL testing. The PIL testing is done in the exact same manner as in actual flight test
where the RC pilot needs to fly the aircraft in the manual mode, trim the aircraft and
switch over to autopilot mode to test the controller. The setup of the PIL simulator flight
environment is exactly the same as that in the simulator parameter tuning described in
135

Section 2.2.1.4.
Automated Monte-Carlo simulation runs used in the initial design and SIL testing can-
not be used in PIL testing as the flight computer system is running the actual standalone
autopilot routine that cannot be reset instantaneously for each different Monte-Carlo sim-
ulation run. Therefore manual variation of model uncertainty conditions was performed in
each of the PIL testing run.
Selective model uncertainty conditions are chosen for the PIL testing to limit the number
of PIL testing runs. The worst-case gain analysis tools described in Section 4.3.1 is used
to determine the closed-loop system worst-case gain condition due to model uncertainty
perturbations. This helps to provide the worst-case model uncertainty conditions for the
PIL testings.
Figure 6.16 shows result of the worst-case gain analysis of the closed-loop system using
the system interconnection in Figure 5.4 with parametric uncertainties in the UAV lateral
model. For frequency range between 0.5 to 10 rad/s, 10 different combinations of parameter
values result to the worst-case gain condition at each of the frequency point within this
frequency range. Hence, these combinations are chosen and used for the PIL testings.
Figure 6.17 shows the result obtained from PIL testings using each of the combination
of uncertainty parameters at the worst-case gain. The roll angle tracking performance
obtained is similar to the result obtained from the SIL testing.
6.3.5 Flight Testing
Flight test of the UAV was conducted with the exact same autopilot program code tested
in the PIL testing. The conduct of the flight test is carried out in the same way as the PIL
testing, where the RC pilot needs to fly and trims the aircraft before engaging the autopilot
at desired operating condition. Multiple test runs with the controller are carried out during
the flight test. In each of the run, the RC pilot trimmed the aircraft in the direction of
head wind so that the controller is tested in a minimal cross-wind condition.
Figure 6.18 shows the roll angle tracking performance obtained from the flight test runs
where t = 0 s (origin) is the time the autopilot is engaged. The initial roll angles from
all the runs are different since this is dependent on how well the RC pilot managed to
136

100
101
−20
−10
0
10
20
30
40
50
60
70
Freq (rad/s)
Par
amet
ric u
ncer
tain
ty v
alue
Parametric uncertainty value at worst−case gain condition
L
da
Ldr
Lp
Lr
Nda
Ndr
Np
Nr
Figure 6.16: Parametric uncertainty values of closed-loop system at worst-case gain condi-
tion
0 1 2 3 4 5 6 7 8 9 10 11−30
−20
−10
0
10
20
30
time (s)
φ (d
eg)
PIL roll angle tracking
φref
φactual
(10 runs)
Figure 6.17: φ angle tracking for PIL testing
trim the aircraft to wing-leveled flight before engaging the autopilot. However, regardless
of the initial roll angle positions, the roll angle controller is able to track the reference
command signal, similar to the responses obtained from the initial design, SIL and PIL
137

testing. Repeatable and consistent tracking responses are achieved for the five different
flight test runs shown in Figure 6.18. The only difference between the flight test results and
the initial design, SIL and PIL testing results is that some high frequency oscillations are
observed in the flight test roll angle tracking responses. This might be due to other external
disturbances or high frequency model dynamics not accounted for during the controller
synthesis or captured by the model used. Nevertheless, the flight testing result still have
good matching with the initial design, SIL and PIL testing. This result helps to validate:
1. Performance of the synthesized controller using the model developed achieves the
control design tracking performance objective.
2. Model and model uncertainty developed have adequate fidelity for the controller syn-
thesis and analysis purposes .
3. Framework used for control synthesis and validation is feasible and achieves its in-
tended objectives.
0 1 2 3 4 5 6 7 8 9 10 11−30
−20
−10
0
10
20
30
time (s)
φ (d
eg)
Flight test roll angle tracking
φ
ref
φactual
(5 runs)
Figure 6.18: φ angle tracking for flight testing
138

6.4 Applications of Integrated Framework for Performance
Analysis
The integrated framework used provides a generic framework and tools for generic flight
controller synthesis, validation and analysis applications. This section will illustrate an ex-
ample application of the integrated framework for validating performance of a H∞ controller
design.
In this setup, two different H∞ roll angle tracking controllers are designed and imple-
mented using the same setup (weighting functions and performance objectives) described
in Section 5.4 with nominal UAV lateral model. One of the H∞ controllers is designed
to have a better performance with γ of 1.0 while the other H∞ controller has a worse off
performance with γ of 1.6. The γ values are chosen such that the better controller will be
able to achieve the design performance objectives while the poor controller will not be able
to achieve the design performance objectives. The controllers are implemented using the
same procedures described in Section 5.5. For each of the implemented discrete-time con-
troller, the controller is reduced to a forth order controller so that both of the implemented
controllers have the same order for making a fair comparison.
Prior to the integrated framework testings, robust analysis is performed on the two
controllers to analyze the robustness of the controllers subjected to real parametric model
uncertainty perturbations in Appendix Table B.5. Figure 6.19 shows the result for the
robust analysis. From the robust stability analysis plot in Figure 6.19, both the controllers
are robustly stable to the real parametric uncertainty perturbations across the frequen-
cies. However, the robust performance analysis plot in Figure 6.19 shows that the poor
performance controller has µ value of more than 1 in the low frequencies region. The in-
terpretation of µ greater than 1 in robust performance analysis means that with the real
parametric uncertainty variations, the closed-loop system is not able to achieve its perfor-
mance objectives. This means that the closed-loop system has poor low frequency tracking
performance. This is expected because even with the nominal model, the poor performance
controller is not able to achieve its performance objectives since it is designed with γ value
of more than 1.
139

100
101
0
0.2
0.4
0.6
0.8
µ va
lue
µ upper bound for robust stability analysis
100
101
0
1
2
3µ upper bound for robust performance analysis
µ va
lue
Frequency (rad/s)
K with γ = 1.6K with γ = 1.0
Figure 6.19: Robust analysis of H∞ controllers with γ of 1.0 and 1.6
Next, the two H∞ controllers are tested using the integrated framework developed to
validate their closed-loop performance in SIL and flight tests. The same validation setup
described in Section 6.3.1 is used for the tests.
In the SIL tests, 50 Monte-Carlo simulation runs are performed with the uncertain
nonlinear simulation model for each of the controller in the closed-loop. Figure 6.20(a) and
6.20(b) show the SIL roll angle tracking performance with the good (γ = 1.0) and poor
(γ = 1.6) performance controller respectively. The poor performance controller shows poor
roll angle tracking performance (Figure 6.20(b)) with large steady-state error as compared
to the better performance controller (Figure 6.20(a)). This is consistent with the designed
γ value since controller with γ value of 1.6 has a poor performance as compared to the
controller with γ value of 1. Both the controllers shows stable closed-loop roll angle tracking
responses in Figure 6.20(a) and 6.20(b) and this is consistent with the robust stability
analysis results where the µ values are less than 1 across the frequencies of interest, which
means that the closed-loop systems are stable with model uncertainty variations.
The two controllers are loaded onto the UAV flight computer and flight tested using the
140

1 2 3 4 5 6 7 8 9 10−30
−20
−10
0
10
20
30
time (s)
φ (d
eg)
SIL testing roll angle tracking [H∞ controller with γ = 1.0]
φ
ref
φactual
(50 runs)
(a) SIL test (γ = 1.0)
1 2 3 4 5 6 7 8 9 10−40
−30
−20
−10
0
10
20
30
time (s)
φ (d
eg)
SIL testing roll angle tracking [H∞ controller with γ = 1.6]
φ
ref
φactual
(50 runs)
(b) SIL test (γ = 1.6)
1 2 3 4 5 6 7 8 9 10−30
−20
−10
0
10
20
30
time (s)
φ (d
eg)
Flight test roll angle tracking [H∞ controller with γ = 1.0]
φ
ref
φactual
(5 runs)
(c) Flight test (γ = 1.0)
1 2 3 4 5 6 7 8 9 10−40
−30
−20
−10
0
10
20
30
time (s)
φ (d
eg)
Flight test roll angle tracking [H∞ controller with γ = 1.6]
φref
φactual
(5 runs)
(d) Flight test (γ = 1.6)
Figure 6.20: SIL and flight test result of H∞ controllers
same procedure described in Section 6.3.5. Figure 6.20(c) and 6.20(d) show the flight test
results of the roll angle tracking performance with the good (γ = 1.0) and poor (γ = 1.6)
performance controllers respectively. The flight test results show good matching with the
SIL testing results. Comparing the SIL testing (Figure 6.20(a)) and flight test results (Fig-
ure 6.20(c)) for the good performance controller, both the plots show the same responses.
The same result is observed with the worse off performance controller tests in Figure 6.20(b)
(SIL testing) and 6.20(d) (flight test). For both of the controllers, the SIL testing results are
able to predict and match the actual flight test results well. Again, this shows and proves
the success in the integrated framework developed for control synthesis and validation.
141

Chapter 7
Conclusion and Recommendations
7.1 Summary
This thesis presented the development of an integrated framework for flight control synthesis
and validation with practical application to a small UAV testbed. The main aim of the
research is to develop a systematic approach in integrating different processes in model-
based flight control development using advance techniques and design tools from initial
design to flight testing of the UAV.
The field of disciplines involved in this research is very wide. This includes mathematical
modeling of the air vehicle, software and hardware system integration of the UAV system,
simulator analysis tools development, flight test system identification and flight control
system design. Extensive efforts have been spent in the past 4 years in the development
of the integrated framework and procedures to support the UAV flight control system
development.
In the aircraft modeling, a 6-DOF nonlinear simulation model was developed based on
first principle theory. Moment of inertia measurement experiments and flight simulator
parameters tuning were conducted to determine the physical parameters of the vehicle
required in the nonlinear simulation model.
To improve the fidelity of the simulation model used, flight test system identification
was conducted to update the aerodynamic coefficients in the simulation model. A linear
parameterized state-space model was used for time-domain maximum likelihood parameter
142

estimation. Model validation in time and frequency domain of the identified models us-
ing flight test validation data showed good matching within the frequency range of input
excitation signal used which was derived from the design of experiment. The identified
parameters were used to update the aerodynamic coefficients in the nonlinear simulation
model by removing the dimensions from these identified parameters.
Parametric uncertainty modeling was used to model the experimental derived paramet-
ric uncertainties into the nonlinear simulation model. A systematic approach was provided
to model these parametric uncertainties into the nonlinear simulation model so that an
LFT model can be extracted using ulinearize procedure. This approach provides a physi-
cally meaningful parametric uncertainties in the LFT model. The details of the principles,
procedures, accuracy and limitations in using ulinearize for the LFT realization have been
presented. Since the LFT model obtained from the ulinearize realization contains a large
number of parametric uncertainties, two methods of LFT model simplification, sensitivity
analysis and frequency domain overbounding approach, have been proposed to reduce the
complexity of the LFT model.
For the flight control synthesis, a flight control architecture was proposed for the UAV
autopilot system. In the controller synthesis problem, an autonomous cruise flight condition
was chosen. Classical PID controllers were first implemented and manually tuned using
flight tests. The roll angle controller was subsequently redesigned using both H∞ and µ
synthesis with specific performance specifications using the model and model uncertainty
developed. The synthesized controller was implemented on the embedded flight computer
system. Various practical and important controller implementation issues have also been
discussed.
To validate the performance of synthesized controllers, the integrated framework de-
veloped was used for testing and validation of the controllers. The framework provides
a systematic and progressive approach to test the controllers before the controllers were
tested in actual flight tests. The SIL and PIL testings provide good prediction for the
closed-loop tracking performance obtained from flight tests. This helps to validate the
model and model uncertainty used in the integrated framework as well as validating the
performance of the controllers that were designed
143

The proposed integrated framework for synthesis and validation of flight control system
has been successfully applied and demonstrated on the small UAV system and this achieves
the objectives of the thesis work.
7.2 Recommendations
The current process of controller C code implementation to the embedded flight computer
system was done using manual coding. It is desirable to use autocode generation for this
process so that it will expedite the controller C code implementation process as well as
minimize error in the controller C code implementation.
The validation approach used in this work is based on time domain comparisons of the
closed-loop tracking responses. This approach does not provide any quantitative result for
the validation process. A better performance validation metric for model, model uncer-
tainty and closed-loop performance needs to be developed to address this problem. This
performance validation metric can be extended to real-time flight test validation so that
the controller performance can be validated online during flight test.
The flight test system identification performed in this work is limited to two-state lateral
model due to the limitation of the current sensor package used on the UAV. A better sensor
package with better attitude determination algorithm will help to improve the parameter
estimation with a four-state lateral model. This will help to update and improve the fidelity
of the nonlinear simulation model.
144

Bibliography
[1] H. Chao, Y. Cao, and Y. Chen, “Autopilots for small fixed-wing unmanned air vehicle:
A survey,” IEEE International Conference on Mechatronics and Automation, pp. 3144–
3149, 2007.
[2] D. Jung and P. Tsiotras, “Modeling and hardware-in-the-loop simulation for a small
unmanned aerial vehicle,” AIAA Guidance, Navigation and Control Conference and
Exhibit, no. 2007-2768, 2007.
[3] I. Kaminer, O. Yakimenko, V. Dobrokhodov, and K. Jones, “Rapid flight test proto-
typing system and the fleet of UAVs and MAVs at the naval postgraduate school,”
Proceedings of the 3rd AIAA Unmanned Unlimited Technical Conference, 2004.
[4] J. Renfrow, S. Liebler, and J. Denham, “F-14 flight control law design, verification
and validation using computer aided engineering tools,” Proceedings of the Third IEEE
Conference on Control Applications, vol. 3, pp. 359–364, 1994.
[5] M. Tischler, Advances in aircraft flight control. Taylor and Francis Ltd, 1996.
[6] M. Civita, G. Papageorgiou, W. Messner, and T. Kanadeo, “Design and flight testing
of a high-bandwidth H∞ loop shaping controller for a robotics helicopter,” AIAA
Guidance, Navigation and Control Conference and Exhibit, no. 2002-4836, 2002.
[7] E. Hallberg, J. Komlosy, T. Rivers, M. Watson, D. Meeks, I. K. J. Lentz, and O. Yaki-
menko, “Development and application of a rapid flight test prototyping system for
unmanned air vehicle,” International Congress on Instrumentation in Aerospace Sim-
ulation Facilities, pp. 26.1–26.10, 1999.
145

[8] R. Smith, G. Dullerud, S. Rangan, and K. Poolla, “Model validation for dynamically
uncertain systems,” vol. 3, no. 1, pp. 43–58, 1997.
[9] N. M. Jodeh, P. A. Blue, and A. A. Waldron, “Development of small unmanned aerial
vehicle research platform: Modeling and simulating with flight test validation,” AIAA
Modeling and Simulation Technologies Conference and Exhibit, no. 2006-6261, 2006.
[10] eCos. Homepage. [Online]. Available: http://ecos.sourceware.org/
[11] J. S. Jang and D. Liccardo, “Automation of small UAVs using a low cost MEMS sensor
and embedded computing platform,” Crossbow Technology Inc., Tech. Rep.
[12] Phytec. MPC555 microcontroller datasheet. [Online]. Available:
http://www.phytec.com/products/sbc/PowerPC/phyCORE-MPC555.html
[13] Crossbow. Micronav sensor datasheet. [Online]. Available:
http://www.xbow.com/Products/Product pdf files/Inertial pdf/uNAV Datasheet.pdf
[14] Maxstream. XTend RF data modem datasheet. [Online]. Available:
http://www.digi.com/products/wireless/long-range-multipoint/xtend-module.jsp
[15] Horizon Hobby. Spektrum DX7 RC radio system datasheet. [Online]. Available:
http://www.spektrumrc.com/Products/Default.aspx?ProdID=SPM2710l
[16] Reactive Technologies. RxMux failsafe switch datasheet. [Online]. Available:
http://reactivetechnologies.com/RxMux.html
[17] Anticyclone System. Antilog RS232 serial datalogger datasheet. [Online]. Available:
http://www.anticyclone.myzen.co.uk/product antilog.html
[18] Unmanned Dynamics. Aerosim blockset homepage. [Online]. Available:
http://www.u-dynamics.com/aerosim/default.htm
[19] Unmannned Dynamics LLC, Aerosim Blockset Version 1.2 User’s Guide,. -, 2003.
[20] R. Nelson, Flight Stability and Automatic Control. McGraw-Hill Sci-
ence/Engineering/Math, 1997.
146

[21] Y. C. Paw and G. J. Balas, “Uncertainty modeling, analysis and robust flight control
design for a small UAV system,” AIAA Guidance, Navigation, and Control Conference,
no. 2008-7434, 2008.
[22] M. Abdulrahim and R. Lind, “Control and simulation of a multi-role morphing micro
air vehicle,” AIAA Guidance, Navigation and Control Conference and Exhibit, no.
2005-6481, 2005.
[23] B. Owens, D. Cox, and E. Morelli, “Development of a low-cost sub-scale aircraft for
flight research: The FASER project,” AIAA Aerodynamics Technology and Ground
Testing Conference, no. 2006-3306, 2006.
[24] FlightGear. Homepage. [Online]. Available: http://www.flightgear.org/
[25] Horizon Hobby. Power 25 outrunner motor specifications. [Online]. Available:
http://www.horizonhobby.com/Products/Default.aspx?ProdID=EFLM4025A
[26] MotoCalc. Homepage. [Online]. Available: http://www.motocalc.com/
[27] K. Kotwani, S. Sane, H. Arya, and K. Sudhakar, “Experimental characterization of
propulsion system for mini aerial vehicle,” 31st National Conference on Fluid Mechan-
ics and Fluid Power, pp. 671–678, 2004.
[28] M. P. Merchant, “Propeller performance measurement for low reynolds number un-
manned aerial vehicle applications,” Master’s thesis, Wichita State University, 2004.
[29] B. Mettler, Identification Modeling and Characteristics of Miniature Rotorcraft.
Springer, 2002.
[30] M. Tischler and R. Remple, Aircraft and rotorcraft system identification: Engineering
methods with flight-test examples. AIAA, 2006.
[31] R. V. Jategaonkar, Flight Vehicle System Identification: A time domain Methodology.
AIAA, 2006.
[32] V. Klein and E. A. Morelli, Aircraft system identification: Theory and Practice. AIAA,
2006.
147

[33] L. Ljung, System Identification: Theory for the user. Prentice Hall, 1999.
[34] E. A. Morelli, “Flight test of optimal inputs and comparison with conventional inputs,”
Journal of Aircraft, vol. 36, no. 2, pp. 389–397, 1999.
[35] J. L. Crassidis and J. L. Junkins, Optimal Estimation of Dynamic Systems. Harpman
& Hall/CRC, 2004.
[36] T. M. Foster and W. J. Bowman, “Dynamic stability and handling qualities of small
unmanned-aerial-vehicle,” AIAA Aerospace Sciences Meeting and Exhibit, no. 2005-
1023, 2005.
[37] S. Skogestad and I. Postlethwaite, Multivariable feedback control: Analysis and Design.
Wiley, 2005.
[38] C. M. Belcastro, “Uncertainty modeling of real parameter variation for robust control
applications,” Ph.D. dissertation, Drexel University, 1994.
[39] G. Balas, R. Chiang, A. Packard, and M. Safonov, Robust Control Toolbox 3 User’s
Guide. The MathWorks, 2007.
[40] M. Idan and G. E. Shaviv, “Robust control design strategy with parameter-dominated
uncertainty,” Journal of Guidance, Control and Dynamics, vol. 19, no. 3, pp. 605–611,
1996.
[41] A. Varga, G. Looye, D. Moormann, and G. Grubel, “Automated generation of LFT-
based parametric uncertainty descriptions from generic aircraft models,” Mathematical
and Computer Modelling of Dynamical Systems, vol. 4, no. 4, pp. 249–274, 1998.
[42] S. Hecker and A. Varga, “Generalized LFT-based representation of parametric uncer-
tain models,” European Journal of Control, vol. 10, no. 4, pp. 326–337, 2004.
[43] T. Mannchen, D. G. Bates, and I. Postlethwaite, “Modeling and computation worst-
case uncertainty combinations for flight control systems analysis,” Journal of Guidance,
Control and Dynamics, vol. 25, no. 6, pp. 1029–1039, 2002.
148

[44] R. Kureemun, D. G. Bates, and M. J. Hayes, “On the generation of LFT-based uncer-
tainty models for flight control law robustness analysis,” AIAA Guidance, Navigation,
and Control Conference, no. 2001-4396, 2001.
[45] F. R. Chavez and D. K. Schmidt, “Uncertainty modeling for multivariable-control
robustness analysis of elastic high speed vehicles,” Journal of Guidance, Control and
Dynamics, vol. 22, no. 1, pp. 87–95, 1999.
[46] J. M. Biannic and C. Doll, “Introduction to a Simulink-
based interface for LFRT toolbox,” Free web publication
http://www.cert.fr/dcsd/idco/perso/Biannic/download/slklfr.pdf, 2006.
[47] J. F. Magni, “Linear fractional representation toolbox [version 2.0] for use with Mat-
lab,” Free Web publication http://www.cert.fr/dcsd/idco/perso/Magni/, 2006.
[48] D. Bates and I. Postlethwaite, Robust Multivariable Control of Aerospace Systems.
Delft University Press, 2002.
[49] D. K. Schmidt and S. K. Lee, “New results in structured uncertainty modeling for
flexible flight vehicles,” AIAA Guidance, Navigation, and Control Conference, no. 99-
4157, 1999.
[50] T. Lombaerts, J. Mulder, and G. Voorsluijs, “Design of a robust control system for
a mini-UAV,” AIAA Guidance, Navigation, and Control Conference and Exhibit, no.
2005-6408, 2005.
[51] H. Hindi, C. Y. Seong, and S. Boyd, “Computating optimal uncertainty models from
frequency domain data,” IEEE Conference on Decision and Control, vol. 3, pp. 2898–
2905, 2002.
[52] K. E. Haggblom, “Data-based modeling of block-diagonal uncertainty by convex opti-
mization,” American Control Conference, pp. 4637–4642, 2007.
[53] G. J. Balas, A. K. Packard, and P. J. Seiler, “Uncertain model set calculation from fre-
quency domain data,” In:P. M .J Van den Hof, P. S. C. Heuberger, C. W. Scherer Se-
149

lected Topics in Model-Based Control: Bridging Rigorous Theory and Advanced Tech-
nology, Springer-Verlag, 2009.
[54] Z. Xing and D. Gebre-Egziabher, “Modeling and bounding low cost inertial sensor
errors,” IEEE/ION Position, Location and Naviagtion Symposium, pp. 1122–1132,
2008.
[55] J. C. Doyle, K. Glover, P. Khargonekar, and B. A. Francis, “State-space solution
to standard H2 and H∞ control problem,” IEEE Transaction on Automatic Control,
no. 8, pp. 831–847, 1989.
[56] K. Zhou and J. C. Doyle, Essentials of Robust Control. Prentice Hall, 1998.
[57] G. J. Balas, “Robust control of flexible structures: Theory and experiments,” Ph.D.
dissertation, California Institute of Technology, 1990.
[58] J.-Y. Shin, “Worst-case analysis and linear parameter-varying gain scheduled control
of aerospace systems,” Ph.D. dissertation, University of Minnesota, 2000.
[59] J. Ledin, Embedded Control Systems in C/C++: An Introduction for Software Devlop-
ers Using Matlab. CMP Books, 2004.
[60] G. F. Franklin, J. D. Powell, and A. Emami-Naeini, Feedback Control of Dynamic
Systems. Prentice Hall, 2002.
[61] Matlab and Simulink, Real-Time Windows Target 3 User’s Guide. The MathWorks
Inc, 2008.
150

Appendix A
Physical Parameters Data
A.1 Simulator Parameter Tuning
CL0 2.30× 10⁻¹ clδa8.55× 10−2
CLα 4.58 clδr−2.40× 10⁻³
CLα 1.97 clp −5.05× 10⁻¹
CLq 7.95 clr 2.52× 10⁻¹
CLmin 2.30× 10⁻¹ cm0 1.35× 10⁻¹
CD0 4.34× 10⁻² cmα -1.50
CDδe1.35× 10−2 cmδe
−9.92× 10⁻¹
CDδr3.03× 10−2 cmα −1.04× 101
CYβ−8.30× 10⁻¹ cmq −3.82× 101
CYδr1.91× 10−1 cnβ
7.26× 10⁻²
CYp 0.00 cnδr−6.93× 10⁻²
CYr 0.00 cnp −6.90× 10⁻²
clβ −1.30× 10⁻¹ cnr −9.46× 10⁻²
Table A.1: Aerodynamic coefficients obtained from simulator parameter tuning
151

A.2 Moment of Inertia Measurement
A.2.1 Aircraft Moment of Inertia Measurement
The Ultrastick aircraft moment of inertia is determined using compound pendulum method
[9]. For a compound pendulum shown in Figure A.1, the moment of inertia of the mass
Imass (kgm2) is related to its natural frequency ωn (rad/s) with small angular amplitude
oscillations:
ωn =√
mgL
Imass + mL2(A.1)
Figure A.1: Description of compound pendulum method setup
The relationship between damped frequency ωd (rad/s), natural frequency ωn (rad/s)
and undamped frequency ωud is:
ωn =√
ω2d + ω2
ud (A.2)
The natural frequency of the oscillations is determined using Equation A.2 with the damped
and undamped frequency measured using the compound pendulum experiment. The damped
frequency is given by a single period of oscillation Tp (s) for the pendulum motion:
ωd =2π
Tp
152

The undamped frequency is approximated using the exponent equation for the pendulum
motion oscillation, eωT . This can be written as e−t/τ , where τ (s) is the time constant. For
oscillation motion to die out (exponent equation becomes zero and t = Tf ), this time can
be approximated with t = 5τ . Therefore, the undamped natural frequency computed by:
ωud =5Tf
(A.3)
Figure A.2 shows the setup of the moment of inertia measurement for the Ultrastick aircraft.
In the pendulum swing, the time taken for 10 oscillations (to compute Tp) and for the
oscillations to die out (Tf ) are taken. 3 sets of data are taken for each axis to determine
the natural frequency for small angular oscillations and the moment of inertia is calculated
with Equation A.1.
The largest and the smallest moment of inertia values are used as the upper and lower
bound value while the mean value between these two bounds is the nominal value for the
aircraft moment of inertia. These values are given in Appendix Table A.2.
(a) Pendulum swing setup for Izz determination (b) Pendulum swing setup for Ixx and Iyy determi-
nation
Figure A.2: Setup for aircraft moment of inertia measurement
A.2.2 Propulsion Moment of Inertia Measurement
The propulsion system moment of inertia measurement determines the moment of iner-
tia contributed by rotating components from the propulsion system. These components
153

include:
• Propeller
• Electric motor
• Propeller adaptor
These components are rotating about a common axis and are semi-semi-symmetrical about
the aircraft body x-axis. The moment of inertia of the propulsion system is measured as a
composite assembled system using bifilar pendulum method. This approach uses the period
of the composite system undamped oscillations to calculate the moment of inertia of the
propulsion system.
Jp =(
Tn
2π
)mgR2
L(A.4)
where
• J = moment of inertia of the composite system (kgm2)
• Tn = undamped oscillation period (s)
• m = mass of the composite system (kg)
• g = gravitational constant (9.81m/s2)
• R = radius of the gyration (m)
• L = length of the pendulum (m)
Figure A.3(a) shows the description of the bifilar pendulum system setup.
A 20 degrees anglular displacement is applied to the bifiar pendulum setup shown in
Figure A.3(b) so that the pendulum system oscillates about the propeller axis of rotation.
The time taken for 5 oscillation cycles is measured and the period taken for a single os-
cillation is used in Equation A.4 to compute the propulsion system moment of inertia.
Two more data sets are taken and the moment of inertia are computed. The largest and
the smallest moment of inertia values are used as the upper and lower bound values while
the mean value between these two bounds is the nominal value for the propulsion system
moment of inertia. These values are given in Appendix Table A.2.
154

(a) Description of bifilar pendulum
setup
(b) Propulsion system moment of inertia measure-
ment
Figure A.3: Bifilar pendulum system setup
A.2.3 Summary of Moment of Inertia Data
Moment of inertia Lower bound Nominal Upper bound
Ixx (kgm2) 7.74× 10⁻² 8.94× 10⁻² 1.03× 10⁻¹
Iyy (kgm2) 1.24× 10⁻¹ 1.44× 10⁻¹ 1.59× 10⁻¹
Izz (kgm2) 1.34× 10⁻¹ 1.62× 10⁻¹ 1.99× 10⁻¹
Ixz (kgm2) 1.12× 10⁻² 1.40× 10⁻² 1.68× 10⁻²
Ip (kgm2) 1.29× 10⁻⁴ 1.30× 10⁻⁴ 1.31× 10⁻⁴
Table A.2: Moment of inertia data
155

A.3 Propeller Characteristics
Advance ratio (J) Coefficient of thrust (CT ) Coefficient of power (CP )
4.00× 10⁻² 1.00× 10⁻² 4.50× 10⁻²
1.30× 10⁻¹ 9.60× 10⁻² 4.50× 10⁻²
2.60× 10⁻¹ 8.60× 10⁻² 4.80× 10⁻²
3.30× 10⁻¹ 8.25× 10⁻² 4.80× 10⁻²
3.80× 10⁻¹ 8.00× 10⁻² 4.80× 10⁻²
4.40× 10⁻¹ 6.75× 10⁻² 4.60× 10⁻²
5.10× 10⁻¹ 5.40× 10⁻² 4.30× 10⁻²
5.90× 10⁻¹ 4.10× 10⁻² 3.75× 10⁻²
6.40× 10⁻¹ 3.00× 10⁻² 3.25× 10⁻²
7.00× 10⁻¹ 2.00× 10⁻² 2.88× 10⁻²
Table A.3: Propeller performance data for APC 12 x 8E propeller
A.4 Control Surfaces Limits
Control Surface Lower limit (deg) Upper limit (deg)
Aileron -23 23
Elevator -20 20
Rudder -25 25
Table A.4: Control surfaces saturation limits
156

Appendix B
Linearization Result
B.1 Operating Point Condition
States Trim value Output Trim value Control input Trim value
u (m/s) 1.70× 101 Va (m/s) 1.70× 101 δe (rad) 9.10× 10⁻²
v (m/s) 3.00× 10⁻² β (deg) 1.00× 10⁻¹ δa (rad) 1.01× 10⁻²
w (m/s) 3.70× 10⁻¹ α (deg) 1.24 δr (rad) -6.70× 10⁻²
p (deg/s) 0.00 φ (deg) 1.00× 10⁻¹ δT (%) 4.25× 101
q (deg/s) 0.00 θ (deg) 2.50× 10⁻¹
r (deg/s) 0.00 ψ (deg) 3.16× 10²
φ (deg) 1.00× 10⁻¹ h (m) 1.00× 10²
θ (deg) 2.50× 10⁻¹
ψ (deg) −4.36× 101
h (m) 1.00× 10²
ωp (rad/s) 5.09× 10²
Table B.1: Trim operating point condition
157

B.2 Full Linearized Model
Af =
−0.444 −0.000 0.594 0.000 −9.794 0.000 0.000 0.000 −0.362 −0.019 0.0134
−0.003 −1.476 0.000 9.794 0.002 0.000 0.000 0.368 0.000 −16.997 0.000
−0.983 0.001 −7.804 −0.012 0.482 0.000 0.001 0.019 15.322 0.000 0.000
0.000 0.000 0.000 0.000 −0.000 0.000 0.000 1.000 −0.000 −0.049 0.000
0.000 0.000 0.000 0.000 0.000 0.000 0.000 0.000 1.000 −0.001 0.000
0.000 0.000 0.000 −0.000 0.0000 0.000 0.000 0.000 0.001 1.001 0.000
0.000 0.000 0.000 0.000 0.000 0.000 0.000 0.000 0.000 0.000 0.000
0.090 −5.703 0.002 0.000 0.000 0.000 −0.000 −21.709 0.000 −6.809 0.002
0.180 −0.000 −8.310 0.000 0.000 0.000 −0.000 −0.000 −35.203 −0.000 0.000
0.010 1.329 0.000 0.000 0.000 0.000 −0.000 −0.100 0.000 −2.698 0.000
136.660 −0.152 2.962 0.000 0.000 0.000 0.054 0.000 0.000 0.000 −8.501
Bf =
−0.000 0.001 0.001 0.000
0.000 0.002 0.006 0.000
−0.004 0.000 0.000 0.000
0.000 0.000 0.000 0.000
0.000 0.000 0.000 0.000
0.000 0.000 0.000 0.000
0.000 0.000 0.000 0.000
0.000 −0.105 −0.003 −0.006
−0.106 0.000 0.000 0.000
0.000 −0.006 −0.012 −0.001
0.000 0.000 0.000 3.894
× 103
Cf =
1.000 −0.001 0.022 0.000 0.000 0.000 0.000 0.000 0.000 0.000 0.000
0.000 0.059 0.000 0.000 0.000 0.000 0.000 0.000 0.000 0.000 0.000
−0.001 0.000 0.059 0.000 0.000 0.000 0.000 0.000 0.000 0.000 0.000
0.000 0.000 0.000 1.000 0.000 0.000 0.000 0.000 0.000 0.000 0.000
0.000 0.000 0.000 0.000 1.000 0.000 0.000 0.000 0.000 0.000 0.000
0.000 0.000 0.000 0.000 0.000 1.000 0.000 0.000 0.000 0.000 0.000
0.000 0.000 0.000 0.000 0.000 0.000 1.000 0.000 0.000 0.000 0.000
Df =
0.000 0.000 0.000 0.000
0.000 0.000 0.000 0.000
0.000 0.000 0.000 0.000
0.000 0.000 0.000 0.000
0.000 0.000 0.000 0.000
0.000 0.000 0.000 0.000
0.000 0.000 0.000 0.000
158

B.3 Decoupled Linear Model
Alon =
−0.444 0.594 −0.362 −9.794 0.000 0.014
−0.983 −7.804 15.322 0.481 0.001 0.000
0.180 −8.310 −35.203 0.000 −0.000 0.000
0.000 0.000 1.000 0.000 0.000 0.000
0.000 0.000 0.000 0.000 0.000 0.000
136.660 2.962 0.000 0.000 0.054 −8.501
Blon =
−0.000 0.000
−0.004 0.000
−0.106 0.000
0.000 0.000
0.000 0.000
0.000 3.894
× 103
Clon =
1.000 0.022 0.000 0.000 0.000 0.000
−0.001 0.059 0.000 0.000 0.000 0.000
0.000 0.000 1.000 0.000 0.000 0.000
0.000 0.000 0.000 1.000 0.000 0.000
0.000 0.000 0.000 0.000 1.000 0.000
Dlon =
0.000 0.000
0.000 0.000
0.000 0.000
0.000 0.000
0.000 0.000
Alat =
−1.476 0.368 −16.997 9.794 0.000
−5.703 −21.709 −6.809 0.000 0.000
1.329 −0.100 −2.698 0.000 0.000
0.000 1.000 −0.049 0.000 0.000
0.000 0.000 1.001 0.000 0.000
Blat =
2.147 5.480
−105.001 −2.792
−6.131 −12.398
0.000 0.000
0.000 0.000
159

Clat =
0.059 0.000 0.000 0.000 0.000
0.000 1.000 0.000 0.000 0.000
0.000 0.000 1.000 0.000 0.000
0.000 0.000 0.000 1.000 0.000
0.000 0.000 0.000 0.000 1.000
Dlat =
0.000 0.000
0.000 0.000
0.000 0.000
0.000 0.000
160

B.4 Open Loop ID Results
B.4.1 Model 2 Parameter Identification
0 0.2 0.4 0.6 0.8 1 1.2−200
0
200Roll rate
p (d
eg/s
)
0 0.2 0.4 0.6 0.8 1 1.2−50
0
50Yaw rate
r (d
eg/s
)
0 0.2 0.4 0.6 0.8 1 1.2−1
0
1
time(s)
Con
trol
stic
k [−
1 to
1]
Control input
AileronRudder
(a) Aileron control excitation
0 0.5 1 1.5−50
0
50Roll rate
p (d
eg/s
)
0 0.5 1 1.5−100
0
100Yaw rate
r (d
eg/s
)
0 0.5 1 1.5−1
0
1
time(s)
Con
trol
stic
k [−
1 to
1]
Control input
AileronRudder
(b) Rudder control excitation
Figure B.1: Flight test data for model 2 parameter identification
0 0.05 0.1 0.15 0.2 0.25 0.3 0.35 0.40
10
20
30
40
50
60
70yaw rate, r
time (s)
r (d
eg/s
)
Flight dataID Model
(a) Step 1
0 0.2 0.4 0.6 0.8 1−200
−100
0
100
200Roll rate, p
time (s)
p (d
eg/s
)
0 0.2 0.4 0.6 0.8 1−40
−20
0
20
40yaw rate, r
time (s)
r (d
eg/s
)
Flight dataID model
(b) Step 2
0 0.5 1 1.5−50
0
50Roll rate, p
time (s)
p (d
eg/s
)
Flight dataID model
0 0.5 1 1.5−100
−50
0
50
100yaw rate, r
time (s)
r (d
eg/s
)
Flight dataID Model
(c) Step 3
Figure B.2: Model 2 parameter identification
161

B.4.2 Model 3 Parameter Identification
0 0.2 0.4 0.6 0.8 1 1.2−200
0
200Roll rate
p (d
eg/s
)
0 0.2 0.4 0.6 0.8 1 1.2−50
0
50Yaw rate
r (d
eg/s
)
0 0.2 0.4 0.6 0.8 1 1.2−1
0
1
time(s)
Con
trol
stic
k [−
1 to
1]
Control input
AileronRudder
(a) Aileron control excitation
0 0.5 1 1.5−50
0
50Roll rate
p (d
eg/s
)
0 0.5 1 1.5−100
0
100Yaw rate
r (d
eg/s
)
0 0.5 1 1.5−1
0
1
time(s)
Con
trol
stic
k [−
1 to
1]
Control input
AileronRudder
(b) Rudder control excitation
Figure B.3: Flight test data for model 3 parameter identification
0 0.05 0.1 0.15 0.2 0.25 0.3 0.35 0.4−60
−50
−40
−30
−20
−10
0
10yaw rate, r
time (s)
r (d
eg/s
)
Flight dataID Model
(a) Step 1
0 0.2 0.4 0.6 0.8 1−200
−100
0
100
200Roll rate, p
time (s)
p (d
eg/s
)
0 0.2 0.4 0.6 0.8 1−40
−20
0
20
40yaw rate, r
time (s)
r (d
eg/s
)
Flight dataID model
(b) Step 2
0 0.5 1 1.5 2 2.5−50
0
50Roll rate, p
time (s)
p (d
eg/s
)
0 0.5 1 1.5 2 2.5−100
−50
0
50
100yaw rate, r
time (s)
r (d
eg/s
)
Flight dataID Model
(c) Step 3
Figure B.4: Model 3 parameter identification
162

B.5 Nominal Model Computed
Derivatives Lower bound Nominal value Upper bound
Lp(s−1) −1.28× 101 −1.20× 101 −1.11× 101
Lr(s−1) 8.62× 100 1.15× 101 1.44× 101
Np(s−1) −4.48× 10⁻¹ 1.20× 10⁻¹ 6.87× 10⁻¹
Nr(s−1) −8.48× 100 −6.55× 100 −4.62× 101
Lδa(s−2) 4.33× 101 5.24× 101 6.14× 101
Lδr(s−2) 8.99× 100 1.13× 101 1.36× 101
Nδa(s−2) −6.58× 100 −5.13× 100 −3.67× 100
Nδr(s−2) −1.75× 101 −1.47× 101 −11.9× 101
Table B.2: Nominal model with upper and lower bounds
163

Appendix C
Uncertainty Modeling
C.1 Aerodynamic Coefficients Parametric Uncertainty
Aerodynamic coefficient Lower bound Nominal Upper bound
clp −4.43× 10⁻¹ −4.14× 10⁻¹ −3.84× 10⁻¹
clr 2.99× 10⁻¹ 3.99× 10⁻¹ 4.99× 10⁻¹
cnp −2.81× 10⁻² −7.50× 10⁻³ 4.31× 10⁻²
cnr −5.32× 10⁻¹ −4.11× 10⁻¹ −2.90× 10⁻¹
clδa5.60× 10−2 6.77× 10⁻² 7.94× 10⁻²
clδr1.60× 10−2 1.68× 10⁻² 1.76× 10⁻²
cnδa−1.54× 10⁻² −1.20× 10⁻² −8.60× 10⁻³
cnδr−4.10× 10⁻² −3.45× 10⁻² −2.79× 10⁻²
Table C.1: Aerodynamic coefficients nominal, lower and upper bound values
164

Fig
ure
C.1
:Si
mul
ink
mod
elw
ith
real
para
met
ric
unce
rtai
ntie
sfo
rdi
men
sion
less
roll
mom
ent
coeffi
cien
t
165

Table C.2: List of parameters with its nominal, lower and upper bound values
166

Figure C.2: Simulink model for angular acceleration kinematics
167

Table C.3: ∆ matrix of LFT realization using ulinearize
168

Table C.4: ∆ matrix of worst-case gain condition at 5 rad/s
169