Synthesis and Characterization of Type II Silicon and ...
87
University of South Florida Scholar Commons Graduate eses and Dissertations Graduate School 3-7-2006 Synthesis and Characterization of Type II Silicon and Germanium Clathrates Mahew K. Beekman University of South Florida Follow this and additional works at: hp://scholarcommons.usf.edu/etd Part of the American Studies Commons is esis is brought to you for free and open access by the Graduate School at Scholar Commons. It has been accepted for inclusion in Graduate eses and Dissertations by an authorized administrator of Scholar Commons. For more information, please contact [email protected]. Scholar Commons Citation Beekman, Mahew K., "Synthesis and Characterization of Type II Silicon and Germanium Clathrates" (2006). Graduate eses and Dissertations. hp://scholarcommons.usf.edu/etd/3865
Transcript of Synthesis and Characterization of Type II Silicon and ...

University of South FloridaScholar Commons
Graduate Theses and Dissertations Graduate School
3-7-2006
Synthesis and Characterization of Type II Siliconand Germanium ClathratesMatthew K. BeekmanUniversity of South Florida
Follow this and additional works at: http://scholarcommons.usf.edu/etd
Part of the American Studies Commons
This Thesis is brought to you for free and open access by the Graduate School at Scholar Commons. It has been accepted for inclusion in GraduateTheses and Dissertations by an authorized administrator of Scholar Commons. For more information, please contact [email protected].
Scholar Commons CitationBeekman, Matthew K., "Synthesis and Characterization of Type II Silicon and Germanium Clathrates" (2006). Graduate Theses andDissertations.http://scholarcommons.usf.edu/etd/3865

Synthesis and Characterization of Type II Silicon and Germanium Clathrates
by
Matthew K. Beekman
A thesis submitted in partial fulfillment of the requirements for the degree of
Master of Science Department of Physics
College of Arts and Sciences University of South Florida
Major Professor: George S. Nolas, Ph.D.
Sarath Witanachchi, Ph.D. Lilia Woods, Ph.D.
Date of Approval: March 7, 2006
Keywords: clathrate, thermal conductivity, transport properties, materials science, silicon
© 2006, Matthew K. Beekman

In memory of Randy.
My first lab mate, and a friend who will be missed.

Acknowledgements
I wish to express my sincere gratitude for continued funding provided to me
through the University of South Florida Presidential Doctoral Fellowship, which has
helped to make possible the research presented in the pages that follow. I also wish to
acknowledge funding for the silicon clathrate work provided by the U.S. Department of
Energy Office of Basic Energy Sciences, and for the germanium clathrate work provided
by the Office of Naval Research. I would like to extend my sincere thanks and deep
appreciation to my advisor Prof. George Nolas. His patience as a teacher, enthusiasm as a
scientist, and guidance as a mentor continue to be essential in my growth as a scientist. I
would also like to thank Prof. Jan Gryko of Jacksonville State University for his
assistance with Rietveld refinement and hot-pressing of the silicon clathrates, and for his
insight into the preparation of silicon clathrates. I gratefully acknowledge Dr. Winnie
Wong-Ng from the National Institute of Standards and Technology and Dr. James Kaduk
at Innovene for their assistance in solving the structure of the new compound Na1-xGe3.
Thank you to Dr. Chris Kendziora of the Navel Research Laboratory for collecting
Raman scattering data. Thanks goes to my coworkers in our research group the Novel
Materials Laboratory, who help make our lab a great environment to work in. Special
thanks to Josh Martin for his insight and advice regarding our transport measurements
system, to Josh and Grant Fowler for continuing stimulating conversations on science,
and to Holly Rubin for her help with the synthesis in this work. Finally, I thank my
parents for the love and support they have always given me and to Teresa for her
continued patience and support.

i
Table of Contents
List of Tables iii List of Figures iv Abstract vii 1 Introduction 1 2 An Overview of Type II Clathrates 6 2.1 Structural Features 6 2.2 Previous Work 9 2.2.1 Electrical Properties 11 2.2.2 Thermal and Vibrational Properties 15 2.3 Applications 20 3 Synthesis and Sample Preparation 26 3.1 Degassing of Silicides and Germanides 26 3.1.1 Preparation of NaxSi136 Clathrates 26 3.1.2 Preparation of NaxGe136 Clathrates and the New Phase Na1-xGe3 31 3.1.3 Other Silicides and Germanides 32 3.2 Direct Synthesis of Cs8Na16MyGe136-y Clathrates (M = Ag, Cu) 34 3.3 Partially Filled Type II Ge Clathrates 37 4 Structural and Chemical Characterization 39 4.1 Characterization of NaxSi136 Clathrates 39 4.2 Characterization of Cs8Na16MyGe136-y Clathrates (M = Ag, Cu) 45 4.3 The New Compound Na1-xGe3 49 5 Transport Properties 53 5.1 Experimental Details 53 5.2 Transport Properties of NaxSi136 Clathrates 54 5.3 Transport Properties of Cs8Na16CuyGe136-y Clathrates 60 6 Summary and Future Directions 67

ii
References 70 Bibliography 74

iii
List of Tables Table 2.1 Comparison of ionic radii of the alkali metals with the approximate van der Waals radii of the empty space in the small (20- atom) and large (28-atom) cages in silicon and germanium type II clathrates, after Bobev and Sevov. 9 Table 2.2 Rattler frequencies in cm-1 as determined from Raman scattering, ADPs from single crystal XRD, and theoretical calculations. 18 Table 3.1 Structures of various silicides and germanides and the products obtained by their thermal decomposition. 33 Table 4.1 Structure and composition of Na1Si136 and Na8Si136. 42 Table 4.2 Preliminary structural data for the novel phase Na0.7Ge3, space group P6/m, a = 15.05399(5) Å, c = 3.96845(2) Å. 50

iv
List of Figures
Figure 1.1 An example of the cage-like structure of clathrate materials. 3 Figure 2.1 Structure of the type II clathrate. 7 Figure 2.2 Temperature dependence of resistivity (round symbols) and Seebeck coefficient (square symbols) for polycrystalline samples of Cs8Na16Si136 (filled symbols) and Cs8Na16Ge136 (open symbols). 13 Figure 2.3 Arrhenius plot of the resistance for Si136. 14 Figure 2.4 Temperature dependent ADPs for (a) Rb8Na16Si136, (b) Cs8Na16Si136, (c) Rb8Na16Ge136, and (d) Cs8Na16Ge136, determined from single crystal X-ray diffraction. 16 Figure 2.5 Raman scattering spectra of Si136 and Cs8Na16Si136. 17 Figure 2.6 Thermal conductivity of the crystalline silicon clathrate Si136 and Cs8Na16Si136. 19 Figure 2.7 Schematic of a thermoelectric couple for power generation. 22 Figure 2.8 Band diagram schematic of carrier generation in a p-n homojunction. 24 Figure 3.1 Crystal structure of the Zintl phase NaSi, emphasizing the Si4
4- cluster units (blue) and Na+ ions (orange). 27 Figure 3.2 Schematic of the vacuum furnace apparatus designed for degassing of the silicides and germanides, and for further degassing of the clathrates. 28 Figure 3.3 Qualitative representation of phase percentages from products obtained from thermal decomposition of NaGe. 31

v
Figure 3.4 Temperature schedule for the synthesis of the framework substituted type II germanium clathrates. 35 Figure 3.5 Small as-grown crystallites of Cs8Na16CuyGe136-y. 36 Figure 3.6 Lattice parameter of NaxRb8Ge136, as measured after vacuum degassing at the indicated temperature. 38 Figure 4.1 Simulated theoretical X-ray diffraction patterns for NaxSi136 clathrates as a function of the Na content x, calculated using the PowderCell computer software. 40 Figure 4.2 Refinement of powder XRD data for Na1S136. Peaks associated with Na8Si46 and diamond-structure silicon are indicated by arrows. 41 Figure 4.3 GSAS fit of the powder XRD data for Na8Si136. 42 Figure 4.4 Stokes Raman scattering spectra for Na1Si136 and Na8Si136. 43 Figure 4.5 Heat flow as a function of temperature for NaxSi136 samples with x = 0, 1, and 8, determined by DSC measurements. 44 Figure 4.6 Powder XRD patterns for Cs8Na16AgyGe136-y clathrates. 46 Figure 4.7 Powder XRD patterns for Cs8Na16CuyGe136-y clathrates. 47 Figure 4.8 Lattice parameter as a function of transition metal content for the Cs8Na16CuyGe136-y (closed circles) and Cs8Na16AgyGe136-y (open triangles) clathrates. 48 Figure 4.9 A schematic of the structure of NaGe3, viewed along the c-axis at a slight tilt. 50 Figure 4.10 Powder X-ray diffraction of Na1-xGe3. 52 Figure 5.1 Temperature dependent electrical resistivity of Na1Si136 (closed circles) and Na8Si136 (open cicles), along with Cs8Na16Si136 (closed squares). 54 Figure 5.2 Temperature dependent thermal conductivity of Na1Si136 (closed circles) and Na8Si136 (open circles), along with that of single crystal diamond structure silicon (dashed line). 55

vi
Figure 5.3 Low temperature lattice thermal conductivity for single crystalline Sr8Ga16Ge30 (circles) and Eu8Ga16Ge30 (squares). 58 Figure 5.4 Temperature dependence of the electrical resistivity of Cs8Na16CuyGe136-y, with y = 0, 5, and 8, indicating the metallic behavior of these materials. 59 Figure 5.5 Temperature dependence of the Seebeck coefficient of Cs8Na16CuyGe136-y, with y = 0, 5, and 8. 61 Figure 5.6 Temperature dependence of the thermal conductivity for Cs8Na16CuyGe136-y with y = 0, 5, and 8. 62 Figure 5.7 Verification of losses due to radiation during the thermal conductivity measurement. 64

vii
Synthesis and Characterization of Type II Silicon and Germanium Clathrates
Matthew K. Beekman
ABSTRACT
Clathrate materials comprise compounds in which guest atoms or molecules can
be encapsulated inside atomic cages formed by host framework polyhedra. The unique
relationship that exists between the guest species and its host results in a wide range of
physical phenomena, and offers the ability to study the physics of structure-property
relationships in crystalline solids. Clathrates are actively being investigated in fields such
as thermoelectrics, superconductivity, optoelectronics, and photovoltaics among others.
The structural subset known as type II clathrates have been studied far less than other
clathrates, and this forms the impetus for the present work. In particular, the known
“composition space” of type II clathrates is small, thus the need for a better
understanding of possible compositions is evident. A basic research investigation into the
synthesis and characterization of silicon and germanium type II clathrates was performed
using a range of synthetic, crystallographic, chemical, calorimetric, and transport
measurement techniques. A series of framework substituted type II germanium clathrates
has been synthesized for the first time, and transport measurements indicate that these
compounds show metallic behavior. In the course of the investigation into type II
germanium clathrates, a new zeolite-like framework compound with its corresponding
novel crystal structure has been discovered and characterized. This compound can be
described by the composition Na1-xGe3 (0 < x < 1), and corresponds to a new binary phase

viii
in the Na-Ge system. One of the most interesting aspects of type II clathrates is the ability
to create compounds in which the framework cages are partially occupied, as this offers
the unique opportunity to study the material properties as a function of guest content. A
series of type II sodium-silicon clathrates NaxSi136 (0 < x < 24) has been synthesized in
higher purity than previously reported for as-synthesized products. The transport
properties of the NaxSi136 clathrates exhibit a clear dependence on the guest content x. In
particular, we present for the first time thermal conductivity measurements on NaxSi136
clathrates, and observe evidence that the guest atoms in type II clathrates affect the
thermal transport in these materials. Some of the crystalline NaxSi136 compounds studied
exhibit very low thermal conductivities, comparable in magnitude to amorphous
materials. In addition, for the first time clear evidence from transport measurements was
found that resonance phonon scattering may be present in type II clathrates, as is also the
case in the type I subset.

1
1
Introduction
The term clathrate refers to any group of materials that has the ability to contain
atomic or molecular “guest” species within a “host” network or lattice. The structure of
these “inclusion compounds” is such that there exist voids that may be filled by the guest
species. Strictly speaking, true clathrates are those compounds which crystallize even in
the absence of the guest. Examples include the skutterudites and various oxide zeolites,
though many more examples exist in which the host lattice only forms in the presence of
the guests. These are sometimes referred to as the crypto-clathrates.1 However, the
structures discussed in this work are collectively referred to simply as clathrates in the
literature.
For more than one hundred years, H2O has been known to form the compounds
referred to today as the clathrate hydrates, where the host lattice is formed by
tetrahedrally coordinated, hydrogen bonded H2O molecules in much the same manner as
common ice.2 Also known as gas or liquid hydrates, these compounds constitute
structural phases of ice, and can encapsulate molecules or atoms in voids formed by the
crystal structure, such as methane or xenon with compositions (CH4)8(H2O)46 and
Xe8(H2O)46, respectively. The methane-containing ice clathrates are naturally occurring
and can be found under the sea in Polar Regions, as well as the Gulf of Mexico and the

2
Caspian Sea.3 There has been much interest in the potential of these clathrates as a
useable source of energy, and it has been suggested that if the huge amounts of methane
trapped in this form could be harvested it could potentially replace the world’s entire
fossil fuel reserves combined.3,4 Ironically, contributions to global warming have also
been speculated due to release of methane from the gas hydrates found in the oceans,3
and gas hydrates have been known to cause flow assurance and safety problems by
forming in oil and gas pipelines.4 Recently, the potential for ice clathrates as a hydrogen
storage medium has also been discussed.5
To date, geometrically there are nine main possible structures that fall in the
general class of clathrate materials, though experimental examples have not been
produced for all of these structures.6 In addition to the nine basic types, structural variants
or derivatives have been reported including isomers or superstructure variants of the type
I clathrates.7-9 The crystal structure of the type I clathrate, the structure type that has
received the most attention, is shown in Figure 1.1. A structural theme common to all
clathrate materials are constituent polyhedra that form the crystal structure. Typically
these polyhedra share faces in an arrangement allowing for the inclusion of the guest
species inside, and include pentagonal dodecahedra, tetrakaidecahedra, and
hexakaidecahedra. For the majority of clathrate materials, the framework consists wholly
or partially of the group IV elements silicon, germanium, or tin, with the guest species
being alkali or alkaline earth atoms, and the rare earth europium.
It was not until the 1960’s that “inorganic” clathrates were first synthesized and
investigated. In a systematic study of the thermal degradation of alkali silicides (e.g.,

3
(a) (b)
Figure 1.1 An example of the cage-like structure of clathrate materials. (a) Crystal structure of the type I
clathrate, viewed along the [001] direction at a slight tilt. The simple cubic unit cell is outlined in the upper
left. (b) The face-sharing polyhedra that constitute the type I clathrate crystal structure.
NaSi, KSi, etc.), Kasper et al.10 reported that cubic phases isostructural with the gas
hydrates were formed that were deficient in the alkali metal. These compounds
comprised the silicon and germanium analogues to the type I and type II clathrate
hydrates. A more thorough report of this work was later given by Cros et al.11
Initially, these silicon and germanium clathrates were interesting due to their
unique crystal structure, but the physical properties of these materials were not
extensively studied. However, in the past ten years new approaches to materials research
have renewed interest in these and similar materials, and clathrates have proved a
extremely rich source of varied and often novel phenomena. For example,
superconducting,12,13,14 thermoelectric,1,15 photovoltaic and optoelectronic,16,17,18

4
magnetic19,20 and mechanical21,22 properties of clathrates are currently being investigated
by several groups. Clathrates such as the type I Na2Ba6Si46,12
Ba8Si46,13 and the type IX
Ba24Ge10014 comprise unique superconductors. Type I clathrates such as Sr8Ga16Ge30 and
Eu8Ga16Ge30 exhibit very low thermal conductivities with glasslike temperature
dependences.23 Paired with the good electrical properties found in Sr8Ga16Ge30, clathrates
are raising continued interest for thermoelectric applications.15 Carbon clathrates, as yet
not produced experimentally, have been predicted to be the second hardest materials
known to humankind.21 Some applications of interest for type II clathrates are discussed
in Chapter 2.
In addition to potential applications, clathrate materials continue to be of interest
for reasons of basic science as well. From a chemical and physical point of view, these
materials allow for the study of the physics of compounds possessing isomorphic
structures with greatly varying properties, ranging from metals24,25 to semiconductors15,26
to superconductors,12-14 and magnetic materials19,20 as well. Also, many variants appear to
adhere to the Zintl formulation of charge balance in extended solids. This chemical aspect
has been investigated by several research groups.6,27 Perhaps the most conspicuous aspect
of clathrate materials is the guest host interaction. For example, the localized vibrational
modes of the guest atoms in several clathrate compounds resonantly scatter the heat-
carrying framework acoustic phonons, greatly reducing the thermal conductivity.1
Most reports on clathrates thus far have concentrated on the type I structure,
though in recent years other structures such as the type VIII and type IX are receiving
increased attention. In general, type II clathrates have been studied far less extensively.

5
The impetus for the present work is the need for a better understanding of the physical
properties of type II clathrates, and moreover a deeper investigation into the possible
“composition space” for these materials.

6
2
An Overview of Type II Clathrates
This chapter reviews the important structural aspects of the type II clathrates, and
some of the prior work that has been performed. The emphasis here is on structural and
transport properties, and those aspects of the materials which can affect the electronic and
thermal transport.
2.1 Structural Features
The type II clathrates crystallize with the space group mFd 3 and can be depicted
by the general formula AxE136 (0 < x < 24), where A has to date empirically been
observed to be Na, K, Rb, Cs, or Ba and E represents Si, Ge, or Sn. The E atoms form an
sp3 tetrahedrally bonded framework, in which the E atoms reside at the vertices of sixteen
pentagonal dodecahedra and eight hexakaidecahedra constituting the conventional unit
cell (see Figure 2.1). The 136 framework atoms per conventional unit cell reside at three
distinct crystallographic sites: 8a, 32e, and 96g in the Wyckoff notation. The A atoms
reside inside the atomic cages formed by the polyhedra at the 8b (larger
hexacaidecahedra) and 16c (smaller dodecahedra) sites. The conspicuous aspect that
differentiates type II clathrates from the other structure types is the possibility of

7
(a) (b)
Figure 2.1 Structure of the type II clathrate. (a) The hexakaidecahedron (larger cage) and pentagonal
dodecahedron (smaller cage) that make up the type II clathrate crystal structure. (b) A depiction of the
conventional unit cell of the type II clathrate crystal structure, viewed along the [110] direction.
fractionally filling the voids in type II clathrates, as seen in the formula AxE136. Thus type
II clathrates may be synthesized such that essentially all of the voids are empty (x = 0),
stoichiometrically filled were each site is occupied (x = 24), or a range of values in
between. Previous work on these materials is reviewed below.
As may be seen from careful examination of the crystal structure (Figure 2.1),
type II clathrates can be viewed as a derivative of the diamond crystal structure. Both
structures are composed of tetrahedral sp3 bonded atoms, and the clathrate structure can
be thought of as an “expanded” version of the diamond structure. Typically the E-E-E
bond angles range from 105° to 126° in the clathrates, and average close to the 109.5°
angle that is characteristic of the diamond structure.1 However, the volume per
framework atom in the clathrate is approximately 15% larger than the corresponding

8
diamond structure, and this is an indication of the “openness” of the clathrates.1 The type
II clathrate structure is related to the diamond structure in another interesting way, and an
alternative way to visualize the type II clathrates is to position the centers of the
hexakaidecahedra at the sites of an enlarged diamond lattice. The pentagonal
dodecahedra are then automatically formed in the spaces between the larger
hexakaidecahedra. Thus the polyhedra share faces, filling three dimensional space.
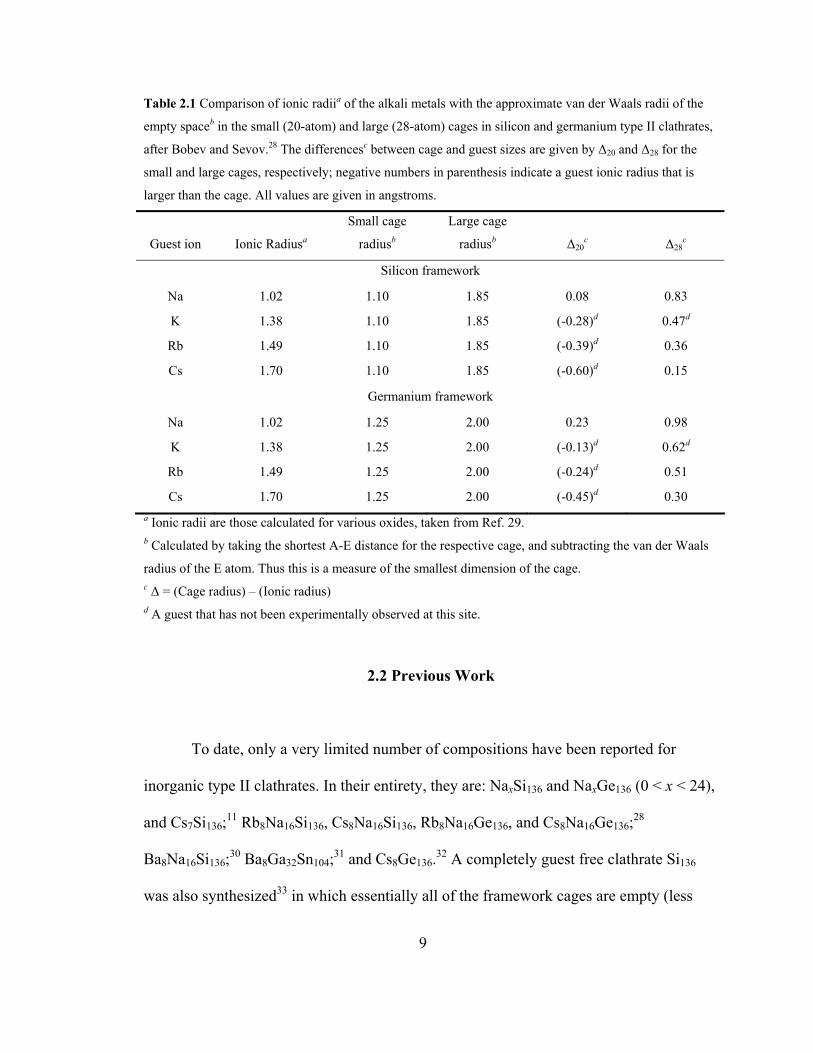
Table 2.1 gives an idea of the relative sizes of alkali guest atoms and the cages in which
they reside, taken from the work of Bobev and Sevov.28 From this table, a clear
geometrical correlation is apparent between the relative sizes of the guest and cage, and
which compounds have been experimentally observed. For example, type II clathrates
with K, Rb, or Cs occupying the smaller cage have not been observed in silicon or
germanium clathrates, due to these guests being too large to “fit” in the smaller
dodecahedra. From the information in Table 2.1, one may also estimate the available
space the guest species has to move around inside their respective cages; note that the
guests inside the larger hexacaidecahedra have more “room” to move. This point will be
revisited below.
9
Table 2.1 Comparison of ionic radiia of the alkali metals with the approximate van der Waals radii of the
empty spaceb in the small (20-atom) and large (28-atom) cages in silicon and germanium type II clathrates,
after Bobev and Sevov.28 The differencesc between cage and guest sizes are given by ∆20 and ∆28 for the
small and large cages, respectively; negative numbers in parenthesis indicate a guest ionic radius that is
larger than the cage. All values are given in angstroms.
Guest ion
Ionic Radiusa
Small cage
radiusb
Large cage
radiusb
∆20c
∆28c
Silicon framework
Na 1.02 1.10 1.85 0.08 0.83
K 1.38 1.10 1.85 (-0.28)d 0.47d
Rb 1.49 1.10 1.85 (-0.39)d 0.36
Cs 1.70 1.10 1.85 (-0.60)d 0.15
Germanium framework
Na 1.02 1.25 2.00 0.23 0.98
K 1.38 1.25 2.00 (-0.13)d 0.62d
Rb 1.49 1.25 2.00 (-0.24)d 0.51
Cs 1.70 1.25 2.00 (-0.45)d 0.30 a Ionic radii are those calculated for various oxides, taken from Ref. 29. b Calculated by taking the shortest A-E distance for the respective cage, and subtracting the van der Waals
radius of the E atom. Thus this is a measure of the smallest dimension of the cage. c ∆ = (Cage radius) – (Ionic radius) d A guest that has not been experimentally observed at this site.
2.2 Previous Work
To date, only a very limited number of compositions have been reported for
inorganic type II clathrates. In their entirety, they are: NaxSi136 and NaxGe136 (0 < x < 24),
and Cs7Si136;11 Rb8Na16Si136, Cs8Na16Si136, Rb8Na16Ge136, and Cs8Na16Ge136;28
Ba8Na16Si136;30 Ba8Ga32Sn104;31 and Cs8Ge136.32 A completely guest free clathrate Si136
was also synthesized33 in which essentially all of the framework cages are empty (less

10
than 600 pmm sodium), constituting a new allotrope of elemental silicon. From this short
list, it is clear that much work still remains to be done to increase the known composition
space of type II clathrates, and this is a driving motivation for the present work.
As mentioned above, the pioneering studies on inorganic type II clathrates were
performed by Cros et al.11,34 Clathrates with general composition NaxSi136 were
synthesized and characterized chemically and structurally. Compositions of Cs7Si136 and
NaxGe136 were also reported, but until the present work these have not been reproduced.
The materials were initially of interest for their peculiar structures, but until recently little
more work was carried out.
In general, type II clathrates have not been extensively studied. However,
significant work has been performed on the sodium-silicon materials, NaxSi136, and this
system has by far been the most studied of the type II clathrates. In these materials the
guest-host interaction is of prime interest, in this case the various interactions between the
sodium guests and the silicon framework. Experimental investigations include powder X-
ray diffraction,35,36 inelastic neutron scattering,37 Raman scattering,38,39 X-ray
photoemission spectroscopy (XPS),40 extended X-ray absorption fine structure
(EXAFS),41,42 electron spin resonance (ESR),43 nuclear magnetic resonance (NMR),44-48
magnetic measurements,11 and initial electrical transport measurements.11 Theoretical
calculations have investigated the possible guest displacement,49,50 electronic and band
structure,16,18,51-53 energetics,16,18,51,53 and lattice vibrational properties.54,55,56 It is
important to note that although these materials were of the first inorganic clathrates
discovered over forty years ago,10 until the present work their transport properties have

11
not been well characterized. In particular, no prior reports exist on the thermal
conductivity of sodium filled NaxSi136 type II clathrates.
Recently, Reny et al.35 and Ramachandran et al.36 independently systematically
synthesized and structurally characterized the NaxSi136 clathrates for a wide range of
values of x. Rietveld refinement of the powder X-ray diffraction data for each sample was
performed in both studies. As also shown in the present work, the powder diffraction
patterns of the type II clathrates depend sensitively on both the guest type and content x.
Thus refinement of the X-ray diffraction data allows a method for determining both
content and relative occupancy of the cages.
2.2.1 Electrical Properties
In terms of scientific merit, the type II clathrates offer material systems in which
the physical properties may be studied as the composition is varied in a controlled
manner. As mentioned above, type II clathrates offer the ability to partially fill the crystal
cages, and as is shown in the present work this has a remarkable effect on the transport
properties in these materials. It was known in the initial work from Cros et al.11 that the
sodium content x in NaxSi136 clathrates has a significant effect on the electrical properties.
The lower sodium content (x < 11) materials were reported to behave as semiconductors
or insulators with respectable Seebeck coefficients, while the higher alkali content results
in metallic behavior.11,57

12
Several other researchers further investigated the Na-Si clathrates, with particular
interest in the possible metal-to-insulator transition that appears to occur with
composition.11,57 In analogy with alkali-doped C60 fullerenes, the NaxSi136 clathrates were
investigated for superconductivity, but with negative results.58 Several mechanisms for
both the electronic conduction and the transition from insulating to metallic behavior in
NaxSi136 clathrates have been suggested. Mott57 explained the transition in terms of a
“Na-band,” which comes into existence as the average distance between Na guests
becomes less as the content increases. Another model describes the conduction in terms
of shallow impurity levels from the sodium atoms, from which electrons may be
thermally excited into the framework conduction bands. Demkov et al.51 discussed the
transition in terms of a Jahn-Teller distortion with sodium filling, causing a modification
of the band structure resulting in a split-off half-filled band inside of the electronic gap.
It is still an open question as for exactly which value of x the transition occurs, though
there is agreement that it is between 8 and 12. The underlying physics of the metal-to-
insulator transition and the mechanisms of conduction in NaxSi136 have not been
determined unequivocally.
More recently, Nolas et al.25 have reported on the electrical and thermal properties
of stoichiometric type II silicon and germanium clathrates, in which all of the cages are
filled by alkali metal guests. As shown in Figure 2.2, type II clathrates such as
Cs8Na16Si136 and Cs8Na16Ge136 possess metallic properties, such as low Seebeck
coefficients and resistivities that increase with increasing temperature. These results were
consistent with NMR measurements performed on Cs8Na16Si136,59 Rb8Na16Si136,60 and

13
Figure 2.2 Temperature dependence of resistivity (round symbols) and Seebeck coefficient (square
symbols) for polycrystalline samples of Cs8Na16Si136 (filled symbols) and Cs8Na16Ge136 (open symbols).
Reprinted with permission from G.S. Nolas, D.G. Vanderneer, A.P. Wilkinson, and J.L. Cohn, J. Appl.
Phys. 91, 8970 (2002). Copyright 2002, American Institute of Physics.
Cs8Na16Ge13661 which also showed metallic behavior for these materials. Band structure
calculations32 indicate that the Fermi level lies clearly within the conduction band in
Cs8Na16Ge136, consistent with the above experiments.
In the initial work on the guest free clathrate Si136,17 Gryko et al. reported results
from resistance (see Figure 2.3) as well as optical absorption measurements. These
indicated Si136 has a wide band gap of approximately 2 eV, in good agreement with
previous theoretical calculations.16 Thus on the expansion of silicon from diamond
structure to the “open” type II clathrate structure, the band gap increases by a factor of
almost 2.

14
Figure 2.3 Arrhenius plot of the resistance for Si136.17 The fit to the high temperature data indicates the
intrinsic band gap to be ~ 2 eV. Reprinted figure with permission from J. Gryko, P.F. McMillan, R.F.
Marzke, G.K. Ramachandran, D. Patton, S.K. Deb, and O.F. Sankey, Phys. Rev. B 62, R7707 (2000).
Copyright 2000 by the American Physical Society. Web: http://link.aps.org/abstract/PRB/v62/pR7707.
Very recently, we have synthesized and characterized for the first time the
clathrate Cs8Ge136.32 The material was synthesized by controlled degassing of Na from
Cs8Na16Ge136, until essentially all of the smaller cages are empty. NMR and electrical
resistivity measurements on Cs8Ge136 showed this material is also metallic, also
consistent with band structure calculations performed on this material.32 A significant
result of this work showed that Ge type II clathrates are indeed stable under partial
occupation, thus offering a potential route toward tuning the electrical properties in these
materials for thermoelectric applications.

15
2.2.2 Thermal and Vibrational Properties
As with type I clathrates, the guest-host interactions and their relation to the
thermal properties is of particular interest in type II clathrates. As discussed in this
section, previous work suggests that the guests in type II clathrates undergo large,
anharmonic vibrations inside their atomic cages. The effects these local modes may have
on the lattice thermal conductivity are therefore of prime interest.
The isotropic atomic displacement parameter (ADP or Ueq) is a measure of the
mean square displacement (averaged over all directions) of an atom about its
“equilibrium” site in a crystal.62 Using single crystal X-ray diffraction, Nolas et al.25 have
measured the temperature dependence of the ADPs for stoichiometric type II Si and Ge
clathrates; the results are presented in Fig. 2.4. For all four compounds, the alkali guests
exhibit significantly larger ADPs than the framework atoms, and also show much
stronger temperature dependencies. This is an indication that the alkali guests “rattle” in
their atomic cages, corresponding to a relatively large amplitude dynamic disorder. Also
note that the ADP data for the various guests also shows good qualitative agreement with
the difference in sizes of guest and cage, as given in Table 2.1. Specifically, a trend is
apparent that the larger the difference between cage and guest, the larger the ADP and the
more pronounced the temperature dependence.
The vibrational properties of some type II clathrates have also been studied using
Raman spectroscopy. Nolas et al.63 reported the Raman spectra for stoichiometric type II
clathrates and for Si136, as shown in Figure 2.5. The local vibrational mode of the Cs

16
Figure 2.4 Temperature dependent ADPs for (a) Rb8Na16Si136, (b) Cs8Na16Si136, (c) Rb8Na16Ge136, and (d)
Cs8Na16Ge136, determined from single crystal X-ray diffraction. Reprinted with permission from G.S.
Nolas, D.G. Vanderneer, A.P. Wilkinson, and J.L. Cohn, J. Appl. Phys. 91, 8970 (2002). Copyright 2002,
American Institute of Physics.
atom in the lager E28 cage is in fact an optic mode and is Raman active. The site
symmetry at the Na atom in the smaller E20 cage results in this mode not being Raman
active, thus this “rattle” mode is not present in the spectra. Clearly, the mode at
approximately 50 cm-1 can be attributed to the rattling motion of the Cs atom in its cage,
as this mode is completely absent in the unfilled clathrate Si136.
(a)
(d) (c)
(b)

17
Figure 2.5 Raman scattering spectra of Si136 and Cs8Na16Si136. Note that the optic mode of the Cs atom in
the bottom spectrum is clearly absent in the spectra for Si136 in which no guest atoms are present. Reprinted
with permission from G.S. Nolas, C.A. Kendziora, J. Gryko, J. Dong, C.W. Myles, A. Poddar, and O.F.
Sankey, J. Appl. Phys. 92, 7225 (2002). Copyright 2002, American Institute of Physics.
The frequencies of some guest atoms in type II clathrates are given in Table 2.2,
as determined from ADP data,25 Raman scattering,63 and theoretical calculations.64 It has
been shown62,65 that an estimate of the vibrational frequencies of weakly bonded atoms in
a crystal can be extracted from ADP data by assuming a simple harmonic oscillator
model to describe the guest atom’s motion. This method can also be used to estimate
some of the physical properties of the material, such as the lattice thermal conductivity
and Debye temperature, ΘD.65 The frequencies in the table agree qualitatively, and all are

18
Table 2.2 Rattler frequencies in cm-1 as determined from Raman scattering,63 ADPs from single crystal
XRD,25 and theoretical calculations.63,64
Compound Cs or Rb Na Cs or Rb Na Cs or Rb Na
ADP Raman Theory
Cs8Na16Si136 53.4 141 57 --- 64 120
Rb8Na16Si136 55.0 130 --- --- --- ---
Cs8Na16Ge136 41.8 117 18 --- 21 89
Rb8Na16Ge136 42.9 127 --- --- --- ---
quite low. Indeed, theoretical calculations64 of phonon dispersion show that the “rattler”
modes cut the acoustic phonon branches, indicating the possibility for strong interaction
between the guest and framework vibrations.
Recently, the thermal conductivities of some type II clathrates have been
reported.25,66,67 The results for the unfilled silicon clathrate Si136 and completely filled
Cs8Na16Si136 are compared in Figure 2.6. The empty clathrate Si136 has a remarkably low
thermal conductivity, almost 30 times lower than elemental diamond-structured silicon at
room temperature, and approaches that of amorphous SiO2 (a-SiO2; glass). This result is
consistent with a theoretical calculation of the thermal conductivity of an unfilled type I
clathrate Ge46, which showed an order of magnitude decrease as compared to diamond
structured germanium. Because Si136 is essentially an electrical insulator,17 thermal
conduction in this material is almost entirely due to the lattice contribution. The notable
aspect of this result is that the thermal conductivity is low even in the absence of “rattler”
atoms inside the cages, where the resonant phonon scattering mechanism present in some
type I clathrates is absent in Si136. The stoichiometric Cs8Na16Si136 has a relatively higher

19
Fig. 2.6 Thermal conductivity of the crystalline silicon clathrate Si136 and Cs8Na16Si136. The solid line
indicates what would be a T3 dependence. Reproduced with permission from M. Beekman, G.S. Nolas, J.
Gryko, G.A. Lamberton, Jr., T.M. Tritt, and C.A. Kendziora, Electrochemical Society Proceedings 2003-
27, 217 (2004). Copyright 2003, the Electrochemical Society.
thermal conductivity, which can be attributed to the large electronic contribution due to
the metallic properties of this material. However, using the approach described by Sales
et al.,65 Nolas et al.25 estimated from the ADP data that the room temperature lattice
thermal conductivity of Cs8Na16Si136 to be on the order of 2 W/m-K.

20
2.3 Applications
In addition to the interesting physics that can be learned from type II clathrates,
these materials hold promise for a number of applications. One of the reasons for the
recent surge in interest in clathrates is due to the discovery of superconductivity in some
clathrate materials. The first report was for the type I clathrate Ba2Na6Si46,12 and further
reports soon followed. These materials are unique in that they are covalently bonded
superconductors. Investigations into superconductivity in type II clathrates have thus far
produced negative results.58 However, if found superconducting type II clathrates could
offer a useful system for studying the effects of the guest content on the superconducting
state, since the former may be varied in these materials.
Type II clathrate materials are also of interest for several potential applications
involving the solid state conversion of energy. For example, these materials are raising
continued interest in the field of thermoelectrics, 68 which is the conversion of electrical
energy to thermal energy, and vice versa. For certain materials, imposing a temperature
gradient across the material induces a corresponding electrical voltage. Under open
circuit and linear response conditions, this voltage ∆V is simply proportional to the
temperature difference, so that
TSV ∆=∆ , (2.1)
where S is a bulk material property know as the Seebeck coefficient or thermopower, and

21
∆T is the imposing temperature difference across the material. This most basic
thermoelectric effect is known as the Seebeck effect, and by convention the sign of S is
negative (positive) if the majority carriers are electrons (holes). In metals, the simplest
picture69 of the Seebeck effect can be described in terms of the differing thermal velocity
distributions of charge carriers at the hot and cold ends, in the steady state resulting in an
accumulation of net charge at the cold end and an accompanying potential difference
typically on the order of a few up to tens of µV for a ∆T of 1 K. The effect is significantly
larger in semiconductors,69 due to the fact that in addition to the differing thermal
velocity distributions, the Fermi-Dirac distributions at the hot and cold ends may also be
appreciably different, thus additionally causing varying carrier excitation with position.
Thus semiconductors typically have Seebeck coefficients of a few hundred to a few
thousand µV/K.
The usefulness of a thermoelectric material is given by its dimensionless figure of
merit ZT, where
TSZTκσ2
= . (2.2)
Here σ is the electrical conductivity, κ is the total thermal conductivity (κ = κe + κL, the
sum of the electronic and lattice contributions, respectively), and T is the absolute
temperature. The Seebeck effect can be used to generate power, converting the energy
from a heat source into electrical current when a thermoelectric circuit is connected to a
load. Figure 2.7 shows a schematic of a thermoelectric couple, in which n-type and p-

22
P N
Heat Source
Heat Sink
LoadI
Figure 2.7 Schematic of a thermoelectric couple designed for power generation. Reprinted with permission
from Ref. 70.
type materials are connected electrically in series and thermally in parallel, and a load is
connected to the circuit. The imposing temperature difference causes a current to flow in
the circuit, thus generating power.
Currently, state of the art thermoelectric materials for power generation have ZT
on the order of or less than 1, resulting in efficiencies for thermoelectric power
generation that are less than 30% of the Carnot limit.68 Thus power generation using
thermoelectric technology has been limited to niche applications, or in situations where
reliability and longevity outweigh efficiency and performance. An example is the case of

23
Radioisotope Thermoelectric Generators (RTGs) that provide the onboard power for
NASA deep space probes such as Voyager or Cassini.
Within the past two decades there has been much renewed interest in
thermoelectric materials research. One reason for this is Slack’s concept of the ideal
“Phonon Glass Electron Crystal” (PGEC) material.71 From Eq. (2.1), it is clear that a
good thermoelectric material must simultaneously possess good electrical properties (i.e.
high electrical conductivity and Seebeck coefficient) and low thermal conductivity. Thus
Slack proposed the design or discovery of materials that would conduct heat like a
structural glass (“Phonon Glass”) yet conduct electricity as in a high quality single crystal
semiconductor (“Electron Crystal”). In particular, Slack suggested72 that clathrate
materials may fulfill the requirements of a PGEC, and investigations by Nolas et al.15
among others73,74,75 have shown this approach to be valid in the search for new
thermoelectric materials. In addition to the good semiconducting properties that some
clathrates possess, several variants have been shown to have very low thermal
conductivities and in a few cases literally “glasslike.”23 The low thermal conductivity of
these materials has been attributed to the resonant scattering of the heat carrying
framework acoustic phonons by the localized vibration modes of the guest atoms.23
As discussed above, type II clathrates possess many similar properites as type I
clathrates, in particular the guest atoms in type II clathrates also display large anharmonic
motion inside of their cages. The lattice thermal conductivities of type II clathrates are in
general expected to be quite low. In addition, the ability to partially fill the cages in type
II clathrates allows for an additional control for simultaneously tuning all of the transport

24
Valence band
Conduction band
Photon
Carrier generation
n-type material
p-type materiale−
h+
Fermi level
Built-in electric field
properties in these materials. A deeper understanding of the transport properties in type II
clathrates is needed in order to assess the potential these materials hold for thermoelectric
applications.
Another potential application for type II clathrates is for photovoltaics, or the
direct conversion of light to electricity. Technologies such as photovoltaics are currently
attracting much attention as candidates to fulfill the world’s increasing energy needs.
However, currently the relatively low efficiency and high fabrication costs of solar cells
form a barrier preventing photovoltaics from significantly contributing to global energy
production. Figure 2.8 shows a simplified band diagram schematic of a conventional p-n
homojunction used for photovoltaic conversion of light into electricity. Typically,
production level solar cells have used a silicon p-n junction design, which has been
shown to have a 31% maximum energy conversion efficiency.76
Figure 2.8 Band diagram schematic of carrier generation in a p-n homojunction. The built-in electric field
caused by the p-n junction allows for separation of photo-generated electrons (e−) and holes (h+).

25
Commentary on the present status and future of photovoltaic technology has led
to the classification of first, second, and third generation PV materials.77,78,79 First
generation PV technology is based on single crystal and polycrystalline silicon wafer
devices. Second generation PV cells use thin film technology and include CdS/CdTe and
amorphous Si/SiGe or Si/H materials. The proposal for third generation PV materials78
includes finding (a) new approaches that dramatically increase the efficiency of devices,
via material mechanisms that are not limited to the 31% target efficiency of a single
junction device,76 and (b) development of technologies and materials possessing moderate
efficiencies but at a drastically reduced cost. Success in either or both of these areas could
enable photovoltaics to become a feasible large-scale energy conversion technology.78
Type II clathrates first attracted attention for photovoltaic and optoelectronic
applications upon the theoretical prediction16 and experimental confirmation17 that the
type II clathrate Si136 is a wide 2 eV band gap insulator, corresponding to absorption in
the visible part of the electromagnetic spectrum. As Si136 is a silicon-based material, type
II silicon clathrates could be integrated into currently used silicon technology. Moreover,
theoretical calculations by Moriguchi et al.80 show that alloyed Si136-xGex clathrates
possess direct band gaps in the range 1.2 to 2.0 eV. NaxSi136 clathrates have also been
investigated53 in hopes of finding potential intermediate band materials,81 an approach
directed towards finding materials that are not constrained to the Shockley-Queisser 31%
limit. The present work is part of an ongoing effort of experimentally investigating the
merit of type II clathrates for the above technological applications.

26
3
Synthesis and Sample Preparation
3.1 Degassing of Silicides and Germanides
One route to the synthesis of type II clathrates is through the controlled vacuum
decomposition known as “degassing” of alkali or alkaline earth silicides and germanides.
Several silicides and germanides were investigated in the present work, the synthesis
results of which are presented in this section.
3.1.1 Preparation of NaxSi136 clathrates
The NaxSi136 specimens produced in this work were synthesized using a multi-
step process, based on a modified procedure compared to what has been previously
reported in the literature.11 First, high purity sodium metal (Alfa Aesar, 99.95%) and
silicon powder (High Purity Chemicals, 99.999%) were combined in the ratio 1:(1 + δ)
silicon to sodium, where δ ~ 0.05 to 0.2. The additional Na metal ensures the complete
reaction of the silicon and compensates for the high vapor pressure of Na at elevated
temperatures. The product is the Zintl compound NaSi (see Figure 3.1), with an excess of
sodium. NaSi is very reactive in air and moisture, thus all handling of the materials was

27
Figure 3.1 Crystal structure of the Zintl phase NaSi, emphasizing the Si44- cluster units (blue) and Na+ ions
(orange). The monoclinic unit cell is outlined.
carried out in a nitrogen-filled glove box (VAC Atmospheres NEXUS System) with
oxygen levels less than 5 ppm. All NaSi products were analyzed using powder X-ray
diffraction (Rigaku MiniFlex and Bruker-Axs D8 Focus) and the diffraction patterns
compared to those in the literature82 to ensure the NaSi structure had formed and to verify
the absence of unreacted elemental silicon. The silicides were sealed under nitrogen on a
glass plate sample holder by thin plastic sealed with vacuum grease, to avoid
decomposition during X-ray diffraction measurements.
In the next step, small portions (~ 250 mg) of NaSi were ground to very fine
powders inside of the nitrogen-filled glove box. The powder was placed into fused quartz
boats, and then into a ¾ inch diameter fused quartz tube that was sealed on one end and
open at the other, the quartz boat with sample being placed at the sealed end. All quartz
tubes and boats were fabricated onsite in the Novel Materials Laboratory. A vacuum

28
Figure 3.2 Schematic of the custom vacuum furnace apparatus designed for degassing of the silicides and
germanides, and for further degassing of the clathrates.
coupling and valve was then attached to the open end of the tube and the valve closed to
ensure that the sample volume remained under a nitrogen atmosphere during the process
of removal from the glove box and attaching to the vacuum system. Upon attaching to the
vaccum system, the line was first evacuated and then the coupling valve opened to avoid
the sample coming in contact with air. A schematic of the custom-designed vacuum
furnace apparatus is shown in Figure 3.2.
Upon reaching a vacuum of 10-5 to 10-6 torr, the tube and sample were inserted
into a tube furnace, preheated to approximately 275oC. A thermocouple was placed
alongside the tube to measure the furnace temperature at the position of the sample
continuously throughout the synthesis process. Heating the NaSi at 275oC for
approximately 12 hours evaporated excess Na metal from the sample, which in turn

29
condensed on the inside of the quartz tube outside of the furnace. A small “test tube” was
also placed in this region to minimize any sodium vapor entering the vacuum line.
After being held at 275oC, the sample was then slowly heated to a temperature
between 410 and 430oC at an average rate of 1-2oC/min. As seen in Fig. 3.1, the structure
of NaSi consists of Na+ ions coordinated with tetrahedral Si44- units. As the temperature
is increased, the sodium ions are “evaporated” from the structure, likely as a neutral
species, presumably causing the Si clusters to “close in” on the remaining Na ions
forming the clathrate structures. The evaporated Na is allowed to condense on the inside
of the tube, in the region outside of the furnace. Using the above procedure, samples with
nominal compositions Na1Si136, Na8Si136, Na12Si136, and Na16Si136 were synthesized. The
synthetic products are very fine bluish powders, and the clathrates are stable in air,
moisture, and strong acids (excluding hydrofluoric acid).
As is well known to those skilled in the synthesis of Na-Si clathrates, the type II
structure is not the only possible product resulting from the above procedure. In fact, the
type I clathrate Na8Si46 is also commonly found as an impurity and it has been quite
difficult to avoid forming this phase.35,36 Previous authors have reported the type I phase
constituting as much as 50% by weight of the synthesis products.36 Inasmuch as Na8Si46
and NaxSi136 have different densities, Ramachandran et al.36 were able to reduce the
percent of the former in their samples to between 1 and 10%, using a density separation
technique. In the present work, we have achieved a much higher purity of the type II
NaxSi136 “as synthesized” than previously reported, without the need for additional
separation techniques. Although all of the specific synthesis details were not given in the

30
previous works, we can hypothesize some of the reasons that have led to better results in
this study. Great care was taken to grind the NaSi to very fine powders before degassing,
and this appears to increase the fraction of the NaxSi136 phase. Also, in general higher
yield of NaxSi136 was obtained by slowly heating the silicide to the synthesis temperature,
though this is in contrast to the results of Gryko83 who found that “flash-degassing” using
rapid heating rates minimizes the Na8Si46 fraction. Theoretical calculations16,53 of the
total energy predict that the NaxSi136 structure is slightly more thermodynamically stable
(lower total energy) than the Na8Si46 structure, thus a slower rate of heating could allow
the former to form in higher yield. Generally better results were also achieved in the
present study by using smaller amounts of starting material.
Initial microprobe analysis indicated a significant presence of oxygen (> 5 wt%)
in our NaxSi136 specimens. Therefore, a procedure was employed for all samples in which
the powders where first washed with a 5 M aqueous solution of hydrochloric acid, then
washed with distilled water, and finally washed with ethanol and then dried under
vacuum. The procedure was carried out inside a nitrogen-filled glove bag, and all liquids
were bubbled with high purity nitrogen gas prior to washing in order to remove oxygen
dissolved in the liquids. This procedure produced samples with greatly reduced oxygen
content (< 1 wt%).
After the acid washing procedure, the powder NaxSi136 specimens were further
ground using an alumina mortar and pestle in an inert nitrogen atmosphere, and then
densified by hot-pressing at 220oC and 5 kbar for 12 hours. This produced specimens
with densities of approximately 70% of the theoretical X-ray density. We note that this

31
0
20
40
60
80
100
270 290 310 330 350 370 390 410 430
Degas Temperature (C)
Rel
ativ
e XR
D In
tens
ity (N
orm
aliz
ed %
)
GeNa1-xGe3NaxGe136NaGe
density is rather low, resulting from the challenge posed in the densification of silicon-
based clathrates. Methods of obtaining higher density, such as spark plasma sintering
(SPS), are currently being investigated.
3.1.2 Preparation of NaxGe136 clathrates and the new phase Na1-xGe3
An extensive and systematic investigation into the synthesis of NaxGe136 was also
undertaken. The synthesis methods were essentially those explained above for NaxSi136,
but using the Zintl phase NaGe as starting material. The results of the investigation are
qualitatively summarized in Figure 3.3, which shows the relative percentages of various
products observed in the powder X-ray diffraction (XRD) patterns, determined from the
Figure 3.3 Qualitative representation of phase percentages from products obtained from thermal
decomposition of NaGe.

32
relative intensities of the diffraction peaks in the individual spectra. The figure was
compiled from the XRD spectra of more than two dozen separate samples. As shown in
the figure, the type II clathrate NaxGe136 was found to form in the range of 350 to 370oC,
but the yield was very low. Thus production of large enough pure samples for further
characterization was not possible. However, over a broader range of temperature an
initially unidentifiable Na-Ge phase was found to be the dominant synthesis product. As
discussed in Section 4.5, as a part of this work the crystal structure of the unknown phase
has been solved and its composition was determined to be Na1-xGe3 (0 < x < 1). This
constitutes the discovery of a new binary compound in the Na-Ge system.
3.1.3 Other Silicides and Germanides
In the course of this work, several other silicides and germanides were
investigated, however none produced type II clathrates in the high yield as found with
NaSi. As discussed in Section 2.1, there appears to be relative size constraints between
guest and framework polyhedra that limit the formation of the clathrates (see Table 2.1).
Upon further analysis of our results, combined with those in the literature, there appears
also to be correlation between the starting structures of the silicides and germanides and
the products that are formed upon their thermal decomposition. One common
characteristic of all silicides (germanides) that decompose to produce clathrates is the
presence of Si44- (Ge4
4-) clusters, which are coordinated with alkali or alkaline earth ions.
Presumably, upon degassing of the alkali or alkaline earth atoms these clusters reorganize

33
and connect to form the frameworks of the clathrate compounds. Thus, empirically the
presence of these four-atom clusters seems to be necessary for formation of the four-
bonded clathrate frameworks using the controlled vacuum decomposition technique.
Table 3.1 presents the structures of a variety of silicides and germanides and the
products that are obtained upon their thermal decomposition under vacuum, compiled
from the present work and from the literature. Most of the starting materials are
Table 3.1 Structures of various silicides and germanides and the products obtained by their thermal
decomposition. The original references are given in addition to the present work. Results from the present
work are shown in red. Type II products are shown in bold.
Compound
Space Group
Lattice
Structural Isotype
Decomposition Products
NaSi C2/c 84 monoclinic NaSi NaxSi136,11 Na8Si4611
KSi nP 34 85 cubic KSi K8Si4611
RbSi nP 34 85 cubic KSi Rb8-xSi4611
CsSi nP 34 85 cubic KSi CsxSi13611
NaGe P21/c 84 monoclinic NaGe NaxGe136,11 Na1-xGe3
KGe nP 34 85 cubic KSi K8Ge46-δ11
RbGe nP 34 85 cubic KSi Rb8Ge46-δ11
NaKGe2 nP 34 85 cubic KSi NaxKyGe136, NaxKyGe46-δ
NaRbGe2 nP 34 85 cubic KSi NaxRbyGe46-δ
NaRbSi2 unknown unknown unknown Rb8Na16Si13660
NaCsSi2 unknown unknown unknown Cs8Na16Si13659
BaNa2Si4 unknown monoclinic unknown NaxBa6Si46,12 Ba8Na16Si13630
BaNa2Ge4 unknown unknown unknown Ba24Ge10086

34
cubic, and result in type I clathrate as the majority phase. Overall, the only starting
material found to produce type II clathrate in high yield is NaSi. Note that none of the
other silicides or germanides listed in this table shares the NaSi crystal structure, though
NaGe is monoclinic but with different space group symmetry. This tabulation suggests
that the design or discovery of starting materials with the desired structures may be an
appropriate approach for the synthesis of type II silicon and germanium clathrates using
the Zintl phase decomposition method. We also note that several of the clathrate
compositions, including NaxKyGe46-δ, NaxRbyGe46-δ, and NaxKyGe136, were previously
unreported.
3.2 Direct Synthesis of Cs8Na16MyGe136-y Clathrates (M = Ag, Cu)
It was recently shown28 that type II clathrates can also be synthesized by direct
reaction of the elements. For the first time, we have synthesized in the present work type
II germanium clathrates in which the framework germanium atoms are substituted by
other species, specifically transition metal elements. This shows that type II clathrates are
stable under framework substitution, opening new doors to synthesis of novel type II
clathrates. In particular, this proves the ability to “dope” these compounds with other
atomic species, which holds promise for control of the electronic properties of type II
clathrates.
A series of silver and copper substituted samples was synthesized by the direct
reaction of high purity Na (99.95%, Alfa Aesar), Cs (99.98%, Alfa Aesar), Ge (99.999%,

35
High Purity Elements), and Ag (99.9%, Alfa Aesar) or Cu (99.9%, Alfa Aesar).
Stoichiometric amounts of the elements were combined in tungsten crucibles and sealed
in steel canisters (see Figure 3.4) under nitrogen atmosphere. The steel canisters were in
turn sealed inside quartz ampoules. The mixtures were held at 800oC for 2 days, slowly
cooled to 650oC, and then held at this temperature for 7 days. The samples were then
allowed to cool to room temperature; the synthesis schedule is show in Figure 3.4. We
note that the use of tungsten crucibles as opposed to niobium28 avoids reaction of the
crucible with germanium, allowing for a higher synthesis temperature and thus
approximately one-third the synthesis time (nine days as opposed to three to four weeks)
as previously reported in the synthesis of stoichiometric type II germanium clathrates.25,28
Figure 3.4 Temperature schedule for the synthesis of the framework substituted type II germanium
clathrates.

36
Using this procedure, series of Cs8Na16CuyGe136-y (y = 2.667, 3.14, 5, 8, 10, 16) and
Cs8Na16AgyGe136-y (y = 2.667, 5, 8) clathrates were synthesized. Here Cs atoms occupy
the larger hexacaidecahedra and Na atoms occupy the smaller dodecahedra, and the
transition metals substitute for the Ge atoms on the framework. The products generally
consist of coarsely grained crystalline powders along with some larger crystals (see
Figure 3.5), and are stable in air and moisture. Cu substituted samples with y = 5 and 8
were ground to 325 mesh and hot pressed at 400oC into pellets of approximately 80% of
the theoretical X-ray density. From X-ray diffraction, no structural transformation of
these samples was detected after hot-pressing.
Figure 3.5 Small clusters of as-grown crystallites of Cs8Na16CuyGe136-y clathrates.
1 mm

37
3.3 Partially Filled Type II Germanium Clathrates
As mentioned in Section 2.2, recently we have reported for the first time on the
synthesis of partially filled type II clathrate Cs8Ge136.32 Although the type I germanium
clathrates are found to be much less stable with respect to partial filling,87 type II
clathrates can be synthesized with the framework polyhedra partially occupied.
Other type II germanium clathrates can also be synthesized with partial
occupation. In the present work, a partially occupied NaxRb8Ge136 clathrate was
produced. First, a “fully loaded” Rb8Na16Ge136 clathrate was synthesized. Stoichiometric
amounts of high purity Na, Rb, and Ge were combined in a tungsten crucible, and the
reaction of the constituents carried out in a similar manner as in the metal substituted
clathrates above. The resulting Rb8Na16Ge136 clathrate was then ground to very fine
powder, and degassed under high vacuum at a temperature of 310oC for 24 hours, using
the apparatus shown in Figure 3.2. The sample was then reground under nitrogen,
degassed again at increased temperature of 320oC. This process was repeated, each time
increasing the temperature by 10 to 15oC, resulting in the degassing of Na from the
structure. As shown in Figure 3.6, as the degassing procedure progressed the lattice
parameter showed a decrease, corresponding to a slight shrinking of the structure on
removal of the Na guests. Also, from the inset of Figure 3.6 it is clear that the structure is
stable with respect to partial occupation of the voids, as was also found in the case of
Cs8Gs136.32 These results reveal yet another avenue that can be explored in synthesizing
novel type II clathrates, and also may offer a way to control the physical properties of
these materials.

38
Degas Temperature (oC)0 100 200 300 400 500
Latti
ce P
aram
eter
(Å)
15.30
15.35
15.40
15.45
15.50
2theta (degrees)20 30 40 50 60
Inte
nsity
(arb
itrar
y un
its)
**
*
Pre-degassing
Post-degassing
Figure 3.6 Lattice parameter of NaxRb8Ge136, as measured after vacuum degassing at the indicated
temperature. Open and closed circles indicate results from the present work on two different samples, while
the open triangle is from the work of Gryko (unpublished). The inset shows that the integrity of the
clathrate framework is maintained after the procedure; an “*” indicates an internal NIST silicon standard,
used to calibrate the peak positions.

39
4
Structural and Chemical Characterization
4.1 Characterization of NaxSi136 Clathrates
In has been shown previously35,36 that the X-ray diffraction (XRD) spectra of
NaxSi136 clathrates are highly dependent on the Na content x. This is illustrated in Figure
4.1, which shows simulated theoretical powder XRD spectra for NaxSi136 clathrates, as a
function of the sodium content x. These theoretical spectra were calculated by inputting
NaxSi136 structural details into the crystallography software PowderCell.88 Note that the
relative intensities of the Bragg peaks display a clear dependence on the Na content,
especially for the (311), (222), (511), and (531) reflections. This allows for the guest
content of samples to be determined quantitatively via refinement of experimental XRD
data. Furthermore, the relative intensities are also dependent upon the relative occupancy
of the two distinct polyhedron sites.
We have employed the Generalized Structure Analysis Software89 (GSAS) suite
as well as the PowderCell88 computer program to perform Rietveld analysis and
refinement on the NaxSi136 specimens in this study. The principle behind Rietveld
analysis90 is to perform a non-linear least squares fit to experimental diffraction data
using a structural model. Structural (i.e. lattice parameters, atomic positions, etc.) and
instrumental (i.e. peak shape, profile coefficients, zero shift, etc.) parameters may all be

40
Degrees 2θ
20 30 40 50 60
Inte
nsity
(arb
. uni
ts)
(331
)
(400
)
(422
)
(311
)
(440
)(5
31)
(711
)
(620
)
(553
)
(733
)
(555
)(8
22)
(840
)(7
53)(4
42)
(220
)
(222
)
(511
)
(533
)
x = 0
x = 4
x = 8
x = 12
x = 16
x = 20
x = 24
Figure 4.1 Simulated theoretical X-ray diffraction patterns for NaxSi136 clathrates as a function of the Na
content x, calculated using the PowderCell computer software. The lattice parameters were kept constant
for all compositions, and the 8b (larger cage) site was filled first as x was increased.

41
Degrees 2θ
10 20 30 40 50 60 70
Inte
nsity
(arb
. uni
ts)
+++++++++++++++++++++++++++++++++++++++++++++++++++++++++++++++++++++++++++++++++++++++++++++++++++++++++++++++++++++++++++++++++++++++++++++++++++++++++++++++++++++++++++++++++++++++++++++++++++++++++++++++++++++++++++++++++++++++++++++++++++++++++++++++++++++++++++++++++++++++++++++++++++++++++++++++++++++++++++++++++++++++++++++++++++++++++++++++++++++++++++++++++++++++++++++++++++++++++++++++++++++++++++++++++++++++++++++++++++++++++++++++++++++++++++++++++++++++++++++++++++++++++++++++++++++++++++++++++++++++++++++++++++++++++++++++++++++++++++++++++++++++++++++++++++++++++++
+++++++++++++++
+++
++++
++
++++++++++++++++++++++++++++++++++++++++++++++++++++++++++++++++++++++++++++++++++++++++++++++++++++++++++++++++++++++
+++++++++++++++++++
++
+
+
+
+
+++
+
+
+
+
+
++++++++++++++++++++++++++++++++++
+
+++++++
+
++++++++++++++++++++++++++++++++++++++++++++++++++++++++++++++++++++++++++++++++++++++++++++++++++++++++++++++++++++++++++++++++++++++++++++++++++++++
+++++++++++++++++++++++++++++++++++++++++++++++++++++++++++++++++++++++++++++++++++++++++++++++++++++++++++++++++
++++++++++++++++++++++++++++++++++++++++++++++++++++++++++++++++++++++++++++++++++++++++++++++++++++++
++++++++++++++++++++++++++++++++++++++++++++++++++++++++++++++++++++++++++++++++++++++++++++++++++++++++++++++++++++++++++++++++++++++++++++++++++++
+++++++++++++++
++++++++
+++
+++++++++++++++++++++++++++++++++++++++++++++++++++++++++++++++++++++++++++++++++++++++++++++++++++++++++++++++++++++++++++++++++
++++++++++++++++++++++++++++++++++++++++++++++++++++++++++++++++++++++++
++++++++++++++
+
+
+
+++++
+
+
++
+++++++++++++++++++++++++++++++++++++++++++++++++++++++++++++++++++++++++++++++++++++++++++++++++++++++++++++++++
++++++++++++++++++++++++++++++++++++++++++++++++++++++++++++++++++++++++++++++
++++++++++++++++++++++++++++++++++++++++++++++++++++++++++++++++++++++++++++++++++++++++++++++++++++++++++++++++++++++++++++++++++++++++++++++++++++++++++++++++++++++++++++++++++++++++++++++
++++++++++++++++++++++++++++++++++++++++++++++++++++++++++++++++++++++++++++++++++++++++++++++++++++++++++++++++++++++++++++++++++++++++++++++++++++++++++++++++++++++++++++++++++++++++++++++++++++++++++++++++++++++++++++++++++++++++++++++++++++++++++++++++++++++++++++++++++++++++++++++++++++++++++++++++++++++++++++++++++++++++++++++
+++++++++++++++++++++++++++++++++++++++++++++++++++++++++++++++++++++++++++++++++++++++++++++
++++++++++++++++++
+
++
+
++++++
+++++
+++++++++++++++++++++++++++++++++++++++++++++++++++++++++++++++++++++++++++++++++++++++++++++++++++++++++++++++++++++++++++++++++++++++++++++++
+++++++++++++++++++++++++++++++++++++++++++++++++++++++++++++++++++++++++++++++++++++++++++++++++++++++++++++++++++++++++++++++++++++++++++++++++++++++++++++++++++++++++++++++++++++++++++++++++++++++++++++++++++++++++++++++++++++++++++++++++++++++++++++++++++++++++++++++++++++++++++++++++++++++++++++++++++++++++++++++++++++++++++++++++++++++++++++++++++++++++++++++++++++++++++++++++++++++++++++++++++++++++++++++++++++++++++++++++++++++++++++++++++++++++++++++++++++++++++++++++++++++++++++++++++++++++++++++++++++++++++++++++++++++++++++++++++++++++++++++++++++++++++++++++++++++++++++++++++++++++++++++++++++++++++++++++++++
+++++++++++++++++++++++++++++++++++++++++++++++++++++++++++++++++++
silic
on
Na 8
Si 46
Na0.6Si136: 98.9%Na8Si46: 0.4%Silicon: 0.7%
refined, in order to determine the structural details of the sample under investigation.
Since the diffraction patterns of NaxSi136 clathrates depend sensitively on the guest atom
content, refinement of the X-ray diffraction data allows for the determination of the guest
concentration.
As noted in Section 3.1.1, high purity NaxSi136 samples were synthesized with
nominal Na contents of x = 1, 8, 12, and 16. Type II sodium-silicon clathrates with x = 1
and 8 were characterized in more detail. Figures 4.2 and 4.3 show typical refined powder
diffraction patterns for Na1Si136 and Na8Si136, respectively. The compositions determined
from refinement of the X-ray diffraction data were in turn corroborated from Energy
Dispersive X-ray Spectroscopy (EDS) performed by Dr. Jan Gryko at Jacksonville State
Figure 4.2 Refinement of powder XRD data for Na1S136. Peaks associated with Na8Si46 and diamond-
structure silicon are indicated by arrows.

42
Figure 4.3 GSAS fit of the powder XRD data for Na8Si136. The peak at approximately 33 degrees is due to
the presence of a small amount (~ 5 wt%) of Na8Si46 in the sample. Data collected and fit by Dr. Jan Gryko,
Jacksonville State University.
Table 4.1 Structure and composition of Na1Si136 and Na8Si136. Compositions are given as determined from
EDS and XRD refinement. Grain size was determined from optical micrographs taken on polished
densified samples, according to ASTM Standard E112-88
Sample Nominal Composition
Composition From EDS
Composition From XRD
Average Grain Size (mm)
Approximate wt% of Na8Si46
Na1Si136 Na1.7Si136 Na0.6Si136
4.5 0.5 Na8Si136 Na8.4Si136 Na8.8Si136
3.1 5.0

43
University. Some structural and compositional details for the Na1Si136 and Na8Si136
samples are given in Table 4.1.
One very useful method for characterization of the vibrational properties of
materials is Raman scattering spectroscopy. The Raman effect is due to the inelastic
scattering of light from a material, corresponding to the gain or loss of energy in the
material such as in the creation or annihilation of phonons. As shown in Figure 4.4,
Raman spectra were collected for Na1Si136 and Na8Si136 by Dr. Chris Kendziora at the
Naval Research Laboratory in Washington, D.C. The figure shows Stokes Raman
scattering spectra for the two samples in both parallel (VV) and perpendicular (HV)
Figure 4.4 Stokes Raman scattering spectra for Na1Si136 and Na8Si136. VV indicates parallel polarization,
HV indicates perpendicular polarization. The arrows indicate the Si136 framework modes.
Na8Si136 – HV Na8Si136 – VV Na8Si136 – HV 514nm
Na1Si136 – VV Na1Si136 – HV

44
Temperature (oC)
100 200 300 400 500 600 700
Hea
t Flo
w (a
rb. u
nits
, exo
= u
p)
Na1Si136
Na8Si136
Si136
polarizations using a 647 nm laser line. Also shown are data for Na8Si136 using 514 nm
laser light. The arrows in the figure indicate the Raman active silicon framework modes,
as determined in a prior work,63 and these spectra are a testament to the high quality of
the Na1Si136 and Na8Si136 samples.
To investigate the stability of type II silicon clathrates, differential scanning
calorimetry (DSC) measurements were performed using a TA Instruments Q600, under
flowing nitrogen gas at a pressure of 1 atm., in the range 100 to 800oC. Figure 4.5 shows
heat flow as a function of temperature for NaxSi136 samples with x = 0,17 1, and 8. The
NaxSi136 clathrates are stable until slightly above 600oC, at which point exothermic
decomposition to diamond structure silicon occurs, as verified by post-DSC XRD. The
Figure 4.5 Heat flow as a function of temperature for NaxSi136 samples with x = 0, 1, and 8.

45
fact that decomposition is exothermic agrees qualitatively with theoretical calculations
that predict the type II silicon framework to be slightly higher in energy than the ground
state of diamond structure silicon.16 It is interesting to note that at synthesis temperatures
(under vacuum of ~ 10-6 torr) in excess of 450oC, diamond-structure silicon becomes an
increasingly larger and eventually total percentage of the synthesis products. Thus clearly
the stability of these materials is dependent on pressure. The relatively high
decomposition temperature of the type II silicon clathrates indicates these materials may
hold promise for applications at elevated temperatures.
4.2 Characterization of Cs8Na16MyGe136-y Clathrates (M = Ag, Cu)
The type II germanium clathrates synthesized in this study constitute the first
framework substituted type II clathrates synthesized to date, with the single exception of
the report of Ba16Ga32Sn104 which was rather described as a Zintl compound.30
The results from the initial powder X-ray diffraction measurements (Rigaku
MiniFlex diffractometer) for the type II germanium clathrates are shown in Figure 4.6
(Ag-substituted) and Figure 4.7 (Cu-substituted). From the diffraction patterns, the
samples all appear essentially single-phase, with the exception of an occasional very
weak peak at approximately 27 degrees 2θ attributed to a trace amount of unreacted
elemental germanium. The NIST 640c internal silicon standard (peaks indicated by a “*”
in the bottom spectra of both figures) was added to the samples for XRD in order to
correct the peak positions for possible sample displacement and instrumental factors in

46
2theta (degrees)20 30 40 50 60
Inte
nsity
(arb
itray
uni
ts)
y = 0a = 15.478±0.007Å
y = 2.667a = 15.499±0.008Å
y = 5.000a = 15.500±0.016Å
y = 8.000a = 15.502±0.018 Å
(311
)(2
22)
(331
)(4
00)
(422
) (333
)(4
40)
(531
)
(642
)
(620
)
(731
) (733
)
(660
)(7
51)
(911
) (642
)
(442
)
***
calculation of lattice parameters. As seen in Figure 4.8, the lattice parameters of the Ag-
substituted type II germanium clathrates increased with substitution, while those for the
Cu-substituted samples decreased. The latter results are consistent with previous reports
on Cu-substituted type I germanium clathrates, which also showed a decrease in lattice
parameter.91 For both Ag and Cu samples, the leveling out of the lattice parameter with
Figure 4.6 Powder XRD patterns for Cs8Na16AgyGe136-y clathrates. An “*” indicates a peak due to the NIST
internal silicon standard used to calibrate the spectra, which is present in all patterns for 2theta corrections
used in the calculation of lattice parameters.

47
Degrees 2θ
20 30 40 50 60
Inte
nsity
(arb
itrat
y un
its)
y = 0a = 15.478±0.007Å
y = 3.140a = 15.440±0.016Å
y = 2.667a = 15.435±0.023Å
y = 5.000a = 15.408±0.014Å
y = 8.000a = 15.399±0.013Å
y = 10.000a = 15.390±0.017Å
y = 16.000a = 15.396±0.012Å
(331
)
(400
) (422
)
(333
)(4
40)
(531
)
(642
)
(620
)
(731
) (733
) (660
)(7
51)
(911
) (642
)
(442
)* * *
Figure 4.7 Powder XRD patterns for Cs8Na16CuyGe136-y clathrates. The “*” indicates a NIST internal
silicon standard used to calibrate the spectra, which is present in all patterns for 2theta corrections used in
the calculation of lattice parameters.

48
Transition metal content (y)
0 2 4 6 8 10 12 14 16 18
Latti
ce p
aram
eter
(ang
stro
ms)
15.36
15.38
15.40
15.42
15.44
15.46
15.48
15.50
15.52
15.54
Figure 4.8 Lattice parameter as a function of transition metal content for the Cs8Na16CuyGe136-y (closed
circles) and Cs8Na16AgyGe136-y (open triangles) clathrates. The Ag-substituted clathrates showed and
increase in lattice parameter, while the Cu-substituted samples showed a decrease. The leveling out of the
lattice parameters may indicate a solubility limit has been reached.
doping concentration indicates that a solubility limit may have been reached for transition
metal substitution, occurring at y ~ 3 for Ag and y ~ 8 for Cu.
Transport properties were measured on Cu substituted samples with y = 5 and 8.
Energy dispersive X-ray spectroscopy indicated average compositions of
Cs10.2Na16.2Cu4.7Ge131.3 and Cs9.1Na14.4Cu7.7Ge128.3 for these two samples, respectively.
Hereafter, these samples will be referred to as Cs8Na16Cu5Ge131 and Cs8Na16Cu8Ge128.

49
4.3 The New Compound Na1-xGe3
As discussed in Section 3.2, an extensive investigation into the synthesis of Na-
Ge type II clathrates resulted predominantly in an unidentifiable Na-Ge phase. In order to
identify this dominant phase, we initially turned to the literature. However, we found
conflicting reports. Several binary compounds have been reported for the Na-Ge system,
including NaGe,84,85 Na12Ge17,92 Na3Ge,93 and NaGe4.94 Some of these reports, in
particular for “NaGe4,”94 were disputed by other authors,95 who suggested instead that the
compound was in fact Ge or even a clathrate phase.95,96 Upon comparing our powder X-
ray diffraction data to the available literature and diffraction databases, the question of
the composition and structure of our unknown phase remained. Thus, in order to help
clarify the confusion in the literature and perhaps better understand the route to synthesis
of Na-Ge type II clathrates, we have further characterized this phase.
Using synchrotron X-ray diffraction experiments performed on approximately
600 mg of material, Dr. James Kaduk of Innovene and Dr. Winnie Wong-Ng of NIST
used a Monte Carlo simulation technique97 in order to solve the structure of the unknown
phase. The structure was then refined by the Rietveld method90 using the GSAS software
suite.89 From these results, we present a preliminary structural model for this new
material. The structure was indexed to a hexagonal unit cell with space group P6/m and
cell constants a = 15.05399(5) Å and c = 3.96845(2) Å. Some of the important structural
details for the new compound are given in Table 4.2, and the preliminary crystal structure
is shown in Figure 4.9.

50
Table 4.2 Preliminary structural data for the novel phase Na0.7Ge3,
space group P6/m, a = 15.05399(5) Å, c = 3.96845(2) Å.
Atom X y Z Uiso (Å 2) Site Occ. Ge1 .37332(8) .26958(8) 0 .0115(4) 1 Ge2 .04088(9) .59174(8) 0 .0106(4) 1 Ge3 .52012(9) .15164(9) ½ .0052(3) 1 Ge4 .48411(10) .30138(7) ½ .0071(3) 1 Na5 2/3 1/3 0 .02 1 Na6 .2539(6) .0639(7) ½ .088(4) .617(9)
Figure 4.9 A schematic of the structure of NaGe3, viewed along the c-axis at a slight tilt. Na atoms are
shown in orange, the Ge atoms in dark pink. The hexagonal unit cell is enlarged in the upper right, with the
crystallographic site designations labeled.
Ge1
Ge3
Ge4
Na5
Ge2
Na6

51
The material crystallizes in a complex zeolite-like structure, in which the
framework of the structure is built from Ge while Na atoms are found to be situated
inside the broad channel (Na6) as well as in the smaller hexagonal channels (Na5). In the
broad channel, the six Na6 sites are related to each other by 6-fold symmetry. Note from
Table 4.2 that while the Ge sites that define the framework of the structure are fully
occupied, the Na sites in the broad channel (Na6) are only partially filled in the sample
studied. If all sites are fully occupied, the chemical formula is NaGe3. As a result of this
partial occupancy, the chemical formula of this new phase is tentatively estimated to be
Na0.7Ge3, and the general chemical formula can be written as Na1-xGe3. Also from Table
4.2, the Na atoms at the Na6 sites possess a relatively large isotropic displacement
parameter, implying either a large static or dynamic disorder at these sites in the broad
channel. In the center of the broad channel, residual electron density was observed at
(0,0,½), the exact nature of which has yet to be determined.
Although the structural model proposed is preliminary, the model reproduces the
experimental X-ray diffraction patterns very well. Figure 4.10 shows a simulated
diffraction pattern calculated using the software PowderCell88 for NaGe3, i.e. with x = 0,
as compared to an experimental X-ray diffraction pattern for Na1-xGe3 collected at USF.
As seen in the figure, the two patterns show excellent agreement in features, indicating
the high quality of the preliminary model. The discovery of this new compound shows
that there is still new science and complexity to be found in simple binary systems and its
unique structure motivates further study which is currently underway by the author and
coworkers.

52
Degrees 2θ
20 30 40 50 60
Inte
nsity
(arb
. uni
ts)
(300
)
(001
)
(130
)(1
11)
(201
)
(211
)(2
30)
(301
)(4
10)
(221
)(1
31)
(330
)
(231
) (150
)
(501
)(3
40)
(250
)(3
31)
(151
)(0
02)
(102
)(6
01)
(341
)(5
21)
(620
)(6
11)
(312
)(7
10)
(531
)(5
40)
(142
)(2
70)
(332
)
(621
)
(101
)
(502
)
(411
)
Experimental XRDNa1-xGe3
Simulated XRDNaGe3
(500
)
(400
)
Figure 4.10 Powder X-ray diffraction of Na1-xGe3. The lower spectrum is a simulated XRD pattern for
NaGe3 (x = 0) calculated using the PowderCell program, with the Bragg reflections indexed. The upper
spectrum is an experimental XRD pattern from a Na1-xGe3 sample. The two patterns show very good
agreement in peak positions and relative intensities.

53
5
Transport Properties
Possibly the most interesting aspect of clathrate compounds is the transport
phenomena these materials exhibit. The transport properties of several of the samples
synthesized in this work have been studied. New transport phenomena in type II
clathrates are presented, with a central result of this work being that the transport
properties of type II clathrates depend strongly on the guest content and on framework
substitution.
5.1 Experimental Details
All transport measurements were performed using a custom built apparatus,70
consisting of a closed-cycle helium cryostat (Janis), Keithley Instruments 2100
multimeter and 2400 current sourcemeters, and a Lakeshore temperature controller.
Samples were mounted on a custom designed sample holder, allowing electrical
resistivity, Seebeck coefficient, and thermal conductivity measurements to be performed
on the same sample simultaneously during the same measurement cycle. Resistivity
measurements were performed using a standard four-probe arrangement. Seebeck
coefficient measurements were performed at each temperature by controlled sweeping

54
through temperature gradient and measurement of the corresponding voltage difference,
the slope of the straight line fit yielding the Seebeck coefficient. For thermal
conductivity, multiple temperature differences are stabilized at each temperature, and the
slope of applied power versus temperature difference yields thermal conductance, from
which thermal conductivity is extracted. For all three measurements, geometrical
considerations determine the largest portion of uncertainty in the measurement. For
resistivity and thermal conductivity, the largest source of uncertainty results from the
measurement of the cross-sectional area and contact separations, the ratio of which is
known as the geometrical factor. For Seebeck measurements, placement of the voltage
and thermocouple contacts such that they lie in the same cross-sectional plane is crucial.
The room temperature uncertainty in the transport measurements is estimated to be 3.5%
for resistivity, 5% for Seebeck coefficient, and 10% for thermal conductivity. Details of
the transport measurement system and sample mounting process can be found in Ref. 70.
5.2 Transport Properties of NaxSi136 Clathrates
As noted previously, the transport properties of NaxSi136 clathrates have not been
well characterized, though these materials were some of the first inorganic clathrates to
be synthesized almost forty years ago.10 In the present work electrical resistivity and
thermal conductivity measurements were performed on samples with compositions
Na1Si136 and Na8Si136. To the best of our knowledge, there exist no previous reports on
the thermal conductivity of NaxSi136 clathrates.

55
Temperature (K)0 50 100 150 200 250 300
Res
istiv
ity (m
ohm
-cm
)
10-1
100
104
105
106
107
108
109
Figure 5.1 Temperature dependent electrical resistivity of Na1Si136 (closed circles) and Na8Si136 (open
cicles), along with Cs8Na16Si13625 (closed squares).
Temperature dependent electrical resistivity measurements for Na1Si136, Na8Si136
and Cs8Na16Si136 are shown in Figure 3. The data for Cs8Na16Si136 are taken from Ref. 25.
The lack of low temperature measurements for the Na1Si136 specimen below 150 K is due
to the exceedingly high resistivity. The effect of the alkali is evident, with the room
temperature values for the resistivity spanning seven orders of magnitude between
Cs8Na16Si136 and Na1Si136, and the resistivity decreasing with increased alkali content.
The “completely filled” stoichiometric clathrate Cs8Na16Si136, which has Cs atoms inside
all of the hexakaidecahedra and Na atoms inside the smaller dodecahedra, exhibits
metallic conduction,25 while Na1Si136 and Na8Si136 show activated temperature

56
dependences. We note that since the density of these two specimens is relatively low
(~ 70% of the theoretical X-ray density), there may be a large contribution to the
resistivity due to poor contact between the polycrystalline grains. Thus the magnitude of
the intrinsic resistivity of the materials may be lower than that shown in Figure 5.1.
Nevertheless the data indicates the Na concentration directly influences the electrical
properties. The room temperature resistivities for Na1Si136 and Na8Si136 differ by
approximately two orders of magnitude, in agreement with the trend in room temperature
electrical conductivity reported by Cros et al.11 Obtaining high density is a challenge in
silicon-based clathrates and we are currently investigating different avenues in order to
address this issue.
The lattice thermal conductivity, κg, as a function of temperature for Na1Si136 and
Na8Si136 is shown in Fig. 5.2 along with that of single crystal diamond-structure silicon.98
The data for the type II silicon clathrates have been adjusted for porosity.99,100 Since
the resistivities of Na1Si136 and Na8Si136 are large, thermal conduction by electrons can be
neglected, assuming a Wiedemann-Franz relation, thus the thermal conductivity for these
type II silicon clathrates can be regarded as entirely due to the lattice. Na1Si136 shows a
very low κg, much lower than that of diamond-structure silicon. A similar result was
found previously for the guest-free clathrate Si136.66 First principles calculations101 of the
thermal conductivity for a "guest-free" clathrate (hypothetical type-I Ge46) indicated a
ten-fold decrease in lattice thermal conductivity compared with that of the diamond-
structure semiconductor (Ge) due to scattering of heat-carrying acoustic phonons by
zone-boundary modes "folded back" due to the increase in unit cell size.100 It is

57
Temperature (K)
10 100
κ g (W
/mK)
1
100
1000
Figure 5.2 Temperature dependent thermal conductivity of Na1Si136 (closed circles) and Na8Si136 (open
circles), along with that of single crystal diamond structure silicon (dashed line).
interesting to note that the κ values we reported for Si13666 are lower than that of Na1Si136,
for temperatures less than 300 K (κg at ~ 300 K are similar within experimental error).
Although the reason for this is not entirely understood, the intensive processing needed to
produce a completely empty clathrate,17 which involves repeated washing with
concentrated acids and heat treatment under vacuum, could cause lattice defects, thus
resulting in further lowering of the thermal conductivity relative to NaxSi136 clathrates
that have not undergone such processing. Nevertheless, evidently low κg values are
achieved in clathrate compounds with few or no atoms inside the polyhedra, due to the
intrinsic vibrational properties of the framework and the enlarged unit cell.

58
Though similar to that of Na1Si136 for T < 20 K, κg above 20 K for Na8Si136 shows
a lower κg with a very different temperature dependence compared with that of Na1Si136.
The magnitude is very low, similar to that of polycrystalline type I clathrates.23 In the
range 50 to 70 K there is a clear “dip” in κg. This feature in the temperature dependence
of thermal conductivity has in the past been attributed to the resonance scattering of
phonons by localized atomic or molecular vibrations.102,103,104 Such a feature can be
understood qualitatively in terms of the thermal occupation of phonons. The interaction
of localized vibrations with the heat carrying phonons in a solid will be strongest when
the phonon frequency closely matches the frequency of the localized vibration, allowing
for a resonant transfer of energy and scattering of the former. When the temperature is
such that a significant population of phonons with frequencies near the resonant
frequency carries the heat, a marked reduction in the thermal conductivity will result,
hence causing a dip-like feature. Indeed, in type I clathrates such as Sr8Ga16Ge30 and
Eu8Ga16Ge30,23,106 dips in the thermal conductivity were attributed to resonance scattering
of the heat-carrying acoustic phonons by the localized vibrations of the guest atoms
inside their cages, as shown in Figure 5.3. The significant suppression and dip-like
feature of the thermal conductivity indicate a similar effect may be occurring in Na8Si136
where one-third of the polyhedra are occupied by Na. From previous measurements on
Cs8Na16Si136 and other stoichiometric type II clathrates using single crystal XRD,25 the
atomic displacement parameters (ADP) suggest that the “guest” atoms in the type II
clathrates undergo large amplitude, localized vibrations. These results were corroborated
by Raman scattering experiments.63 Furthermore, inelastic neutron scattering

59
Figure 5.3 Low temperature lattice thermal conductivity for single crystalline Sr8Ga16Ge30 (circles) and
Eu8Ga16Ge30 (squares).105 The dashed line is data for amorphous SiO2, and the solid lines at fits to the
experimental data, which account for resonant phonon scattering. Reprinted figure with permission from
G.S. Nolas, T.J.R. Weakly, J.L. Cohn, and R. Sharma, Phys. Rev. B 61, 3845 (2000). Web:
http://link.aps.org/abstract/PRB/v61/p3845.
measurements of the phonon density of states106 as well as theoretical calculations64
indicate a strong interaction exists between the localized vibrations of the guests and the
host phonon modes in type II clathrates. Optical and ultrasound measurements on
Na1Si136 and Na8Si136 specimens, along with an investigation into NaxSi136 specimens
with varying Na concentrations, are currently underway.
The thermal conductivity data presented here for Na1Si136 and Na8Si136 indicate
that these materials are low thermal conductivity crystalline solids. In addition, κg data
on Na8Si136 may indicate localized disorder produced by the Na within the Si polyhedra

60
resulting in a further reduction in κg, as compared with low Na content type II silicon
clathrates. To the best of our knowledge this constitutes the first evidence from transport
measurements that the guest atoms have a dramatic effect on the thermal transport in type
II clathrates.
5.3 Transport Properties of Cs8Na16CuyGe136-y Clathrates
The electrical resistivity, Seebeck coefficient, and thermal conductivity of
Cs8Na16CuyGe136-y clathrates with y = 5 and 8 are reported, and compared to
Cs8Na16Ge136 (y = 0). All data shown for Cs8Na16Ge136 (y = 0) were taken from Ref. 25. It
is shown that Cu substitution for Ge on the framework has a significant effect on all of
the transport properties in these materials.
Figure 5.4 shows the temperature dependence of the resistivity for Cu substituted
samples. The effect of substituting Cu is an increase in the magnitude of the resistivity
with increasing Cu concentration. All three materials exhibit metallic behavior, with
resistivities that increase approximately linearly with temperature. To our knowledge, no
theoretical calculations exist for the electronic structure of framework-substituted type II
clathrates, though calculations32 for Cs8Na16Ge136 indicate this material to be a metal with
a Fermi level clearly within the conduction band, consistent with both transport25 and
NMR61 measurements. In a simplified interpretation, the electropositive guests in
clathrates can donate their valence electrons to the framework. The Cu in the framework
would act as a “trivalent acceptor,” since three electrons are needed to become

61
Figure 5.4 Temperature dependence of the electrical resistivity of Cs8Na16CuyGe136-y, with y = 0,25 5, and 8,
indicating the metallic behavior of these materials.
isoelectronic with Ge and participate in the tetrahedral bonding. Thus we can write the
expression (Cs1+)8(Na1+)16(Cu3-)yGe136-y. Within this picture, increasing the copper
content would correspond to decreasing the number of majority carriers per formula unit.
This simplified picture is consistent with our resistivity measurements. In addition, the
increased impurity scattering of the charge carriers by the Cu ions on the framework is a
likely contributor to the increase in magnitude of the resistivity with increasing Cu
content.
Measurements of the Seebeck coefficient (S) for these materials yielded
interesting results, as shown in Figure 5.5. As expected for materials possessing metallic
properties, the magnitudes of the Seebeck coefficients for the three samples are all
Temperature (K)
0 50 100 150 200 250 300 350
Res
istiv
ity (m
Ohm
-cm
)
0.0
0.5
1.0
1.5
2.0
2.5
3.0
3.5
4.0
Cs8Na16Cu5Ge131
Cs8Na16Ge136
Cs8Na16Cu8Ge128

62
relatively low. Upon Cu substitution from y = 0 to y = 5, the magnitude of the Seebeck
coefficient increased by approximately a factor of 2 at 300 K. This is consistent with the
increase in resistivity found for this Cu content, and the simple picture outlined above.
However, perhaps the most interesting aspect of the data is for the Cu content of y = 8.
This material shows a very small value of S of –1.6 µV/K at 300 K, which quickly
decreases to zero at approximately 230 K, and then changes sign below this temperature.
As the sign of the Seebeck coefficient is indicative of the type of majority charge carrier,
the transition from negative to positive S indicates a transition from electron (n-type) to
hole (p-type) conduction. This result constitutes the first observation of p-type conduction
in type II clathrates, and shows that framework-substitution in type II clathrates has a
Figure 5.5 Temperature dependence of the Seebeck coefficient for Cs8Na16CuyGe136-y, with y = 0,25 5, and
8. The sample with y = 8 shows p-type conduction below 220 K.
Temperature (K)
0 50 100 150 200 250 300
See
beck
Coe
ffici
ent (µ V
/K)
-15
-10
-5
0
5
Cs8Na16Cu5Ge131
Cs8Na16Ge136
Cs8Na16Cu8Ge128

63
significant effect on the electrical properties in these materials. Within the simplified
picture given above, the composition y = 8 corresponds to exact compensation of the 24
electrons per formula unit “donated” by the alkali guests to the framework, and the low
magnitude and change of sign of the Seebeck coefficient may indicate dual conduction in
this material. Again, theoretical calculations of the electronic structure in these materials
may help to elucidate the underlying physics.
The thermal conductivity was also found to be affected by the Cu substitution.
Figure 5.6 shows the total measured and estimated lattice thermal conductivity. The
thermal conductivity (κ) of a solid is typically expressed as the sum of electronic (κe) and
lattice (κg) contributions, so that κ = κe + κg. Since the Cs8Na16CuyGe136-y specimens
behave as metallic conductors, there is expected to be a significant contribution from the
Temperature (K)
10 100
Latti
ce T
herm
al C
ondu
ctiv
ity (W
/mK
)
1
10
Cs8Na16Ge136
Cs8Na16Cu5Ge131
Cs8Na16Cu8Ge128
Temperature (K)
10 100
Ther
mal
Con
duct
ivity
(W/m
K)
1
10
Figure 5.6 Thermal conductivity of Cs8Na16CuyGe136-y with y = 0,25 5, and 8. (a) Total measured thermal
conductivity. (b) Estimated lattice thermal conductivity.
(a) (b)

64
charge carriers. To estimate the lattice thermal conductivity (κg = κ − κe) the electronic
portion was estimated assuming the Weidemann-Franz relation κe = L0T/r, where L0 =
2.45×10⁻⁸ V2/K2 is the Lorenz number, T is the absolute temperature, and r is the
measured electrical resistivity. This was then subtracted from measured thermal
conductivity. In addition, as these samples were approximately 80% of the theoretical X-
ray density, the data were also corrected for porosity.99,100 The results are shown in Figure
5.6(b), and indicated a slight decrease in the magnitude of the thermal conductivity with
increasing Cu content. The reduction could conceivably be due to point-defect scattering
of phonons resulting from the difference in mass between Cu and Ge. No conclusive
evidence was found here for resonance contributions to phonon scattering from the Cs or
Na guests, though in the range 60 to 100 K, the same range in which the dip was
observed for Na8Si136, the thermal conductivity appears temperature independent for our
y = 8 specimen.
The data all show a significant upswing in the thermal conductivity at the higher
temperatures. A common source of error in thermal conductivity measurements is from
radiation absorbed or emitted from the sample if it is not at the same temperature as its
surroundings, since this is a source of power not accounted for in the measurement. This
can be explained using the Stefan-Boltzmann law,
)()( 440
440 SS TTCTTAP −=−= σε , (5.1)
where P is the total power radiated or absorbed, ε is the emissivity of the sample, σ is the

65
Stefan-Boltzmann constant, A is the surface area of the sample, T0 is the temperature of
the sample, TS is the temperature of the surroundings, and C = εAσ is a constant. During
measurement of the thermal conductivity, the sample is not at uniform temperature, since
a temperature difference of order ∆T ~ 0.5 K is applied to the sample. If we assume the
surroundings are at TS = T, and the sample is at T0 = T + ∆T, we have
. ]})[({
}){(
3
23
44
TCTTOTTC
TTTCP
∆≅
∆+∆=
−∆+=
(5.2)
We have ignored terms of order (∆T)2 and higher, since at all temperatures of interest
T >> ∆T. It is clear then that this radiation effect should follow a T3 temperature
dependence, and should be more important at higher temperatures. Figure 5.7 shows a
method by which the presence of effects from radiation can by verified, using the
Cs8Na16Ge136 sample25 as an example. The thermal conductivity is extrapolated from the
mid-range temperature dependence, as indicated by the dashed line. This extrapolated
portion is then subtracted from the measured portion, giving the difference ∆κ. If there
are significant radiation losses present, this difference is expected to follow a T3
dependence, as described above. As shown in the inset, this was found to be the case
indicating that the upswing is in fact likely due to radiation losses from the sample.
Similar analysis was performed for the two Cu substituted samples, which also showed
similar results. We note that the effect was much smaller in the Cu samples (see Figure
5.6), as compared to the Cs8Na16Ge136 sample which was measured on a system

66
Figure 5.7 Verification of losses due to radiation during the thermal conductivity measurement. The
dashed line represents the thermal conductivity extrapolated from the mid-range temperatures. The inset
shows the T3 dependence of ∆κ, indicating the upswing at the higher temperatures is likely due to radiation
losses from the sample.
elsewhere,25 indicating that the losses due to radiation are small for our measurement
system in the Novel Materials Laboratory, reinforcing the high quality of our transport
measurements system.
Temperature (K)
10 100
Ther
mal
Con
duct
ivity
(W/m
-K)
1
10
T3 (106 K3)
6 8 10 12 14 16 18 20 22 24 26 28∆κ
(W/m
-K)
0.6
0.8
1.0
1.2
1.4
1.6
∆κ
Total measuredthermal conductivity
Extrapolatedthermal conductivity

67
6
Summary and Future Directions
The impetus for the present work throughout has been the need for deeper
experimental investigation into the synthesis and physical properties of type II clathrates.
This follows from the unique and interesting properties these materials possess, their
potential for technological applications, and the significantly less attention that type II
clathrates have received thus far as compared to the type I structural subset. In particular,
a better understanding of the possible composition space for type II clathrates is needed
in order to better quantify the prospects these materials hold for applications. In this
section, some of the key results of this work are reviewed, and directions for future work
are discussed.
The present work has utilized a range of synthesis and characterization techniques
to explore new type II clathrate compositions, as well as to study the structural and
transport properties of these materials. For the first time, it has been shown that type II
clathrates are stable under substitution of the framework species. The substitution of Cu
for Ge in Cs8Na16CuyGe136-y type II clathrates is found to significantly affect the transport
properties, in particular the electronic transport. For Cu content of y = 8, a transition from
n-type to p-type majority conduction is observed below room temperature, the first such

68
observation of hole conduction in type II clathrates to date. These initial results suggest
the possibility that the electrical properties of type II clathrates could be controlled via
appropriate framework substitution, and give new direction for expanding the possible
compositions in type II clathrates.
An extensive investigation has been undertaken into the synthesis of type II
clathrates by route of degassing of alkali and alkaline earth silicides and germanides.
NaxSi136 clathrates, materials whose wide optical band gap is raising interest for
photovoltaic applications, have been successfully synthesized covering a range of Na
content, with significantly less type I Na8Si46 clathrate present as impurity as compared to
the research found in the literature. NaxSi136 samples with x = 1, 8 have been studied in
greater detail. These materials are stable up to 600oC, an encouraging result for higher
temperature applications. The electrical transport in these materials show resistivities that
decrease with Na content, and activated temperature dependences for Na1Si136 and
Na8Si136. This compared with the metallic behavior of the “fully loaded” Cs8Na16Si136
shows that the properties of type II silicon clathrates depend strongly on the guest atom
content and/or type. Indeed, the thermal conductivity measurements on theses materials
also revealed striking results. Na1Si136 and Na8Si136 clathrates are shown to be low-
thermal conductivity crystalline materials, in agreement with previous work on the
completely unfilled clathrate Si136. Although these compounds appear to be
“intrinsically” poor conductors of heat, the introduction of guest Na atoms into the cages
in Na8Si136 have a further dramatic effect. The thermal conductivity is reduced even
lower, and the data show an unmistakable dip in the temperature dependence. As this

69
phenomena has in the past been associated with resonant phonon scattering phenomena,
this may constitute the first evidence that localized vibrations of the guests in type II
clathrates may scatter the heat carrying phonons in type II clathrates, as has also been
found in type I clathrates. This warrants further investigation into the dynamics of the
guests, which is currently underway.
One challenge in the silicon-based type II clathrates is achieving high density in
the compacted polycrystalline samples. Currently used hot-pressing techniques have
produced samples with densities of the order of 70% of the theoretical X-ray density.
Although the clathrate framework was found to be stable to relatively high temperatures,
hot-pressing at elevated temperature is excluded as a possibility due to the sensitivity of
the composition x with temperature. This combined with the rigidity of the silicon
framework, and the inherent oxide layer that is ubiquitous in silicon materials, presents
obstacles to obtaining high density in NaxSi136 clathrates. One possible route being
investigated is Spark Plasma Sintering (SPS). In this method, high current densities are
passed through a sample, resulting in internal Joule heating, as opposed to external
heating of the press die with a heater coil as in conventional hot-pressing techniques. This
may hold promise in ensuring good contact between the grains through breaking of the
oxide layer, with the added advantage of densification at lower temperatures.
A number of other silicides and germanides were also investigated. Analysis of
the synthesis results, as well as the published literature revealed relationships between the
crystal structures of the intermediate compounds and synthesis products observed. A
systematic investigation into the synthesis of NaxGe136 did produce the clathrate, however

70
the yield was too small and of poor quality to produce samples for transport
measurements. Rather the dominant phase over a range of several tens of degrees Celsius
consisted of a newly discovered compound of general chemical formula Na1-xGe3. The
structural solution of the material revealed a novel crystal structure, and this new material
warrants further study which is currently underway.
In summary, this work has expanded the currently small body of knowledge that
exists concerning type II clathrate materials, as well as opening new doors in the
synthesis of clathrates. These materials continue to attract interest due to the unique
properties they possess, and the prospects they hold for useful applications. This work
has shown clearly that type II clathrates offer a class of materials in which new physics,
materials science, and solid state chemistry can be discovered.

71
References 1. G.S. Nolas, G.A. Slack, and S.B Schujman, “Semiconducting Clathrates: Phonon
Glass Electron Crystal Material with Potential for Thermoelectric Applications,” in Semiconductors and Semimetals V. 69, Ed. T.M. Tritt, Academic Press, San Diego, p. 255 (2001).
2. G.A. Jeffrey, “Hydrate Inclusion Compounds,” in Inclusion Compounds V. 1, Ed. J.L Atwood, J.E. Davies, D.D. MacNicol, Academic Press, London, p. 135 (1984).
3. E.D. Sloan, Jr., Nature 426, 353 (2003). 4. E. Suess, G. Bohrmann, J. Greinert, and E. Lausch, “Flammable Ice,” Scientific
American, November 1999, p. 76. 5. W.L. Mao, H.-K. Mao, A.F. Goncharov, V.V. Struzhkin, Q. Guo, J. Hu, J. Shu, R.J.
Hemley, M. Somayazulu, Y. Zhao, Science 297, 2247 (2002). 6. P. Rogl, Proc. of the 24th International Conf. on Thermoelectrics, p. 440 (2005). 7. J. Dünner and A. Mewis, Z. Anorg. Allg. Chem. 621, 191 (1995). 8. N.L. Okamoto, T. Nishii, M.W. Oh, and H. Inui, Mater. Res. Soc. Symp. Proc. 793,
187 (2004). 9. W. Carrillo-Cabrera, S. Budnyk, Y. Prots, and Y. Grin, Z. Anorg. Allg. Chem. 630,
2267 (2004). 10. J.S. Kasper, P. Hagenmuller, M. Pouchard, and C. Cros, Science 150, 1713 (1965). 11. C. Cros, M. Pouchard, and P. Hagenmuller, J. Solid State Chem. 2, 570 (1970). 12. H. Kawaji, H. Horie, S. Yamanaka, and M. Ishikawa, Phys. Rev. Lett. 74, 1427
(1995). 13. S. Yamanaka, E. Enishi, H. Fukouka, and M. Yasukawam, Inorg. Chem. 39, 56
(2000). 14. F.M. Grosche, H.Q. Yuan, W. Carrillo-Cabrera, S. Paschen, C. Langhammer, F.
Kromer, G. Sparn, M. Baenitz, Y. Grin, and F. Steglich, Phys. Rev Lett. 87, 247003 (2001).
15. G.S. Nolas, J.L. Cohn, G.A. Slack, and S.B. Schujman, Appl. Phys. Lett. 73, 178 (1998).
16. G.B. Adams, M O’Keeffe, A.D. Demkov, O.F. Sankey, and Y.-M. Huang, Phys. Rev B 49, 8048 (1994).
17. J. Gryko, P.F. McMillan, R.F. Marzke, G.K. Ramachandran, D. Patton, S.K. Deb, and O.F. Sankey, Phys. Rev. B 62, R7707 (2000).
18. K. Moriguchi, S. Munetoh, and A. Shintani, Phys. Rev. B 62, 7138 (2000). 19. T. Kawaguchi, K. Tanigaki, and M. Yasukawa, Appl. Phys. Lett. 77, 3438 (2000). 20. S. Pachen, W. Carrillo-Cabrera, A. Bentien, V.H. Tran, M. Baenitz, Yu. Grin, and
F. Steglich, Phys. Rev. B 64, 214404 (2001). 21. X. Blase, P. Gillet, A. San Miguel, and P. Mélinon, Phys. Rev. Lett. 92, 215505
(2004). 22. D. Connétable, V. Timoshevskii, E. Artacho, and X. Blasé, Phys. Rev. Lett. 87,
206405 (2001).

72
23. J.L. Cohn, G.S. Nolas, V. Fessatidis, T.H. Metcalf, and G.A. Slack, Phys. Rev. Lett. 82, 779 (1999).
24. G.S. Nolas, J.-M. ward, J. Gryko, L. Qiu, and M.A. White, Phys. Rev. B B 64, 153201 (2001).
25. G.S. Nolas, D.G. Vanderneer, A.P. Wilkinson, and J.L. Cohn, J. Appl. Phys. 91, 8970 (2002).
26. B.C. Sales, B.C. Chakoumakos, R. Jin, J.R. Thompson, and D. Mandrus, Phys. Rev. B 63, 245113 (2001).
27. J.-T. Zhao and J.D. Corbett, Inorg. Chem. 33, 5721 (1994). 28. S. Bobev and S.C. Sevov, J. Solid State Chem. 153, 92 (2000). 29. R.D. Shannon and C.T. Prewitt, Acta Crystallogr. B 25, 925 (1969). 30. T. Rachi, K. Tanigaki, R. Kumashiro, J. Winter, and H. Kuzmany, Chem. Phys.
Lett. 409, 48 (2005). 31. R. Kröner, K. Peters, H.G. von Schnering, and R. Nesper, Z. Kristallogr. NCS 213,
664 (1998). 32. J. Gryko, R.F. Marzke, G.A. Lamberton, Jr., T.M. Tritt, M. Beekman, and G.S.
Nolas, Phys. Rev. B 71, 15208 (2005). 33. J. Gryko, P.F. McMillan, R.F. Marzke, G.K. Ramachandran, D. Patton, S.K. Deb,
and O.F. Sankey, Phys. Rev. B 62, R7707 (2000). 34. C. Cros, “Sur quelques nouveaux siliciures et gemaniures alcalins à structure
clathrate: etude cristallochimique et physique,” Doctoral Thesis, University of Bordeaux, Bordeaux, France (1970).
35. E. Reny, P. Gravereau, C. Cros, and M Pouchard, J. Mater. Chem. 8, 2844 (1998). 36. G.K. Ramachandran, J. Dong, J. Diefenbacher, J. Gryko, R.F. Marzke, O.F. Sankey,
and P.F. McMillan, J. Solid State Chem. 145, 716 (1999). 37. P. Mélinon, P. Kéghélian, A. Perez, B. Champagnon, Y. Guyot, L. Saviot, E. Reny,
C. Cros, M. Pouchard, and A.J. Dianoux, Phys. Rev. B 59, 10099 (1999). 38. Y. Guyot, B. Champagnon, E. Reny, C. Cros, M. Prouchard, P. Melinon, A. Perez,
and I Gregora, Phys. Rev. B 57, R9475 (1998). 39. Y. Guyot, L. Grosvalet, B. Champagnon, E. Reny, C. Cros, and M. Pouchard, Phys.
Rev. B 60, 14507 (1999). 40. P. Mélinon, P. Kéghélian, X. Blasé, J. Le Brusc, A. Perez, E. Reny, C. Cros, and M.
Pouchard, Phys. Rev. B 58, 12590 (1998). 41. F. Brunet, P. Mélinon, A. San Miguel, P. Kéghélian, A. Perez, A.M. Flank, E. Reny,
C.Cros, and M. Pouchard, Phys. Rev. B 61, 16550 (2000). 42. F. Tournus, B. Masenelli, P. Mélinon, D. Connétable, X. Blase, A.M. Flank, P.
Lagarde, C. Cros, and M. Pouchard, Phys. Rev. B 69, 035208 (2004). 43. H. Yahiro, K. Yamaji, M. Shiotani, S. Yamanaka, and M. Ishikawa, Chem. Phys.
Lett. 246, 246 (1995). 44. J. Gryko, P.F. McMillan, and O.F. Sankey, Phys. Rev. B 54, 3037 (1996). 45. J. Grkyo, P.F. McMillan, R.F. Marzke, A.P. Dodokin, A.A. Demkov, and O.F.
Sankey, Phys. Rev. B 57, 4172 (1998). 46. F. Shimizu, Y. Maniwa, K. Kume, H. Kawaji, S. Yamanaka, and M. Ishikawa,
Synth. Mater. 86, 2142 (1997). 47. J. He, D.D. Klug, K. Uehara, K.F. Preston, C.I. Ratcliffe, and J.S. Tse, J. Phys.
Chem. B 105, 3475 (2001).

73
48. E. Reny, M. Ménétrier, C. Cros, M. Pouchard, and J. Sénégas, C.R. Acad. Sci. Paris, 1, 129 (1998).
49. H. Libotte, J.-P. Gaspard, A. San Miguel, and P. Mélinon, Europhys. Lett. 64, 757 (2003).
50. H. Libotte and J.-P. Gaspard, High Press. Res. 24, 139 (2004). 51. A.A. Demkov, O.F. Sankey, K.E. Schmidt, G.B. Adams, and M. O’Keeffe, Phys.
Rev. B 50 17001 (1994). 52. V.I. Smelyansky and J.S. Tse, Chem. Phys. Lett. 264, 459 (1997). 53. J.C. Conesa, C. Tablero, and P. Wahnón, J. Chem. Phys. 120, 6142 (2004). 54. M. Menon, E. Richter, and K.R. Subbaswamy, Phys. Rev. B 56, 12290 (1997). 55. D. Kahn and J.P. Lu, Phys. Rev. B 56, 13898 (1997). 56. J. Dong, O.F. Sankey, and G. Kern, Phys. Rev. B 60, 950 (1999). 57. N.F. Mott, J. Solid State Chem. 6, 348 (1973). 58. S.B. Roy, K.E. Kim, and A.D. Caplin, Phil. Mag. B 65, 1445 (1992). 59. G.K. Ramachandran, J.J. Dong, O.F. Sankey, and P.F. McMillan, Phys. Rev. B 63,
033102 (2001). 60. S. Latturner, B.B. Iversen, J. Sepa, V. Srdanov, and G. Stucky, Phys. Rev. B 63,
125403 (2001). 61. R.F. Marzke, G.S. Nolas, and J. Gryko, Mat. Res. Soc. Symp. Proc. 691, 439
(2002). 62. J.D. Dunitz, V. Schomaker, and K.N. Trueblood, J. Phys. Chem. 92, 856 (1988). 63. G.S. Nolas, C.A. Kendziora, J. Gryko, J. Dong, C.W. Myles, A. Poddar, and O.F.
Sankey, J. Appl. Phys. 92, 7225 (2002). 64. C.W. Myles, J.J. Dong, and O.F. Sankey, Phys. Stat. Sol. B 239, 26 (2003). 65. B.C. Sales, B.C. Chakoumakos, D. Mandrus, and J.W. Sharp, J. Solid State. Chem.
146, 528 (1999). 66. G.S. Nolas, M. Beekman, J. Gryko, G.A. Lamberton, Jr., T.M. Tritt, and P.F.
McMillan, Appl. Phys. Lett. 82, 910 (2003). 67. M. Beekman, G.S. Nolas, J. Gryko, G.A. Lamberton, Jr., T.M. Tritt, and C.A.
Kendziora, Proc. Electrochem. Soc. 2003-27, 271 (2004). 68. G.S. Nolas, J. Sharp, and H.J. Goldsmid, Themoelectrics: Basic Principles and New
Materials Developments. Springer-Verlag, New York, 2001. 69. A.F. Ioffe, Physics of Semiconductors. Academic Press, New York, 1960. 70. J. Martin, M.S. Thesis, University of South Florida (2005). 71. G.A. Slack, “New Materials and Performance Limits for Thermoelectric Cooling”
in CRC Handbook of Thermoelectrics, D.M. Rowe, Editor, CRC Press, Boca Raton, 1995.
72. G.A. Slack, Mat. Res. Soc. Symp. Proc. 478, 47 (1997). 73. B.C. Sales, D. Mandrus, B.C. Chakoumakos, V. Keppens, and J.R. Thompson,
Phys. Rev. B. 56, 15081 (1997). 74. K. Takahata, Y. Iguchi, D. Tanaka, T. Itoh, and I. Terasaki, Phys. Rev. B 61, 12551
(2000). 75. G.J. Snyder, M. Christensen, E. Nishibori, T. Caillat, and B.B. Iversen, Nature Mat.
3, 458 (2004). 76. W. Shockley and H.J. Queisser, J. Appl. Phys. 32, 510 (1961).

74
77. S.E. Shaheen, D.S. Ginely, and G.E. Jabbour, Bull. Mater. Res. Soc. 30, 10 (2005). 78. M.A. Green, Physica E 14, 65 (2002). 79. M.A. Green, Solar Energy 76, 3 (2004). 80. K. Moriguchi, S. Munetoh, and A. Shintani, Phys. Rev. B 62, 7138 (2000). 81. A. Luque and A. Marti, Phys. Rev. Lett. 78, 26 (1997). 82. G.K. Ramachandran, Ph.D. Dissertation, Arizona State University (2000). 83. J. Gryko, U.S. Patent No. 6,423,286 B1, July 23, 2002. 84. V.J. Witte, H.G. Schnering, and V.W. Klemm, Z. anorg. allg. Chemie 327, 260
(1964). 85. V.R. Schäfer and W. Klemm, Z. anorg. allg. Chemie 312, 12 (1961). 86. H. Fukuoka, K. Iwai, S. Yamanaka, H. Abe, K. Yoza, and L. Häming, J. Solid State
Chem. 151, 117 (2000). 87. S. Erickson, Undergraduate Honors Thesis, University of South Florida (2005). 88. W. Kraus and G. Nolze, J. Appl. Cryst. 29, 301 (1996). 89. A.C. Larson and R.B. Von Dreele, "General Structure Analysis System (GSAS)",
Los Alamos National Laboratory Report LAUR 86-748 (1994). 90. The Rietveld Method, ed. R.A. Young, Oxford University Press, Oxford, 1993. 91. Y. Li, J. Chi, W. Gou, S. Khandekar, and J.H. Ross, Jr., J. Phys: Condens. Matter
15, 5535 (2003). 92. W. Carrillo-Cabrera, R.C. Gil, M. Somer, O. Persil, and H.G. von Schering, Z.
Anorg. Allg. Chem. 629, 601 (2003). 93. M.E. Drits, V.F. Potemkin, and L.L. Zusman, Izv. Akad. Nauk SSSR, Neorg. Mater.
18, 1148 (1982). 94. F. Potemkin, R.A. Sizov, L.L. Zusman, and M.E. Drits, Izv. Akad. Nauk SSSR,
Met. 3, 197 (1989). 95. J. Sangster and A.D. Pelton, J. Phase Equilibria 18, 295 (1997). 96. H.G. von Schnering, M. Baitinger, U. Bolle, W. Carrillo-Cabrera, J. Curda, Y. Grin,
F. Heinemann, J. Llanos, K. Peters, A. Schmeding, and M. Somer, Z. Anorg. Allg. Chem. 623, 1037 (1997).
97. K. Brandenburg and H. Putz, Endeavour software package vs. 1.2d, Crystal Impact GbR (2004).
98. C.J. Glassbrenner and G.A. Slack, Phys. Rev. 134, A1058 (1964). 99. S.L. Loeb, J. Am. Ceram. Soc. 37, 96 (1954). 100. J. Francl and W.D. Kingery, J. Am. Ceram. Soc. 37, 99 (1954). 101. J. Dong, O.F. Sankey, and C.M. Myles, Phys. Rev. Lett. 86, 2361 (2001). 102. R.O. Pohl, Phys. Rev. Lett. 8, 481 (1962). 103. C.T. Walker and R.O. Pohl, Phys. Rev. 131 1422 (1963). 104. R. Berman, Thermal Conduction in Solids, Oxford University Press, Oxford, 1976. 105. G.S. Nolas, T.J.R. Weakly, J.L. Cohn, and R. Sharma, Phys. Rev. B 61, 3845
(2000). 106. P. Mélinon, P. Kéghélian, A. Perez, B Champagnon, Y. Guyot, L. Saviot, E. Reny,
C. Cros, M. Pouchard, and A.J. Dianoux, Phys. Rev. B 59, 10099 (1999).

75
Bibliography 1. R. Berman, Thermal Conduction in Solids, Oxford University Press, Oxford, 1976. 2. A.F. Ioffe, Physics of Semiconductors. Academic Press, New York, 1960. 3. C. Kittel, Introduction to Solid State Physics, 2nd Ed., John Wiley & Sons, Inc., New
York, 1956. 4. G.S. Nolas, J. Sharp, and H.J. Goldsmid, Thermoelectrics: Basic Principles and
New Materials Developments, Springer, New York, 2001. 5. The Reitveld Method, Ed. R.A. Young, Oxford University Press, Oxford, 1993.