Synthesis and Characterization of Copolycarbonates Derived ...
114
Louisiana State University LSU Digital Commons LSU Historical Dissertations and eses Graduate School 1993 Synthesis and Characterization of Copolycarbonates Derived From 2,2,4,4-Tetramethyl-1,3-Cyclobutanediol. Carey Cecil Geiger Louisiana State University and Agricultural & Mechanical College Follow this and additional works at: hps://digitalcommons.lsu.edu/gradschool_disstheses is Dissertation is brought to you for free and open access by the Graduate School at LSU Digital Commons. It has been accepted for inclusion in LSU Historical Dissertations and eses by an authorized administrator of LSU Digital Commons. For more information, please contact [email protected]. Recommended Citation Geiger, Carey Cecil, "Synthesis and Characterization of Copolycarbonates Derived From 2,2,4,4-Tetramethyl-1,3-Cyclobutanediol." (1993). LSU Historical Dissertations and eses. 5634. hps://digitalcommons.lsu.edu/gradschool_disstheses/5634
Transcript of Synthesis and Characterization of Copolycarbonates Derived ...
Louisiana State UniversityLSU Digital Commons
LSU Historical Dissertations and Theses Graduate School
1993
Synthesis and Characterization ofCopolycarbonates Derived From2,2,4,4-Tetramethyl-1,3-Cyclobutanediol.Carey Cecil GeigerLouisiana State University and Agricultural & Mechanical College
Follow this and additional works at: https://digitalcommons.lsu.edu/gradschool_disstheses
This Dissertation is brought to you for free and open access by the Graduate School at LSU Digital Commons. It has been accepted for inclusion inLSU Historical Dissertations and Theses by an authorized administrator of LSU Digital Commons. For more information, please [email protected].
Recommended CitationGeiger, Carey Cecil, "Synthesis and Characterization of Copolycarbonates Derived From 2,2,4,4-Tetramethyl-1,3-Cyclobutanediol."(1993). LSU Historical Dissertations and Theses. 5634.https://digitalcommons.lsu.edu/gradschool_disstheses/5634
INFORMATION TO USERS
This manuscript has been reproduced from the microfilm master. UMI films the text directly from the original or copy submitted. Thus, some thesis and dissertation copies are in typewriter face, while others may be from any type of computer printer.
The quality of this reproduction is dependent upon the quality of the copy submitted. Broken or indistinct print, colored or poor quality illustrations and photographs, print bleedthrough, substandard margins, and improper alignment can adversely affect reproduction.
In the unlikely event that the author did not send UM I a complete manuscript and there are missing pages, these will be noted. Also, if unauthorized copyright material had to be removed, a note will indicate the deletion.
Oversize materials (e.g., maps, drawings, charts) are reproduced by sectioning the original, beginning at the upper left-hand comer and continuing from left to right in equal sections with small overlaps. Each original is also photographed in one exposure and is included in reduced form at the back of the book.
Photographs included in the original manuscript have been reproduced xerographically in this copy. Higher quality 6" x 9" black and white photographic prints are available for any photographs or illustrations appearing in this copy for an additional charge. Contact UMI directly to order.
Reproduced with permission of the copyright owner. Further reproduction prohibited without permission.
University Microfilms International A Bell & Howell Information Company
300 North Zeeb Road. Ann Arbor, Ml 48106-1346 USA 313/761-4700 800/521-0600

Reproduced with permission of the copyright owner. Further reproduction prohibited without permission.

Order Num ber 9419888
Synthesis and characterization of copolycarbonates derived from 2,2,4,4-tetram ethyl-l,3-cyclobutanediol
Geiger, Carey Cecil, Ph.D.
The Louisiana State University and Agricultural and Mechanical Col., 1993
U M I300 N. Zeeb Rd.Ann Arbor, M I 48106
Reproduced with permission of the copyright owner. Further reproduction prohibited without permission.

Reproduced with permission of the copyright owner. Further reproduction prohibited without permission.

SYNTHESIS AND CHARACTERIZATION OF COPOLYCARBONATES DERIVED FROM 2,2,4,4-TETRAMETHYL-1,3-CYCLOBUTANEDIOL
A Dissertation
Submitted to the Graduate Faculty of Louisiana State University
Agricultural and Mechanical College in partial fulfillment of the
requirements for the degree of Doctor of Philosophy
in
The Department of Chemistry
byCarey Cecil Geiger
B.S., University of Southern Mississippi, 1987 December 1993
Reproduced with permission of the copyright owner. Further reproduction prohibited without permission.
Acknowledgments
It would be a terrible error if the first paragraph of this thesis is not
devoted to Dr. William H. Daly. His dedication, knowledge and inspiration
have been invaluable to this research and thesis. While on sabbatical leave
at IBM, Dr. Daly initialized this research and much of discussed results in this
thesis are a repetition of his work. Also, his patience with the weekend golfer
and fisherman are appreciated. Finally, the properties of the TMCBD
homopolycarbonate and the BisTP/TMCBD copolymers are results from his
research.
Dr. Soo Lee and Dr. loan Negulescu need to be thanked. Both of them
spent valuable time measuring the thermal properties discussed in chapter 4.
The crystal structures listed in the appendix were solved by Dr. Frank
Fronczek. Dr. Paul Russo loaned his lab equipment to this research. Dr.
Andy Maverick, Dr. Mark McLaughlin, Dr. James Robinson and Dr. William
Bernard served as committee members and gave valuable assistance.
Zhaoyao Qiu, Doris Culberson, Kim Ngo, Dr. Drew Poche' and Dr. Marrietta
Aniano-llao gave their time and advice to this research. Louisiana State
University and IBM provided financial support.
Fred Koch provided friendship and entertainment during graduate
school, and had the undesirable job of editing the first draft. My father and
step-father provided the occasional kick to the seat of pants that led to the
completion of this work. Finally, I am dedicating this work to my mother and
sisters who provided encouragement, moral support and good food.
ii
Reproduced with permission of the copyright owner. Further reproduction prohibited without permission.
Table of Contents
Acknowledgments ii
List of Tables v
List of Figures vi
List of Abbreviations viii
Abstract xi
Chapter 1: Introduction 1
1.1 Opening Remarks 21.2 Review of Polycarbonates 21.3 Properties of an Electrical Insulator and Optical Substrate 41.4 Proposed Copolymers 61.5 Review of Previous Work 81.6 Objectives 10
Chapter 2: Synthesis of Monomers and Polymers 11
2.1 Introduction 122.2 Review of BisA/TMCBD Copolymer 142.3 Bis-phenols 152.4 2,2,4,4-Tetramethyl-1,3-cyclobutanedichloroformate 212.5 Copolymers 222.6 End Groups 252.7 Experimental 262.8 Conclusion 29
Chapter 3: Identification of Copolymers 30
3.1 Introduction 313.2 Molecular Weights and Viscosities 313.3 Infrared and NMR Spectra 343.4 End Groups 443.5 Conclusion 45
Reproduced with permission of the copyright owner. Further reproduction prohibited without permission.

Chapter 4: Optical Properties 47
4.1 Introduction 484.2 Films 484.3 Optical Properties 504.4 Conclusion 51
Chapter 5: Thermal Properties 52
5.1 Introduction 535.2 Transition Temperatures 535.3 Thermal Instability 585.4 Thermal Stability 605.5 Conclusion 63
Chapter 6: Conclusion 64
6.1 Research 656.2 Future Work 66
References 68
Appendix 1. Spectral Data of BisCB 74
Appendix 2. Spectral Data of BisAD 81
Appendix 3. Spectral Data of TMCBDCI 88
Appendix 4. ^ C NMR Chemical Shifts of Substituents 90
Appendix 5. Instrumentation 93
Vita 96
iv
Reproduced with permission of the copyright owner. Further reproduction prohibited without permission.

List of Tables
Table 2.1. Purchased Bis-phenols. 16
Table 2.2. Synthesized Bis-phenols. 17
Table 2.3. Experimental Conditions. 23
Table 3.1. Molecular Weights and Viscosities. 31
Table 3.2. Chemical Shifts of Backbone Hydrogens in ppm. 36
Table 3.3. Chemical Shifts of Backbone Carbons in ppm. 42
Table 4.1. Refractive Indices. 50
Table 5.1. Glass Transition Temperatures. 54
Table 5.2. Beta Transition Temperatures at 10 Hertz 56
Table 5.3. Computer Simulation of Bis-phenols. 58
v
Reproduced with permission of the copyright owner. Further reproduction prohibited without permission.

List of Figures
Figure 1.1. Structure of Polycarbonates. 2
Figure 1.2. Poly(bisphenol A)carbonate. 3
Figure 1.3.1,1-bis(4-hydroxyphenyl)-1-phenylethane. 8
Figure 1.4. Bisphenol A and TMCBD Copolycarbonate. 9
Figure 2.1. Reaction Scheme Used to Synthesize Copolycarbonates. 13
Figure 2.2. Structure of (a) BisCB and (b) BisAD. 18
Figure 2.3. FTIR Spectrum of BisCB. 19
Figure 2.4. FTIR Spectrum of BisAD. 20
Figure 2.5 .1H NMR Spectra of (a) BisA, (b) BisN and (c) BisCB. 21
Figure 2.6. 1H NMR Spectrum of TMCBDCI. 22
Figure 2.7. Structure of Copolymers. 23
Figure 2.8. Addition of Trimethylsilyl End Groups. 26
Figure 3.1. GPC Plot of BisC/TMCBD. 33
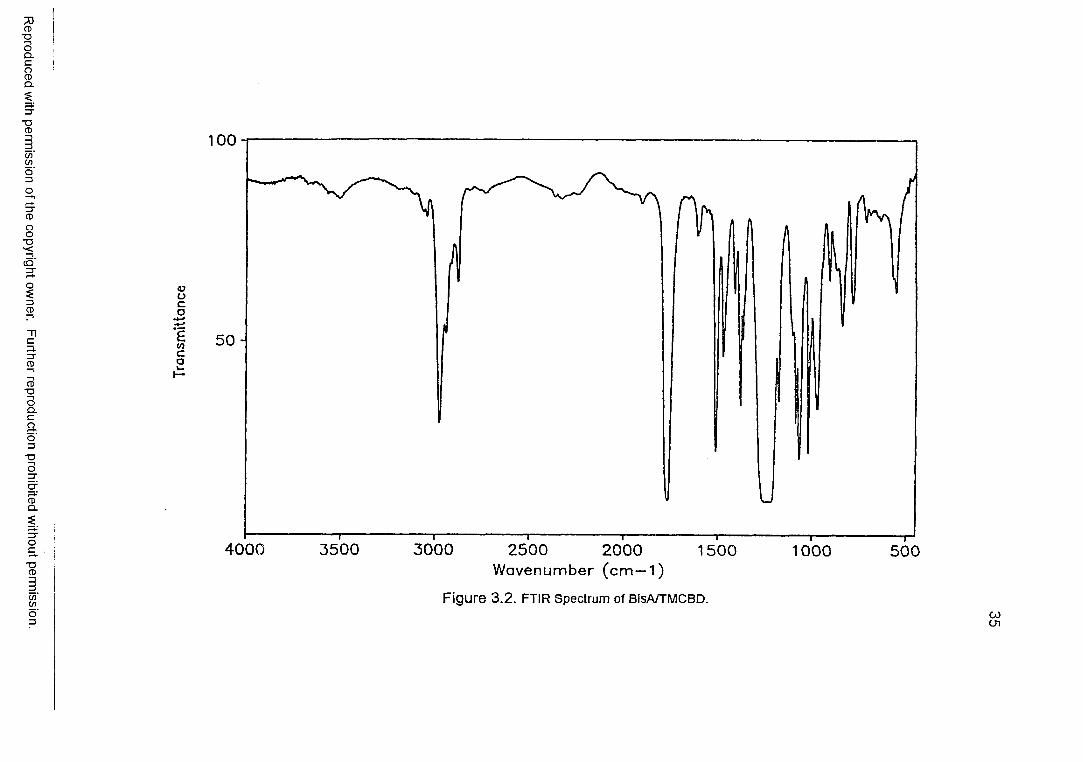
Figure 3.2. FTIR Spectrum of BisA/TMCBD. 35
Figure 3.3. Location of Backbone Hydrogens. 36
Figure 3.4.1H NMR Spectra of (a) BisA/TMCBD, (b) BisN/TMCBD 37and (c) BisCB/TMCBD.
Figure 3.5. 1H NMR Spectrum of BisA/TMCBD. 38
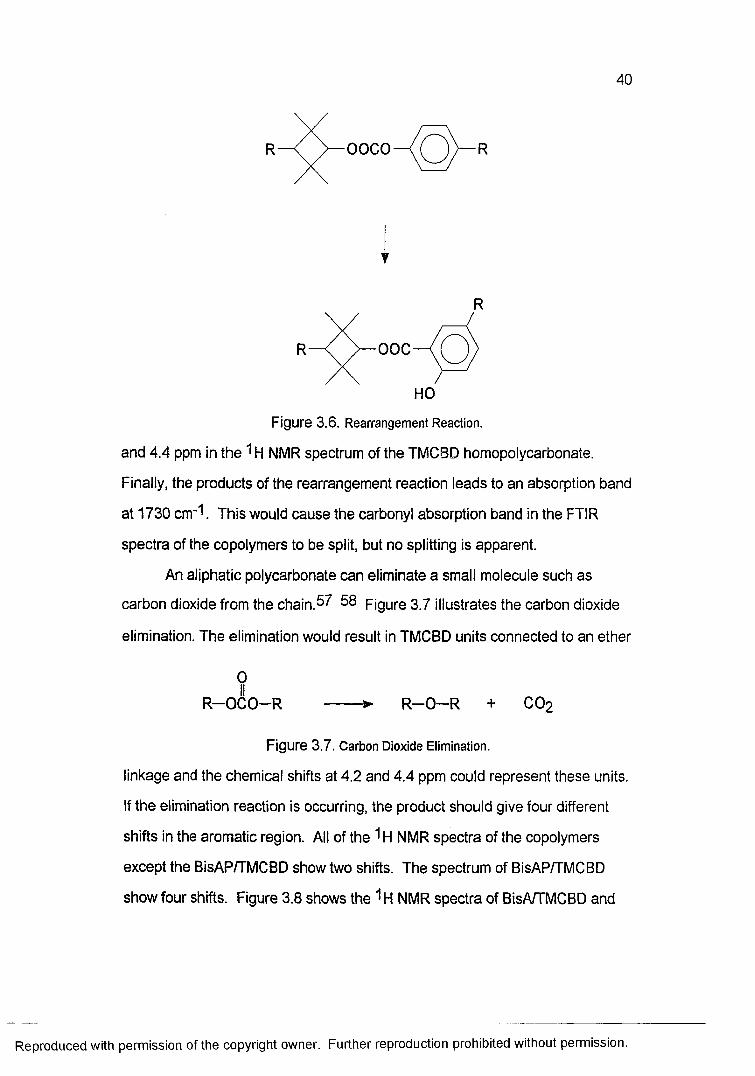
Figure 3.6. Rearrangement Reaction. 40
Figure 3.7. Carbon Dioxide Elimination. 40
Figure 3.8.1H NMR Spectra of (a) BisA/TMCBD and (b) BisAP/TMCBD. 41
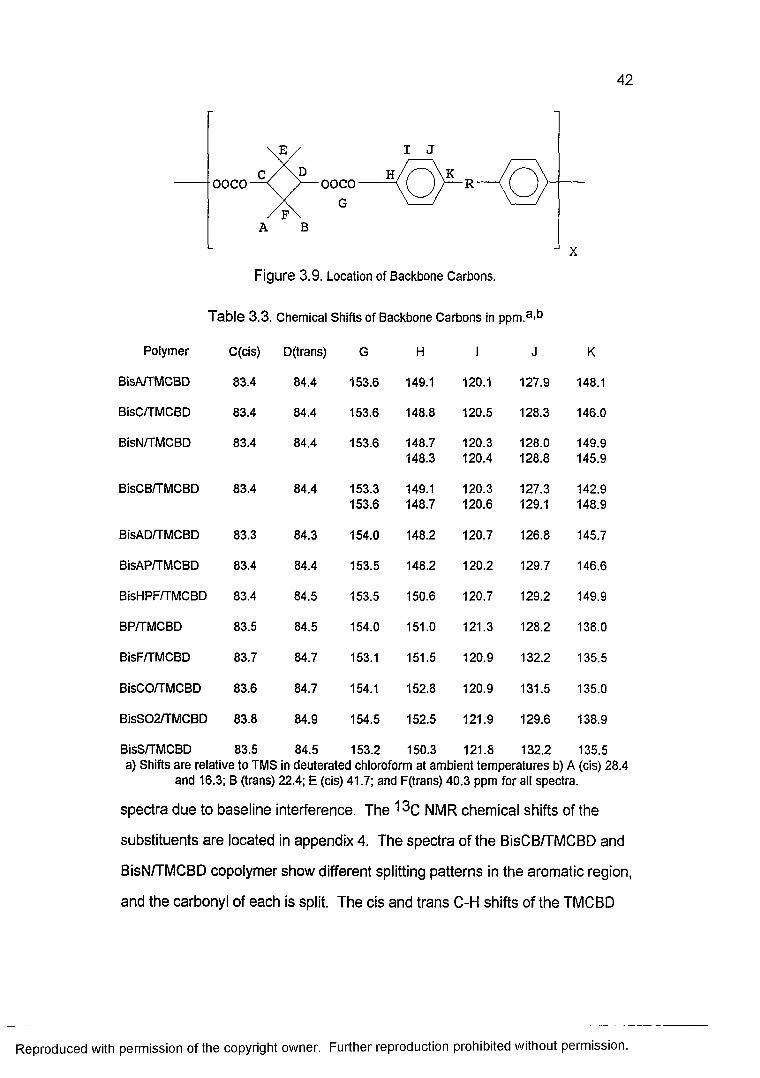
Figure 3.9. Location of Backbone Carbons. 42
Figure 3.10. 13C NMR Spectra of (a) BisCB/TMCBD and 43(b) BisN/TMCBD.
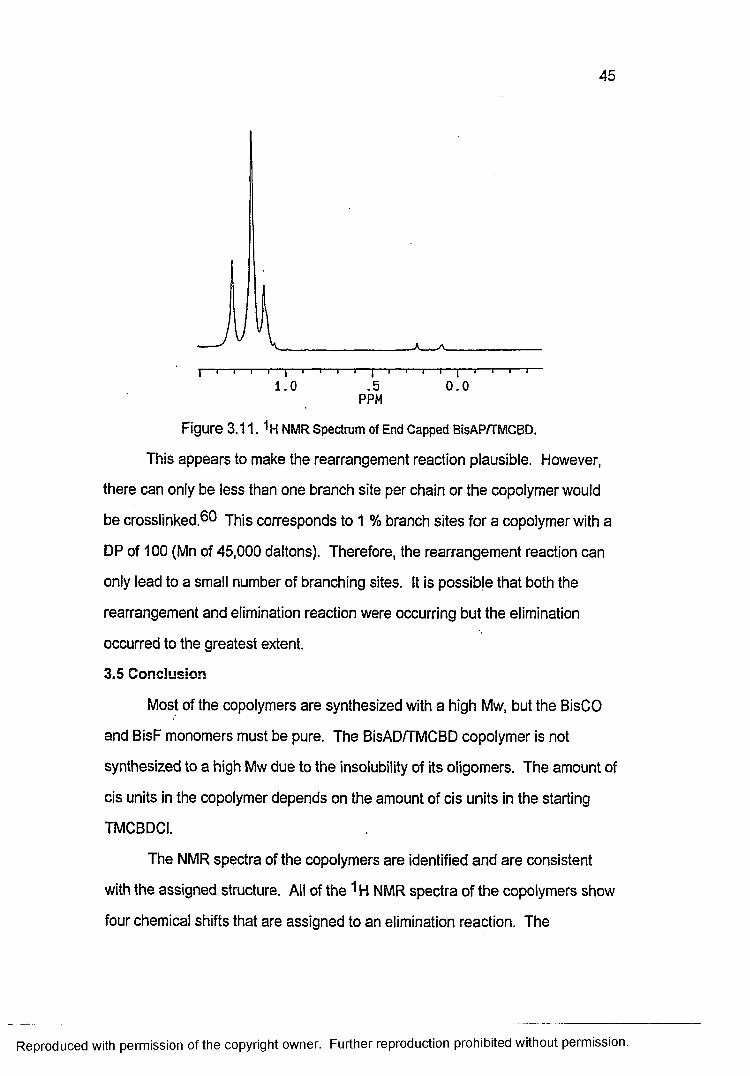
Figure 3.11.1H NMR Spectrum of End Capped BisAP/TMCBD. 45
vi
Reproduced with permission of the copyright owner. Further reproduction prohibited without permission.

Figure 5.1. DSC Plot of BisA/TMCBD. 55
Figure 5.2. Dynamic Thermal Mechanical Analyzer Plot of BisCB/TMCBD. 57
Figure 5.3. Simulated Bond Angle. 57
Figure 5.4. GPC Trace of (a) BisC/TMCBD and (b) Residual. 59
Figure 5.5. 1H NMR Spectra of (a) BisAP/TMCBD and (b) Residual. 60
Figure 5.6. TGA Plot of BisA/TMCBD Precipitated from 62(a) Tetrahydrofuran and (b) Chloroform.
Figure 5.7. Reaction of Copolymer with Water. 63
vii
Reproduced with permission of the copyright owner. Further reproduction prohibited without permission.

List of AbbreviationsA: Angstroms
a\: Polarizability in the i th direction.
BisA and bisphenol A: 2,2-bis(4-hydroxyphenyl)propane.
BisA/TMCBD: Poly(oxy-carbonyl-oxy-1,4-phenyl-2,2-propane-1,4-phenyl-oxy- carbonyl-oxy-1,3-(2l2I4,4-tetramethyl)cyclobutane).
BisAD: 9,9-bis(4-hydroxyphenyl)tricyclo[3.3.1.13>7]decane.
BisAD/TMCBD: Poly(oxy-carbonyl-oxy-1,4-phenyl-2,2-tricyclo[3.3.1.1 Jdecane1,4-phenyl-oxy-carbonyl-oxy-1,3-(2,2,4,4-tetramethyl)cyclobutane).
BisAP: 1,1 -bis(4-hydroxyphenyl)-1 -phenylethane.
BisAP/TMCBD: Poly(oxy-carbonyl-oxy-1,4-phenyl-1,1 -(1 -phenyl)ethane-1,4- phenyl-oxy-carbonyl-oxy-1I3-(2l2,4,4-tetramethyl)cyclobutane).
BisC: 1,1 -bis(4-hydroxyphenyl)cyclohexane.
BisC/TMCBD: Poly(oxy-carbonyl-oxy-1,4-phenyl-1,1 -cyclohexane-1,4-phenyl- oxy-carbonyl-oxy-I.S-^^^-tetramethyOcyclobutane).
BisCB: 1,1 -bis(4-hydroxyphenyl)-4-t-butylcyclohexane.
BisCB/TMCBD: Poly(oxy-carbonyl-oxy-1,4-phenyl-1,1 - (4-t-butyl)cyclohexane l^-phenyl-oxy-carbonyl-oxy-I.S^^^^-tetramethylJcyclobutane).
BisCO: 4,4'-dihydroxybenzophenone.
BisCO/TMCBD: Poiy(oxy-carbonyl-oxy-1,4-phenyi-carbonyi-1,4-phenyi-oxy- carbonyl-oxy-1,3-(2I2,4I4-tetramethyl)cyclobutane).
BisF: 2,2-bis(4-hydroxyphenyl)hexafluoropropane.
BisF/TMCBD: Poly(oxy-carbonyl-oxy-1,4-phenyl-2,2-hexafluoropropane-1,4- phenyl-oxy-carbonyl-oxy-1,3-(2,2I4l4-tetramethyl)cyclobutane).
BisHPF: 9,9-bis(4-hydroxyphenyl)fluorene.
viii
Reproduced with permission of the copyright owner. Further reproduction prohibited without permission
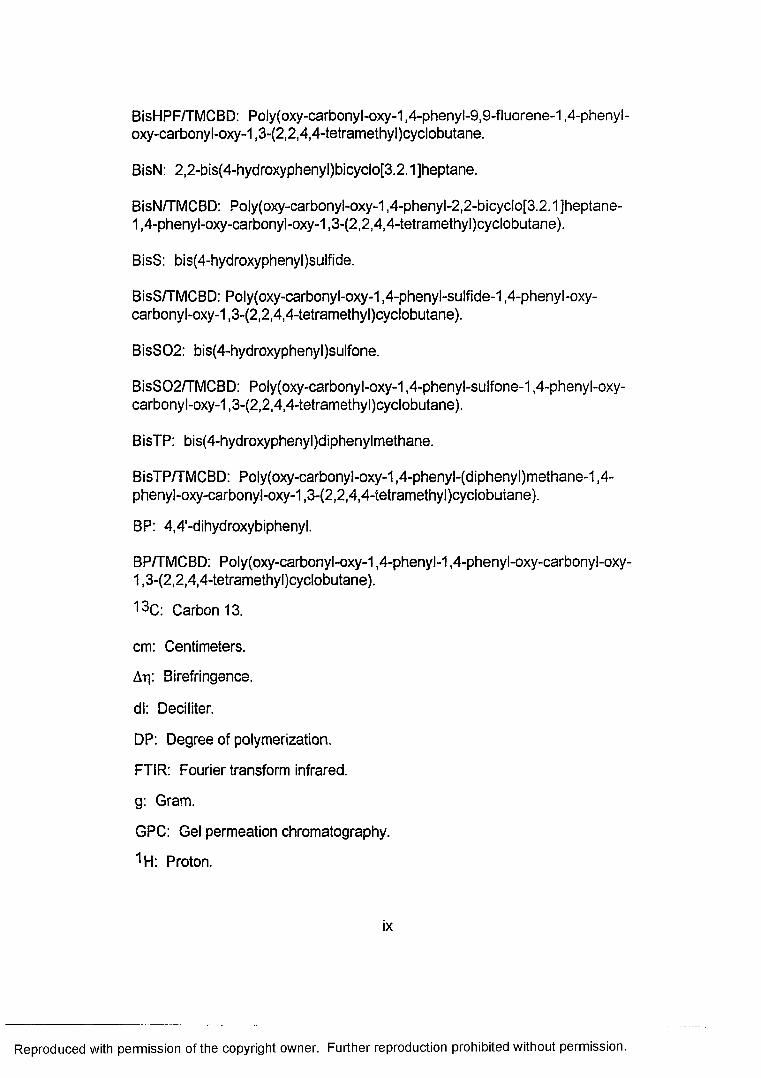
BisHPF/TMCBD: Poly(oxy-carbonyl-oxy-1,4-phenyl-9,9-fluorene-1,4-phenyl- oxy-carbonyl-oxy-1,3-(2,2,4,4-tetramethyl)cyclobutane.
BisN: 2,2-bis(4-hydroxyphenyl)bicyclo[3.2.1]heptane.
BisN/TMCBD: Poly(oxy-carbonyl-oxy-1,4-phenyl-2,2-bicyclo[3.2.1 Jheptane-1,4-phenyl-oxy-carbonyl-oxy-1,3-(2,2,4,4-tetramethyl)cyclobutane).
BisS: bis(4-hydroxyphenyl)sulfide.
BisS/TMCBD: Poly(oxy-carbonyl-oxy-1,4-phenyl-sulfide-1,4-phenyl-oxy- carbonyl-oxy-1,3-(2,2,4,4-tetramethyl)cyclobutane).
BisS02: bis(4-hydroxyphenyl)sulfone.
BisS02/TMCBD: Poly(oxy-carbonyl-oxy-1,4-phenyl-sulfone-1,4-phenyl-oxy- carbonyl-oxy-1,3-(2,2,4,4-tetramethyl)cyclobutane).
BisTP: bis(4-hydroxyphenyl)diphenylmethane.
BisTP/TMCBD: Poly(oxy-carbonyl-oxy-1,4-phenyl-(diphenyl)methane-1,4- phenyl-oxy-carbonyl-oxy-1I3-(2I2I4,4-tetramethyl)cyclobutane).
BP: 4,4'-dihydroxybiphenyl.
BP/TMCBD: Poly(oxy-carbonyl-oxy-1,4-phenyl-1,4-phenyl-oxy-carbonyl-oxy- 1,3-(2,2,4,4-tetramethyl)cyclobutane).
13C: Carbon 13.
cm: Centimeters.
A-q: Birefringence,
dl: Deciliter.
DP: Degree of polymerization.
FTIR: Fourier transform infrared,
g: Gram.
GPC: Gel permeation chromatography.
^H: Proton.
ix
Reproduced with permission of the copyright owner. Further reproduction prohibited without permission.

KBr: Potassium bromide.
[n]: Intrinsic viscosity.
M: Molecular weight,
mm: Millimeters of mercury.
Mn: Number average molecular weight.
MP: Melting point.
Mw: Weight average molecular weight.
Na : Avogadro's number,
np: Refractive Index.
NMR: Nuclear magnetic resonance.
P: Density.
ppm: Parts per million.
SIB: Stress induced birefringence.
Tg: Glass transition temperature.
TMCBD: 2,2,4,4-tetramethyM ,3-cyclobutanediol.
TMCBDCI: 2,2,4,4-tetramethyM ,3-cyclobutanedichloroformate.
urn: micrometer.
UV: Ultraviolet light,
wt: Weight.
°C: Degree centigrade.
Beq: Equivalent Thermal Parameters.
Reproduced with permission of the copyright owner. Further reproduction prohibited without permission.

Abstract
Alternating copoly(bis-phenol-co-2,2,4,4-tetramethyl-1,3-cyclobutane)
carbonates are synthesized from 2,2,4,4-tetramethyM ,3-cyclobutanedichloro-
formate and the corresponding bis-phenol using a solution polymerization
technique. The bis-phenols consist of various 4,4'-substituted diphenols
including: 2,2-propane; 1,1-cyclohexane; 1,1-(4-t-butyl)cyclohexane; 2,2-
tricyclo[3.3.1.1]decane; 2,2-bicyclo[3.2.1]heptane; 1,1-(1-phenyl)ethane; 2,2-
hexafluoropropane; carbonyl; 9,9-fluorene; sulfide; sulfone; and diphenyl-
methane. Crystal structures of the 9,9-tricyclo[3.3.1.13>7]decane and 1,1-(4-t-
butyl)cyclohexane bis-phenols, previously unreported in the literature, confirm
the structures proposed and reveal that the compounds are solvated with
acetonitrile and toluene, respectively.
The copolymers are isolated by precipitation in methanol; yields
ranging from 50 to 80 % are obtained. All monomers and polymers reported
are characterized by 1H and 13C NMR and Fourier transform infrared
spectroscopy, differential scanning calorimetery, and gel permeation
chromatography. The spectroscopic results are consistent with the assigned
structures.
With the exception of the copolymer with the 2,2-tricyclo[3.3.1.1.]
decane substituent, sufficiently high molecular weights are achieved to allow
production of stable films by either solution casting or melt pressing. The
films are optically clear and show no birefringence when viewed through a
crossed polarized microscope. The refractive index varies from 1.49 for the
2,2-hexafluoropropane substituted copolymer to 1.57 for the 9,9-fluorene
substituted copolymer; thus, all of the copolymers exhibit lower refractive
indices than the bisphenol A homopolycarbonate.
xi
Reproduced with permission of the copyright owner. Further reproduction prohibited without permission.
The glass transition temperatures vary from 110 °C for the sulfide
substituted copolymer to 210 °C for the 9,9-fluorene substituted copolymer.
Clearly increasing the bulkiness of substituents in the bis-phenol units is an
effective method for raising the glass transition of the copolymers. When
heated above their glass transition temperature, the copolymers degrade by a
chain unzipping mechanism. The thermal stability is enhanced by end
capping the copolymers with chlorotrimethylsilane.
xii
Reproduced with permission of the copyright owner. Further reproduction prohibited without permission.

Chapter 1: Introduction
1
Reproduced with permission of the copyright owner. Further reproduction prohibited without permission.
2
1.1 Opening Remarks
Throughout history, humanity has made an effort to improve on the
materials available to them. One material that is used in a wide variety of
applications is poly(bisphenol A)carbonate. However, the use of
poly(bisphenol A)carbonate as an electrical insulator and optical coating can
be improved. The goal of this project was to synthesize and evaluate
copolycarbonates that offer an advantage over poly(bisphenol Ajcarbonate as
an electrical insulator and/or optical coating,
Before the synthesis and data of the copolymers is discussed, it is
explained why poly(bisphenol A)carbonate needs improving. Chapter one
discusses poly(bisphenol A)carbonate, the properties that need improving, and
the proposed copolymers. Chapter two discusses the synthesis and properties
of the monomers and the synthesis of the copolymers. Chapter three details
the characterization of the copolymers. Chapter four discusses the optical
properties. Chapter five discusses the thermal properties of the copolymers.
Finally, Chapter six concludes the research.
1.2 Review of Polycarbonates
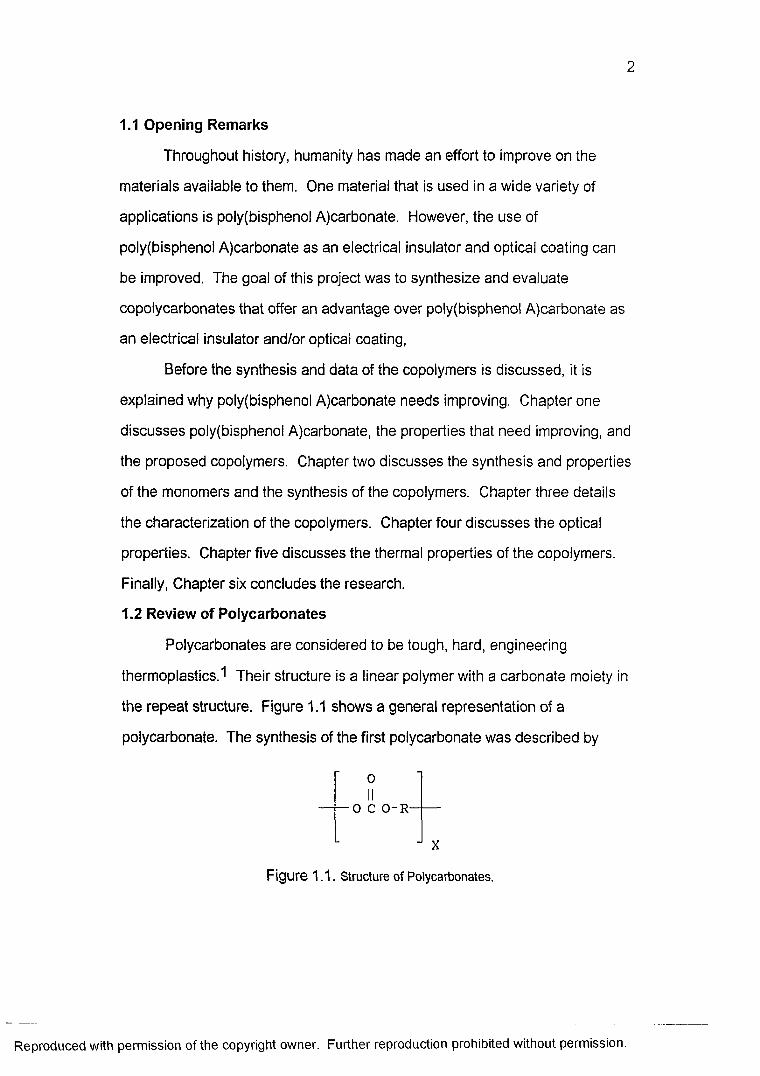
Polycarbonates are considered to be tough, hard, engineering
thermoplastics. 1 Their structure is a linear polymer with a carbonate moiety in
the repeat structure. Figure 1.1 shows a general representation of a
polycarbonate. The synthesis of the first polycarbonate was described by
oI I
0 C O - R -
X
Figure 1.1. Structure of Polycarbonates.
Reproduced with permission of the copyright owner. Further reproduction prohibited without permission.

3
Eihorn in 1898.2 T h js was accomplished by reacting hydroquinone with
phosgene in the presence of a base. However, it was not until experiments
done by Schnell in 1959 that polycarbonates became a commercially viable
product.3 Schnell showed that a high molecular weight polymer capable of
being processed from the melt is obtained through a transesterification reaction
between 2,2-bis(4-hydroxyphenyl) propane (bisphenol A) and diphenyl
carbonate. The structure of this polymer is shown in Figure 1.2. The polymer
is commercially available under several trade names including; poly(bisphenol
L J X
Figure 1.2. Poly(bisphenol A)carbonate.
A)carbonate, polycarbonate, lexan, and merlon. In fact, the overwhelming
majority of commercially available polycarbonates are different grades of
poly(bisphenol A)carbonate. The remaining available polycarbonates are
either copolycarbonates of bisphenol A or polycarbonates with structures
similar to poly(bisphenol A)carbonate where either the central unit of bisphenol
A is changed or the ortho position on the aromatic ring is substituted with an
alkyl or halogen group.
The most important attribute of poly(bisphenol A)carbonate is that its
properties are retained over a wide range of temperatures from -100 to 130 °C.
Below -100 °C, the polymer undergoes a beta transition believed to be caused
by the cessation of aromatic ring flips. The glass transition temperature (Tg) is
at 140 °C.4 The upper and lower usable temperatures can be raised or
lowered with an appropriate comonomer. Also, the polymer can be processed
Reproduced with permission of the copyright owner. Further reproduction prohibited without permission.

4
into two forms, either a cloudy semicrystalline material or a highly transparent
amorphous material.
Poly(bisphenol A)carbonate can be synthesized with a number average
molecular weight (Mn) of up to 100,000 daltons. If the Mn is below 18,000
daltons, the polymer will not form a stable product due to cracking and
crazing. 1 The polymer shows excellent resistance to ozone, high energy
radiation and cold water; but exposure to hot water for long periods of time
causes loss of its mechanical properties.5 The polymer is self extinguishing
and, if copolymerized with a halogenated comonomer, nonflammable.6 Also, it
is nontoxic and does not degrade in the digestive tracts of animals7
Poly(bisphenol A)carbonate shows good adhesion to stainless steel,
aluminum and copper.8 Due to this, the polymer's electrical insulating
properties, ductility and low coefficient of expansion, poly(bisphenol
A)carbonate is often used as an insulating material. Finally, because
poly(bisphenol A)carbonate will form a clear colorless film or sheet, it is often
used in optical applications requiring high optical quality such as a substrate
for optical disks.
1.3 Properties of an Electrical Insulator and Optical Substrate
In order for a material to be used as an electrical insulator or an optical
substrate it should posses certain properties which should be retained over a
wide range of temperatures. The Tg should be higher than the boiling point of
water. The material should be processed from the melt usually by injection,
compression molding or a combination of both methods. The material should
be thermally stable in the processing. Once the product is formed, it should
have good dimensional stability and show a low permeability to oxygen and
water. Further, the material should have good interaction with the surface to be
coated.9
Reproduced with permission of the copyright owner. Further reproduction prohibited without permission.

5
There are several other properties needed by a material if it is used as
an electrical insulator. The material should have a low dielectric constant. The
material should be stable in environments of high humidity and temperature.
Due to the wide variety of insulating materials, the cost of the material must be
low. Finally, the material should be non-flammable.
Although the available materials used for optical substrate are less than
those used for electrical insulators, the cost of the material should be an
important consideration. Also, the material must be optically clear, meaning
the material does not reflect, absorb, scatter light or exhibit birefringence.
Even though poly(bisphenol A)carbonate is a commonly used material,
there are several disadvantages. Samples of the polymer discolor upon
exposure to ultraviolet light. Further, the polymer exhibits a high refractive
index (1.58)3 and permeability to oxygen10. Also, the polymer has a high melt
viscosity and a tendency to develop stress induced birefringence during
processing. Stress induced birefringence occurs when a polymer molecule is
optically anisotropic and aligns itself in the direction of a stress. Therefore,
when a sample is molded and cooled rapidly, the polymer molecules remain
aligned in the direction of flow and birefringence occurs.11
Most of the problems associated with using poly(bisphenol A)carbonate
are either negligible or simple to remedy. The discoloration is minimized by the
use of UV stabilizers such as b e n z o t r ia z o le .1 ^ The high refractive index and
oxygen permeability of poly(bisphenol A)carbonate as compared to other
conventional polymers are low enough such that it does not affect the
performance of poly(bisphenol A)carbonate, but a lower refractive index
indicates a lower dielectric constant.13 The high melt viscosity requires
poly(bisphenol A)carbonate to be processed at a higher temperature (approx.
300 °C).14 In most uses, the formation of stress induced birefringence is not
Reproduced with permission of the copyright owner. Further reproduction prohibited without permission.

6
detrimental. However, there should be no stress induced birefringence when a
material is used in applications requiring high optical quality.
When undesirable, the stress induced birefringence is removed by
either one of two methods: first, a molded sample of poly(bisphenol
A)carbonate is cooled in the mold at a slower rate than average or second, the
molded sample is annealed above its Tg. Both of these methods cause the
aligned polymer chains to randomize, but the added heat and process time of
these methods increase the cost of the optical materials. One way to avoid the
need to randomize poly(bisphenol A)carbonate is to design a new polymer with
properties similar to poly(bisphenol A)carbonate, but the new polymer needs a
stress induced birefringence that does not interfere with the requirements of an
optical material.
1.4 Proposed Copolymers
The disadvantages of using poly(bisphenol A) carbonate as an electrical
insulator or optical coating are due to the polarizable aromatic rings in the
polymer chain. Replacing the aromatic rings with less polarizable groups will
cause a decrease in the dielectric constant and stress induced birefringence.
This can be easily accomplished by placing an aliphatic unit in the polymer
chain.
It is easy to understand the advantage an aliphatic unit will provide in
electrical insulation; however, a discussion is needed to explain why an
aliphatic unit will decrease the stress induced birefringence. The equation for
birefringence is located below; where An is the birefringence, P is the density,
M is the molecular weight of the monomer, n is the average refractive index, N/\
is Avogadro's number, ay and az are the polarizabilities in the two directions
perpendicular to the polymer chain, a x is the polarizability parallel to the
polymer chain, or if a stress is applied to a system, ax is the polarizability in
Reproduced with permission of the copyright owner. Further reproduction prohibited without permission.

Equation 1.1. Equation for Birefringence,
the direction of the stress. it js interesting to note that birefringence can be
equal to zero and when this happens aligned polymer chains show no
birefringence. Also, the birefringence can be positive or negative. Finally by
controlling the polarizability parallel to and perpendicular to the polymer chain,
both the sign and magnitude of the birefringence can be controlled.
The polarizable aromatic groups oriented along the polymer chain
provide a positive birefringence in poly(bisphenol A)carbonate; whereas,
polymers with polarizable groups perpendicular to the chain such as
poly(methyl methacrylate) have negative birefringences. 15 |n fact, one way to
lower the stress induced birefringence of a polymer is to blend it with a polymer
of opposite s ig n . 15 This was done with poly(methyl methacrylate) and
poly(vinyl chloride) to give a blend with zero b ir e f r in g e n c e . 15 However, two
problems occur when this method is applied to poly(bisphenol A)carbonate.
Most blends of poly(bisphenol A)carbonate are unstable and phase separate
with heat. Also, a zero birefringence blend requires a large amount of the
second polymer resulting in blend properties more similar to those of the other
p o ly m e r . 17 This is due to the large positive birefringence of poly(bisphenol
A)carbonate. Another more practical method is to copolymerize bisphenol A
with comonomers to give a copolycarbonate with a birefringence lower than
poly(bisphenol A)carbonate.
The two methods by which a comonomer can lower the birefringence of
a polymer are decreasing the polarizability of the polymer chain or increasing
the polarizability perpendicular to the polymer chain. The parallel polarizability
Reproduced with permission of the copyright owner. Further reproduction prohibited without permission.

8
or refractive index of poly(bisphenol A)carbonate is lowered by the introduction
of an aliphatic c o m o n o m e r . 18 jh e refractive index of the copolycarbonate
derived from 2,2,4,4-tetramethyM ,3-cyclobutanediol and bisphenol A is 1.53; a
significant reduction when compared to the value of 1.58 observed in
poly(bisphenol A)carbonate.19 Also, the polarizability perpendicular to the
polymer chain is increased by substituting the isopropyl group with a more
polarizable group. An example of a bis-phenol with a more polarizable group is
shown in Figure 1.3. In fact, a previous article showed that the homopolymer
derived from 1,1-bis(4-hydroxyphenyl)-1-phenylethane (BisAP) has a
birefringence much lower than poly(bisphenol A)carbonate.20
HO OH
CH
Figure 1.3. 1,1-bis(4-hydroxyphenyl)-1-phenylethane.
It was the intent of this project to use an aliphatic comonomer with
bisphenol A to design a copolymer with a lower polarizability than
poly(bisphenol A)carbonate. Then, the aliphatic comonomer was to be
copolymerized with other bis-phenols in the hope that the materials will offer
advantages over poly(bisphenol A)carbonate.
1.5 Review of Previous Work
Due to the success of poly(bisphenol A)carbonate, it is surprising that no
copolymers of bisphenol A and an aliphatic monomer are commercially
available. Three problems occur when using an aliphatic comonomer: a lack of
thermal stability, an inability to make high molecular weight samples, and a
significant reduction in Tg. The first two problems are caused by the instability
Reproduced with permission of the copyright owner. Further reproduction prohibited without permission.

9
of the aliphatic carbonate linkage. Once a carbonate group is added to an
aliphatic diol, either the carbonate linkage and a beta hydrogen can eliminate
to form a double bond or the carbonate linkage can be attacked by a
nucleophile in a S fg 2 type r e a c t io n .21 The low Tg is due to the flexibility of the
aliphatic carbonate linkage.22
2,2,4,4-tetramethyM ,3-cyclobutanediol (TMCBD) is an aliphatic diol that
yields high Mw copolycarbonates with high Tg's when copolymerized with
bisphenol A or various bis-phenols. 19. 23 ■ 23 Figure 1.4 shows the structure
of the bisphenol A and TMCBD copolycarbonate (BisA/TMCBD). TMCBD is an
ooco ooco
CHCH.
X
Figure 1.4. Bisphenol A and TMCBD Copolycarbonate,
interesting monomer because: (a) it is inexpensive, (b) there is no beta
hydrogen next to the alcohol groups, (c) the steric hindrance of the methyl
groups prevents a S|\j2 attack when TMCBD is used to form a polycarbonate,
and (d) crystal structures of the cis29 and trans30 TMCBD show the
cyclobutane ring to be rigid resulting in homopolycarbonates and
copolycarbonates with high Tg's.31 However, if a molded sample of the
BisA/TMCBD copolymer is heated above the Tg, the copolymer degrades
through single polymer chain unzipping, causing foaming of the sample. A.
D'Onofrio has shown that the degradation is accelerated with certain catalysts
Reproduced with permission of the copyright owner. Further reproduction prohibited without permission.

10
such as the sodium acetate. The degradation was controlled by removing
heavy metals, neutralizing the sample and end capping, i.e. converting reactive
end groups to stable moieties by a post polymerization reaction.24 Because
of the promising properties of the TMCBD and bisphenol A copolycarbonate, it
is an excellent comonomer to design a polymer more suited as an electrical
insulator or optical coating.
1.6 Objectives
It was the intent of this project to design a polymer which is better suited
than poly(bisphenol A)carbonate as an electrical insulator or optical coating.
The goals of this project were finding a thermally stable, high weight average
molecular weight (Mw) aromatic aliphatic copolycarbonate with a high Tg and
low polarizability. In order to accomplish these goals, the first step was to
copolymerize an aliphatic monomer (TMCBD) with bisphenol A to give a high
Mw polymer with a Tg above 120 °C . The next step was to copolymerize the
TMCBD with assorted bis-phenols. The references for the TMCBD and various
bis-phenol copolymers give very little information on the properties of the
copolymers. Therefore, the physical properties were to be measured to
establish whether the copolymers offer an advantage as an electrical insulator
or optical coating. After measuring the properties of the copolymers, a way to
make the copolymers thermally stable was developed.
Reproduced with permission of the copyright owner. Further reproduction prohibited without permission.
Chapter 2: Synthesis of Monomers and Polymers
11
Reproduced with permission of the copyright owner. Further reproduction prohibited without permission.

12
2.1 Introduction
As stated in Chapter one, the intent of this project was to synthesize
copolycarbonates of TMCBD and various bis-phenols. There are several
methods used to synthesize polycarbonates. These include: melt polymer-
iz a t io n s ,3 solution polymerizations between diols and either phosgene or a
dichloroformate,32 phase transfer polymerizations between diols and either
phosgene33 or a dichloroformate,3^ ring opening polymerizations of a cyclic
monomers containing carbonate linkages,33 and ring opening polymer
izations of spiro ortho-carbonate rings 33 In deciding which polymerization
method was best suited for synthesizing the copolycarbonates, there were
several factors to consider. The polycarbonates derived from phase transfer
polymerizations contain water and salt contaminates that cause the polymer
to degrade upon heating and influence the electrical properties. The
formation of the cyclic monomers in the ring opening polymerizations was too
tedious for the synthesis of the series of copolycarbonates needed in this
research. Finally, M. Gawalek et al have shown that the high temperatures
needed to melt the TMCBD homopolymers in melt polymerizations degrade
the homopolymer resulting in lower yields than expected.31 Therefore,
solution polymerization was the method best suited to synthesize the
copolycarbonates.
There were two aspects to consider in deciding which solution
polymerization method to use to synthesize the copolycarbonates. First,
solution polymerizations using phosgene require repetitive use of phosgene
to produce the copolymers; whereas, the solution polymerizations using
2,2,4,4-tetramethyl-1,3-cyclobutanedichloroformate (TMCBDCI) require the
use of phosgene only in the synthesis of TMCBDCI from TMCBD. Second,
solution polymerizations using phosgene result in random copolymers;
Reproduced with permission of the copyright owner. Further reproduction prohibited without permission.

13
whereas, solution polymerizations using TMCBDCI result in alternating
copolymers giving more stereochemical knowledge of the copolymers.
Therefore, the solution polymerization with TMCBDCI was used to synthesize
the desired copolycarbonates.
There are several disadvantages associated with this polymerization
method. There is the possibility of solvent and salt contaminants remaining in
the polymer. The polymerization can leave reactive chloroformate end groups
on the polymer chain. This procedure is more costly than a melt
polymerization; however, the melt polymerization of bisphenol A and TMCBD
is previously r e p o r t e d .2 3 - 2 7
Figure 2.1 illustrates the reaction scheme used to synthesize the
copolycarbonates. The synthesis of TMCBDCI and its possible use in
Cl CO OCC1 +
HO OH
0
COII
o
R X
Figure 2.1. Reaction Scheme Used to Synthesis Copolycarbonates.
Reproduced with permission of the copyright owner. Further reproduction prohibited without permission.

14
synthesizing copolycarbonates has been previously p u b lis h e d .25 The
synthesis of TMCBDCI in this project was different and is discussed in section
2.7. Also, the polymerization between TMCBDCI and bisphenol A yields a
copolymer similar to poly(bisphenol A)carbonate except a tetramethyl
cyclobutane ring is added to the chain backbone. The remaining copolymers
were synthesized using bis-phenols with different central groups. This results
in the difference between the copolymers being a different group between the
two aromatic rings and the difference is indicated by R in figure 2.1.
This chapter discusses the purchase or synthesis, purification and
properties of the bis-phenols, as well as the synthesis, purification and
properties of TMCBDCI. Also, the synthesis of the copolycarbonates and the
addition of end groups is discussed. Before discussing the synthesis, a brief
review of some of the properties of the BisA/TMCBD copolymer is given.
2.2 Review of BisA/TMCBD Copolymer
The synthesis of BisA/TMCBD copolymers has been described. 19,23-
27 BisA/TMCBD copolymers containing 60-90 % TMCBD were synthesized
from the melt using TMCBD, BisA, diphenyl carbonate and a heavy metal
catalyst; copolymers with molecular weights ranging from 15,000 to 120,000
daltons were produced. Below 30,000 daltons, the mechanical properties of
the polymers are not strong enough to form stable products.
Films of the BisA/TMCBD copolymer have better clarity than
poly(bisphenol A)carbonate, and the refractive index is 1.53.19-28 However,
there are two problems associated with the films. Films of the copolymers
become indelibly marred when handled with bare skin, and when a sample is
heated above the Tg, the sample degrades by polymer chains u n z ip p in g .2 3 ,
24 The degradation is noticed by foaming of the film.
Reproduced with permission of the copyright owner. Further reproduction prohibited without permission.

15
These problems are removed by simple methods. The marring is
ceased by either placing the film in a saturated environment of acetone or
immersing the film in an aqueous solution of acetone.2 6 -2 8 Thermal stability
of the copolymer is enhanced by removing heavy metals, neutralizing the film
and placing phenolic end groups on the polymer chains. Once stabilized, the
copolymer can be processed by injection molding.
The properties of the BisA/TMCBD copolymer in this report are similar
to those listed above. The properties of the remaining copolymers vary but
the differences are due to the different substituents. Also, films of the
copolymers are thermally unstable, and stability was obtained by a different
method.
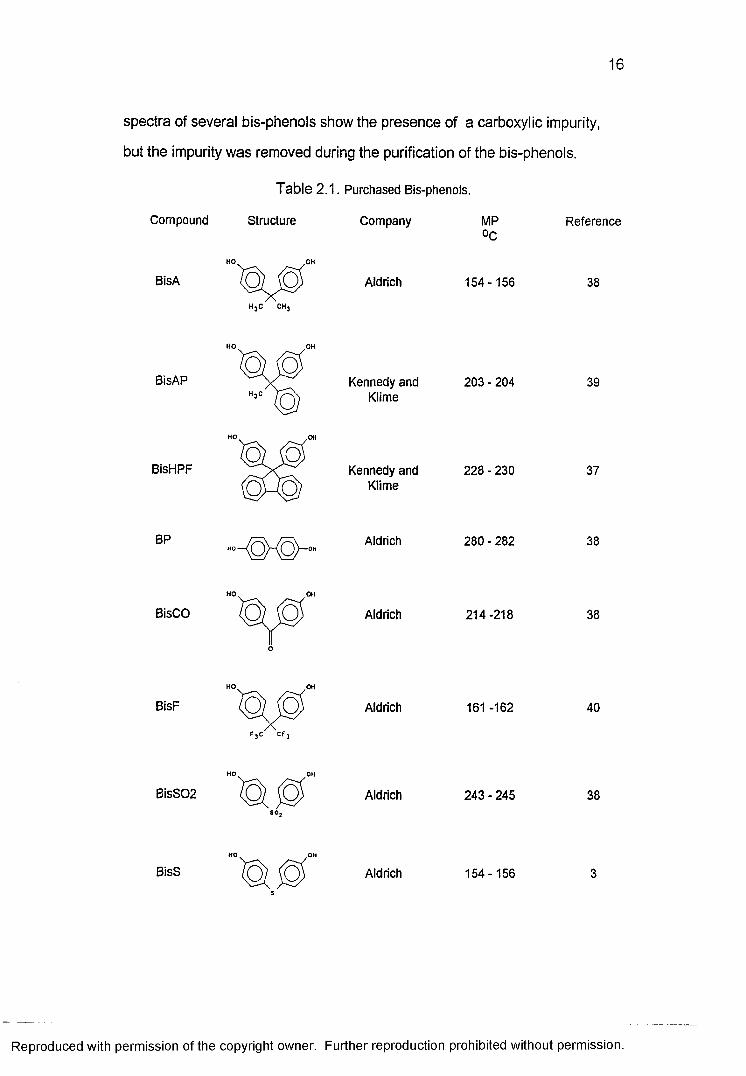
2.3 Bis-phenols
The majority of bis-phenols in this project were purchased from
chemical supply companies as listed in table 2.1. The bis-phenols were
purified either by sublimation or recrystallization from an appropriate solvent.
The purity of the bis-phenols was confirmed by melting points, Fourier
transform infrared (FTIR), proton (1 H) nuclear magnetic resonance (NMR),
and carbon (”*8 C) NMR spectra. Table 2.1 lists the melting points and
references to the properties of each bis-phenol.
There are several notes about the purchased bis-phenols. The
BisHPF was originally synthesized using a published method.8 7 During the
project, BisHPF became commercially available and was used in the
remaining portion of the project. There was no difference between the
purchased and synthesized BisHPF and the copolymers synthesized from
them. Also, the ^H NMR spectrum of BisCO shows the presence of a small
aliphatic impurity at 1.7 ppm. Attempts to remove the impurity from the
compound by sublimation and recrystallization have failed. Finally, the FTIR
Reproduced with permission of the copyright owner. Further reproduction prohibited without permission.
16
spectra of several bis-phenols show the presence of a carboxylic impurity,
but the impurity was removed during the purification of the bis-phenols.
Table 2.1. Purchased Bis-phenols.
Compound Structure Company MP°C
Reference
BisA o o Aldrich 154-156 38
BisAP Kennedy and Klime
203 - 204 39
BisHPFO ) O
Kennedy and Klime
228 - 230 37
BP Aldrich 280 - 282 38
BisCO Aldrich 214-218 38
BisF o o Aldrich 161 -162 40
BisS02 Aldrich 243 - 245 38
BisS Aldrich 154-156
Reproduced with permission of the copyright owner. Further reproduction prohibited without permission.

17
Several of the bis-phenols used in this project were not commercially
available, but the synthesis is described in literature. Table 2.2 lists the
synthesized bis-phenols, yields, melting points and references. The listed
yields are lower than the referenced yields.
Table 2.2. Synthesized Bis-phenols.
Compound Structure Yield MP Reference% °C
BisC 70 189-190 39
BisN 33 199-200 41
BisTP 20 285 - 286 42
Two of the bis-phenols in this research are not found in the
literature. 1,1-bis(4-hydroxy-phenyl)-4-t-butylcyclohexane (BisCB) and 9,9-
bis(4-hydroxyphenyl)tricyclo[3.3.1.13 >7]decane (BisAD) were synthesized
using a previously described method.3? The structures of the bis-phenols are
illustrated in figure 2.2 and the synthesis is described in section 2.7. The
bis-phenols were characterized by FTIR, 1H NMR, 13C NMR and mass
spectra data. The interpreted NMR, ^3C NMR and mass spectra are
Reproduced with permission of the copyright owner. Further reproduction prohibited without permission.

18
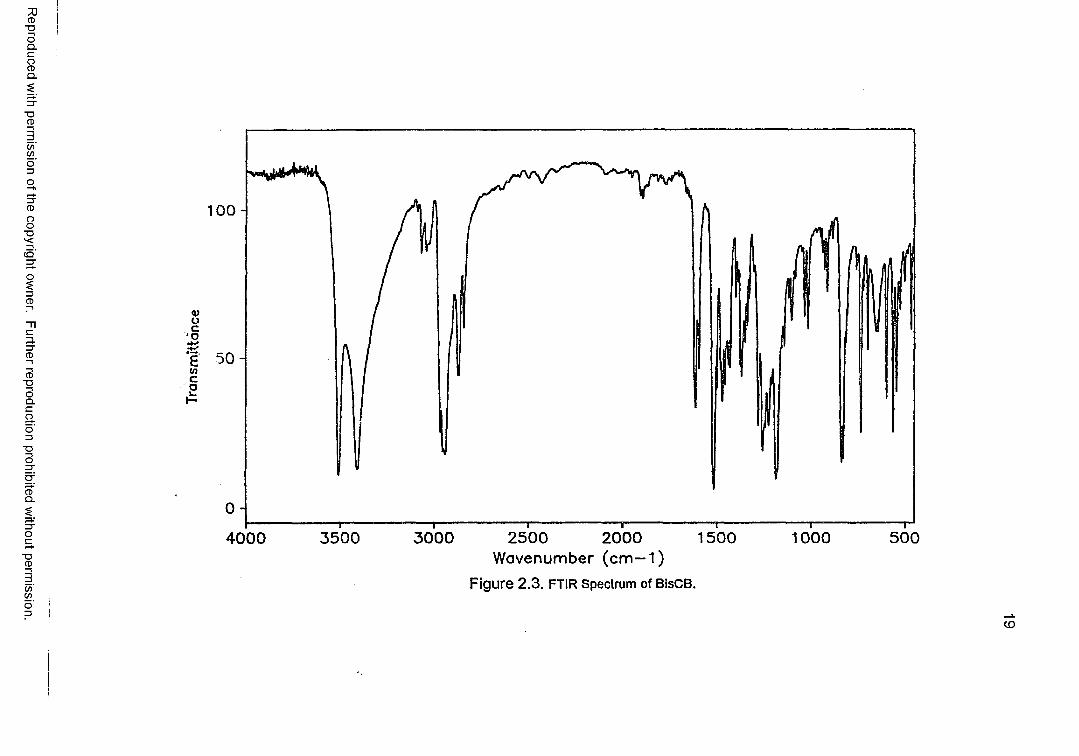
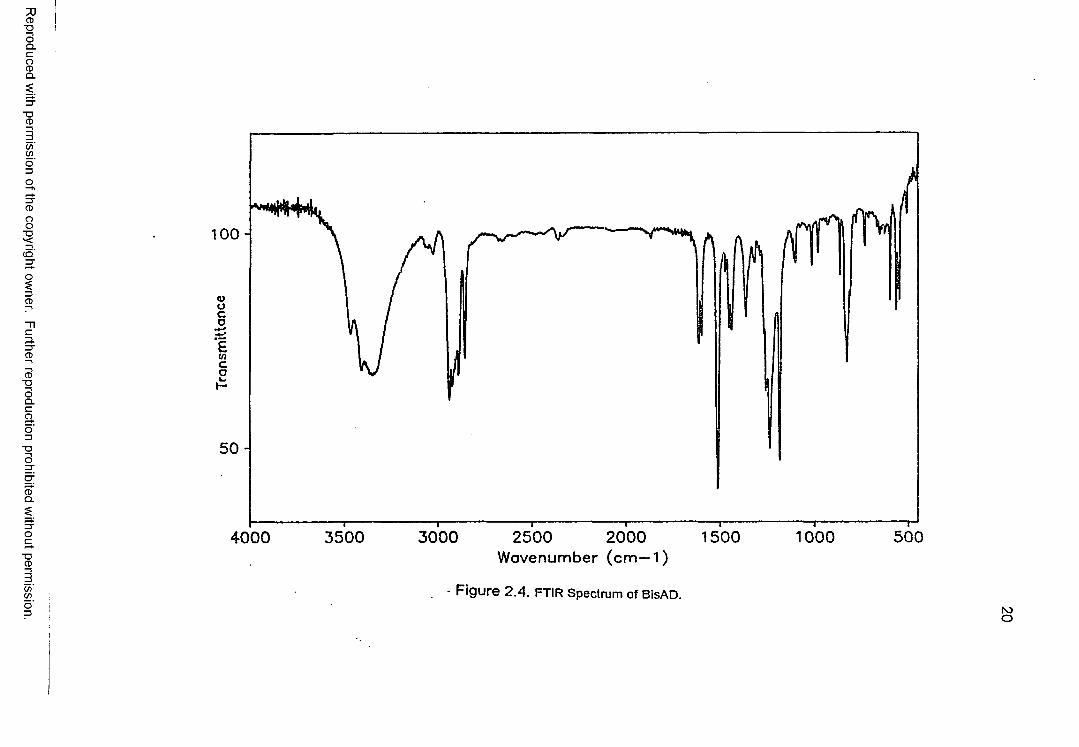
located in appendix 1 and 2, respectively. The FTIR spectra of BisCB and
BisAD are located in figure 2.3 and 2.4, respectively.
C(CH3)3
a b
Figure 2.2. Structure of (a) BisCB and (b) BisAD.
The crystal structure, cell dimensions, and atom coordinates of BisCB
and BisAD are located in appendix 1 and 2, respectively. Each molecule of
BisCB is solvated with a half of molecule of toluene, and each molecule of
BisAD is solvated with one molecule of acetonitrile. The solvating molecules
were removed by heating to their boiling point at 1 mm of Hg. The melting
point of BisCB is 184 -186 °C, and BisAD decomposes at 304 °C.
Three of the discussed bis-phenols (BisC, BisCB, and BisN) are not
symmetrical about a C2 axis between the two phenolic groups and this results
in their aromatic rings being in different environments. Because of this, the
aromatic rings of BisCB and BisN give two sets of four aromatic shifts in the
and NMR spectra as compared to only one set for the symmetrica!
bis-phenols. The difference in the aromatic rings of BisC is such that the 1H
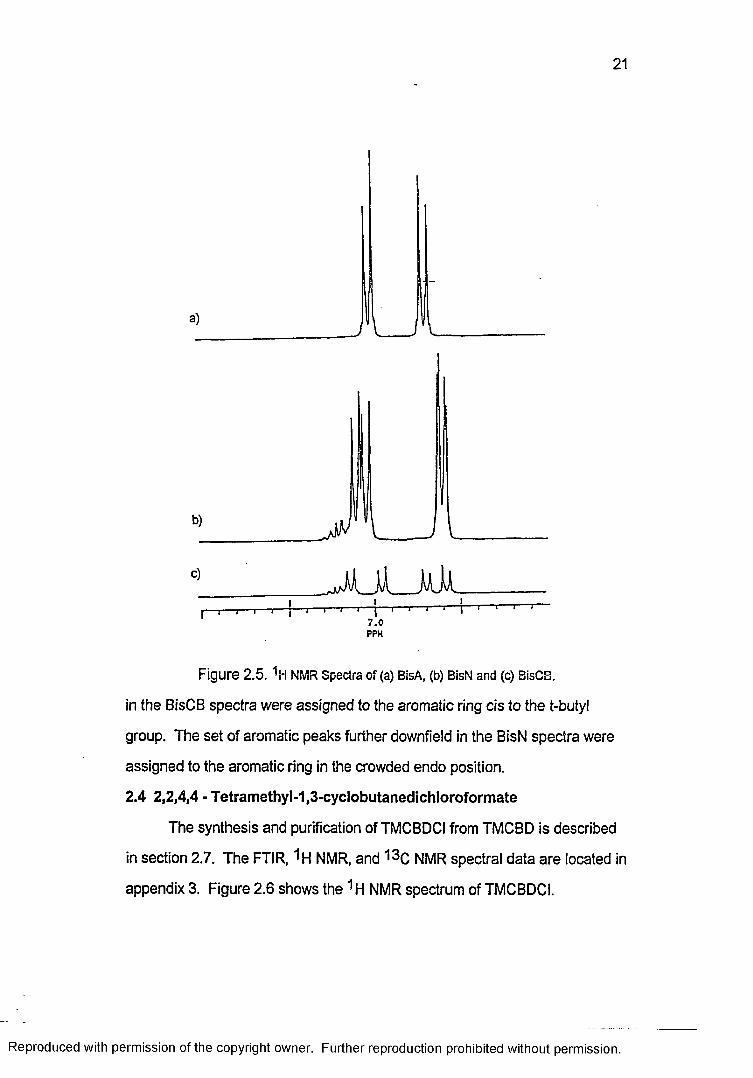
and NMR spectra show one set of shifts. Figure 2.5 compares the
aromatic region in the ''H NMR spectra of a symmetrical BisA with
unsymmetrical BisN and BisCB. The set of aromatic peaks further downfield
Reproduced with permission of the copyright owner. Further reproduction prohibited without permission.
Reproduced
with perm
ission of the
copyright ow
ner. Further
reproduction prohibited
without
permission.
1 0 0
oc
'P.
£ 5 0wco
0 -
3 5 0 0 3 0 0 0 2 5 0 0 2000 1 5 0 0 1000 5 0 04 0 0 0
Wavenumber (cm—1)Figure 2 .3 . FTIR Spectrum of BisCB.
! <DIi
Reproduced
with perm
ission of the
copyright ow
ner. Further
reproduction prohibited
without
permission.
I
100 -
5 0 -
3 0 0 0 2000 5 0 03 5 0 0 2 5 0 0 1 5 0 0 10004 0 0 0Wavenumber (cm —1)
- Figure 2.4. FTIR Spectrum of BisAD.roo
21
c)_______A JL k li—I I I
I— I— I— I— I— j— I— I— I— I— j— I— 1 1 ' 1 1 1 ' '
7 .0PPH
Figure 2.5. NMR Spectra of (a) BisA, (b) BisN and (c) BisCB.
in the BisCB spectra were assigned to the aromatic ring cis to the t-butyl
group. The set of aromatic peaks further downfield in the BisN spectra were
assigned to the aromatic ring in the crowded endo position.
2.4 2,2,4,4 -Tetramethyl-1,3-cyclobutanedichloroformate
The synthesis and purification of TMCBDCI from TMCBD is described
in section 2.7. The FTIR, NMR, and 13c NMR spectral data are located in
appendix 3. Figure 2.6 shows the 1H NMR spectrum of TMCBDCI.
Reproduced with permission of the copyright owner. Further reproduction prohibited without permission.

2 2
TMCBDCI was recrystallized from hexane; however, the trans isomer is
more soluble in hexane than the cis isomer. This resulted in a varying cis
isomer concentration (50 - 65%). However, it was possible to lower
(40 - 50 %) or raise (65 - 75 %) the cis isomer concentration. The method
used to change the cis isomer concentration is discussed in section 2.7. The
cis to trans ratio was found by two methods. First, the cis C-H peak (4.37
ppm) in the ^H NMR spectrum was compared to the trans C-H peak (4.55
ppm). Second, the cis CH3 peaks (1.14 and 1.32 ppm) in the 1H NMR
spectrum were compared to the trans CH3 peak (1.22 ppm). Both of these
methods gave the same results. The melting range of TMCBDCI varies with
the amount of cis and trans isomers but is generally 40 - 60 °C.
rrTTTT18.0
T T TT rTTr 6 . 0 4
PPM
Figure 2.6. 1H NMR Spectrum of TMCBDCI.
2.5 Copolymers
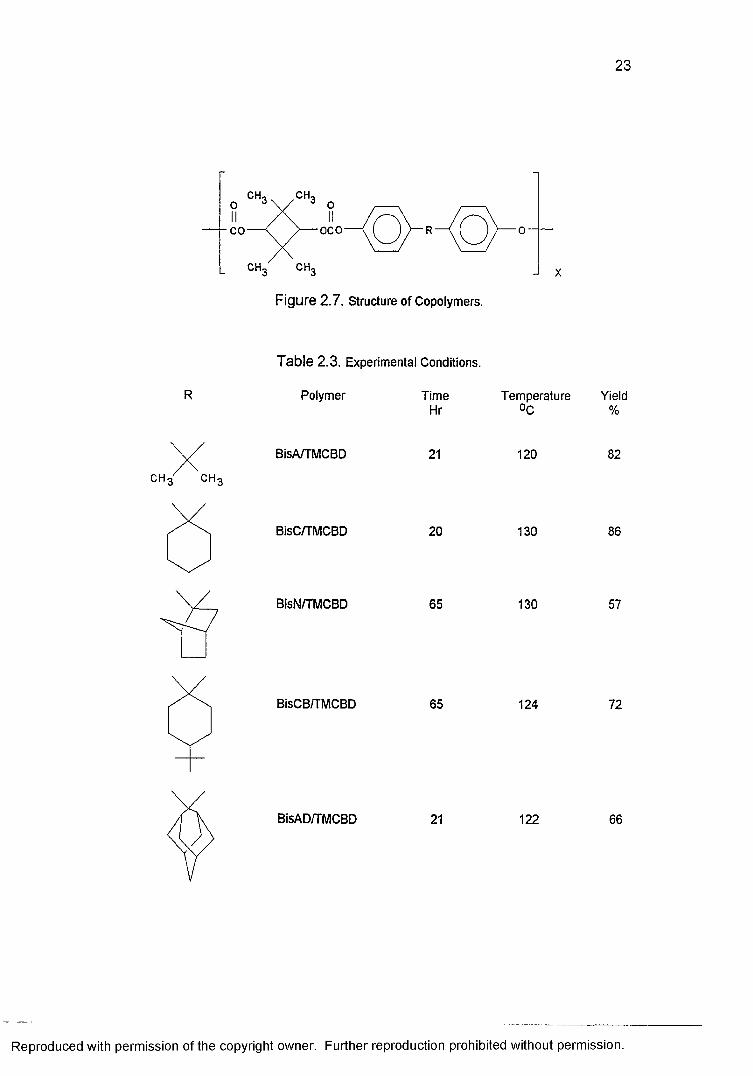
The synthesis of the copolymers is described in section 2.7. The
general structure of the copolymers is illustrated in figure 2.7, where R
indicates the changing substituent of the bis-phenols. Typical reaction
conditions and yields are shown in table 2.3. The copolymers contained 50 %
bis-phenol, 25 - 33 % cis TMCBD, and 1 7 - 2 5 % trans TMCBD units.
Reproduced with permission of the copyright owner. Further reproduction prohibited without permission.
23
CH.CH.0
OCOCO
CH. CH.
Figure 2.7. Structure of Copolymers.
R
Tab le 2.3. Experimental Conditions.
Polymer TimeHr
Temperature Yield°C %
CH Y CH
BisA/TMCBD 21 120 82
BisC/TMCBD 20 130 86
BisN/TMCBD
BisCB/TMCBD
65
65
130
124
57
72
BisAD/TMCBD 21 122 66
Reproduced with permission of the copyright owner. Further reproduction prohibited without permission.

24
Table 2.3. cont. Polymer Time
Hr
BisAP/TMCBD
BisHPF/TMCBD
BPfTMCBD
40
19
Temperature Yield
°C %
126
116
135
76
63
87
CF3 CF3
0
c
o o\s // s
BisF/TMCBD
BisCO/TMCBD
BisS02/TMCBD
20
20
69
124
119
124
70
51
85
BisS/TMCBD 20 90 68
The reaction time and temperature were important conditions. The
reaction temperature was kept between 100-130 °C. Because pyridine in
the presence of water degrades the copolymers and TMCBDCI, the reaction
was maintained above 100 °C. Also, above 100 °C, pyridine hydrogen
chloride sublimes from the reaction removing the hydrogen chloride
condensate. The temperature was maintained below 130 °C to avoid boiling
off the solvent and/or codistilling one of the monomer components. When
adding the pyridine, the temperature was maintained at 120 -125 °C during
the initial exothermic stages of the reaction. The reaction was ran for 10 - 70
Reproduced with permission of the copyright owner. Further reproduction prohibited without permission.
25
hours. Early in the reaction, the copolymers precipitated from the solution as
oligomers. If the reaction was given sufficient time, the copolymers
redissolved and continued to react. Finally, if the reaction was continued for
longer periods of time, the copolymers began to degrade with a
corresponding lowering of the molecular weight.
There are a few notes about the copolymerizations. First, the
BisS/TMCBD copolymerization formed a discolored low molecular weight
polymer. If the reaction was done at 90 °C and care was taken to dry the
solvent and glassware, a high molecular weight copolymer was formed.
Second, the BisAD/TMCBD copolymer precipitated early from the reaction
medium and did not redissolve. Third, after a few hours, the BP/TMCBD
reaction solution became too viscous to stir and the reaction was halted.
Finally, the yield of the reactions were not quantitative, but the lower
molecular weight components of the copolymers are soluble in methanol.
This causes incomplete precipitation of the copolymers from the reaction
solution. Evaporation of the methanol to isolate the low molecular weight
components gave greater than quantitative yields due to salt and solvent
impurities.
2.S End Groups
End groups were added to the copolymer chains to increase the
thermal stability of the copolymers. Because the proton shifts of trimethylsilyl
groups are easily identified, the copolymers were capped with them ,4 3 .4 4
This was accomplished by treating the dissolved copolymers with
chlorotrimethylsilane in the presence of pyridine using bulk chloroform as the
solvent. The small amount of water in the chloroform reacts with any
chloroformate groups to give an alcohol, and the alcohol reacts with
Reproduced with permission of the copyright owner. Further reproduction prohibited without permission.

26
chlorotrimethylsilane adding an end group. Figure 2.8 shows the addition of
trimethylsilyl end groups to the copolymer chain.
CICOO— Copolymer— OH
Base/H20
ir
HO— Copolymer— OH
(CH3)3SiCI Base
(CH3)3SiO— Copolymer— OSi(CH3)3
Figure 2.8. Addition of Trimethylsilyl End Groups.
2.7 Experimental
The synthetic method used to produce BisCB was described
p r e v io u s ly .^ ? 10.4 g (6.76 mmol) of 4-t-butylcyclohexanone, 17.3 g (18.4
mmol) of phenol and 1 ml of 3-mercaptopropionic acid were added to a three
neck flask equipped with a condenser, magnetic stirrer, gas inlet and
thermometer. The reaction was heated to 80 °C and purged with nitrogen
gas. Then, hydrogen chloride gas was bubbled through the reaction. After
forty minutes, a dark red foamy material was formed. The addition of
hydrogen chloride gas was stopped and the reaction was cooled. The mixture
was allowed to stand at room temperature for twelve hours. Afterwards, the
solid mass was broken up and 100 ml of water was added. The mixture was
steam distilled to remove the excess phenol and 3-mercaptopropionic acid
leaving an aqueous solid suspension. The solid was collected from the
Reproduced with permission of the copyright owner. Further reproduction prohibited without permission.

27
mixture by filtration. The solid was dissolved in 900 ml of toluene, dried with
anhydrous magnesium sulfate, and decolorized with carbon black. The
mixture was filtered over celite, and the filtrate was evaporated to 400 ml.
During which time, a fine white crystalline material separated from the
solution. The crystals were collected by filtration. The filtrate was evaporated
to 125 ml and more white crystals separated from the solution. These were
collected and combined with the other crystals. This was continued until only
20 ml of filtrate remains at which time the filtrate was discarded. The yield of
BisCB was 55 %. The melting point is 184 -186 °C. Larger crystals were
formed by recrystallizing from hot toluene.
The synthetic method used in producing BisAD was the same as the
above procedure. 8.56 g (5.70 mmol) of adamantanone, 13.7 g (14.6 mmol)
of phenol, and 1 ml of 3-mercaptopropionic acid were used. The crude solid
was dissolved in hot acetonitrile instead of toluene. The yield was 6 6 %.
BisAD decomposes at 304 °C.
TMCBDCI was synthesized from TMCBD using a previously described
method, but the synthesis and purification were different.25 48.4 g of TMCBD
(33.6 mmol) and 100 ml of dichloromethane were added to a four neck 500 ml
round bottom flask and cooled to 8 °C in an ice bath. The flask was equipped
with a mechanical stirrer, nitrogen inlet, thermometer and dewar condenser.
The dewar condenser was cooled with a dry ice/acetone mixture and was
connected to a sodium hydroxide bath by a rubber hose. The reaction was
purged with nitrogen for ten minutes. The nitrogen inlet was then removed
and replaced with a 150 ml dripping funnel containing 55.7 ml (68.9 mmol) of
pyridine and 56 ml of dichloromethane. 100.7 g (101 mmol) of phosgene
were added to the reaction and the cooled suspension was stirred. The
pyridine solution was dripped into the suspension at a rate such that the
Reproduced with permission of the copyright owner. Further reproduction prohibited without permission.

28
reaction temperature did not go above 15 °C. After the pyridine addition, the
reaction was warmed to room temperature and allowed to stand with stirring
for 12 hours. After 12 hours, the reaction was purged with nitrogen gas with
the effluent stream going into a ammonium hydroxide bath. The purging was
continued until no more reaction was noted between the phosgene and
ammonium hydroxide (usually 6 to 8 hours). Afterwards, the reaction was
extracted with 2000 ml of hexane. The hexane solution was filtered,
evaporated to 600 ml, and cooled at 0 °C for twelve hours, during which time,
bulky white crystals were formed. The crystals were collected by filtration.
The filtrate was evaporated to 200 ml and cooled for twelve hours yielding
more crystals. The crystal were collected by filtration and combined with the
previous crystals. This was continued until the newly formed crystals were
discolored. At that time, the discolored crystals and filtrate were discarded.
The yield was 8 8 % and the melting point is 51 - 57 °C. The crystals were
thoroughly mixed to insure an even distribution of cis and trans isomers. The
cis concentration varied for each synthesis but was between 50 - 65 %. In
order to control the cis isomer concentration, the fraction of TMCBDCI crystals
were not combined. The first collected fraction of crystals varied for each
synthesis but had a cis isomer concentration of 65 - 75 %. The last collected
fraction of crystals had a cis concentration of 40 - 50%. Copolymers can be
synthesized from any of the fractions.
The synthesis of the copolymers was kept the same; therefore, only the
synthesis of the bisphenol A and TMCBD copolymer (BisA/TMCBD) is
discussed. 2.764 g (1.211 mmol) of bisphenol A, 3.258g (1.211 mmol) of
TMCBDCI and 50 ml of chlorobenzene were added to a 100 ml three neck
round bottom flask equipped with a magnetic stirrer, thermometer, condenser,
and nitrogen gas inlet. The reaction was heated to 120 °C and purged with
Reproduced with permission of the copyright owner. Further reproduction prohibited without permission.
29
nitrogen. The nitrogen inlet was replaced with a dropping funnel containing 5
ml of chlorobenzene and 2.1 ml (2.6 mmol) of pyridine. The pyridine solution
was dripped into the reaction at a rate such that the temperature did not go
above 125 °C. After the pyridine addition, the nitrogen inlet was returned and
nitrogen gas was bubbled through the reaction for 10 hours. At which time, a
clear solution of polymer was topped by a crystalline pyridine hydrogen
chloride that sublimed to the top of the flask. The reaction was poured into
methanol, and the coagulated white polymer was collected by filtration. The
polymer was dissolved into tetrahydrofuran and precipitated into methanol.
The polymer was collected by filtration and dried in a vacuum oven at 60 °C
for 10 hours. The yield was 82 %.
In order to add end groups to the copolymer chains, 2.0 grams of the
copolymer were dissolved in 100 ml of chloroform. The reaction was purged
with nitrogen, 2 ml of pyridine were added, and the reaction was stirred for 15
minutes. Then, 2 ml of chlorotrimethylsilane were added, and the reaction
was stirred for 15 minutes. The reaction was poured in methanol coagulating
the copolymer. The copolymer was purified by dissolving in tetrahydrofuran
and reprecipitating in methanol. The copolymer was collected by filtration and
dried in a vacuum oven for 18 hours. The yield was 1.8 grams (90%).
2.8 Conclusion
Most of the starting materials used to synthesize the copolymers are
commercially available. The copolymerizations are simple to carry out and
the products are easily isolated from the reaction mixture. Also, the
concentration of cis to trans isomers varies when TMCBDCI is synthesized
and purified by the described method. The concentration of cis TMCBDCI is
between 50 - 65 %. Finally, the copolymers are end capped with
chlorotrimethylsilane.
Reproduced with permission of the copyright owner. Further reproduction prohibited without permission.
Chapter 3: Identification of Copolymers
30
Reproduced with permission of the copyright owner. Further reproduction prohibited without permission.

31
3.1 Introduction
This chapter describes the characterization of the copolymers with
respect to the intrinsic viscosities, molecular weights and dispersions. The
chemical shifts from 1H and 13C NMR spectra are listed. The common FTIR
absorbencies of the copolymers are listed. There are several publications
which helped in identifying the spectra.45 - 50 j h e experimental methods used
to measure the properties of the copolymers are located in appendix 5.
3.2 Molecular Weights and Viscosities
Typical weight average molecular weights (Mw), dispersions (Mw/Mn),
intrinsic viscosities ([n]) and composition of the copolymers are listed in table
3.1. The copolymers contained 50 % bis-phenoi units. The cis and trans
TMCBD concentration varied but the cis concentration was 25 - 33 %.
Table 3.1. Molecular Weights and Viscosities.
Polymer Mwg/molex10"3
Mw/Mn [n]dl/g
cis trans % %
BisA/TMCBD
CH CH,76 3.0 .56 31 19
BisC/TMCBD 68 4.0 .39 29 21
BisN/TMCBD 133 6.7 .67 33 17
BisCB/TMCBD 68 3.1 .40 30 20
Reproduced with permission of the copyright owner. Further reproduction prohibited without permission.

32
Polymer
BisAD/TMCBD
BisAP/TMCBD
BisHPF/TMCBD
BP/TMCBD
BisF/TMCBD
BisCO/TMCBD
BisS02/TMCBD
BisS/TMCBD
Table 3.1. Continued.
Mw Mw/Mn [n] cis trans g/mole dl/g % %X10-3
44 4.4 .30 31 19
CH 51 3.0 .38 25 25
,OKO 39 2.9 .34 31 19
144 3.4 .80 27 23
c f 3 c f 3
64 2.7 .34 35 15
0
IIc
55 2.2 .53 32 18
130 5.1 .62 26 24
65 4.3 .44 37 13
Reproduced with permission of the copyright owner. Further reproduction prohibited without permission.

33
The variation in the cis and trans isomer concentration depended on the
concentration of cis units in the starting monomer.
The weight average molecular weights are not exact values but are
found using a gel permeation chromatography (GPC) calibrated with
polystyrene standards. Figure 3.1 shows a typical GPC plot. The
BisA/TMCBD copolymer was synthesized with weight average molecular
weights ranging from 20,000 to 120,000 daltons. However, below 30,000
daltons, the samples did not form stable films.
453525Minutes
Figure 3.1. GPC Plot of BisC/TMCBD.
Most of the molecular weight dispersions are high for copolymers
derived by a condensation method. Because lower molecular weight
components were not recovered, the actual dispersions are higher. This can
be seen by the low molecular weight shoulder of the GPC plot in figure 3.1.
The high dispersions are caused by the copolymers precipitating from the
Reproduced with permission of the copyright owner. Further reproduction prohibited without permission.
34
reactions as oligomers. Step growth polymerizations involving a precipitating
polymer have high dispersions.51
The BisAD/TMCBD, BisHPF/TMCBD, BisCO/TMCBD and BisF/TMCBD
copolymers were not synthesized with high Mw values. If the BisF, BisHPF and
BisCO monomers were ultra pure, molecular weights just high enough to form
stable films were achieved. The low Mw of BisAD was caused by an
insufficient reaction time due to the copolymer precipitating from the reaction
medium. In contrast, the formation of BP/TMCBD copolymer lead to a reaction
viscosity that ultimately limited dispersion of reactants.
3.3 infrared and NMR Spectra
The infrared spectra of the copolymers have similar absorption bands
including: C=0 at 1770 cm-1, O-C stretching at 1245 c irr i, CH3 stretching at
2860-70 cm‘ 1, CH3 bending at 1380 cm'1. The para substituted aromatic ring
absorption is at 850 cm'1. When present, the absorption band corresponding
to the O-H end group is at 3500 cm_1. Figure 3.2 shows a typical FTIR
spectrum.
The 1h NMR chemical shifts of the copolymers backbone hydrogens are
listed in table 3.2, and figure 3.3 gives the hydrogens locations. Several of the
substituents in the copolymers have overlapping chemical shifts. Because of
this, the chemical shifts for the substituents are identified for their respective
13c NMR spectra.
As mentioned earlier, the BisN and BisCB monomers show two sets of
aromatic shifts in the 1H NMR spectra and this is the same for their respective
copolymers. Figure 3.4 shows the 1H NMR spectra of BisA/TMCBD, BisN/
TMCBD and BisCB/TMCBD copolymers. Furthermore, the spectrum of the
BisCB/TMCBD copolymer shows two sets of cis and trans C-H shifts. Because
of this, only the 13C NMR spectra of BisCB/TMCBD and BisN/TMCBD spectra
Reproduced with permission of the copyright owner. Further reproduction prohibited without permission.
Reproduced
with perm
ission of the
copyright ow
ner. Further
reproduction prohibited
without
permission.
1 0 0
<ooco
£mc.a5 0 -
4 0 0 0 3 5 0 0 3 0 0 0 2 5 0 0 2000 1 5 0 0 1000 5 0 0Wavenumber ( cm —1)
Figure 3.2 . FTIR Spectrum of BisA/TMCBD.coOl

36
ooco ooco
A , B
R
Figure 3.3. Location of Backbone Hydrogens.
Table 3.2. Chemical Shifts of Backbone Hydrogens in ppm.a
Polymer A (cis) B(trans) C(cis) D(trans) E F
BisA/TMCBD 1.181.34
1.25 4.29 4.46 7.207.25
7.087.09
BisC/TMCBD 1.131.30
1.20 4.24 4.41 7.217.25
7.037.06
BisAD/TMCBD 1.111.29
1.18 4.22 4.39 7.367.40
7.017.05
BisAP/TMCBD 1.121.35
1.21 4.30 4.46 7.237.29
7.00
BisHPF/TMCBD 1.131.31
1.21 4.25 4.42 7.187.23
7.007.04
BP/TMCBD 1.241.38
1.30 4.34 4.52 7.547.59
7.247.27
BisF/TMCBD 1.201.37
1.27 4.33 4.50 7.427.46
7.217.26
BisCO/TMCBD 1.231.39
1.30 4.36 4.53 7.857.88
7.327.35
BisS02/TMCBD 1.161.33
1.24 4.30 4.47 7.968.00
7.337.37
BisS/TMCBD 1.18 1.35
a: Shifts are relative to
1.25 4.30 4.48 7.347.38
tetramethylsilane (TMS) in deuterated chloroform at
7.127.16
ambienttemperatures.
Reproduced with permission of the copyright owner. Further reproduction prohibited without permission.

37
a)
IL
b)
u J A—
C)
1------- ,------- ,------- — |— — ~ j ! ■ ■ ■ "1------- 1 " ■" I------- -------- 1------- 1-----9.0 1 .0 7 .0 1 .0 S.O 4.0 3 .0 2 .0 1.0 0.0
Figure 3.4. 1H NMR Spectra of (a) BisA/TMCBD, (b) BisN/TMCBD and (c) BisCB/TMCBD.
Reproduced with permission of the copyright owner. Further reproduction prohibited without permission.

38
will be discussed. Also, the chemical shift of the impurity in the H NMR
spectrum of the BisCO monomer appears in the spectrum of the copolymer.
The 1H NMR spectra of the copoiymers show four small chemical shifts
at 4.2, 4.4, 6 .7 and 6 .8 ppm that can not be identified as hydrogen in the repeat
unit of the copolymer. Figure 3.5 shows the 1 H NMR spectrum of the BisA/
TMCBD copolymer. The chemical shifts at 4.2 and 4.4 ppm could represent
either TMCBD units or cis and trans TMCBD units in a sequence. Also, the
shifts at 4.2 and 4 .4 ppm could represent TMCBD units at the end of a polymer
chain or products derived from degradation or rearrangement reactions.
Two of the explanations are not feasible. The 1H NMR spectrum of the
TMCBD homopolymer shows the same two small chemical shifts at 4 .2 and 4.4
ppm .52 Therefore, the shifts do not represent TMCBD units in a sequence.
Also, the copolymerization method leads to an alternating copolymer making it
unlikely that more than one cis or trans TMCBD units are in succession. If the
Reproduced with permission of the copyright owner. Further reproduction prohibited without permission.
M,
■i-i'i | >-n i j-ri i i t i i i i | i i i"i'f i t~ri |
r 6 .0
PPH
*'■> i i l i i i i | i
. 4 .0
Figure 3.5. 1H NMR Spectrum of BisA/TMCBD.

39
chemical shifts represents TMCBD end groups, the calculated average degree
of polymerization (DP) would be about 12; however, this assumes that there is
no phenolic end groupsM If the probabilities are equal for phenolic and
TMCBD end groups, the DP would be reduced to 6 . A DP of 6 for the
BisA/TMCBD copolymer corresponds to a number average molecular weight of
2500 daltons. Thus, the peaks do not represent TMCBD end groups.
This leaves degradation or rearrangement reactions that occur during
the copolymerization as possible explanations for the four peaks. There are
three known possible reactions. Chain unzipping of the copolymers is already
mentioned in the introduction of this report 23,24 However, the products
formed from chain unzipping are volatile at 120 °C, and the chemical shifts of
the products do not correspond to the four peaks.5 3
Two remaining explanations for the four chemical shifts are possible. In
both explanations, the shifts at 4.2 and 4.4 ppm are assigned to the C-H group
of the cis and trans TMCBD units, respectively. If this is true, the shifts at 4.2
and 4.4 ppm represent about 8 % of the TMCBD units in the copolymer chain.
Also, the ratio of the shifts at 4.2 to 4.4 ppm equals the ratio of the cis to trans
TMCBD units in the copolymer chain.
Aromatic polycarbonates are know to undergo a rearrangement between
the carbonyl and aromatic ring to give a trisubstituted aromatic ring that has the
potential to cause chain branching.5 ^ - 5 3 Figure 3.6 shows the rearrangement.
Therefore, the peaks at 4.2 and 4.4 ppm could represent TMCBD units
connected to an ester linkage. This would lead to a different splitting pattern
for the protons of the trisubstituted aromatic ring. The splitting should result in
three sets of shifts at 6.7, 6 .8 and 7.5 ppm. The chemical shift at 7.5 ppm may
not be noticeable due to interference by the shifts of the aromatic protons in the
copolymer. This explanation does not account for the chemical shifts at 4.2
Reproduced with permission of the copyright owner. Further reproduction prohibited without permission.
o o c o — ( C j y -
v
R
OOCR
HO
Figure 3.6. Rearrangement Reaction,
and 4.4 ppm in the NMR spectrum of the TMCBD homopolycarbonate.
Finally, the products of the rearrangement reaction leads to an absorption band
at 1730 cm-1. This would cause the carbonyl absorption band in the FTIR
spectra of the copolymers to be split, but no splitting is apparent.
An aliphatic polycarbonate can eliminate a small molecule such as
carbon dioxide from the c h a in .5 7 58 Figure 3.7 illustrates the carbon dioxide
elimination. The elimination would result in TMCBD units connected to an ether
0II
R -O C O -R ------- ► R -O -R + C02
Figure 3.7. Carbon Dioxide Elimination,
linkage and the chemical shifts at 4.2 and 4.4 ppm could represent these units.
If the elimination reaction is occurring, the product should give four different
shifts in the aromatic region. All of the 1H NMR spectra of the copolymers
except the BisAP/TMCBD show two shifts. The spectrum of BisAP/TMCBD
show four shifts. Figure 3.8 shows the ̂H NMR spectra of BisA/TMCBD and
Reproduced with permission of the copyright owner. Further reproduction prohibited without permission.

41
6 .0 4.0
PPM
Figure 3.8. 1h NMR Spectra of (a) BisA/TMCBD and (b) BisAP/TMCBD.
BisAP/TMCBD. The other spectra do not show the peaks due to interference
from the shifts of the aromatic protons in the copolymer. Also, the elimination
would explain the chemical shifts in the NMR spectrum of the TMCBD
homopolycarbonate. Because of this and the lack of a split carbonyl band in
the FTIR spectra of the copolymers, the elimination reaction is occurring.
The chemical shifts for the 13C NMR spectra are located in table 3.3
and the carbon identification is located in figure 3.9. The four unidentified
chemical shifts seen in the NMR spectra do not show in the ^3C NMR
Reproduced with permission of the copyright owner. Further reproduction prohibited without permission.
42
OOCOooco R
Figure 3.9. Location of Backbone Carbons.
Table 3.3. Chemical Shifts of Backbone Carbons in ppm.a-b
Polymer C(cis) D(trans) G H I J K
BisA/TMCBD 83.4 84.4 153.6 149.1 120.1 127.9 148.1
BisC/TMCBD 83.4 84.4 153.6 148.8 120.5 128.3 146.0
BisN/TMCBD 83.4 84.4 153.6 148.7148.3
120.3120.4
128.0128.8
149.9145.9
BisCB/TMCBD 83.4 84.4 153.3153.6
149.1148.7
120.3120.6
127.3129.1
142.9148.9
BisAD/TMCBD 83.3 84.3 154.0 148.2 120.7 126.8 145.7
BisAP/TMCBD 83.4 84.4 153.5 148.2 120.2 129.7 146.6
BisHPF/TMCBD 83.4 84.5 153.5 150.6 120.7 129.2 149.9
BP/TMCBD 83.5 84.5 154.0 151.0 121.3 128.2 138.0
BisF/TMCBD 83.7 84.7 153.1 151.5 120.9 132.2 135.5
BisCO/TMCBD 83.6 84.7 154.1 152.8 120.9 131.5 135.0
BisS02/TMCBD 83.8 84.9 154.5 152.5 121.9 129.6 138.9
BisS/TMCBD 83.5 84.5 153.2 150.3 121.8 132.2 135.5 a) Shifts are relative to TMS in deuterated chloroform at ambient temperatures b) A (cis) 28.4
and 16.3; B (trans) 22.4; E (cis) 41.7; and F(trans) 40.3 ppm for all spectra.
spectra due to baseline interference. The 13C NMR chemical shifts of the
substituents are located in appendix 4. The spectra of the BisCB/TMCBD and
BisN/TMCBD copolymer show different splitting patterns in the aromatic region,
and the carbonyl of each is split. The cis and trans C-H shifts of the TMCBD
Reproduced with permission of the copyright owner. Further reproduction prohibited without permission.

43
unit in the BisCB/TMCBD spectrum are not split. Figure 3.10 shows the 13C
NMR spectra of BisCB/TMCBD and BisN/TMCBD.
f ' 1 ' i ' 1 1 i160 160 140 120
T -60
T0
~~r~so100
— i40
tSO
Figure 3.10. 13C NMR Spectra of (a) BisCB/TMCBD and (b) BisN/TMCBD.
Mass spectra of the BisS/TMCBD copolymer were measured. This was
done by raising the temperature from 25-150 °C with the ion source passing
through the copolymer. The fragments collected were phenol, benzene, 4-
phenolsulfide, carbonate, and 2,4 dimethyl-2-pentene (TMCBD degradation
Reproduced with permission of the copyright owner. Further reproduction prohibited without permission.

44
product). Also, the mass spectra showed trace amounts of chloroform,
pyridine, and chlorobenzene. This shows that not only is the synthetic method
costly but impurities were left in the copolymer sample.
3.4 End Groups
When the reaction time was kept to a minimum, treatment of a
copolymer with chlorotrimethylsilane did not cause large changes in the
molecular weight or viscosity of the sample. Long reaction times resulted in a
lowering of the molecular weight and viscosity. If a short reaction time was
used, there was only a small change in intrinsic viscosity, the FTIR spectra and
H NMR spectra of the copolymers.
After the treatment, the viscosity showed a slight decrease. The FTIR
spectrum shows a disappearance of the -OH peak at 3500 cm '1, and the 1H
NMR spectrum shows the appearance of two peaks at .1 and .3 ppm. The
peaks at .3 and .1 ppm are the expected position for the chemical shifts of a
CH3 -Si group connected to a phenol or aliphatic alcohol.5® Figure 3.11 shows
the 1H NMR spectrum of BisAP/TMCBD with end groups. The four chemical
shifts at 4.2,4.4, 6 . 6 and 6 . 8 ppm in the 1H NMR spectra show no change after
the reaction. This gives proof that the shifts are not hydroxyl end groups,
phenolic end groups or phenolic groups from a rearrangement reaction.
If the reaction of a copolymer and chlorotrimethylsilane was quantitative,
the Mn can be calculated from the shifts of the trimethylsilyl groups in the 1H
NMR.44 However, the calculated Mn is 30 % lower than the measured Mn.
Three explanations could account for the difference. The conformation of the
copolymers in solution may not be similar to polystyrene. Polystyrene was the
standard used to calibrate the GPC. The area of the small chemical shifts at .1
and .3 ppm may be in error. Chain branching gives polymers with more than 2
end groups per chain and this would lower the calculated Mn.
Reproduced with permission of the copyright owner. Further reproduction prohibited without permission.
45
1.0 .5 0.0PPM
Figure 3.11. 1H NMR Spectrum of End Capped BisAP/TMCBD.
This appears to make the rearrangement reaction plausible. However,
there can only be less than one branch site per chain or the copolymer would
be crosslinked.6 0 This corresponds to 1 % branch sites for a copolymer with a
DP of 100 (Mn of 45,000 daltons). Therefore, the rearrangement reaction can
only lead to a small number of branching sites. It is possible that both the
rearrangement and elimination reaction were occurring but the elimination
occurred to the greatest extent.
3.5 Conclusion
Most of the copolymers are synthesized with a high Mw, but the BisCO
and BisF monomers must be pure. The BisAD/TMCBD copolymer is not
synthesized to a high Mw due to the insolubility of its oligomers. The amount of
cis units in the copolymer depends on the amount of cis units in the starting
TMCBDCI.
The NMR spectra of the copolymers are identified and are consistent
with the assigned structure. All of the 1H NMR spectra of the copolymers show
four chemical shifts that are assigned to an elimination reaction. The
Reproduced with permission of the copyright owner. Further reproduction prohibited without permission.

46
elimination reaction leads to about 8 % ether linkages in the copolymer chain.
Finally, the addition of trimethylsilyl end groups to the copolymer chain is
confirmed by 1H NMR.
Reproduced with permission of the copyright owner. Further reproduction prohibited without permission.

Chapter 4: Optical Properties
47
Reproduced with permission of the copyright owner. Further reproduction prohibited without permission.
48
4.1 Introduction
The rest of this report discusses the physical properties of the
copolymers. Due to the varying cis (25 - 33 %) and trans (17-25 %) TMCBD
concentration and molecular weights (intrinsic viscosity) for each synthesis,
two values of each property are given. The first value reported is a range
which represents the value that is obtained if the measurement is repeated
from the synthesis with one stipulation. The stipulation is that the molecular
weight of a newly synthesized copolymer must be high enough to form a
stable film in order to be included in the range. Even with this stipulation, the
range in a property reported in this manuscript is mainly due to the different
molecular weights of a copolymer. Also, the synthetic portion of this report
mentions that copolymers with lower (20 - 25 %) and higher (33 - 35 %) cis
TMCBD concentration can be synthesized. The values for the properties of
these copolymers are not included in the range but are used to confirm the
accuracy of the range. Finally, a specific example of each value is given.
This chapter discusses the refractive indices of the copolymers.
Because films of the copolymers were used to measure some of the
properties and to determine if a copolymer forms a stable film, the method
used to produce films is discussed.
4.2 Films
Films were made either 0.05 mm or 0.15 - 0.2 mm in thickness. Thin
films (0.05 mm) of the copolymers were formed by casting from a dilute
chloroform solution on a glass surface and allowing the chloroform to
evaporate. The films were optically clear to the naked eye and showed no
birefringence under a cross polarized microscope. However, samples of
BisA/TMCBD with low Mw's (under 20,000 daltons) show a few spherulites.
Reproduced with permission of the copyright owner. Further reproduction prohibited without permission.

49
The refractive indices of the copolymers were measured from thin film
samples.
Thicker films (0.15 - 0.2 mm) were made by two methods. First, films
were pressed using a hot press heated to 15 °C above the Tg at 600
pounds/inch^. The pressed films were optically clear to the eye and showed
no birefringence under a cross polarized microscope. The surfaces of the
films were irregular. The irregularity was caused by undulations on the
surface of the hot plate. However, Nieglisch et al showed that clear films of
BisA/TMCBD can be formed by injection molding.^ 8 Second, films were cast
in a circular glass dish (9 cm) from a chloroform solution (1.2g /100 ml). The
glass dish was heated to 60 °C in a chloroform saturated environment.
Surprisingly, most of the thick films cast from chloroform showed a slight
cloudiness. If the Mw was greater than 20,000 daltons, the films showed no
birefringence under a polarized microscope. Thick films were used to
measure the beta transition temperatures
In order to determine if the molecular weight of a copolymer was high
enough to form a stable film, a thin film of the freshly synthesized copolymer
was cast on a glass plate from a chloroform solution. The film was allowed to
dry for 24 hours at room temperature and then placed in an oven at 60 °C for
24 hours. If the film had dimensional stability (i.e. no cracking or crazing), the
copolymer was deemed acceptable and the properties were measured. If the
film did not have dimensional stability, the copolymer was discarded. The
synthesis of BisA/TMCBD, BisAP/TMCBD, BP/TMCBD and BisS/TMCBD
consistently yielded copolymers that formed stable films. The synthesis of
BisC/TMCBD, BisN/TMCBD, BisCB/TMCBD and BisS02/TMCBD yielded
copolymers that formed stable films a majority of the time. The synthesis of
BisCO/TMCBD, BisF/TMCBD and BisHPF/TMCBD occasionally yielded
Reproduced with permission of the copyright owner. Further reproduction prohibited without permission.

50
copolymers that formed stable films. Finally, the synthesis of BisAD/TMCBD
never yielded a stable film and will not be discussed.
4.3 Optical Properties
The refractive index of each copolymer is listed in table 4.1 along with
a reference for the refractive indices of the homopolymers derived from
several of the bis-phenols. The range of the refractive index of a copolymer is
Table 4.1. Refractive Indices.Polymer nD cis trans [n] Reference
% % dl/g
BisA/TMCBD 1.527 26 24 .46 39
BisC/TMCBD 1.535 29 21 .39 39
BisN/TMCBD 1.535 33 17 .71 41
BisCB/TMCBD 1.526 30 20 .40
BisAP/TMCBD 1.555 25 25 .38 39
BisTP/TMCBDb 1.57
BisHPF/TMCBD 1.576 31 19 .34
BP/TMCBD 1.550 27 23 .80
BisF/TMCBD 1.493 35 15 .34 33
BisCO/TMCBD 1.541 32 18 .53
BisS02/TMCBD 1.540 26 24 .62
BisS/TMCBD 1.560 33 17 .40a) refractive indices of copolymers at ambient temperatures, b) value donated by Dr. William
H. Daly of Louisiana State University.
found easily by rounding the listed value up to 3 significant figures. Except
for the BisF/TMCBD, the refractive index of each copolymer is lower than the
refractive index of its corresponding homopolymer. This indicates that the
addition of the TMCBD units does decrease the polarizability, the dielectric
constant, and the birefringence. Finally, the addition of trimethylsilyl end
groups to a copolymer results in a refractive index within the reported range.
Replacing the isopropyl substituent on bisphenol A with other aliphatic
groups results in only a small change in the refractive index of the copolymer.
Reproduced with permission of the copyright owner. Further reproduction prohibited without permission.

51
Because of this, the BisF/TMCBD and aliphatic substituted copolymers have
the lowest polarizability and represent the best choices for electrical
insulators. Replacing the methyl groups of bisphenol A with aromatic rings
increases the refractive index of the copolymer, and this indicates an increase
in the polarizability. Since the group is perpendicular to the polymer chain,
the aromatic copolymers are the best choices to be used as optical coatings.
The remaining copolymers show an increase in the refractive index caused by
an increase in the polarizability parallel to the polymer chain. Thus, these
copolymers do not represent good choices for an electrical insulator or an
optical coating.
The refractive index of a copolymer can be calculated from the
refractive index of the individual homopolymers.®'' Using this method the
refractive index of the TMCBD homopolycarbonate, the BisCB/TMCBD and
BisAD/TMCBD copolycarbonate are calculated to be 1.45,1.58 and 1.58,
respectively. However, the measured refractive index of the BisF/TMCBD
copolymer is higher than the calculated index. Also, the refractive index of
the homopolycarbonate of TMCBD has not been measured due to samples
being crystalline but the refractive index of a .05/.95 copolymer of
BisA/TMCBD is 1.46.19
4.4 Conclusion
The refractive indices indicate that the copolymers have a lower
polarizability than poly(bisphenol A)carbonate. Due to the low refractive
indices, the BisF and aliphatic substituted copolymers are the best choices as
electrical insulators. The aromatic substituted copolymers show an increase
in the refractive index when compared to the BisA/TMCBD copolymer.
Because the substitution is perpendicular to the polymer chain, the aromatic
substituted copolymers are the best choices for an optical material.
Reproduced with permission of the copyright owner. Further reproduction prohibited without permission.
Chapter 5: Thermal Properties
52
Reproduced with permission of the copyright owner. Further reproduction prohibited without permission.

53
5.1 Introduction
This chapter discusses the thermal properties of the copolymers. The
Tg's and beta transition temperatures are listed. The temperature range in
which the copolymers in this report can be used are discussed. The Tg is the
onset of long range motion by a polymer chain, and the beta transition
temperature is the onset of short range motion by individual units in the
polymer chain. A polymer is soft and tacky when it is at a temperature above
the Tg; it is brittle when at a temperature below the beta transition temperature.
The temperature range in which a polymer can be used as a structural material
is between the Tg and beta transition temperatures. The thermal stability of the
copolymers with and without end groups is discussed.
5.2 Transition Temperatures
Table 5.1 lists the transition temperatures of the copolymers and a
reference for the Tg of the homopolycarbonate derived from each bis-phenol.
Figure 5.1 shows a typical differential scanning calorimeter (DSC) plot for the
measurement of a Tg. The range of Tg's of the copolymer is the first value
± 3 °C. The second value is the exact value. The range may seem surprising
but M. Gawlak et al have shown that the Tg of the TMCBD homopolycarbonate
is independent of ihe cis/trans TMCBD ratio.3 1 The Tg of a copolymer treated
with chlorotrimethylsilane is within the range reported for that copolymer.
The Tg's of the aliphatic copolymers increase as the size of the aliphatic
unit increases. Replacing a methyl group on bisphenol A with a phenyl ring
causes an increase in the Tg of the copolymer. Replacement of both methyl
groups with phenyl rings causes an even greater increase in the Tg. Bonding
the two aromatic rings together as in the fluorenone substituted bis-phenol
results in an increase in the Tg. As expected, flexible substituents like the
sulfide and carbonyl group decrease the Tg.
Reproduced with permission of the copyright owner. Further reproduction prohibited without permission.
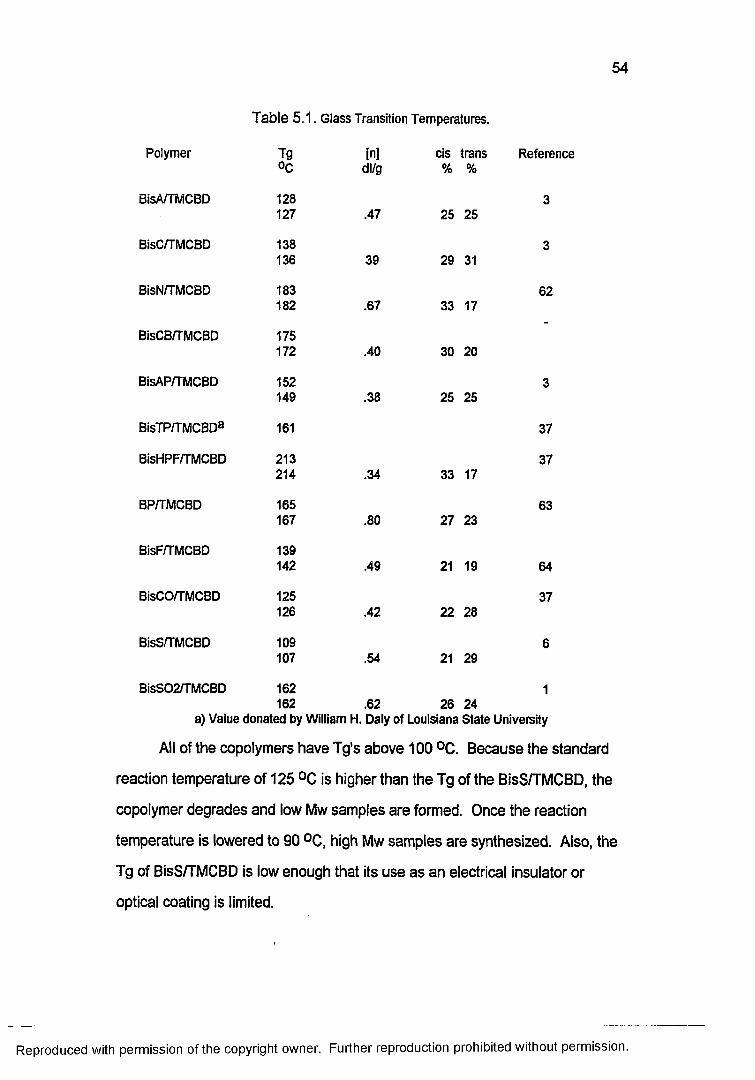
54
Table 5.1. Glass Transition Temperatures.
Polymer Tg°c
In]dl/g
cis trans % %
Reference
BisA/TMCBD 128127 .47 25 25
3
BisC/TMCBD 138136 39 29 31
3
BisN/TMCBD 183182 .67 33 17
62
BisCB/TMCBD 175172 .40 30 20
BisAP/TMCBD 152149 .38 25 25
3
BisTP/TMCBD3 161 37
BisHPF/TMCBD 213214 .34 33 17
37
BP/TMCBD 165167 .80 27 23
63
BisF/TMCBD 139142 .49 21 19 64
BisCO/TMCBD 125126 .42 22 28
37
BisS/TMCBD 109107 .54 21 29
6
BisS02/TMCBD 162162 .62 26 24
1
a) Value donated by William H. Daly of Louisiana State University
All of the copolymers have Tg’s above 100 °C. Because the standard
reaction temperature of 125 °C is higher than the Tg of the BisS/TMCBD, the
copolymer degrades and low Mw samples are formed. Once the reaction
temperature is lowered to 90 °C, high Mw samples are synthesized. Also, the
Tg of BisS/TMCBD is low enough that its use as an electrical insulator or
optical coating is limited.
Reproduced with permission of the copyright owner. Further reproduction prohibited without permission.
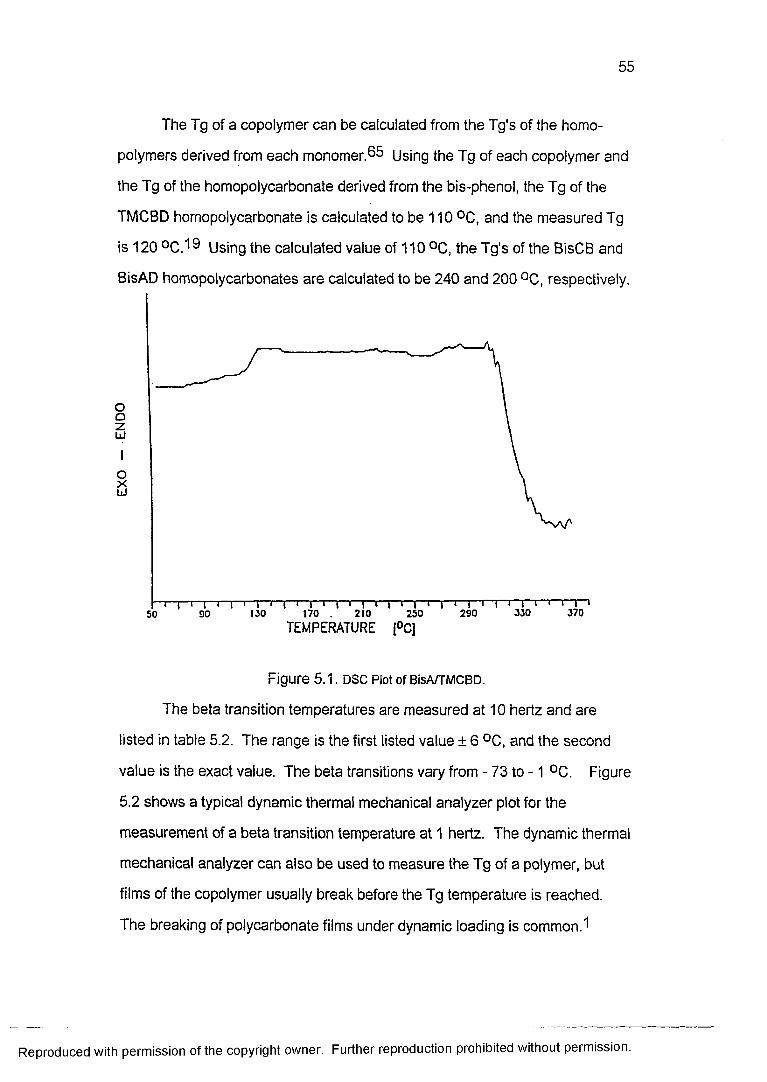
55
The Tg of a copolymer can be calculated from the Tg's of the homo
polymers derived from each monomer.^5 Using the Tg of each copolymer and
the Tg of the homopolycarbonate derived from the bis-phenol, the Tg of the
TMCBD homopolycarbonate is calculated to be 110 °C, and the measured Tg
is 120 °C .1 9 Using the calculated value of 110 °C, the Tg's of the BisCB and
BisAD homopolycarbonates are calculated to be 240 and 200 °C, respectively.
oazU)
OXu
J70 . 210
T E M P E R A T U R E [°C ]
29025090
Figure 5.1. DSC Plot of BisA/TMCBD.
The beta transition temperatures are measured at 10 hertz and are
listed in table 5.2. The range is the first listed value ± 6 °C, and the second
value is the exact value. The beta transitions vary from - 73 to - 1 °C. Figure
5.2 shows a typical dynamic thermal mechanical analyzer plot for the
measurement of a beta transition temperature at 1 hertz. The dynamic thermal
mechanical analyzer can also be used to measure the Tg of a polymer, but
films of the copolymer usually break before the Tg temperature is reached.
The breaking of polycarbonate films under dynamic loading is common. 1
Reproduced with permission of the copyright owner. Further reproduction prohibited without permission.

56
However, the plot in figure 5.2 shows a sample of BisCB/TMCBD in which the
film did not break. The peak at the higher temperature (172 °C) represents the
Tg.
Table 5.2. Beta Transition Temperatures at 10 Hertz.3
Polymer Beta cis trans [n]°C % % dl/g
BisA/TMCBD -69-70 25 25 .74
BisC/TMCBD -51-51 27 23 .58
BisN/TMCBD -55-59 22 28 .52
BisCB/TMCBD -39-37 24 26 .70
BisAP/TMCBD -47-45 23 27 .45
BisHPF/TMCBD -45-44 25 25 .32
BP/TMCBD 0-1 35 15 1.2
BisF/TMCBD -56-56 25 25 .30
BisCO/TMCBD -73-73 29 21 .38
BisS/TMCBD -47-46 22 28 .54
a) Beta Transitions measured on copolymers with trimethylsilyl end groups at 10 hertz.
The range of temperature in which a polycarbonate can be used is from
10 °C above the beta transition temperature to 10 °C below the Tg. Therefore,
the copolymer do show a large range of usage. However, most are smaller
than the usage range of poly(bisphenol A)carbonate.
Reproduced with permission of the copyright owner. Further reproduction prohibited without permission.

57
o.i ioo [•
tan 8 !.
0.0600 j-
0.1600
0 .0100*--150 -62.5 ' 25
. Temperature [°C]112.5 200
Figure 5.2. Dynamic Thermal Mechanical Analyzer Plot of BisCB/TMCBD.
Finally, computer simulations on a Sybyl (version 5.22) molecular
graphics and mechanics program were done on several bis-phenols to find
their minimum conformations. It was hoped that by comparing the central bond
angles between the two aromatic rings of different bis-phenols the copolymer
with the higher Tg could be predicted. Figure 5.3 shows the bond angle (A) of
the bis-phenols. Table 5.3 lists the bond angles, the oxygen to oxygen
distances of the simulated bis-phenols and the Tg's of the copolymers derived
from the bis-phenols. As can be seen, the Tg's of the copolymers do not
depend on the bond angle in the simulated models.
Reproduced with permission of the copyright owner. Further reproduction prohibited without permission.
R R'
Figure 5.3. Simulated Bond Angle.

58
Table 5.3. Computer Simulation of Bis-phenols.
Bis-phenolangle (A) degrees
0 - 0 aA
Tg°c
BisA 109.6 9.35 130
BisN 105.9 9.14 180
BisCB 105.3 9.01 175
BisC 102.2 8.92 140
a) A = angstroms
5.3 Thermal Instability
As stated in Chapter one, copolycarbonates of TMCBD and bisphenol A
degrade when heated above the Tg, and the degradation is noticed by foaming
of the polymer sample. There are three mechanisms in which a polymer can
d e g r a d e d a polymer can degrade by a random cleavage mechanism. This
happens when the polymer chains break in random places and results in a
lower molecular weight and higher dispersion for the residual polymer after a
heating cycle. Polycarbonates degrade by this mechanism.1 Also, a polymer
can degrade by a mechanism in which a small molecule is lost from the
chain.57 This would result in a change in the FTIR and NMR spectral data for
a polymer after a heating cycle. Finally, a polymer chain can degrade by an
unzipping m e c h a n is m .2 3 .2 4 Unzipping occurs when a single polymer chain
completely degrades to small molecules while the surrounding chains show no
change. If the products are volatile, then the unzipping mechanism results in
no change in the molecular weight, dispersion and spectral data after a heating
cycle. If the products are not volatile, the spectral data should account for the
degradation products.
Figure 5.4 compares GPC traces of a copolymer with the residual after
a heating cycle. There is a small change in the molecular weight of the sample
and no change in the dispersion. Figure 5.5 compares 1H NMR spectra of
Reproduced with permission of the copyright owner. Further reproduction prohibited without permission.

59
'45Minutes
Figure 5.4. GPC Trace of (a) BisC/TMCBD and (b) Residual,
a copolymer with the residual after a heating cycle. These figures show that
the copolymers degrade by an unzipping mechanism with volatile products
being formed. The volatile products lead to the formation of gas pockets in the
film which is known as foaming. These results are in agreement with those of
Reproduced with permission of the copyright owner. Further reproduction prohibited without permission.

60
A. D'Onofrio for the BisA/TMCBD c o p o ly m e r .2 3 .2 4 Nevertheless, the intent of
this project is to make thermally stable films and not foams.
Figure 5 .5 . 1H NMR of (a) BisAP/TMCBD and (b) Residual.
5.4 Thermal Stability
R. Hasek et al have shown that the trans isomer of the TMCBD is
unstable in acidic m e d i a . 5 4 , 6 7 Therefore, the phenolic end groups of the
copolymer chains could initiate the unzipping by degrading a trans TMCBD unit
Reproduced with permission of the copyright owner. Further reproduction prohibited without permission.
S.O 8.0 7 .0 6 .0 S.O 4.0 3 .0 2.0 1.0 0 .0PPM

61
at the end or in the copolymer chain. If this is the reason for the thermal
instability of the copolymers, then end capping would convert the phenolic and
trans TMCBD end groups to more stable moieties. Because of this, the
copolymers were end capped with trimethylsilyl groups.
The thermal stability of BisA/TMCBD, BisAP/TMCBD and BisHPF/
TMCBD with and without end groups were studied by thermal gravimetric
analysis (TGA). The analysis was done by heating the copolymer to 15 °C
above the Tg for three hours while measuring the weight loss. There was no
significant difference in weight loss between the copolymers with and without
trimethylsilyl end groups. Both of the samples showed a 0 - 3 % weight loss
after the three hours. However, if a film of a copolymer with trimethylsilyl end
groups is annealed at 15 °C above the glass transition temperature, a
significant reduction in the number of gas pockets formed by degradation is
noticed when compared to film without end groups from a similar copolymer..
Therefore, the addition of trimethylsilyl end groups to a copolymer does
increase the thermal stability but the copolymers with end groups still show
some degradation.
One interesting curiosity during the thermal analysis of the copolymers
was that samples which were precipitated from chloroform solutions showed a
large decrease in thermal stability when compared to copolymers which where
precipitated from tetrahydrofuran. If the same three hour thermal weight loss
analysis is done on copolymers precipitated from chloroform, the copolymers
show a 3 -12% weight loss. Figure 5.6 compares the thermal weight loss
measurements of (a) a copolymer precipitated from tetrahydrofuran with (b) a
copolymer precipitated from chloroform. As can be seen, the chloroform
precipitated copolymer shows a much larger weight loss.
Reproduced with permission of the copyright owner. Further reproduction prohibited without permission.

62
100.8
90.6
93.-1
97.2
93.6
92.-1
61.5 111 160.5 210TIME m1n
Figure 5.6. TGA Plot of BisA/TMCBD Precipitated from (a) Tetrahydrofuran and (b)Chloroform.
The thermal stability of a copolymer with or without trimethylsilyl end
groups is lessened when the copolymer is repeatedly heating above its Tg.
This is mainly noticed when pressing a film with a hot plate under atmospheric
conditions. If the film is not acceptable, the sample is chopped into pieces and
pressing is repeated. Eventually, the copolymer begins to break down and the
film foams, it is known that the combination of heat and humidity in the air can
cleave carbonate linkages to give reactive phenolic groups which can initiate
the foaming process. Figure 5.7 shows the reaction with w a t e r . 6 ^ , 6 9
Reproduced with permission of the copyright owner. Further reproduction prohibited without permission.

63
Polymer— OOCO OOCO Polymer
X
h 2o
?
Polymer— OOCO Polymer
Figure 5 .7. Reaction of Copolymer with Water.
5.5 Conclusion
The Tg's of the copolymers range from 110 - 210 °C. The Tg of the
BisS/TMCBD copolymer is low enough that its use as an electrical insulator or
optical coating is limited. By comparing the Tg's and beta transitions, the
copolymers have a large range of temperature in which they can be used.
Finally, end capping the copolymers with chlorotrimethylsilane increases the
thermal stability of the copolymers.
Reproduced with permission of the copyright owner. Further reproduction prohibited without permission.

Chapter 6: Conclusion
64
Reproduced with permission of the copyright owner. Further reproduction prohibited without permission.
65
6.1 Research
The goal of this project was to synthesize and evaluate copoly
carbonates that offer an advantage over poly(bisphenol A)carbonate as an
electrical insulator or optical coating. This was accomplished by a solution
polymerization between 2,2,4,4-tetramethyM ,3-cyclobutanedichloroformate
and a bis-phenol in the presence of a base. The copolymers were isolated
from the reactions by precipitation in methanol and are white solids at room
temperature. The yields of the reaction were not quantitative, but part of the
product is lost in the isolation step. The concentration of cis and trans 2,2,4,4-
tetramethyl-1,3-cyclobutane units in the copolymers varied for each synthesis
but was dependent on the concentration of cis and trans 2,2,4,4-tetramethyl-
1.3-cyclobutanedichloroformate in the starting monomer. During the
copolymerization reaction, there is an elimination reaction occurring that leads
to replacement of 8 % of the carbonate linkages with ether linkages.
All of the copolymers except BisAD/TMCBD were synthesized to
molecular weights high enough to form dimensional stable films at room
temperature. The BisAD/TMCBD is of low molecular weight. Thin films were
cast from chloroform solution and thick films are formed by either pressing from
a hot press or casting from chloroform solution. The films are optically clear to
the naked eye and show no birefringence under a polarized microscope.
However, the cast thick films have a slight cloudiness to them.
The refractive indices of the copolymers are less than poly(bisphenol
A)carbonate. This indicates that the polarizability of the copolymers is less
than the polarizability of poly(bisphenol A)carbonate thus showing improved
insulating and optical properties. Because of their lower refractive indices, the
1.1.1.3.3.3-hexaflouro-2-propane and aliphatic substituted copolymer offer the
best insulating materials; whereas, the aromatic substituted copolymers offer
Reproduced with permission of the copyright owner. Further reproduction prohibited without permission.
66
the best optical materials due to the polarizable groups perpendicular to the
polymer chain.
The glass transition temperatures of the copolymers are greater than the
desired 100 °C. The glass transition of the BisS/TMCBD copolymers is close
to 100 °C and its use as an insulator or coating is limited. The beta transition
temperatures of the copolymers are low enough that when compared to the
glass transition temperatures the copolymers can be used in a wide range of
temperatures.
The copolymers degrade by chain unzipping when heated above the
glass transition temperature. This degradation was noticed by foaming of the
sample. The thermal stability is improved by the placing of end groups on the
polymer chain; however, the copolymers with end groups are not completely
stable. Also, thermal stability of a copolymer with end groups was lessened
when the copolymers are precipitated from a chloroform solution or when
repeatedly heated above its glass transition temperature.
6.2 Future Work
The next step in this project is to find a new method of synthesizing the
copolymers. The new method should either stop the cis to trans ratio variation
or offer better control over the cis to trans ratio. Also, the new method should
yield copolymers of higher molecular weights in order to end the dependency of
properties on molecular weight.
After a new reaction is found, a decision needs to made as to whether
the copolymers are to be used as an electrical insulator or an optical coating.
If the copolymers are to be used as an electrical insulator, the copolymers
derived from BisA, BisF, BisC, BisCB and BisN are better suited. The dielectric
constant and failure of the five copolymers needs to be measured. Also, the
melt viscosity and stability in the melt should be measured. The ability of the
Reproduced with permission of the copyright owner. Further reproduction prohibited without permission.

67
copolymer to bind to various metals and mix with various additives needs to be
measured.
If the copolymers are to be used as an optical coating, the copolymers
derived from the BisA, BisAP, BisTP and BisHPF represent the best choices.
The birefringence, melt viscosity and stability need to be measured to
determine which of the four copolymers are best suited as an optical substrate.
A way to remove the tendency to become marred by fingerprints needs to be
explored. Finally, the ability of the copolymer to bind to a surface needs to be
measured.
There are several interesting experiments that could be a continuation of
this project. It would be interesting to study the elimination reaction that occurs
during the copolymerization. If the reaction can be accelerated, then aromatic
aliphatic polyethers can be formed from polycarbonates. It would be interesting
to study how the properties of the copolymers vary with different TMCBD
compositions and broader cis to trans ratios. These properties include: Tg,
beta transition, refractive index, and thermal stability. Also, the use of different
end groups on the copolymers may lead to better thermal stability and lower
melt viscosities. Once the birefringence is measured, the monomers can be
copolymerized with different compositions to give materials with lower
polarizabilities or birefringence.
Finally, it would be interesting to explore other aliphatic monomers to
replace the TMCBD unit in the copolymer chains. Hopefully, this would lead to
a copolymer with improved thermal stability and fingerprint resistance. Also,
the new monomer could be copolymerized with TMCBD to give an aliphatic
polycarbonate that has no polarizable aromatic groups.
Reproduced with permission of the copyright owner. Further reproduction prohibited without permission.

References
I. For a review see Freitag, D.; Grigo, U.; Muller, P.; and Nouvertne, W.Polycarbonates in Encyclopedia of Polymer Science and Engineering 2nd edition Kroschwitz, J. ed. John Wiley and Sons, New York, NY 1988.
2. Eihorn, A. Ann. 300,135 1898.
3. Schnell, H. Ind. and Eng. Chem. 51, 2,1571959.
4. Henrichs, P.; Luss, H.; and Scaringe, R. Macromolecules 22, 2731 1989.
5. Robenson, L. and Crisafulli, S. J. Appl. Polym. Sci. 28,29251983.
6. Factor, A. and Orlando, C. J. Polym. Sci. Polym. Chem. 18, 5791980.
7. Bornmann, G. and Loeser, A. Arzneimittel-Forschg. 9, 9 1959.
8. Christopher, W. and Fox, D. Polycarbonates Reinhold, New York, NY 1962.
9. Jones, R. and Kuder, J. Optical Data Storage in Encyclopedia of Polymer Science and Engineering suppl. 2nd edition Kroschwitz, J. ed. John Wiley and Sons, New York, NY 1988.
10. Schnell, H. Angew. Chem. 68, 6331956.
I I . Erman, B. and Queslel, J. Birefringence in Encyclopedia of Polymer Science and Engineering 2nd edition Kroschwitz, J. ed. John Wiley and Sons, New York, NY 1988.
12. Olson, D. and Webb, K. Macromolecules 23,16, 3762 1990.
13. Van Krevelen, D.W. Properties o f Polymers Elseyier Science, New York 1990.
14. Baumann, G. and Steingiser, S. J. Polym. Sci. Part A 1, 3395 1963.
15. Saito, H. and Inoue, T. J. Polym. Sci. Polym. Phys. 25,16291987.
16. Prest, W. US Patent 4,373,0651983.
17. Hahn, B. and Wendorff, J. Polymer26,16191985.
68
Reproduced with permission of the copyright owner. Further reproduction prohibited without permission.

69
18. The refractive index is proportional to the mean polarizability of the polymer. It is assumed that the introduction of an aliphatic group into the chain affects the polarizability greater in the chain direction.
19. Daly, W. and Hahn, B. Polym. Preprints 30, 337 1989.
20. Werumeus Buning, G. H.; Wimberger-Friedl, J. R.; Janeschitz-Kriegl, H.; and Ford, T. M. paper presented at the Rol-Duk Polymer Meeting II, Limburg, Netherlands, 1987 as referenced in Jones, R. and Kuder, J. Optical Data Storage in Encyclopedia of Polymer Science and Engineering suppl. 2nd edition Kroschwitz, J. ed. John Wiley and Sons, New York, NY 1988.
21. Searles, S.; Hummel, S.; and Throckmorten, P. J. Am. Chem. Soc. 82, 2928 1960.
22. Boileau, S.; Mechin, F.; Martinho, J.; and Winnik, M. Macromolecules 22, 2151989.
23. D'Onofrio, A. British patent 1,011,283 to Union Carbide 1961.
24. D'Onofrio, A. United States patent 3,375,210 to Union Carbide 1968.
25. Caldwell, J. and Jackson, W. United States patent 3,096,359 to Eastman Kodak Company 1963.
26. Merriam, C.; Snedeker, R.; and Stine, G. United States patent 3,546,332 to Union Carbide 1970.
27. Niegisch, W. United States patent 3,546,331 to Union Carbide 1970.
28. a) Niegisch, W. United States patent 3,674,623 to Union Carbide 1972.b) Niegisch, W. United States patent 3,541,200 to Union Carbide 1970.
29. Shirrell, C. and Williams, D. Acta Crystallogr. B32,1867 1976.
30. Marqulis, T. Chem. Comm. 5, 2151969.
31. Gawlak, M.; Palmer, J.; Rose, J.; Sandiford, D.; andTurner-Jones, A. Chem. and Ind. 11481962.
32. Matzner, M.; Kurkjy, R.; and Cotter, R. J. Appl. Polym. Sci. 9, 32951965.
33. Saegusa, Y.; Kurikr, M.; Kawaj, A.; and Nakamura, S. J. Polym. Sci. Polym. Chem. 28, 3327 1990.
Reproduced with permission of the copyright owner. Further reproduction prohibited without permission.

70
34. Mantaudo, G.; Puglisi, C.; and Samperi, F. Polym. Bull. 21, 4831989.
35. Evans, T.; Berman, C.; Carpenter, J.; Choi, D.; and Williams, A. Polym. Preprints 30,2, 5731989.
36. Takata, T. and Endo, T. Macromolecules 21, 9001988.
37. Morgan, P. Macromolecules 3, 5361970.
38. Barclay, R. and Sulzberg, T. High Polymers vol. 27. Condensation Monomers ed. Stille, J. K. and Campbell, T. W. John Wiley and Sons, New York NY 1972.
39. Schnell, H. Chemistry and Physics o f Polycarbonates John Wiley and Sons, New York, NY 1964.
40. Maruyama, Y.; Kakimoto, M.; and Imai, Y. J. Polym. Sci. Polym. Cherri. 24, 35551986.
41. Jackson, W. and Caldwell, J. Ind. Eng. Chem. Prod. Res. Develop. 2,2461963.
42. Baekland, L. and Bender, H. Ind. Eng. Chem. 17,2251925.
43. Riffle, J.; Shchori, E.; Banthia, A.; Freelin, R.; Ward, T.; and McGrath, J. J. Polym. Sci. Polym. Chem. 20,22891982.
44. Anderson, K.; Mathias, L.; and McGrath, J. J. Polym. Sci. Polym. Lett. 21, 445 1983.
45. The Infrared Spectra Atlas o f Monomers and Polymers Sadtler Research Laboratories Philadelphia, PA 1980.
46. Szymanski, H. A. and Erickson, R. E. Infrared Band Handbook vol. 1&2 IF I Plenum Data Corporation New, NY 1970.
47. Pretsch, E.; Clerc, T.; Seibl, J.; and Simon, W. Spectral Data for Structure Determination of Organic Compounds Springer-Verlag Berlin, Germany 1983.
48. Silverstein, R. M.; Bassler, G. C.; and Morrill, T. C. Spectrometric Identification of Organic Compounds John Wiley and Sons New York, NY 1981.
Reproduced with permission of the copyright owner. Further reproduction prohibited without permission.

49. Sadtler Standard NMR Spectra Sadtler Research Laboratories,Inc. number: 291,1594, 8058, 9042, 22863,27642, 27818, and 39712.
50. Sadtler Standard NMR Spectra Sadtler Research Laboratories,Inc. number: 341,1241, 3782, 4046, 4069, 5885, 8537, 8658, 8877, and 12441.
51. Morgan, P. Condensation Polymers by Interfacial and Solution Methods John Wiley and Sons New York, NY 1965.
52. Personal Communications with Dr. William H. Daly Louisiana State University 1992.
53. Hasek, R.; Clark, R.; and Chaudet, J. J. Org. Chem. 26, 31301961.
54. Lindsey, A. and Jeskey, H. Chem. Revs. 57, 5831957.
55. Gupta, A.; Liang, R.; Moacanin, J.; Goldbeck, R.; and Kliger, D. Macromolecules 13, 262 1980.
56. Bellus, D.; Hrdlovic, P.; and Manasek, Z. J. Polym. Sci. Polym. Lett. 4,1 1966.
57. Hill, J. J. Amer. Chem. Soc. 57,1131 1935.
58. Sweeny, W. J. Appl. Polym. Sci. v S151961.
59. Talyor, R.; Parbhloo, B.; and Fillmore, D. Nuclear Magnetic Resonance Spectroscopy in The Analytical Chemistry of Silicones Smith, A. ed. John Wiley and Sons, New York, NY 1991.
60. Fiory, P. Principles of Polymer Chemistry Cornell University Press, Ithaca, NY 1953.
61. Albert, W. and Malon, M. J. Macromol. Sci. Chem. 2, 347 1972.
62. Connolly, J. and Jones, A. Macromolecules 18, 9061985.
63. Kricheldorf, H. and Lubbers, D. Makromol. Chem. Rapid Commun. 10, 3831989.
64. Garfield, J. J. Polym. Sci. Polym. Symp. 30, 561 1970.
65. Fox, T. Bull. Am. Phys. Soc. 1,123 1956.
Reproduced with permission of the copyright owner. Further reproduction prohibited without permission.

7 2
65. Fox, T. Bull. Am. Phys. Soc. 1,123 1956.
6 6 . Allcock, H. and Lampe, F. Contemporary Polymer Chemistry Prentice Hall, Englewood Cliffs, NJ 1981.
67. Wilcox, C. and Nealy, D. J. Org. Chem. 28, 34501963.
6 8 . Pryde, C. and Heilman, M. J. ofAppl. Polym. Sci. 25, 2573 1980.
69. Robeson, L. and Crisafulli, S. J. ofAppl. Polym. Sci. 28, 2925 1983.
Reproduced with permission of the copyright owner. Further reproduction prohibited without permission.

Appendix 1: Spectral Data of BisCB
73
Reproduced with permission of the copyright owner. Further reproduction prohibited without permission.

74
a) Crystal Structure
b) Mass Spectra Data
c) 1 NMR Shift Identification
d) Atom Coordinates and Equivalent Isotropic Thermal Parameters
e) Bond Distancesof BisCB in Angstroms
f) Table of Bond Angles in Degrees
g) Crystal Data
a) Crystal Structure.
Reproduced with permission of the copyright owner. Further reproduction prohibited without permission.
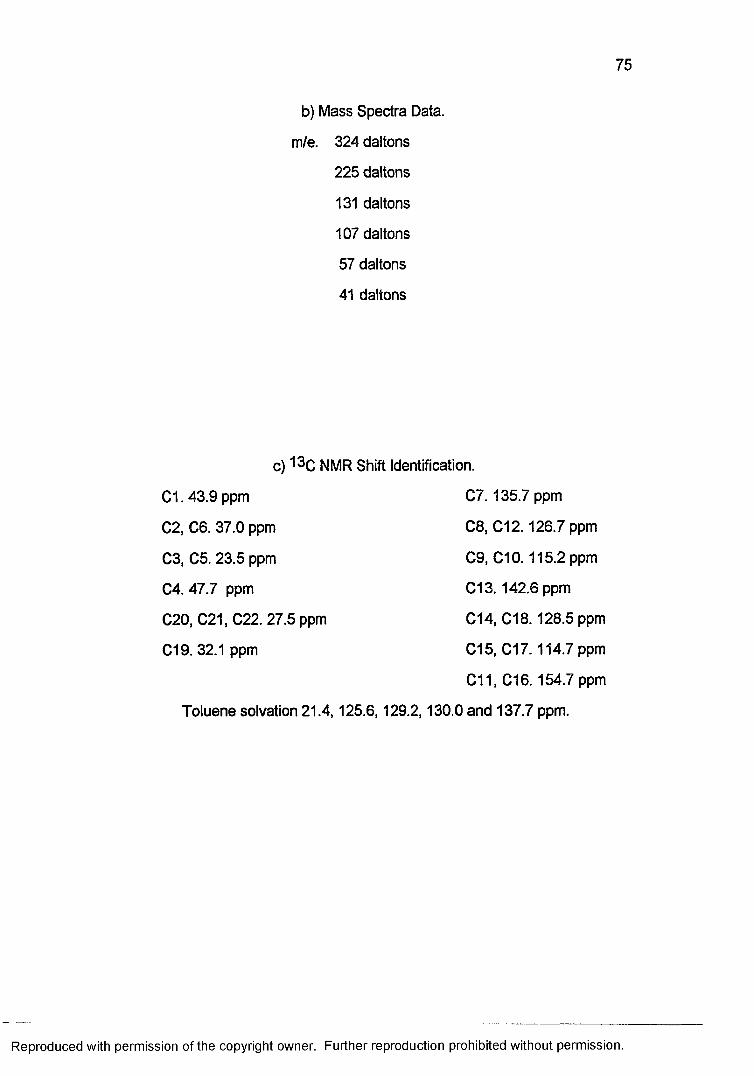
75
b) Mass Spectra Data,
m/e. 324 daltons
225 daltons
131 daltons
107 daltons
57 daltons
41 daltons
c) 13c NMR Shift Identification.
C11, C16.154.7 ppm
Toluene solvation 21.4,125.6,129.2,130.0 and 137.7 ppm.
C1.43.9 ppm
C2, C6 . 37.0 ppm
C3, C5. 23.5 ppm
C4. 47.7 ppm
C20, C21, C22. 27.5 ppm
C19. 32.1 ppm
C 7.135.7 ppm
C8 , C12.126.7 ppm
C9, C10.115.2 ppm
C13. 142.6 ppm
C14, C18.128.5 ppm
C15, C17.114.7 ppm
Reproduced with permission of the copyright owner. Further reproduction prohibited without permission.

76
d) Atom Coordinates and Equivalent Isotropic Thermal Parameters.3
Atom X Y Z BeqA3
01 0.04658 (7) 0.7025 (1) 0.46121 (6) 6.43 (3)
02 0.40451 (7) 0.1651 (1) 0.49684 (7) 6.16 (3)
C1 0.25550 (7) 0.5025 (1) 0.64713 (7) 3.57 (3)C2 0.30207 (8) 0.6098 (1) 0.67285 (7) 3.94 (3)C3 0.35858 (9) 0.5776 (1) 0.72700 (7) 4.21 (3)C4 0.32573 (8) 0.5175(1) 0.78421 (7) 4.03 (3)
C5 0.27939 (9) 0.4110(2) 0.75940 (7) 4.35 (3)C6 0.22277 (8) 0.4479 (2) 0.70656 (7) 4.17(3)
C7 0.19686 (8) 0.5510 (1) 0.59795 (7) 3.69 (3)
C8 0.21580(8) 0.5958 (2) 0.53851 (7) 4.23 (3)
C9 0.16576(9) 0.6452 (2) 0.49371 (8) 4.68 (3)
C10 0.09368 (9) 0.6506 (2) 0.50667 (8) 4.68 (3)
C11 0.07325 (8) 0.6047 (2) 0.56378 (8) 4.92 (4)
C12 0.12401 (8) 0.5560 (2) 0.60885 (8) 4.52 (3)
C13 0.29961 (7) 0.4086 (1) 0.61210 (7) 3.47 (3)
C14 0.36460 (8) 0.4351 (1) 0.58668 (7) 4.04 (3)
C15 0.39915(8) 0.3533 (2) 0.54917 (8) 4.44 (3)
C16 0.36911 (8) 0.2418(2) 0.53632 (8) 4.37 (3)
C17 0.30551 (9) 0.2112(2) 0.56185 (9) 4.89 (4)
C18 0.27150(8) 0.2941 (2) 0.59925 (9) 4.43 (3)
C19 0.38141 (9) 0.4849 (2) 0.84140 (7) 4.58 (3)
C20 0.3423 (1) 0.4423 (2) 0.89895 (9) 6.55 (5)
C21 0.4319 (1) 0.3833 (2) 0.8231 (1) 6.33 (5)
C1T 0.0308 (2) 0.5099 (4) 0.2778 (2) 6.6 (1)*
C22 0.4270 (1) 0.5951 (2) 0.8616 (1) 7.04 (5)C2T 0 0.3989 (3) 1/4 7.71 (7)C3T 0.0504 (3) 0.3894 (5) 0.2957 (2) 8.7(1)*C4T 0.0809 (2) 0.5036 (3) 0.3299 (1) 9.92 (9)C5T 0.0508 (3) 0.6040 (5) 0.3068 (2) 8.7(1)*C6T 0
a) A =0.6134 (3) 1/4
angstroms. * population = 1/28.12 (9)
Reproduced with permission of the copyright owner. Further reproduction prohibited without permission.

77
e) Bond Distances of BisCB in Angstroms.3
Atom 1 Atom 2 Distance Atom 1 Atom 2 Distance
01 C10 1.367(2) C13 C18 1.390(2)02 C16 1.381 (2) C14 C15 1.383(2)C1 C2 1.542(2) C15 C16 1.372(2)C1 C6 1.540(2) C16 C17 1.373(2)C1 C7 1.536(2) C17 C18 1.385(2)
C1 C13 1.539(2) C19 C20 1.520(3)C2 C3 1.525(2) C19 C21 1.531 (3)C3 C4 1.528(2) C19 C22 1.526(3)
C4 C5 1.528(2) C11 C12 1.389(2)C4 C19 1.560(2) C1T C2T 1.485(5)
C5 C6 1.520(2) C1T C3T 1.425(7)C7 C8 1.400(2) C1T C4T 1.377(5)
C7 C12 1.390(2) C1T C6T 1.388(5)C8 C9 1.380(2) C2T C3T 1.289(5)
C9 C10 1.387(2) C3T C4T 1.538(6)
C10 C11 1.370(2) C4T C5T 1.319(6)
C13 C14 1.385(2) C5T C6T 1.460(5)a) Solvent molecule is disordered about 2 fold axis.
Reproduced with permission of the copyright owner. Further reproduction prohibited without permission.

78
f) Table of Bond Angles in Degrees.
tom 1 Atom 2 Atom 3 Angle Atom 1 Atom 2 Atom 3 Angle
C2 C1 06 105.6 (1) 01 013 014 123.2 (1)C2 C1 07 108.3 (1) 01 013 018 120.1 (1)C2 C1 013 112.3 (1) 014 013 018 116.5 (1)C6 C1 07 111.6 (1) 013 014 015 122.0 (1)C6 C1 013 111.7 (1) 014 015 016 120.0 (1)
C7 C1 013 107.3 (1) 02 016 015 117.7 (1)
C1 C2 03 114.5 (1) 02 016 017 122.6 (1)
C2 C3 04 112.6(1) 015 016 017 119.7(2)
C3 C4 05 108.7 (1) 016 017 018 119.6(2)C3 C4 019 114.4 (1) 013 018 017 122.1 (1)C5 C4 019 113.8 (1) 04 019 020 110.1 (1)
C4 C5 06 112.3(1) 04 019 021 111.4 (1)
C1 C6 05 113.1 (1) 04 019 022 110.4(1)
C1 C7 08 120.0 (1) 020 019 021 107.8(2)C1 07 012 123.9 (1) 020 019 022 108.6(2)
C8 C7 012 116.1(1) 021 019 022 108.5 (2)
C7 C8 09 122.4 (1)
C8 C9 010 119.9(2) C3T C1T C5T 126.5(4)01 C10 09 117.5(2) C4T C1T C6T 127.2(4)01 C10 011 123.4(2) C4T C5T C6T 125.9 (4)
C9 C10 011 119.0(1) C2T C1T C6T 113.1 (3)C10 011 012 120.7 (1) C2T C3T C4T 119.8(4)C7 012 011 121.8 (1) C3T C4T C5T 113.1 (4)
Reproduced with permission of the copyright owner. Further reproduction prohibited without permission.

g) Crystal Data.
Formula: C22H28°2'1/2C7H8
Formula weight: 370.5 g/moles
Space Group: C2/c
a: 18.582(1) A
b: 11.0694 (7) A
c: 20.790 (1) A
P: 94.195(8)
V: 4264.9 (8) A3
Z: 8
Dc: 1.154 g/cm3
Crystal size: 0.42 x 0.52 x 0.55 mm
Reproduced with permission of the copyright owner. Further reproduction prohibited without permission.
Appendix 2: Spectral Data of BisAD.
80
Reproduced with permission of the copyright owner. Further reproduction prohibited without permission.

81
a) Crystal Structure
b) Mass Spectra Data
c) 13c NMR Shift Identification
d) Atom Coordinates and Equivalent Isotropic Thermal Parameters
e) Bond Distances of BisAD in Angstroms
f) Table of Bond Angles in Degrees
g) Crystal Data
a) Crystal Structure.
C20,C14
C21C13CIS CIS
C12 C22_C16 C18
C17
C25'
as
C5i
CIO
Reproduced with permission of the copyright owner. Further reproduction prohibited without permission.

82
b) Mass Spectra Data,
m/e. 320 daltons
199 daltons
107 daltons
91 daltons
79 daltons
77 daltons
c) NMR Shift Identification.
C1. 38.5 ppm
C2, C6 . 32.1 ppm
C3, C5, C7, C9. 33.1 ppm
C4, C8 . 28.0 ppm
C10. 30.5 ppm
C11, C17.141.5 ppm
C12, C16, C18, C22. 127.3 ppm
C13.C15, C19, C21.115.5 ppm
C14, C20.154.5 ppm
Reproduced with permission of the copyright owner. Further reproduction prohibited without permission.
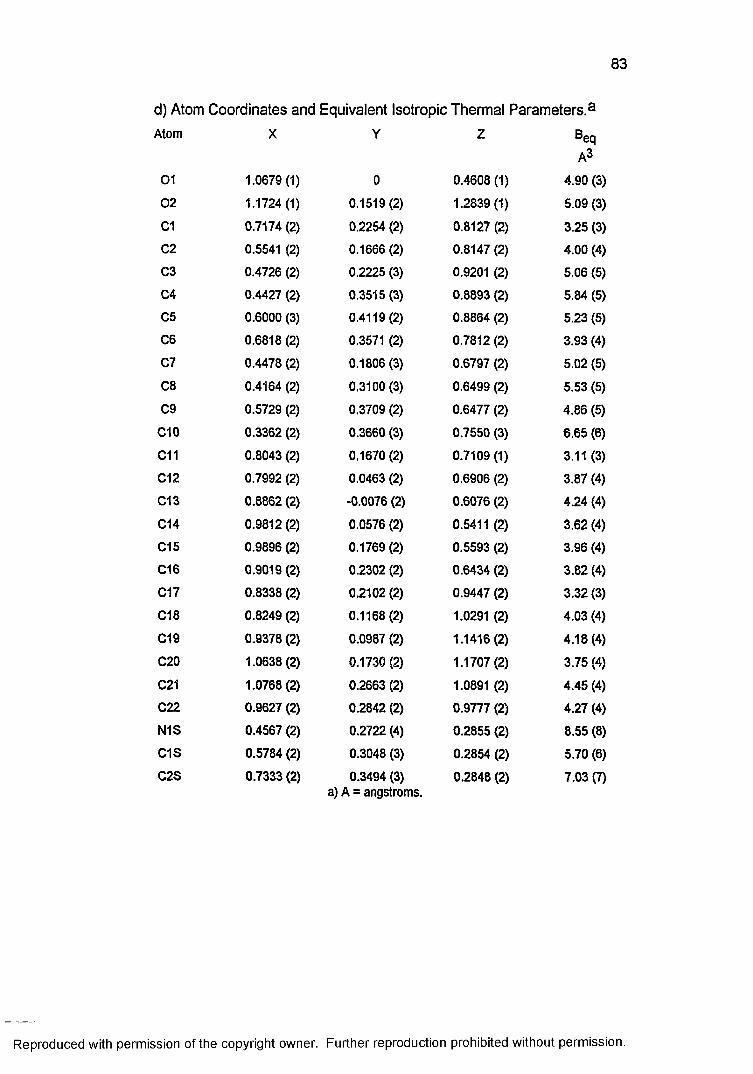
83
d) Atom Coordinates and Equivalent Isotropic Thermal Parameters.3
Atom X Y Z Beq
A301 1.0679 (1) 0 0.4608 (1) 4.90 (3)
02 1.1724(1) 0.1519(2) 1.2839 (1) 5.09 (3)
C1 0.7174 (2) 0.2254 (2) 0.8127 (2) 3.25 (3)C2 0.5541 (2) 0.1666 (2) 0.8147 (2) 4.00 (4)C3 0.4726 (2) 0.2225 (3) 0.9201 (2) 5.06 (5)C4 0.4427 (2) 0.3515(3) 0.8893 (2) 5.84 (5)C5 0.6000 (3) 0.4119(2) 0.8864 (2) 5.23 (5)C6 0.6818 (2) 0.3571 (2) 0.7812 (2) 3.93 (4)
C7 0.4478 (2) 0.1806 (3) 0.6797 (2) 5.02 (5)08 0.4164 (2) 0.3100 (3) 0.6499 (2) 5.53 (5)C9 0.5729 (2) 0.3709 (2) 0.6477 (2) 4.86 (5)
C10 0.3362 (2) 0.3660 (3) 0.7550 (3) 6.65 (6)
C11 0.8043 (2) 0.1670 (2) 0.7109 (1) 3.11 (3)C12 0.7992 (2) 0.0463 (2) 0.6906 (2) 3.87 (4)C13 0.8862 (2) -0.0076 (2) 0.6076 (2) 4.24 (4)
C14 0.9812 (2) 0.0576 (2) 0.5411 (2) 3.62 (4)C15 0.9896 (2) 0.1769 (2) 0.5593 (2) 3.96 (4)
C16 0.9019(2) 0.2302 (2) 0.6434 (2) 3.82 (4)
C17 0.8338 (2) 0.2102 (2) 0.9447 (2) 3.32 (3)
C18 0.8249 (2) 0.1168(2) 1.0291 (2) 4.03 (4)C19 0.9378 (2) 0.0987 (2) 1.1416(2) 4.18 (4)C20 1.0638(2) 0.1730 (2) 1.1707(2) 3.75 (4)
C21 1.0768(2) 0.2663 (2) 1.0891 (2) 4.45 (4)C22 0.9627 (2) 0.2842 (2) 0.9777 (2) 4.27 (4)
N1S 0.4567 (2) 0.2722 (4) 0.2855 (2) 8.55 (8)C1S 0.5784 (2) 0.3048 (3) 0.2854 (2) 5.70 (6)C2S 0.7333 (2) 0.3494 (3) 0.2848 (2) 7.03(7)
a) A = angstroms.
Reproduced with permission of the copyright owner. Further reproduction prohibited without permission.
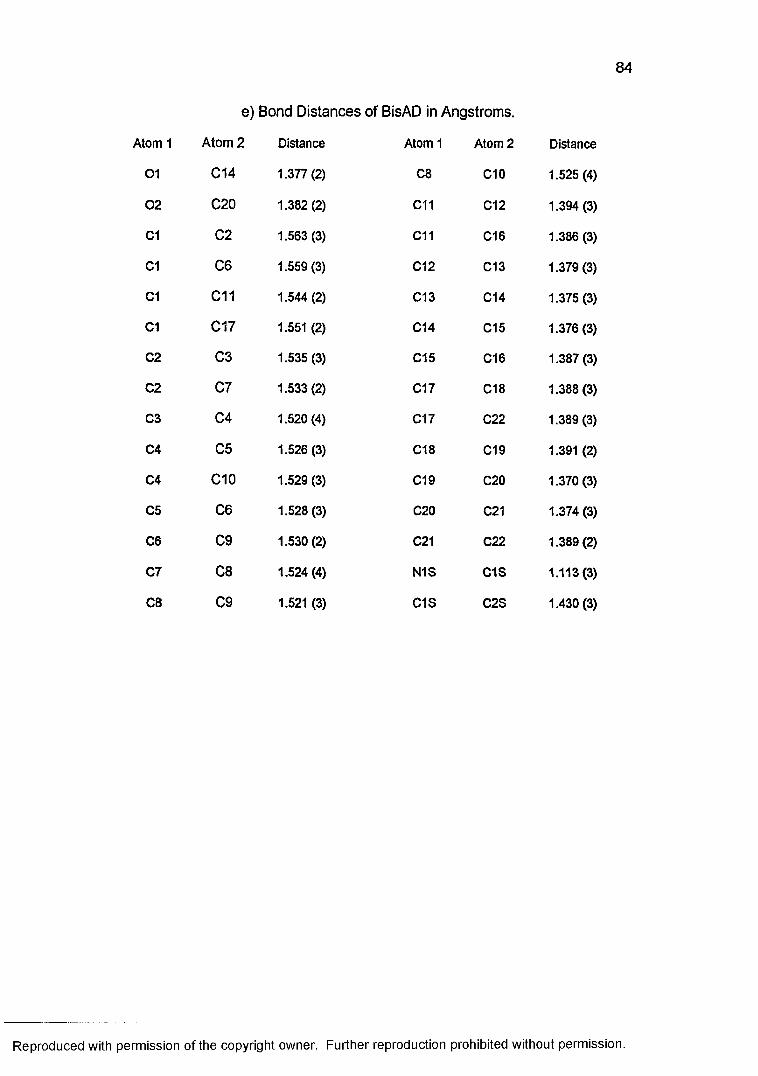
84
e) Bond Distances of BisAD in Angstroms.
Atom 1 Atom 2 Distance
01 C14 1.377(2)
02 C20 1.382(2)
C1 C2 1.563(3)
C1 C6 1.559(3)
C1 C11 1.544(2)
C1 C17 1.551 (2)
C2 C3 1.535(3)
C2 C7 1.533(2)
C3 C4 1.520(4)
C4 C5 1.526(3)
C4 C10 1.529(3)
C5 C6 1.528(3)
CS C9 1.530(2)
C7 C8 1.524(4)
C8 C9 1.521 (3)
Atom 1 Atom 2 Distance
C8 C10 1.525(4)
C11 C12 1.394(3)
C11 C16 1.386(3)
C12 C13 1.379(3)
C13 C14 1.375(3)
C14 C15 1.376(3)
C15 C16 1.387(3)
C17 C18 1.388(3)
C17 C22 1.389(3)
C18 C19 1.391 (2)
C19 C20 1.370(3)
C20 C21 1.374(3)
C21 C22 1.389(2)
N1S C1S 1.113(3)
C1S C2S 1.430(3)
Reproduced with permission of the copyright owner. Further reproduction prohibited without permission.

85
f) Table of Bond Angles in Degrees.
Atom 1 Atom 2 Atom 3 Angle Atom 1 Atom 2 Atom 3 Angle
C2 C1 C6 105.9 (1) C4 C10 C8 108.8 (2 )
C2 C1 C11 1 1 1 .6 (2 ) C1 C11 C12 121.5(2)
C2 C1 C17 1 1 2 . 6 (1 ) C1 C11 C16 1 2 1 .8 (2 )
C6 C1 C11 1 1 2 .1 (1 ) C12 C11 C16 116.5(2)
C6 C1 C17 111.4 (1) C11 C12 C13 121.9(2)
C11 C1 C17 103.4 (1) C12 C13 C14 120.3 (2)
C1 C2 C3 110.9(2) 0 1 C14 C13 118.3(2)
C1 C2 C7 109.8 (2) 0 1 C14 C15 122.3 (2)
C3 C2 C7 108.9 (2) C13 C14 C15 119.4(2)
C2 C3 C4 109.7 (2) C14 C15 C16 119.9(2)
C3 C4 C5 108.9 (2) C11 C16 C15 1 2 2 .1 (2 )
C3 C4 C10 110.3(2) C1 C17 C18 122.5 (2)
C5 C4 C10 109.1 (2) C1 C17 C22 1 2 0 .8 (2 )
C4 C5 C6 1 1 0 .6 (2 ) C18 C17 C22 116.4(1)
C1 C6 C5 1 1 0 .2 (2 ) C17 C18 C19 121.9(2)
C1 C6 C9 110.7(2) C18 C19 C20 1 2 0 .1 (2 )
C5 C6 C9 108.0 (2 ) 0 2 C20 C19 118.0(2)
C2 C7 C8 109.9 (2) 0 2 C20 C21 122.4 (2)
C7 C8 C9 108.7 (2) C19 C20 C21 119.6(2)
C7 C8 C10 110.5(2) C20 C21 C22 119.9(2)
C9 C8 C10 109.4 (2) C17 C22 C21 1 2 2 .1 (2 )
C6 C9 C8 1 1 0 .1 (2 ) N1S C1S C2S 178.6 (4)
Reproduced with permission of the copyright owner. Further reproduction prohibited without permission.

86
g) Crystal Data.
Formula: c 24h 27n o 2
Formula weight: 361.5 g/moles
Space Group: P2.j
a: 8.6131 (5) A
b: 11.4249 (7) A
c: 10.3088 (4) A
P: 100.167(4)
V: 999.1 (2) A3
Z: 2
Dc: 1 .2 0 2 g/cm3
Crystal size: 0 .38x0 .52x0 .
Reproduced with permission of the copyright owner. Further reproduction prohibited without permission.

Appendix 3: Spectral Data of TMCBDCI.
87
Reproduced with permission of the copyright owner. Further reproduction prohibited without permission.

88
a) Structure TMCBDCI
b) 1H NMR Identification
c) 13c NMR Identification
a) Structure of TMCBDCI.
Cl COO OOCC14
b )1H NMR Identification.
1. cis 1.14 and 1.32 ppm
1. trans 1.22 ppm
3. cis 4.55 ppm
3. trans 4.37 ppm
c) 13q nMR Identification.
1. cis 16.4 and 28.0 ppm
1. trans 22.3 ppm
2. cis 40.7 ppm
2. trans 42.1 ppm
3. cis 86.4 ppm
3. trans 87.6 ppm
4.150.3 ppm
Reproduced with permission of the copyright owner. Further reproduction prohibited without permission.

Appendix 4 :13C NMR Chemical Shifts of Substituents.
89
Reproduced with permission of the copyright owner. Further reproduction prohibited without permission.

90
a) Identification of Substituent Carbons
b) 13c NMR Chemical Shifts of Substituents
Reproduced with permission of the copyright owner. Further reproduction prohibited without permission.

91
a) Identification of Substituent Carbons.
ooo lOCi
Y N /CH3 CJH3
B
BisCO/TMCBD BisA/TMCBD
C F f ' c F sB
BisF/TMCBD
D
BisN/TMCBD BisCB/TMCBD
BisHPF/TMCBD
E
F
BisAP/TMCBD
BisC/TMCBD
BisTP/TMCBD
BisADfiMCBD
Reproduced with permission of the copyright owner. Further reproduction prohibited without permission.

9 2
b )13C NMR Chemical Shifts of Substituents in ppm.
Polymer A B C D E F
BisO/TMCBD 194.0
BisA/TMCBD 42.4 30.9
BisF/TMCBD 64a 220
BisN/TMCBD 55.6 43.5 38.2 29.5 24.5 44.9
BisCB/TMCBD 45.4 37.6 22.3 48.1 32.2 27.4
BisC/TMCBD 45.7 37.3 26.2 22.7
BisHPF/TMCBD 64.5 140.0 127.8 126.0 127.9 120.3
BisAP/TMCBD 51.9 30.7 149.2 128.0 128.5 126.2
BisAD/TMCBD 45.5 32.1 33.1
a) multiple!.
27.3 37.8
38.2
143.5
Reproduced with permission of the copyright owner. Further reproduction prohibited without permission.

Appendix 5: Instrumentation.
93
Reproduced with permission of the copyright owner. Further reproduction prohibited without permission.

94
Instrumentation
This section discusses the instruments and methods used to analyze
the copolymers. Infrared spectra were obtained using a Perkin-Elmer 1760x
FTIR spectrometer at ambient temperatures. Films of the copolymers and
KBr pellets of the bis-phenols were used. 1H and 1 NMR spectra were
obtained using a 200 MHz Bruker AC/WP200 NMR spectrometer equipped
with a dual probe. The spectra were taken at ambient temperatures from
solutions with the preference of the deuterium solvent being chloroform,
dimethylsulfoxide, and acetonitrile, respectively. A Hewlett Packard gas
chromatography/mass spectrometer with the gas chromatograph turned off
was used to determine the parent mass of the bis-phenols and to determine
the degradation products of the BisS/TMCBD copolymer.
Gel permeation chromatography analysis were performed on a 1 % wt
copolymer solution in tetrahydrofuran at 25 °C with a waters model M45 GPC
using a refractive index detector and a Phenomix 300 x 7.8 column.
Molecular weights and dispersions were determined from polystyrene
standards. Viscosities were measured from filtered (0.2 urn) chloroform
solutions for three points (1.2, 0.6, and 0.4 g/dl) using a Cannon Ubbelhode
viscometer in a constant temperature bath at 29 °C.
Melting points were obtained from a Fisher-Jones melting apparatus
and are calibrated. The Tg's of the copolymers were measured with a Seiko
DSC 220 differential scanning calorimeter in a nitrogen environment and a
heating rate of 5 °C/minute. Thermal weight loss measurements were
preformed with a Seiko DSC 120 thermal gravimetric analyzer in a nitrogen
environment. The Beta transition temperature were measured with a Seiko
DMS 200 thermal mechanical analyzer at 10 hertz under a nitrogen
environment and a heating rate of 2 °C/minute.
Reproduced with permission of the copyright owner. Further reproduction prohibited without permission.
95
Minimal conformations were found on a Sybyl (version 5.22) molecular
graphics/mechanics program on a local area vax cluster system. X-ray data
were collected on an ENRAF-NONIUS CAD4 diffractometer. Structure
solution and refinement were carried out using MULTAN and M01EN
programs.3’b Refractive indices of the copolymers were measured by casting
a film of the sample from chloroform on the base of a Bausch and Lomb Abbe'
refractometer. The films was allowed to dry for 24 hours at ambient
temperatures before the refractive index was measured.
a) Main, P.; Hull, S.; Lessinger, L.; Germain, G.; Dedereg, J. and Woolfson,
M. MULTAN. A System of Computer Programs for The Automatic Solution
of Crystal Structures from X-ray Diffraction Data. University of York,
England and Louvain, Belgium. 1978
b) Nonius, E. M01EN An Interactive Structure Solution Procedure Deft, The
Netherlands 1990.
Reproduced with permission of the copyright owner. Further reproduction prohibited without permission.

Vita
Carey Cecil Geiger was born in Pensacola, Florida on May 12,1961.
He attended Arlington Elementary School and Colmer Junior High School
before graduating from Pascagoula High School in May 1979. He received
his B.S. degree in polymer science from the University of Southern
Mississippi in Hattiesburg, Mississippi in May 1987. Currently, he is a
candidate for the degree of Doctor of Philosophy with a major in polymer
chemistry and a minor in analytical chemistry.
96
Reproduced with permission of the copyright owner. Further reproduction prohibited without permission.

DOCTORAL EXAMINATION AND DISSERTATION REPORT
C a n d i d a t e : Carey Cecil Geiger
M a j o r F i e l d : c h e m is t r y
T i t l e o f D i s s e r t a t i o n : Synthesis and Characterization of CopolycarbonatesDerived from 2,2,4,4-Tetramethyl 1-1,3-Cyclobutanediol
A p p r o v e d :
' Z jM a jo r P r o f e s s o r a n d C h a irm a n
D e a n o f t h e G r a d a t e S c h o o l
EXAMJNJJJCJ COMMITTEE
D a t e o f E x a m in a t io n :
March 18, 1993
Reproduced with permission of the copyright owner. Further reproduction prohibited without permission.