SYNTHESIS AND CHARACTERIZATION OF CERAMIC COMPOSITES BY … · SYNTHESIS AND CHARACTERIZATION OF...
66
SYNTHESIS AND CHARACTERIZATION OF CERAMIC COMPOSITES BY Amit K. Shrestha A Research Paper Submitted in Partial Fulfillment of the Requirements for the Master of Science Degree In Management Technology Approved: 3 Semester Credits I Dr. Rajiv Asthma Research Advisor The Graduate School University of Wisconsin-Stout May, 2006
Transcript of SYNTHESIS AND CHARACTERIZATION OF CERAMIC COMPOSITES BY … · SYNTHESIS AND CHARACTERIZATION OF...

SYNTHESIS AND CHARACTERIZATION OF
CERAMIC COMPOSITES
BY
Amit K. Shrestha
A Research Paper
Submitted in Partial Fulfillment of the
Requirements for the
Master of Science Degree
In
Management Technology
Approved: 3 Semester Credits
I Dr. Rajiv Asthma
Research Advisor
The Graduate School
University of Wisconsin-Stout
May, 2006

The Graduate School
University of Wisconsin-Stout
Menomonie, WI 5475 1
ABSTRACT
Shrestha Amit K
(Writer) (Last Name) (First IVame) (Middle Initial)
Synthesis and Characterization of Ceramic Composites
(Title)
Management Technology Dr. Rajiv Asthma May, 2006 56
(Graduate Program) (Research Advisor) (MontWYear) ( # of Pages)
American Psychological Association, 5th edition
(Name of Style Manual Used in This Study)
Due to inherent brittleness, ceramic materials have limited use in
industrial applications, especially in structural components at high temperatures
where they can outperform other material classes. By adding a small amount of a
metal, ceramics can be imparted some toughness at little expense to their other
useful engineering properties. Aluminum oxide is the most widely used and
characterized ceramic material. In this research, aluminum oxide was used as the
ceramic matrix material and a two-step powder metallurgy approach involving
powder compaction and sintering approach was implemented to synthesize the

aluminum oxide-bronze composites. The sintered composites were characterized
for density, porosity, hardness, and fracture strength as a function of the material
composition and sintering parameters.

ACKNOWLEDGEMENTS
I would like to acknowledge my family and friends for their constant support in
the pursuit of all my goals. A sincere appreciation is extended to the Department of
Engineering and Technology, University of Wisconsin-Stout. A special thanks to my
research advisor Dr. Rajiv Asthma who took time to meet with me, guided and supported
me in every possible way throughout this research work. Words of gratitude will not be
enough for him.
There are many who helped me from behind the scenes - my sincere thanks to Dr.
Tom Lacksonen, Dr. John Dzissah and Dr. Mehar Arora. Here, I would like to thank
everyone who supported me in completing this research work.

TABLE OF CONTENTS
..................................................................................................... Page
. . ABSTRACT ....................................................................................... 11
LIST OF TABLES ................................................................................ vi
LIST OF FIGURES ............................................................................... x
CHAPTER I: INTRODUCTION ............................................................... 1
Problem Statement ..................................................................... 1
An Overview of the Study ............................................................... 2
.................................................................... Purpose of the study 4
Research approach ..................................................................... 4
Signzficance of the Study ................................................................ 5
CHAPTER 11: LITERATURE REVIEW ...................................................... 6
CHAPTER 111: METHODOLOGY ............................................................. 9
Material selection and description .................................................... 9
Research Methodology .................................................................. 9
Instrumentation .......................................................................... 10
Analysis ..................................................................................... 11
CHAPTER IV: RESULTS AND DISCUSSION ............................................. 12
Density andporosity ..................................................................... 12
MOR and cutting rate .................................................................... 14
Limitations of the study .................................................................. 16
Suggestions for future work ................. ........................................... 16
REFERENCES ....................................................................................... 53

LIST OF TABLES
Table 1A: Sintered Density and % Porosity of A1203 - Bronze Composite
..................................... (0% Bronze; Sintering Temperature =1300°C). .18
Table 2A: Sintered Density and % Porosity of A1203 - Bronze Composite
..................................... (0% Bronze; Sintering Temperature = 1400°C). . I9
Table 3A: Sintered Density and % Porosity of A1203 - Bronze Composite
(0% Bronze; Sintering Temperature = 1500°C) ..................................... ..20
Table 4A: Sintered Density and % Porosity of A1203 - Bronze Composite
(5% Bronze; Sintering Temperature = 1300°C) ..................................... ..2 1
Table 5A: Sintered Density and % Porosity of A1203 - Bronze Composite
(5% Bronze; Sintering Temperature = 1400°C) ..................................... ..22
Table 6A: Sintered Density and % Porosity of A1203 - Bronze Composite
(5% Bronze; Sintering Temperature = 1500°C) ...................................... .23
Table 7A: Sintered Density and % Porosity of A1203 - Bronze Composite
(1 0% Bronze; Sintering Temperature = 1300°C) .................................... .24
Table 8A: Sintered Density and % Porosity of A1203 - Bronze Composite
(1 0% Bronze; Sintering Temperature = 1400°C) .................................... .25
Table 9A: Sintered Density and % Porosity of A1203 - Bronze Composite
(1 0% Bronze; Sintering Temperature = 1500°C) .................................... .26
Table 10A: Sintered Density and % Porosity of A1203 - Bronze Composite
(20% Bronze; Sintering Temperature = 1300°C) .................................... .27

vii
Table 11A: Sintered Density and % Porosity of A1203 - Bronze Composite
................................... (20% Bronze; Sintering Temperature = 1400°C) .28
Table 12A: Sintered Density and % Porosity of A1203 - Bronze Composite
................................... (20% Bronze; Sintering Temperature = 1500°C) .29
Table 1B: Modulus of Rupture (MOR) and Cutting Rate of A1203 - Bronze
....................... Composite (0% Bronze; Sintering Temperature = 1300°C). .30
Table 2B: Modulus of Rupture (MOR) and Cutting Rate of A1203 - Bronze
........................ Composite (0% Bronze; Sintering Temperature = 1400°C) .3 1
Table 3B: Modulus of Rupture (MOR) and Cutting Rate of A1203 - Bronze
........................ Composite (0% Bronze; Sintering Temperature = 1500°C) .32
Table 4B: Modulus of Rupture (MOR) and Cutting Rate of A1203 - Bronze
............... ....... Composite (5% Bronze; Sintering Temperature = 1300°C) .; .33
Table 5B: Modulus of Rupture (MOR) and Cutting Rate of A1203 - Bronze
........................ Composite (5% Bronze; Sintering Temperature = 1400°C) .34
Table 6B: Modulus of Rupture (MOR) and Cutting Rate of A1203 - Bronze
Composite (5% Bronze; Sintering Temperature = 1500°C) ........................ .35
Table 7B: Modulus of Rupture (MOR) and Cutting Rate of A1203 - Bronze
Composite (1 0% Bronze; Sintering Temperature = 1300°C) ...................... ..36
Table 8B: Modulus of Rupture (MOR) and Cutting Rate of A1203 - Bronze
Composite (1 0% Bronze; Sintering Temperature = 1400°C) ...................... ..3 7
Table 9B: Modulus of Rupture (MOR) and Cutting Rate of A1203 - Bronze
Composite (1 0% Bronze; Sintering Temperature = 1500°C) ...................... ..38

Table 10B: Modulus of Rupture (MOR) and Cutting Rate of A1203 - Bronze
........................ Composite (20% Bronze; Sintering Temperature = 1300°C) 39
Table 1 1B: Modulus of Rupture (MOR) and Cutting Rate of A1203 - Bronze
........................ Composite (20% Bronze; Sintering Temperature = 1400°C) 40
Table 12B: Modulus of Rupture (MOR) and Cutting Rate of A1203 - Bronze
........................ Composite (20% Bronze; Sintering Temperature = 1500°C) 41
............. Table 13: Rule-of-Mixture (ROM) Density of A1203 - Bronze Composites.. .42
Table 14: Sintered Density and %Bronze of - Bronze Composite
.......................... (0.5hr, 2.0hr and 4.0hr; Sintering Temperature = 1300°C). 43
Table 15: Sintered Density and %Bronze of A1203 - Bronze Composite
(0.5hr, 2.0hr and 4.0hr; Sintering Temperature = 1400°C) ........................ ..43
Table 16: Sintered Density and %Bronze of A1203 - Bronze Composite
(0.5hr, 2.0hr and 4.0hr; Sintering Temperature = 1500°C) ........................ ..44
Table 17: Sintering Temperature and Sintered Density of A1203 - Bronze
Composite (0%, 5%, 10% and 20% Bronze; Sintering Time = 0.5hr). ........... ..44
Table 18: Sintering Temperature and Sintered Density of A1203 - Bronze
Composite (0%, 5%, 10% and 20% Bronze; Sintering Time = 2hr). ............. ..45
Table 19: Sintering Temperature and Sintered Density of A1203 - Bronze
Composite (0%, 5%, 10% and 20% Bronze; Sintering Time = 4hr). ............. ..45
Table 20: Sintering Time and Sintered Density of A1203 - Bronze Composite
(1300°C, 1400°C and 1500°C; Bronze = 0%). ........................................... 46
Table 2 1 : Sintering Time and Sintered Density of A1203 - Bronze Composite
(1 300°C, 1400°C and 1500°C; Bronze = 5%). ......................................... 46

Table 22: Sintering Time and Sintered Density of A1203 - Bronze Composite
...................................... (1 300°C, 1400°C and 1500°C; Bronze = 10%). .47
Table 23: Sintering Time and Sintered Density of A1203 - Bronze Composite
...................................... (1 300°C, 1400°C and 1500°C; Bronze = 20%). .47
Table 24: Sintered Density, Porosity, MOR and Cutting Rate of A1203 - Bronze
Composite with 0%, 5%, 10% and 20% Bronze under Sintering Temperatures
......................................................... 1 300°C, 1400°C and 1500°C.. ..48

LIST OF FIGURES
Figure 1 : % Porosity and MOR.. ............................................................ ..SO
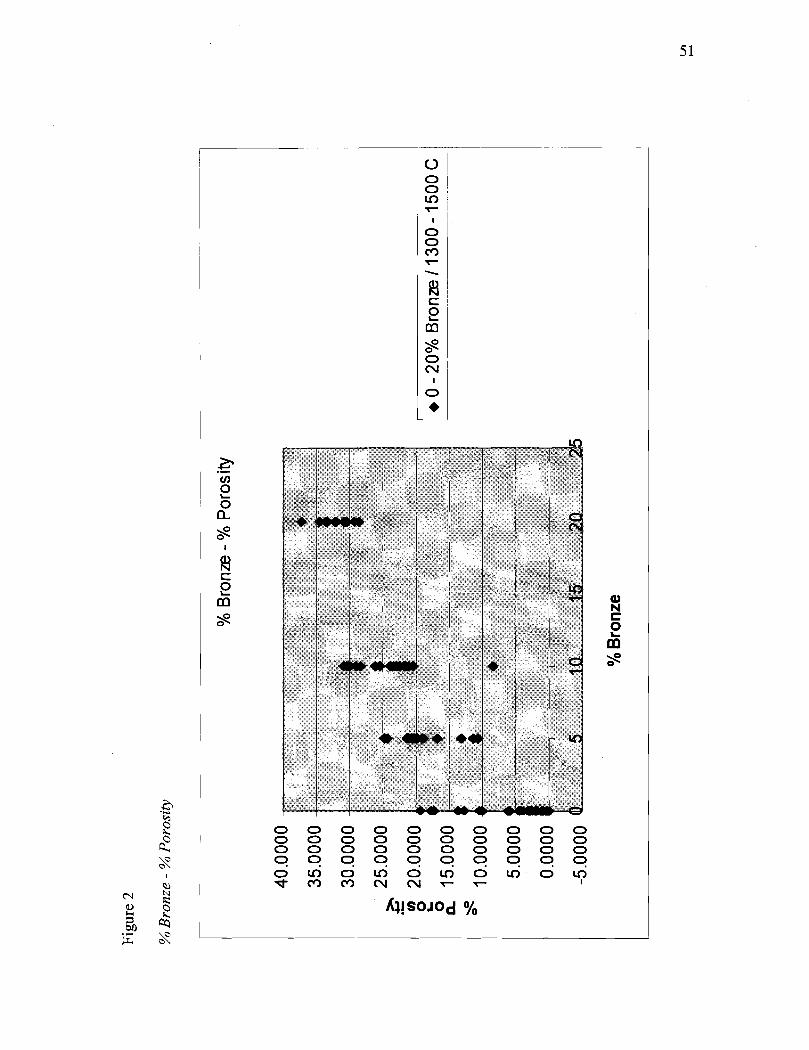
............................................................ Figure 2: % Bronze - % porosity.. .5 1
Figure 3: % Bronze and Cutting Rate.. ....................................................... .52

Chapter I: Introduction
Ceramic materials are inorganic and non-metallic; however they may contain both
metallic and nonmetallic elements. This class of materials includes both traditional
ceramics such as clay, tile, porcelain, and glass, as well as modern technical ceramics
such as carbides, borides, oxides, and nitrides of various elements, which are used in
high-technology applications. Examples of technical ceramics include aluminum oxide,
aluminum nitride, boron carbide, boron nitride, silicon carbide, titanium diboride, silicon
nitride, sialons, zirconium dioxide, barium titanate, and ceramic superconductors.
Usually, ceramics attain their properties during a sintering process at high temperatures.
As monolithic polycrystalline materials, ceramics exhibit low toughness but high
stiffness (i.e., high elastic modulus). Generally stronger under compression than under
tension, ceramics are poor conductors of heat and electricity. Ceramics are lightweight
ionic compounds with high atomic bond energies, which leads to high melting points
(Kingery, 1976).
Problem Statement
To synthesize and characterize new ceramic composites with improved
toughening potential while studying the effects of the volume fraction of metal powder,
compaction pressure, sintering temperature, and sintering time on density, porosity,
fracture strength and hardness.

An Overview of the Study
In spite of their superior heat-resistance, wear-resistance, durability, strength,
hardness, and corrosion resistance, monolithic ceramics are inherently brittle and less
forgiving than metals to surface and internal flaws, which limits their use in industrial
applications, especially in structural components at high temperatures where they can
outperform other material classes.
One method to overcome the low toughness of ceramics is to increase the
misorientation between grains to hinder crack propagation across the grain boundaries.
Another method introduces tiny microcracks in noncubic crystalline ceramics (A1203,
Ti02, etc.) in order to increase the fracture energy, and therefore the toughness. These
subcritical microscopic cracks provide an additional mechanism to dissipate the energy
although they also tend to decrease the strength. Yet another method to toughen ceramics
is based on the beneficial role of sintering aids that are frequently added to ceramics to
stimulate sintering. Sintering aids often form compounds that constantly deflect cracks
during the latter's growth, thus requiring increased energy consumption for crack
propagation.
Combining two or more ceramics such as S i c whiskers reinforcedAI2O3 is yet
another method to toughen ceramics. Considerable toughness gains are possible; for
example, A1203 containing S i c whiskers nearly doubles the fracture toughness of
alumina. The whiskers inhibit crack advance and absorb energy when they are pulled out
or fractured by a propagating crack. The interface strength between different ceramics in
such materials must be carefully tailored; too high a bond strength will impart poor
toughness because of limited fiber pullout, and too low a strength will consume little

energy during pullout, with negligible gains in toughness. The whiskers should be
thermally and chemically stable at processing and service temperatures.
An interesting approach to enhance the toughness of ceramics is to use the energy
of propagating cracks to trigger a solid-state phase change in the vicinity of the crack in
such a way that volume changes on transformation accommodate the stresses to inhibit
the growth of crack. This approach is called transformation toughening, and the classic
example of this mode of toughening is yttria-stabilized zirconia. In transformation
toughened zirconia ceramics, fine particles of partially stabilized Zr02 are dispersed
within an AI2o3 or a Zr02 matrix. Small quantities ( 24%) of oxides such as MgO, Y2O3,
and CaO are added to Zr02 and equilibrated at -1 100°C to form a phase with a tetragonal
crystal structure. The oxide phase stabilizes the tetragonal structure. The material is then
cooled rapidly to room temperature to prevent the transformation of the tetragonal phase
into the more stable monoclinic form (the transformation kinetics for this reaction are
rather sluggish). This stabilizes the metastable tetragonal Zr02 phase at room temperature
rather than the more stable monoclinic phase. The stress field at the tip of an advancing
crack causes the tetragonal Zr02 to transform into the stable monoclinic phase
accompanied by a slight (-2%) volume expansion of transformed particles. This
expansion of the dispersed Zr02 particles results in a compressive stress on the crack tip
that arrests the latter's growth, thus imparting toughness to the ceramic.
Toughness can be enhanced and cracks can be blunted by distributing a soft,
plastically deformable phase in a ceramic matrix which is the basis of a class of materials
called cermets (e.g., Co binder in WC). Cermets contain fine (0.5-10 pm) grains of a
hard carbide (WC or TaC) bonded with a thin (0.5-1 pm) layer of a metallic binder such
as cobalt, which partially dissolves the carbide grains and forms a strong chemical bond
to it. Cermets may also contain fine grains of two carbides; for example, WC intermixed
with TaC and T i c grains. These latter carbides stabilize the tungsten carbide and reduce
the erosion during machining. Ceramic-matrix composites containing a small amount of a
ductile metal phase possess good toughness.
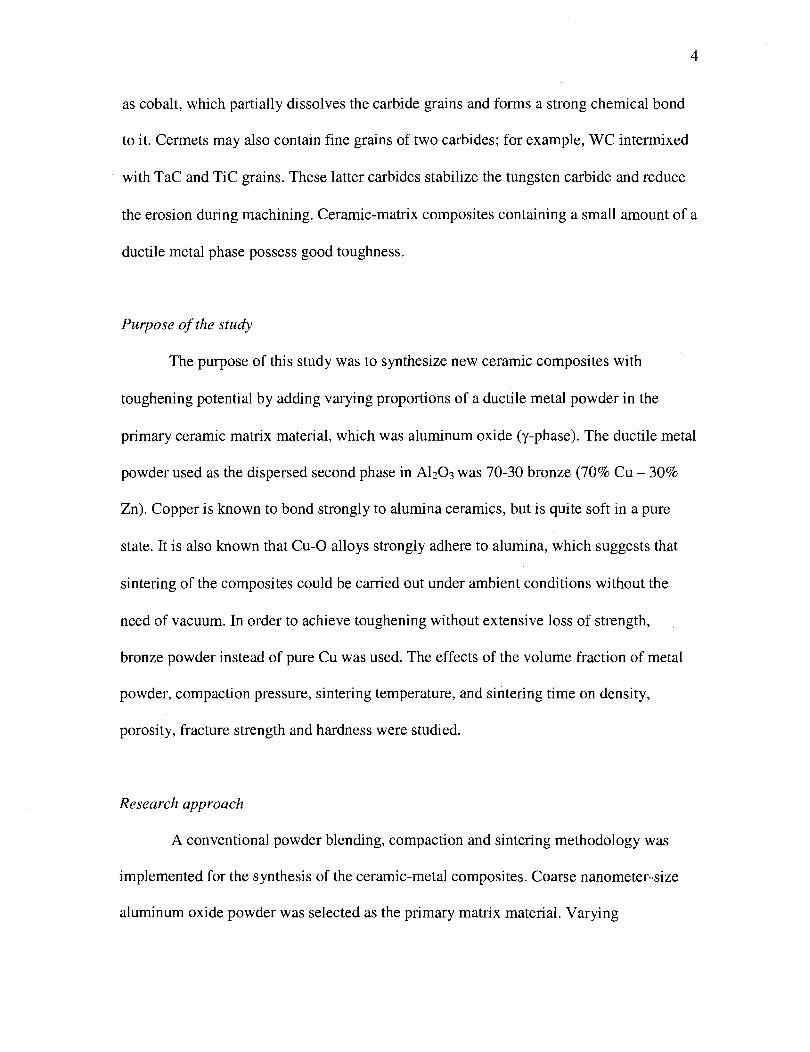
Purpose of the study
The purpose of this study was to synthesize new ceramic composites with
toughening potential by adding varying proportions of a ductile metal powder in the
primary ceramic matrix material, which was aluminum oxide (y-phase). The ductile metal
powder used as the dispersed second phase in A1203 was 70-30 bronze (70% Cu - 30%
Zn). Copper is known to bond strongly to alumina ceramics, but is quite soft in a pure
state. It is also known that Cu-0 alloys strongly adhere to alumina, which suggests that
sintering of the composites could be carried out under ambient conditions without the
need of vacuum. In order to achieve toughening without extensive loss of strength,
bronze powder instead of pure Cu was used. The effects of the volume fraction of metal
powder, compaction pressure, sintering temperature, and sintering time on density,
porosity, fracture strength and hardness were studied.
Research approach
A conventional powder blending, compaction and sintering methodology was
implemented for the synthesis of the ceramic-metal composites. Coarse nanometer-size
aluminum oxide powder was selected as the primary matrix material. Varying

proportions (0-20%) of the bronze powders were added to A1203 powder, mechanically
mixed, and pressed in a hydraulic press to form disc-shaped compacts that were sintered
in air in a programmable furnace under different conditions of time and temperature. The
sintered composites were characterized for density, porosity, hardness, and fracture
strength as a function of the material composition and sintering parameters. The
experimental data were systematically recorded and analyzed to evaluate mechanical
behavior of the synthesized materials.
Significance of the Study
As stated in a preceding paragraph, this research implemented a materials design
approach to overcome the inherent lack of toughness of brittle ceramics. This approach
involved judicious selection of ceramic and metal powders to synthesize ceramic-matrix
composites via a classical powder metallurgy technique, followed by preliminary
physical and mechanical characterization of the composite. The research outcomes
provide experimental data and insight into processing and properties of the fabricated
composites.

Chapter 11: Literature Review
Several different approaches have been used to impart toughness to industrial
ceramics. Some of these approaches were mentioned in Chapter I, which include:
increasing the misorientation between grains to hinder crack propagation across the grain
boundaries, introducing microcracks in ceramics such as A1203 and Ti02 to dissipate the
fracture energy, incorporating suitable sintering aids that form compounds that deflect
cracks during the latter's growth, combining two or more ceramics such as S i c whiskers
and A1203, transformation toughening in which volume changes accompanying a
crystalline phase transformation accommodate the stresses at crack tip, and crack
impeding by dispersing plastically deformable particles or fibers in a brittle ceramic. In
this case, crack is either arrested or bows out.
By adding a small amount of a ductile metallic phase, ceramics can be imparted
toughness at little expense to their other useful engineering properties. Ceramic
composites containing fine metal dispersions can be prepared using powder metallurgy.
For example, silicon carbide ceramics containing up to 24.6 vol% dispersed T i c particles
yielded fully dense composites by hot-pressing at 2000°C with 1 wt% A1 and 1 wt% C
added (Wei and Becher, 1984). It was observed that at high temperatures, the fracture
strength of S ic hot pressed with A1 and C additives was improved by the addition of T i c
particles.
The improvement in the toughness of brittle ceramics through metal dispersions is
attractive because of extremely high concentration of internal interfaces that become
available for energy dissipation during loading. Similar practices have been applied in

dielectric matrices. Particle dispersions in dielectric matrices have been produced; for
example, semiconductor or metal dispersions in glass have been developed for
applications in optoelectronic devices, and magnetic, and solar energy conversion
devices.
Metal composites containing dispersions of ceramic particles also have been
designed and fabricated. The goal here is to enhance the strength of the metal even at
some expense to toughening. Powder metallurgy has been used to synthesize metal-based
composites containing ceramics. Generally, such materials are fabricated using high-
energy ball milling followed by hot consolidation. For example, creep-resistant,
lightweight MgISiC nanocomposites have been obtained by using milling and hot
extrusion (Ferkel & Mordike, 2001). The Ultimate Tensile Strength (UTS) of the hot
extruded composite doubled as compared to un-reinforced Mg. Even a low volume
fraction of S ic nanoparticles when dispersed in pure Mg significantly increased the
strength and, in particular, the creep resistance of the material. Metal-matrix composites
(MMCs) containing micrometer-scale reinforcements such as continuous-fiber reinforced
BIA1, CIA1, and CIMg, and SiCIA1 are already in use. In addition, low-cost discontinuous
metal composites such as C(,,Al, A1203(,{A1, SiC(,{Al, rnicroballoon/Al, and fly ashIAl
have been synthesized for potential automotive and other industrial applications. works.
Recent research to synthesize tough ceramics by dispersing a metallic phase, and
strong metals by dispersing a ceramic phase have employed nanoscale dispersions. For
example, mechanical properties of Cu-matrix composites reinforced by carbon nanotubes
(CNT) were investigated by Dong et a1 (2001). These composites were synthesized using

a hot pressing technique with 350 MPa pressure and 850°C temperature. A decrease in
the composite's coefficient of friction and low wear losses characterized the composites.
A variety of other novel nano-ceramics and ceramic- and metal nanocomposites
have been synthesized. These materials have been processed using high-energy ball
milling, internal oxidation, hot consolidation, crystallization of amorphous solid, sol-gel
processing, and vapor-phase and vapor-liquid-solid deposition. Ceramic nanocomposites
possessing improved fracture toughness include hot-pressed composites of CNTISiC,
A1203/SiC, MgOISiC, W/A1203, A1203/Co, Zr02/Ni and Si3N4/SiC. The powders are first
synthesized using chemical reactions and precipitation. The resulting material is then
reduced by hydrogen and hot press sintered at high temperatures and pressures to produce
nanocomposites. Considerable improvements in mechanical strength, hardness and
fracture toughness are achieved.
Creep-resistant dispersion-strengthened (DS) composites such as Cu/A1203 have
been used in the aerospace industry for nearly forty years. These composites contain fine
dispersions (10-100 nm) and low volume fractions (10-15%) of ceramic oxide particles in
a high-temperature alloy, usually Ni-base. The dispersed oxide phase primarily serves as
a barrier to the motion of dislocations rather than as the load bearing constituent. The
attractive feature of the DS composite is its ability to retain high yield strength, creep
resistance, and oxidation resistance at elevated temperatures rather than an ability to
enhance the room-temperature yield strength (Ying & Zhang, 2000). The thrust of the
current research on ceramics is to improve the room-temperature toughness of brittle
ceramics through fine metal dispersions or other means.

Chapter 111: Methodology
Material selection and description
As discussed in the preceding chapters, toughening of ceramics is a topic of
contemporary interest in the research and development of advanced materials. Aluminum
oxide is the most widely used and characterized ceramic material. Hence, in this research,
aluminum oxide was used as the ceramic matrix material. Nanometer-size aluminum
oxide (A1203) powder was obtained from Reynold's Metals Co.
Research Methodology
A two-step powder metallurgy approach involving powder compaction and
sintering was implemented to synthesize the aluminum oxide-bronze composites. The
powder metallurgy technique to fabricate the composites consisted of the following steps:
(1) The aluminum oxide powder was hand mixed with different fractions of bronze
(70% Cu, 30% Zn) powder using basic laboratory tools.
(2) Pure aluminum oxide powder (with 0% Bronze) was compacted under a pressure
of 20,000 lb to prepare 27 disc-shaped samples (3 groups of 9 samples for
sintering at 3 different temperatures of 1300°C, 1400°C, and 1500°C).
(3) The aluminum oxide powders containing 5%, 10% and 20% by weight of Bronze
powder were compacted under a pressure of 20,000 lb to prepare 54 disc-shaped
samples (3 groups of 18 samples). In each group 18 samples were further hvided
into 3 subgroups for sintering at 3 different temperatures; 1300°C, 1400°C,
1500°C.

(4) The pure aluminum oxide powder (with 0% weight Bronze) compacts were
sintered for 0.5hr, 2hr and 4hr at temperatures of 1300°C, 1400°C and 1500°C,
with 3 samples for each timeltemperature combination. The experiments were
conducted under normal ambient atmosphere.
(5) The aluminum oxide powder compacts (with 5%, 10% and 20% weight Bronze)
were sintered for 0.5hr, 2hr and 4hr at temperatures of 1300°C, 1400°C and
1500°C, with 2 samples for each timeltemperature combination. The experiments
were conducted under normal ambient atmosphere.
( 6 ) The sintered coupons were characterized for density from weight and volume
measurements. For samples that had cracked, and presented difficulty in
measuring the bulk dimensions, a water displacement method was employed to
determine the coupon volume. From the measured density data, porosity content
in each sintered coupon was calculated.
(7) The samples were tested for modulus of rupture (MOR) using a three-point bend
test fixture.
(8) Selected samples were sectioned on a low-speed diamond saw to determine the
rate of cutting as mm2/s. The cutting speed was maintained constant at 200
revolutions per minute.
Instrumentation
All the equipment required for the research was available in the Ceramics and
Powder Metallurgy Laboratory of the Department of Engineering and Technology at
UW-Stout. The major tools and equipment used to accomplish this research were:
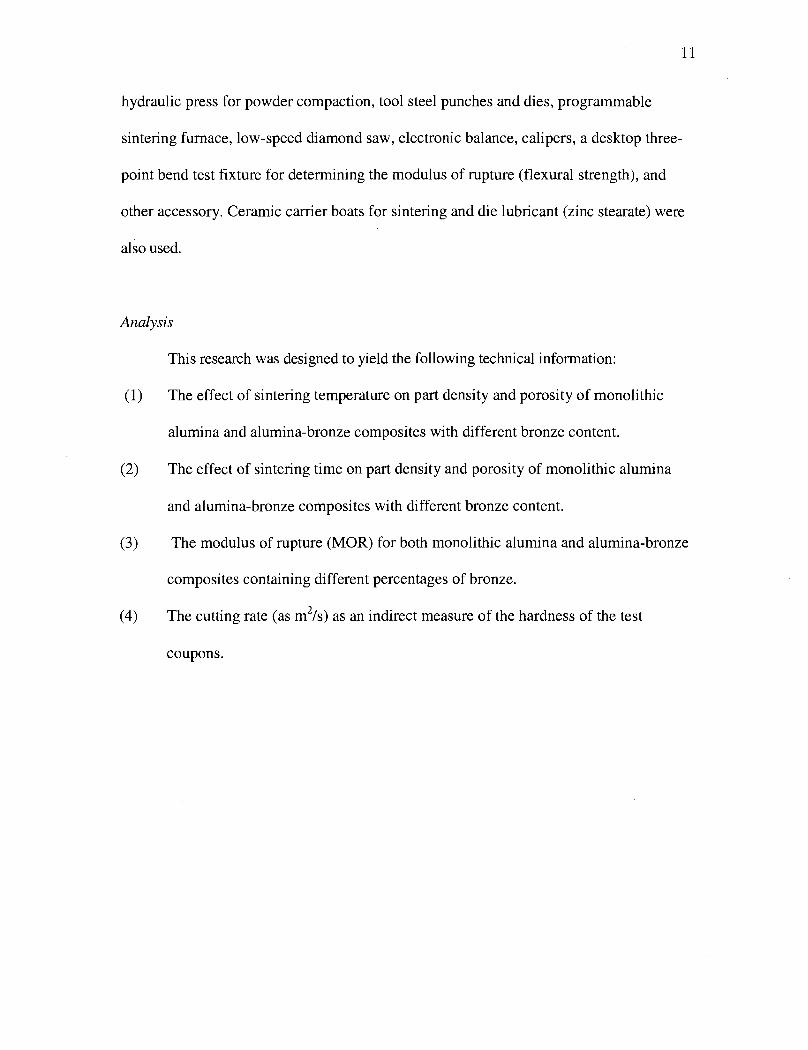
hydraulic press for powder compaction, tool steel punches and dies, programmable
sintering furnace, low-speed diamond saw, electronic balance, calipers, a desktop three-
point bend test fixture for determining the modulus of rupture (flexural strength), and
other accessory. Ceramic carrier boats for sintering and die lubricant (zinc stearate) were
also used.
Analysis
This research was designed to yield the following technical information:
(1) The effect of sintering temperature on part density and porosity of monolithic
alumina and alumina-bronze composites with different bronze content.
(2) The effect of sintering time on part density and porosity of monolithic alumina
and alumina-bronze composites with different bronze content.
(3) The modulus of rupture (MOR) for both monolithic alumina and alumina-bronze
composites containing different percentages of bronze.
(4) The cutting rate (as m2/s) as an indirect measure of the hardness of the test
coupons.

Chapter IV: Results and discussion
Density and porosity
Tables 1A through 12A summarize the measured density and estimated porosity
of press and sintered aluminum oxide based composite specimens containing 5%, 10%
and 20% weight Bronze fabricated from the green state under an external force of
20,0001b. The tables also provide the density of pure aluminum oxide composites (with
0% weight Bronze) that were sintered for 0.5hr, 2hr and 4hr at 1300°C, 1400°C and
1500°C, with 3 samples for each time-temperature combination. In addition, the
preceding tables present density of the aluminum oxide compacts (with 5%, 10% and
20% weight Bronze) that were sintered for 0.5hr, 2hr and 4hr at 1300°C, 1400°C and
1500°C with 2 samples for each time-temperature combination.
The theoretical density of aluminum oxide composites with 0%, 5%, 10% and
20% weight fraction of bronze were calculated using the equation (I) given below.
d d 0 d 0 Comp = A1203 (1 - A1203 ) + Bronze * Bronze ---------------- I
where,
d Comp = Theoretical density of compacted composite
d A1203 = Theoretical density of A1203 = 3900 kg/m3
0 A1203 = Volume fraction of A1203 in the composite
d Bronze = Theoretical density of bronze (70%Cu-30%Zn) = 8530 kg/m3

0 Bronze = Volume fraction of bronze in the composite
The volume fraction of bronze in the composites was calculated from the
measured weight fraction using the equation (11) given below:
W 0 0 0 Bronze = Bronze / [ Bronze + (1 - Bronze) * d ~ 1 2 0 3 / d ~ r ~ n z e ] ---- I1
where,
W Bronze = Weight fraction of bronze in the composite
0 Bronze = Volume fraction of bronze in the composite
The Rule-of-mixture (ROM) method was applied to calculate the theoretical
densities for the A1203 - Bronze composite compacts as shown in Table 13.
After calculating the theoretical and experimental density values, the porosity
content in all the Alz03 - Bronze composites sintered under different time and
temperature conditions were determined using the formula given below:
% Porosity = heore ore tical density - Experimental density) * 1001 1 Theoretical density
Tables 1A through 12A also summarize the estimated porosity for the compacted
aluminum oxide powders with 0%, 5%, 10% and 20% weight Bronze. Tables 14 through
16 provide data to compare sintered density and %Bronze of A1203 - Bronze composite
at 1300°C, 1400°C and 1500°C sintering temperatures for 0.5hr, 2.0hr and 4.0hr. Tables
17 through 19 provide data to compare sintering temperature and sintered density of
A1203 - Bronze composite with 0%, 5%, 10% and 20% weight bronze for 0.5hr, 2.0hr

and 4.0hr. Similarly Table 20 through 23 provide data to compare sintering time and
sintered density of A1203 - Bronze composite at sintering temperatures 1300°C, 1400°C
and 1500°C with 0%, 5%, 10% and 20% bronze.
MOR and cutting rate
A three-point bend test was performed on forty-nine A1203 - Bronze composite
samples to calculate modulus of rupture (MOR). On the three-point bend test fixture,
each division on the deflection dial gage represents 71b force. Thus, by measuring the
deflection to fracture, the fracture force could be estimated from which the MOR value is
obtained using the formula:
where,
o = MOR(Modu1us of Rupture) / Flexural strength / Rupture strength
F = Force in Newton
L = Spacing between the two supports on the test fixture = 1.4cm = 14mm
R = Radius of the specimen
Only approximate values of the MOR were obtained because the press-and-
sintered coupons were essentially non-standard and only roughly satisfied the
assumptions of equation (111).

A test to determine the cutting rate was performed on thirty A1203 - Bronze
composite samples using a low-speed diamond saw at a constant cutting speed of 200
revolutions per minute. The cutting test results were expressed as area cut per unit time.
Table 1B through 12B provide estimated modulus of rupture (MOR) and cutting
rate of A1203 - Bronze composite with 0%, 5%, 10% and 20% Bronze under sintering
temperatures 1300°C, 1400°C and 1500°C. Table 24 provides a consolidated data on
sintered density, porosity, MOR and cutting rate of A1203 - Bronze composite with 0%,
5%, 10% and 20% Bronze under sintering temperatures 1300°C, 1400°C and 1500°C.
Figure 1 shows a negative correlation between % porosity and MOR. As the %
Porosity of A1203 - Bronze composite increases, the MOR decreases. This result is
consistent with the theoretical behavior which predicts a weakening of the ceramic
composites with increasing defect content. Figure 2 reflects a positive correlation
between % Bronze and % porosity in the A1203 - Bronze composite. With increasing %
Bronze in the composite, the % porosity increases. This behavior is inconsistent with the
theoretical expectations. Bronze, being a heavier alloy than monolithic alumina, should
cause an increase in the composite density at increasing bronze contents. The reverse
trend observed in Fig. 2 is a consequence of the void and crack formation in the
composite specimens, which led to inaccurate measurements of volume for density and
porosity estimation. Finally, Fig. 3 shows a positive correlation between % Bronze and
the cutting rate for the A1203 - Bronze composite compacts. It shows that the cutting rate
increases as the bronze content in the A1203 - bronze composite increases. Bronze would
cause some softening in the alumina compact which should essentially reduce the cutting
rate. However, as the sintering experiments were conducted in air, oxidation of bronze

constituents is a strong likelihood. Thus, formation of copper oxides and zinc oxides will
be unavoidable, and these oxides will essentially enhance the effective hardness and the
cutting rate.
Limitations of the study
(1) The experimental research was limited to A1203 - Bronze (70%Cu-30%Zn)
composites and only a limited number of composite samples could be synthesized
due to both cost and time constraints. Nevertheless, the experimental results
provided a preliminary assessment of the effect of air sintering of bronze-alumina
composites on some physical and mechanical characteristics.
(2) Experimental error in measuring the dimensions of the compacts could not be
avoided due to the cracks formed in the samples after sintering at elevated
temperatures. Whereas a water displacement method was used to estimate the
sample volume for use in the density and porosity calculations for samples that
displayed visible surface craclung, the use of two different methods of volume
measurements, and the possibility of internal voids and cracks not visible at the
specimen surface possibly led to errors in measurements.
Suggestions for future work
The cracking of samples led to errors and inconsistencies in the experimental
measurements. The problem was caused due to melting and accompanying expansion of
the bronze powders even below the lowest sintering temperature of 1300" C used in the
present study. This volumetric expansion upon phase change caused internal stresses and

cracks to develop even before the alumina powders developed 'necks' via thermally-
induced atomic mass transport processes. In addition, zinc vapor formation at high
sintering temperatures could cause internal gas pressure to build, leading to void
formation and cracking. During cooling at the conclusion of sintering, the liquid bronze
would resolidify, leading to internal shrinkage and shrinkage porosity to form. These
changes will lead to defect formation and eventual weakening of the composite test
samples. It is recommended that a two-step press and sinter technique is not viable to
synthesize these composites. Instead, hot pressing should be used where compaction and
sintering take place concurrently under large hydrostatic pressures which reduce crack
and void formation.

Table 1A
Sintered Density and % Porosity of Al2o3 - Bronze Composite (0% Bronze; Sintering Temperature = 1300°C)
Sample Sintering After Sintering Average Average Number Time Weight Weight Diameter Diameter Radius Thickness Thickness Volume Volume Density Porosity
(Hrs.) (gm) (kg) (Inches) (m) (m) (cm3) Density Porosity (m) (Inches) (m3) (kg1m3) ("h)

Table 2A
Sintered Density and % Porosity of Al2o3 - Bronze Composite (0% Bronze; Sintering Temperature = 1 400°C)
Sample Sintering After Sintering
Number Time Weight Weight Diameter Diameter Radius Thickness Thickness Volume Density Average Density Porosity Average
(Hrs.) (P) (kg) (Inches) (m) (m) (Inches) ( 4 (m') (kg/m3) (kg/m,) (%I Porosity ("/.I
I 0.5 11.10 0.01 1 1 0.9605 0.0244 0.0122 0.2550 0.0065 3.03E-06 3666.03 5.9992
2 0.5 11.16 0.0112 0.9590 0.0244 0.0122 0.2530 0.0064 2.99E-06 3726.61 3683.26 4.4458 5.56
3 0.5 11.18 0.0112 0.9595 0.0244 0.0122 0.2580 0.0066 3.06E-06 3657.1 3 6.2275


Table 5A
Sintered Density and % Porosity of Al2o3 - Bronze Composite (5% Bronze; Sintering Temperature = 1400°C)
Sample Sintering After Sintering -
Number Time Weight Weight Diameter Diameter Radius Thickness Thickness Volume Volume Density Average ~~~~a~~ Average (Hrs.) (gm) (kg) (Inches) (m) (m) (Inches) (m) (cm3) (m3) (kg/m3) Density
("h) Porosity
("?I

Table 6A
Sintered Density and % Porosity ofAlz03 - Bronze Composite (5% Bronze; Sintering Temperature = 1500°C)
Sample Sintering After Sintering
Average Average Sample Time Weight Weight Diameter Diameter Radius Thickness Thickness Volume Volume Density Density Porosity Porosity Number (Hrs.) (gm) 0%) (Inches) (m) (m) (Inches) (m) (cm3) (m3) @dm3) 3 ?/.)
( O h ,

Table 7A
Sintered Density and % Porosity of A1203 - Bronze Composite (1 0% Bronze; Sintering Temperature = 1 300°C)
Sample Sintering After Sintering
Number Time Weight Weight Diameter Diameter Radius Thickness Thickness Volume Volume Density Density Porosity Average
(Hrs.) (gm) @g) (Inches) (m) (m) (Inches) ( 4 Porosity (cm3) (m3) (kg/m3) (k ~ ~ 3 ) (Oh)
("/.I


Table 9A
Sintered Density and % Porosity of A1203 - Bronze Composite (1 0% Bronze; Sintering Temperature = 1500°C)
Sample Sintering After Sintering
Time Weight Weight Diameter Diameter Radius Thickness Thiclaless Volume Volume Density Average Average Number Density Porosity
(Hrs.) (pm) (kg) (Inches) (m) (m) (Inches) (m) (cm') w) Porosity (m3) (kdm3) (kgm))
(%)

Table 10A
Sintered Density and % Porosity of A1203 -Bronze Composite (20% Bronze; Sintering Temperature = 1300°C)
Sample Sintering After Sintering
Time Weight Weight Diameter Diameter Radius Thickness Thickness Volume Volume Density Average Average Number Density Porosity
(Hrs.) (pm) (kg) (Inches) ( 4 (rn) (Inches) (m) (cm3) (m3) (kg/m3) (k ,m~) (%I Porosity ("h)


Table 12A
Sintered Density and % Porosity ofA1203 - Bronze Composite (20% Bronze; Sintering Temperature = 1500°C)
Sample Sintering After Sintering
Weight Weight Diameter Diameter Radius Thickness Thickness Volume Volume Density Average Porosity Average Time Number (Hrs.) (gm) (kg) (Inches) (m) (m) (Inches) (m) ( 4 (m') (kg/m3) (kdm3) Density
("h) Porosity
W)

Table 1B
Modulus of Rupture (MOR) and Cutting Rate of A1203 - Bronze Composite (0% Bronze; Sintering Temperature = 1300°C)
Cutting Cutting Cutting Cutting Cutting Deflection Load(F) Load(F) Radius(R) Radius(R) MOR(o) Time Depth Depth Thickness Area Number Measured (lb) (N) (m) (mm)
Rate (Mpa) (Set) (Inches) (m) (m) (m2) (m2/s)
Note. (o = MOR (Modulus of Rupture) / Flexural Strength / Rupture Strength; F = Force in Newton; L = Spacing between the two supports on the test fixture = 14mrn; R = Radius of the specimen; 1 Deflection measured on the 3 point bend test fixture = 7 lb Force; 1 lb = 4.45 N)

Table 2B
Modulus of Rupture (MOR) and Cutting Rate of - Bronze Composite (0% Bronze; Sintering Temperature = 1400°C)
Sample Deflection Load(F) Load(F) Radius(R) Radius(R) MOR(a) Number Measured (Ib) (N) (4 (mm> ( M P ~ )
Note. (o = MOR (Modulus of Rupture) / Flexural Strength / Rupture Strength; F = Force in Newton; L = Spacing between the two supports on the test fixture = 14mm; R = Radius of the specimen; 1 Deflection measured on the 3 point bend test fixture = 7 lb Force; 1 lb = 4.45 N)

Table 3B
Modulus of Rupture (MOR) and Cutting Rate ofAl2OJ - Bronze Composite (0% Bronze; Sintering Temperature = 1500°C)
Sample Deflection Load(F) Load(F) Radius(R) Radius(R) MOR(a) Number Measured (lb) (N) (m) (mm) ( M P ~ )
Note. (o = MOR (Modulus of Rupture) 1 Flexural Strength I Rupture Strength; F = Force in Newton; L = Spacing between the two supports on the test fixture = 14rnm; R = Radius of the specimen; 1 Deflection measured on the 3 point bend test fixture = 7 lb Force; 1 lb = 4.45 N)

Table 4B
Modulus of Rupture (MOR) and Cutting Rate of A1203 - Bronze Composite (5% Bronze; Sintering Temperature = 1300°C)
Sample Deflection Load(F) Load(F) Radius(R) Radius(R) MOR(o) Number Measured (lb) (N) ( 4 (mm) ( M P ~ )
Note. (o = MOR (Modulus of Rupture) / Flexural Strength / Rupture Strength; F = Force in Newton; L = Spacing between the two supports on the test fixture = 14rnm; R = Radius of the specimen; 1 Deflection measured on the 3 point bend test fixture = 7 lb Force; 1 Ib = 4.45 N)

Table 5B
Modulus of Rupture (MOR) and Cutting Rate of A1203 - Bronze Composite (5% Bronze; Sintering Temperature = 1400°C)
Cutting Cutting Cumng Cutting Sample Deflection Load(F) Load(F) Radius(R) Radius(R) MOR(a) Time Depth Thickness Area Cutting Rate Number Measured (lb) (N) ( 4
(-) (Mpa) (Sec) (Inches) (m) (m) (m2) (m2/s)
Note. (o = MOR (Modulus of Rupture) I Flexural Strength I Rupture Strength; F = Force in Newton; L = Spacing between the two supports on the test fixture = 14mm; R = Radius of the specimen; 1 Deflection measured on the 3 point bend test fixture = 7 Ib Force; 1 Ib = 4.45 N)

Table 6B
Modulus of Rupture (MOR) and Cutting Rate of A1203 - Bronze Composite (5% Bronze; Sintering Temperature = 1500°C)
Cutting Cutting Cutting Cutting Sample Deflection Load(F) Load(F) Radius(R) Radius(R) MOR(o) Time Depth Depfh Thickness Area Cutting Rate Number Measured (lb) 0 (m>
(Mpa) (Sec) (Inches) (m) ( 4 (mZ> (rn2/s)
Note. (o = MOR (Modulus of Rupture) / Flexural Strength / Rupture Strength; F = Force in Newton; L = Spacing between the two supports on the test fixture = 14mm; R = Radius of the specimen; 1 Deflection measured on the 3 point bend test fixture = 7 lb Force; 1 lb = 4.45 N)

Table 7B
Modulus of Rupture (MOR) and Cutting Rate of Alz03 - Bronze Composite (1 0% Bronze; Sintering Temperature = 1300°C)
Cutting Cutting Cutting Cutting Sample Deflection Load(F) Load(F) Radius(R) Radius(R) MOR(o) Time Depth Depth Thickness Area Cutting Rate Number Measured (Ib) (N) (m)
(-) (Mpa) (Sec) (Inches) (m) (m) (m2) (m2/s)
Note. (o = MOR (Modulus of Rupture) / Flexural Strength / Rupture Strength; F = Force in Newton; L = Spacing between the two supports on the test fixture = 14mm; R = Radius of the specimen; 1 Deflection measured on the 3 point bend test fixture = 7 lb Force; 1 lb = 4.45 N)

Table 8B
Modulus of Rupture (MOR) and Cutting Rate of Al2o3- Bronze Composite (1 0% Bronze; Sintering Temperature = 1400°C)
Cutting Cutting Cutting Sample Deflection Load(F) Load(F) Radius(R) Radius(R) MOR(o) Time DepUl Depth Thickness cutting Area Cutting Rate Number Measured (lb) (N) (m)
(Mpa) (Set) (Inches) (m) ( 4 (m2) (m2/s)
Note. (o = MOR (Modulus of Rupture) / Flexural Strength 1 Rupture Strength; F = Force in Newton; L = Spacing between the two supports on the test fixture = 14rnm; R = Radius of the specimen; 1 Deflection measured on the 3 point bend test fixture = 7 lb Force; 1 lb = 4.45 N)

Table 9B
Modulus of Rupture (MOR) and Cutting Rate of Al2o3 - Bronze Composite (1 0% Bronze; Sintering Temperature = 1500°C)
Cutting Cutting Cutting Sample Deflection Load(F) Load(F) Radius(R) Radius(R) MOR(o) Time Cutting
Depth Depth Thickness Area Cutting Rate
Number Measured (lb) (N) (m) (-) (Mpa) (Sec) (Inches) (m) ( 4 (m2>
(m2/s)
Note. (o = MOR (Modulus of Rupture) 1 Flexural Strength I Rupture Strength; F = Force in Newton; L = Spacing between the two supports on the test fixture = 14rnm; R = Radius of the specimen; 1 Deflection measured on the 3 point bend test fixture = 7 lb Force; 1 lb = 4.45 N)
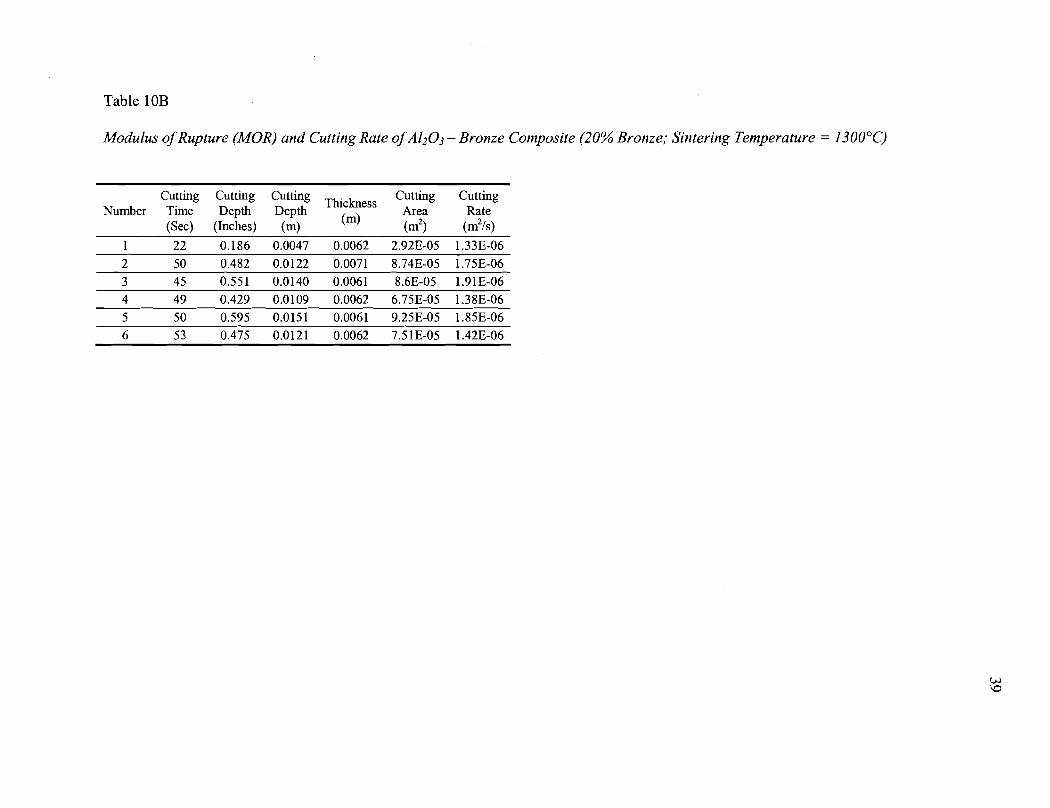
Table 10B
Modulus of Rupture (MOR) and Cutting Rate of Al2o3 - Bronze Composite (20% Bronze; Sintering Temperature = 1300°C)
Cutting Cutting Cutting Cutting Cutting Number Time Depth Depth
Thickness Area (m)
Rate (Sec) (Inches) (m) (m2) (m2/s)

Table 1 1B
Modulus of Rupture (MOR) and Cutting Rate of A1203 - Bronze Composite (20% Bronze; Sintering Temperature = 1400°C)
Cutting Cutting Cutting Sample Deflection Load(F) Load(F) Radius(R) Radius(R) MOR(o) T_x Depth Depth
Cutting Cutting Thickness Area
Number Measured (Ib) (N) (m) Rate
(Mpa) (Sec) (Inches) (m) ( 4 (m21 (m2/s)
Note. (o = MOR (Modulus of Rupture) 1 Flexural Strength I Rupture Strength; F = Force in Newton; L = Spacing between the two supports on the test fixture = 14mm; R = Radius of the specimen; 1 Deflection measured on the 3 point bend test fixture = 7 lb Force; 1 lb = 4.45 N)

Table 12B
Modulus of Rupture (MOR) and Cutting Rate of A1203 - Bronze Composite (20% Bronze; Sintering Temperature = 1500°C)
Cutting Cutting Cutting Sample Deflection Load(F) Load(F) Radius(R) Radius(R) MOR(o) Time Cutting Cutting
Depth Depth Thickness Area
Number Measured (lb) (N) (m) Rate
(-) (Mpa) (Sec) (Inches) (m) (m) (m2) (m2/s)
Note. (o = MOR (Modulus of Rupture) 1 Flexural Strength / Rupture Strength; F = Force in Newton; L = Spacing between the two supports on the test fixture = 14mm; R = Radius of the specimen; 1 Deflection measured on the 3 point bend test fixture = 7 Ib Force; 1 Ib = 4.45 N)


Table 14
Sintered Density and %Bronze of A1203 - Bronze Composite (0.5hr, 2.Ohr and 4.Ohr; Sintering Temperature = 1300°C)
Table 15
Sintered Density and %Bronze of A1203 - Bronze Composite (0.5hr, 2.0hr and 4.0hr; Sintering Temperature = 1400°C)

Table 16
Sintered Density and %Bronze of A1203 - Bronze Composite (0.5hr, 2.0hr and 4.0hr; Sintering Temperature = 1500°C)
Table 17
Sintering Temperature and Sintered Density of A1203 - Bronze Composite (0%, 5%, 10% and 20% Bronze; Sintering Time = 0.5hr)
A1203 (% Bronze)
0 0 0 5 5 5 10 10 10 20 20 20
Time (Hrs.)
0.5 0.5 0.5 0.5 0.5 0.5 0.5 0.5 0.5 0.5 0.5 0.5
Temp ("C) 1300 1400 1500 1300 1400 1500 1300 1400 1500 1300 1400 1500
Density (kg/m3) 3191.09 3683.26 3885.06 3025.13 3372.54 3249.78 2866.80 3183.71 2969.89 3032.68 2961.11 3004.32

Table 18
Sintering Temperature and Sintered Density of Alz03 - Bronze Composite (0%, 5%, 10% and 20% Bronze; Sintering Time = 2hr)
Table 19
Sintering Temperature and Sintered Density of AZ2O3 - Bronze Composite (0%, 5%, 10% and 20% Bronze; Sintering Time = 4hr)
A1203 (% Bronze)
0 0 0 5 5 5 10 10 10 20 20 20
Time (Hrs.)
4 4 --- 4 4 4 4 4 4 4 4 4 4
Temp ("C) 1300 1400 1500 1300 1400 1500 1300 1400 1500 1300 1400 1500
Density (kg/m3) 3497.11 3792.72 3842.37 3206.47 3269.53 3327.35 3354.10 3265.85 3123.85 3038.36 2959.99 2879.21

Table 20
Sintering Time and Sintered Density of Alz03 - Bronze Composite (1300°C, 1400°C and 1500°C; Bronze = 0%)
Table 21
Sintering Time and Sintered Density of A1203 - Bronze Composite (1300°C, 1400°C and 1500°C; Bronze = 5%)

Table 22
Sintering Time and Sintered Density of AZ203 - Bronze Composite (1300°C, 1400°C and 1500°C; Bronze = 10%)
Table 23
Sintering Time and Sintered Density of AZz03 - Bronze Composite (1300°C, 1400°C and 1500°C; Bronze = 20%)

Table 24
Sintered Density, Porosity, MOR and Cutting Rate of Al2O3 - Bronze Composite with 0%, 5%, 10% and 20% Bronze under Sintering Temperatures 1300°C, 1400°C and 1500°C.

Table 24:
Continued


References
Asthana, R., Kumar, A., & Dahotre, N.B. (2006). Materials Processing and
Manufacturing Science. Elsevier: Academic Press.
Beraud, C. M., Courbier, M., Esnouf, C., Juve, D., & Treheux, D. (1989). Study of
copper-alumina bonding, Journal of Materials Science, 24(12), 4545-4554.
Chakladar, A. C. D., Armstrong, A. M., & Misra, S. K. (1968). Interface reactions
between metals and ceramics: IV. Wetting of sapphire by liquid copper-oxygen
alloys. Journal of the American Ceramic Society, 51(1 l), 630-634.
Chidambaram, P., Meir, A., & Edwards, G. R. (1996). The nature of interfacial
phenomena at copper-titanium/alumina and copper-oxygen/alumina interfaces.
Materials Science & Engineering, A206, 249-258.
Dong, S. R., Tu, J. P., & Zhang, X. B. (2001) An investigation of the sliding wear
behavior of Cu-matrix composite reinforced by carbon nanotubes. Materials
Science and Engineering, A313, 83-87.
Eustathopoulos, N., Chatain, D., & Coudurier, L. (1991). Wetting and interfacial
chemistry in liquid metal ceramic systems. Materials Science and Engineering,
A13.5, 83-88.
Ferkel, H., & Mordike, B. L. (2001). Magnesium strengthened by S i c nanoparticles.
Materials Science and Engineering, A298, 193- 199.
Frekel, H., & Riehemann, W. (1996). Bonding of alumina ceramics with nanoscaled
alumina powders. Nanostructured Materials, 7(8), 835-845.

Kanetkar, C. S., Kacar, A. S., & Stefanescu, D. M. (1988). Wetting characteristics and
surface tension of some Ni-base alloys on yttria, hafnia, alumina and zirconia
substrates. Metallurgical and Materials Transactions, 19A, 1833- 1839.
Kingery, W. D., Bowen, H. K., & Uhlmann, D. R. (1976). Introduction to Ceramics.
New York : John Wiley & Sons Inc.
Locatelli, M. R., Tomsia, A. P., Nakashima, K., Dalgleish, B. J., & Glaser, A. M. (1995).
New strategies for joining ceramics for high-temperature applications. Key
Engineering Materials, 111-1 12, 157-190.
Mandal, S., Kumar, A., & Ray, A. K. (2004). Correlation between the mechanical
properties and the microstructural behavior of A1203-(Ag-Cu-Ti) brazed joints.
Materials Science and Engineering, A383,235-244.
Mishra, P., Sengupta, P., Athavale, S. N., Pappachan, A. L, Grover, A. K., Suri, A. K.,
Kale, G. B., De, P. K., & Bhanumurthy, K. (2005). Brazing of hot isostatically
pressed alumina-to-stainless steel (AISI 304L) by Mo-Mn route using 72Ag-28Cu
braze. Metallurgical and Materials Transactions, 36A, 1 487- 1494.
Naka, M., & Hafez, K. M. (2003). Applying ultrasonic waves on brazing of alumina to
copper using Zn-A1 filler alloy. Journal of Materials Science, 38, 3491-3494.
Nicholas, M. G. (1988). Interactions at oxide-metal interfaces. Materials Science Forum,
29, 127-150.
Reed, J. S. (1988). Principles of Ceramic Processing. New York: John Wiley & Sons Inc.
Ritland, M. A., & Readey, D. W. (1993). Alumina-copper composites by vapor phase
sintering. Ceramic Engineering and Science Proceedings, 14(9-lo), 896-907.

Ritter, J. E., & Burton, M. S. (1967). Adherence and wettability of Ni, Ni-Ti, and Ni-Cr
alloys to sapphire. Transactions of the Metallurgical Society of AIME, 239, 21-26.
Sekino, T., Yu, J. H., Choa, Y. H., & Niihara, K. (2000). Reduction and sintering of
aluminaltungsten nanocomposites. Journal of the Ceramic Society of Japan,
108(6), 54 1-547.
Shalek, P. D., Petrovic, J. J., Hurley, G. F., & Gac, F. D. (1986). Hot-pressed S i c
whiskerlSi3N4 matrix composites. American Ceramic Society Bulletin, 65(2),
351-356.
Suganuma, K., Mi yamoto, Y., & Koizumi, M. (1988). Joining of Ceramics and Metals.
Annual Review of Materials Science, 18,47-73.
Wei, G.C., & Becher, P. F. (1984). Improvements in mechanical properties in SIC by the
addition of T i c Particles. Journal of the American Ceramic Society, 67(8), 571-
574.
Wei, G.C., & Becher, P. F. (1985). Development of Sic-whisker-Reinforced ceramics.
Ceramic Bulletin, 64(2), 298-304.
Xue, X. M., Wang, J. T., & Sui, Z. T. (1993). Wettability and interfacial reactions of
alumina and zirconia by reactive Ag-In base alloy at mid-temperatures. Journal of
Materials Science, 28, 13 17-1322.
Ying, D. Y., & Zhang, D. L. (2000). Processing of Cu-A1203 metal matrix
nanocomposite materials by using high energy ball milling. Materials Science and
Engineering, A286, 152- 156.

Zhang, J. X., Chandel, R. S., & Seow, H. P. (2002). Effect of chromium addition on
brazing of copper to alumina: some microstructural aspects. Science and
Technology of Welding and Joining, 7(3), 182-1 86.