SYNOVIAL SERUM AMYLOID A (SAA) AS A DIAGNOSTIC MARKER …
52
ESTONIAN UNIVERSITY OF LIFE SCIENCES Institute of Veterinary Medicine and Animal Sciences Kia Pekkonen SYNOVIAL SERUM AMYLOID A (SAA) AS A DIAGNOSTIC MARKER FOR EQUINE JOINT DISEASE SÜNOOVIA SEERUMI AMÜLOID A (SAA) KUI VÕIMALIK DIAGNOSTILINE MARKER HOBUSE LIIGESEHAIGUSTE KORRAL Final Thesis Curriculum in Veterinary Medicine Supervisor: Professor Toomas Orro Tartu 2020
Transcript of SYNOVIAL SERUM AMYLOID A (SAA) AS A DIAGNOSTIC MARKER …

ESTONIAN UNIVERSITY OF LIFE SCIENCES
Institute of Veterinary Medicine and Animal Sciences
Kia Pekkonen
SYNOVIAL SERUM AMYLOID A (SAA) AS A DIAGNOSTIC
MARKER FOR EQUINE JOINT DISEASE
SÜNOOVIA SEERUMI AMÜLOID A (SAA) KUI VÕIMALIK
DIAGNOSTILINE MARKER HOBUSE LIIGESEHAIGUSTE
KORRAL
Final Thesis
Curriculum in Veterinary Medicine
Supervisor: Professor Toomas Orro
Tartu 2020

Estonian University of Life Sciences Kreutzwaldi 1, 51014, Tartu Estonia
Abstract of Final Thesis
Author: Kia Pekkonen Curriculum: Veterinary Medicine
Title: Synovial serum amyloid A (SAA) as a diagnostic marker for equine joint disease
Pages: 51 Figures: 3 Tables: 4 Appendixes: 2
Chair: Chair of Clinical Veterinary Medicine Field of research and (CERC S) code: 3. Health, 3.2. Veterinary Medicine B750 Veterinary medicine, surgery, physiology, pathology, clinical studies Supervisor: Professor Toomas Orro Place and year: Tartu 2020 Joint disease of different aseptic origins, is common problem in horses. An acute phase protein, serum amyloid A (SAA), is produced by chondrocytes and it is good candidate to be diagnostic marker for equine joint disease. In this study 11 synovial samples were collected from joints with different joint diseases and 8 samples from non-pathologic joints. Samples were from stifle (n = 10), tarsal (n = 6) and fetlock (n = 3) joints. Four different pathologies were identified: osteoarthritis (OA), osteochondrosis (OC), meniscal tear and one fetlock with chronic suspensory ligament injury. This sample was included into OA group for data analysis. Samples were analyzed with commercial ELISA kit with detection limit 0.1 mg/l. Samples from OA group (n = 5) and meniscal tear group (n = 3) had the highest concentrations of SAA in pathologic joint groups with ranges from 0.1-0.60 mg/l and 0.36-0.61 mg/l, respectively. Concentrations were lower in the OC group (0.20-0.28 mg/l). No-pathologies group (n = 4) had even lower synovial SAA concentrations (0.1-0.22 mg/l). Four synovial samples from two horses were omitted from controls and were included to a separate group due to possible systemic inflammatory response (0.4-3.24 mg/l). There were no statistically significant differences between groups’ synovial SAA concentrations, except between no-pathologies group and horses with possible systemic inflammation (p < 0.05). SAA concentrations were higher in all samples with joint pathology (n = 11) when compared to no-pathologies group (n = 4; p = 0.037). Horses with higher synovial SAA concentrations tended to have higher lameness scores, and higher synovial SAA concentrations were found in samples (n = 9) from lame horses compared to samples from sound ones (n = 6; p = 0.034). As a conclusion, synovial SAA could potentially be used as a marker for equine joint disease, but in future large-scale studies are needed to evaluate synovial SAA as diagnostic marker. Keywords: Equine joint diseases, osteoarthritis, synovia, serum amyloid A
Eesti Maaülikool Kreutzwaldi 1, 51014, Tartu
Lõputöö lühikokkuvõte
Autor: Kia Pekkonen Õppekava: Veterinaarmeditsiin
Pealkiri: Sünoovia seerumi amüloid A (SAA) kui võimalik diagnostiline marker hobuse
liigesehaiguste korral
Lehekülgi: 51 Jooniseid: 3 Tabeleid: 4 Lisasid: 2
Õppetool: Kliinilise veterinaarmeditsiini õppetool ETIS-e teadusvaldkond ja CERC S-i kood: 3. Terviseuuringud, 3.2 veterinaarmeditsiin B750 Veterinaarmeditsiin, kirurgia, füsioloogia, patoloogia, kliinilised uuringud Juhendaja: Professor Toomas Orro Kaitsmiskoht ja -aasta: Tartu 2020 Erinevate aseptiliste põhjustega liigesehaigused on hobustel väga levinud. Ägeda järgu valku, seerumi amüloid A-d (SAA) toodetakse kondrotsüütide poolt ja SAA-d on potentsiaalselt võimalik kasutada kui diagnostilist markerit liigesehaiguste korral. Antud uuringus koguti liigesehaigusega hobuste liigestest 11 sünoviaalproovi ja mittepatoloogilistest liigestest 8 proovi. Proove oli põlve- (n = 10), kanna- (n = 6) ja randmeliigesest (n = 3). Diagnoositi 4-ja erinevat patoloogiat: osteoartriit (OA), osteokondroos (osteochondrosis; OC), meniski rebend ja üks proov oli kroonilise tugisidemete kahjustusega randmeliigesest. Viimati nimetatud proov liideti andmete analüüsiks OA rühmaga. Liigeseproovide SAA sisaldus määrati ELISA testiga mille avastamispiir oli 0.1 mg/l. OA rühma (n = 5) ja meniski rebendi rühma (n = 3) sünoovia SAA kontsentratsioonid olid kõrgemad, vastavalt 0,1-0,60 mg/l ja 0,36-0,61 mg/l. OC rühmas olid madalamad tulemused (0,20-0,28 mg/l). Kahe hobuse 4 liigeseproovi eemaldati kontrollproovide rühmast võimaliku süsteemse põletikuvastuse tõttu ja nende proovide tulemusi käsitleti eraldi rühmana (0.4-3.24 mg/l). Ilma liigese patoloogiata rühmas (n = 4) olid madalaimad sünoovia SAA kontsentratsioonid (0,1-0,22 mg/l). Nende rühmade SAA kontsentratsioonid ei erinenud omavahel oluliselt, välja arvatud ilma patoloogiata liigeseproovid ja võimaliku süsteemse põletikuvastusega hobuste proovid (p < 0.05). Kõigi patoloogiatega liigeseproovide (n = 11) SAA oli kõrgem võrreldes tervete liigeste proovidega (n = 4; p = 0.037). Tugevama lonkeastmega hobuste proovides oli ka kõrgem SAA tase ning lonkavate hobuste liigeseproovide (n = 9) SAA sisaldus oli kõrgem kui mittelonkavate hobuste liigeseproovides (n = 6; p = 0.034). Kokkuvõtteks võib ütelda, et sünoovia SAA-d saab potentsiaalselt kasutada hobuste liigesehaiguste diagnostikas, kuid selle kinnitamiseks on vaja laiahaardelisemaid uuringuid. Märksõnad: Hobuste liigesehaigused, osteoartriit, sünoovia, seerumi amüloid A
4
TABLE OF CONTENTS
ABBREVIATIONS ................................................................................................................................... 6
INTRODUCTION ..................................................................................................................................... 8
1. LITERATURE REVIEW ..................................................................................................................... 9
1.1. Acute phase response ..................................................................................................................... 9 1.1.1. Acute phase response................................................................................................................ 9 1.1.2. Cytokines ................................................................................................................................. 9 1.1.3. Systemic effect of cytokines ................................................................................................... 10 1.1.4. Effects of nitric oxide ............................................................................................................. 10 1.1.5. Effect of APR in liver ............................................................................................................. 10
1.2. Acute phase proteins .................................................................................................................... 11 1.2.1. Classification of APP.............................................................................................................. 11 1.2.2. APP of the equine species ....................................................................................................... 12 1.2.3. SAA in equines ...................................................................................................................... 12 1.2.4. SAA as a molecule ................................................................................................................. 13 1.2.5. Specific functions of SAA ...................................................................................................... 13
1.3. Osteoarthritis ............................................................................................................................... 14 1.3.1. Physical function of joints ...................................................................................................... 14 1.3.2. Characterization of OA ........................................................................................................... 14 1.3.3. Approaches to the disease ....................................................................................................... 15
1.3.3.1. Abnormal loading of normal joint ............................................................................... 15 1.3.3.2. Normal loading of abnormal joint ........................................................................................ 15
1.3.4. Characteristics of articular cartilage ........................................................................................ 16
1.3.4.1. Organization of cartilage............................................................................................. 16 1.3.5. Pathogenesis of the OA .......................................................................................................... 17 1.3.6. Molecular pathways of OA ..................................................................................................... 17 1.3.7. Matrix degradation ................................................................................................................. 19
1.3.7.1. Matrix metalloproteinases ........................................................................................... 19
1.3.7.2. Collagen destruction ................................................................................................... 21
1.3.7.3. Role of disintegrin and metalloproteinase with thrombospondin motifs ........................ 21
1.3.8. Clinical diagnosis of OA in equines ........................................................................................ 21 1.4. Conclusions of literature review .................................................................................................. 22
2. AIM OF THE STUDY ........................................................................................................................ 23
3. MATERIALS AND METHODS ......................................................................................................... 24
5
3.1. Animals and samples ................................................................................................................... 24 3.1.1. Inclusion criteria for study group ............................................................................................ 24 3.1.2. Diagnosing joint pathologies................................................................................................... 24 3.1.3. Inclusion criteria for control group .......................................................................................... 26 3.1.4. Synovial sampling and storage ................................................................................................ 26
3.2. Description of study population ................................................................................................... 26 3.2.1. Description of control group ................................................................................................... 28
3.3. Laboratory analysis ..................................................................................................................... 28 3.4. Statistical analysis ........................................................................................................................ 29
4. RESULTS ............................................................................................................................................ 30
5. DISCUSSION ...................................................................................................................................... 34
CONCLUSIONS ..................................................................................................................................... 40
ÜLDKOKKUVÕTE ................................................................................................................................ 41
ACKNOWLEDGEMENTS .................................................................................................................... 43
REFERENCES ....................................................................................................................................... 44
APPENDIXES ......................................................................................................................................... 50
Appendix 1. Data-survey used to collect anamnesis of the animals included in the study population ...... 51 Appendix 2. Non-exclusive license for depositing the final thesis and opening it for the public and the
supervisor’s confirmation for allowing the thesis for the defense ........................................................... 52

6
ABBREVIATIONS
ADAMTS Disintegrin and metalloproteinase with
thrombospondin motifs
AGE Advanced glycation end product
AGP Alpha 1-acid glycoprotein
APP Acute phase protein
APR Acute phase reaction
COX-2 Cyclo-oxygenase 2
CP Ceruloplasmin
DAMP Damage-associated molecular patterns
ECM Extra-cellular matrix
ELISA Enzyme-linked immunosorbent assay
FIB Fibrinogen
HDL High density lipoproteins
HP Haptoglobin
HPA-axis hypothalamic-pituitary-adrenal
IL-1b Interleukin 1beta
IL-6 Interleukin six
iNOS Inducible nitric oxide synthase
L-score Lameness score
LPS Lipopolysaccharides
MMP Matrix metalloproteinases
MMP-1, -8, -13 Collagenases
MMP-14, -15, -16, -17, -24, -25 Membrane type matrix metalloproeinases
MMP-2, -9 Gelatinases
MMP-3, -10, -11 Stromelysins
MP Metalloproteinases
MRI Magnetic resonance imaging
NF-κB Nuclear factor-Kappa B

7
NLRP3 Nucleotide-binding oligomerization domain,
leucine rich repeat and pyrin domain containing;
NO Nitric oxide
OA Osteoarthritis
OC Osteochondrosis
OCD Osteochondrosis dissecans
RAGE Advanced glycated end receptors
SAA Serum amyloid A
TLR Toll-Like receptor
TNF -α Tumor necrosing factor alpha
TRF Transferrin

8
INTRODUCTION
Equine species are made for movement. Horses are stretched to jump higher, run faster and
perform better in dressage. But it does not come without a cost: while movement is the
essence of equine sports, practitioners face the challenge of lameness and joint disease on a
daily basis. Inflammatory joint diseases are a broad group of diseases that all culminate
towards common endpoint: osteoarthritis (OA). OA is described as irreversible destruction
of articular cartilage and modulation of the underlying bony structures due to inflammation
in the synovial space. To better understand, the process must be viewed in molecular bases.
The body has two mechanisms to respond to integrity challenges: Innate and acquired
immunity. Inflammation is mainly driven by the innate mechanism, better called the acute
phase response (APR) (Gruys et al., 2005). Physiological changes in APR are associated
with cytokine production and acute phase protein (APP) synthesis in the liver and locally in
the joint. Rather intensive research is done over the APR and OA in human medicine (Xia
et al., 2014; Sofat et al., 2019) and equine medicine (Jacobsen et al. 2016; McIlwraith et al.,
2018) alike. Equine OA treatment is usually restricted to pain control and anti-inflammatory
treatment like intra-articular corticosteroids (McIlwraith et al.,2012). Disease progress is
usually very advanced before diagnosis. Subjective diagnostic tactics, like lameness scoring
can make disease progress observations inconsistent. By good diagnostic markers, like
synovial APP, the diagnosis could be made more promptly, intervention more efficiently
and disease progress observed more objectively.
Serum amyloid A (SAA) is a major APP in horses. SAA is well investigated in both equine
and human OA. SAA is strongly suspected to intermediate in the pathogenesis of OA in the
synovial compartment, because SAA is produced extrahepatically in the joint by
synoviocytes and has collagen cleaving properties. Typical ranges of SAA in the equine joint
are not known yet, but SAA has been shown to increase in septic joint infections with 100-
1000 fold compared to the detection limit of robust assays. I hypothesize that if SAA is
detected with a more optimized assay, a significant difference between aseptically inflamed
joint and non-pathologic joint could be found.

9
1. LITERATURE REVIEW
1.1. Acute phase response
1.1.1. Acute phase response
All domestic animals face immunological challenges constantly. Not depending on the
species, gender or age, the first reaction to immunological stress is an activation of the non-
specific innate immunity, proceeded by the specific immune reactions. The systemic
inflammatory component of innate immunity alias APR is well described systemic
phenomena of the organism to local or systemic deviation from homeostasis, invoked by
trauma, infection, stress, neoplasia or inflammation (Gruys et al., 2005; Cray et al., 2009;
Belgrave et al., 2013). Initiating factors create several reactions by the local area or tissue
itself. Pro-inflammatory cytokines are released whenever the integrity of the cells is
compromised, and affect neural signs to initiate local response (Murata et al., 2004).
Vascular system and inflammatory cells are activated, and the production of more cytokines
and other inflammatory mediators are in turn elicited. This is followed by diffusing of
cytokines into the extracellular matrix and eventually increased concentrations in circulation
(Gruys et al., 2005).
1.1.2. Cytokines
Cytokine is an umbrella term for a large group of proteins, which have a specific effect on
communication and cell interactions. Cytokines involved in APR are termed pro-
inflammatory cytokines and are mainly produced by activated macrophages (Zhang and An,
2007). The main pro-inflammatory cytokines are tumor necrosis factor-alpha (TNF-α),
interleukin-1beta (IL-1 β), and interleukin-6 (IL-6) (Gruys et al., 2005; Zhang and An,
2007). IL-1β is also produced in fibroblasts and endothelial cells during cell injury (Zhang
and An, 2007), which shows that APR can also have more local effects.

10
1.1.3. Systemic effect of cytokines
Systemic effects of the cytokines are multiple in the body. Trough receptor activation in
target cells, cytokines activate the hypothalamic-pituitary-adrenal (HPA-) axis, reduce
growth hormone secretion, cause negative nitrogen balance and catabolism of muscle, elicit
clinical changes like fever and anorexia (Gruys et al., 2005). Activation of the HPA-axis
also increases glucocorticoid levels in circulation (Murata et al., 2004; Gruys et al., 2005),
which is partly seen in clinical signs. Murata et al. (2004) noted that increased glucocorticoid
production has also cytokine downregulating action. Other reported direct changes induced
by cytokines that can be measured in the laboratory include lower plasma cholesterol,
decreased leukocyte count, activation of the complement system and blood coagulation
system (Gruys et al., 2005).
1.1.4. Effects of nitric oxide
The third component inducing APR is nitric oxide (NO) production in cells. NO has been
known to be involved in the inflammation from the 1980s when Stuehr and Marletta (1985)
reported NO production in mice macrophages in response to bacterial lipopolysaccharides
(LPS). In addition to bacterial compounds, NO reacts also to cytokines like TNF-α, hypoxia
and deviations of calcium homeostasis. NO has an important role in modulation of APR;
infection control, regulatory role in vascular responses, cascades and transcription factors,
leucocyte migration, proliferation, apoptosis and in turn cytokine production (Korhonen et
al., 2005).
1.1.5. Effect of APR in liver
Pro-inflammatory cytokines, glucocorticoids and nitric oxide trigger and modulate the
systemic effect of APR (Murata et al., 2004; Gruys et al., 2005). Most of the actions are
based on rapid plasma composition change facilitated by the liver (Murata et al., 2004; Gruys
et al., 2005). Especially protein production is changed by APR, and thus there are proteins
named acute phase proteins (APP). The effect of APR may be enhancing the production of
APP or hindering it down. By this categorization, APPs are either positive, meaning their
plasma concentration rises or negative when plasma concentration decreases, respectively

11
(Rodney et al., 2014). In the hepatic APR, pro-inflammatory cytokines play a major role:
especially IL-6 activates the hepatic receptors for APP production (Gruys et al., 2005). To
maintain homeostasis, the body also causes itself to down-regulate the APR. The main down
regulator action is rapid clearance of APP in the hepatocytes, anti-inflammatory cytokine
secretion, especially IL-10 secretion by Kupffer cells and gene activation pathways co-
activation at receptor binding (Gruys et al., 2005). IL-6 hepatic activation is dependent on
glucocorticoid concentrations, but on the other hand the glucocorticoids down-regulate
cytokine production by macrophages and monocytes (Murata et al., 2004; Gruys et al.,
2005). APR is a result of all these very complex interactions and all aim to repair the
homeostasis.
1.2. Acute phase proteins
1.2.1. Classification of APP
As mentioned earlier, APP are differentiated to positive and negative APP by APR influence
on the plasma concentration. Although APR is inter-species phenomena, APP reactions
differ from species to species (Cray et al., 2009; Rodney et al., 2013). Still, some general
analogies are found: Albumin, major plasma protein, drops during APR (Petersen et al.,
2004) and is negative APP. Other downregulated APP of mammals include transferrin
(TRF), transthyretin, retinol-binding protein 4 and corticosteroid-binding globulin (Schrödl
et al., 2016). The positive APP are further subdivided into major, mediate and minor classes.
Major APP are characterized to have low plasma concentrations in healthy animals, but
increase several hundred folds in hours after APR stimulus occurs and drop promptly with
recovery (Murata et al., 2004; Cray et al., 2009). Major positive APP in most species
including equines is serum amyloid A (SAA). Other equine APP moderate and minor for
equine species are alpha 1-acid glycoprotein (AGP), ceruloplasmin (CP), fibrinogen (FIB),
and haptoglobin (HP).

12
1.2.2. APP of the equine species
HP is considered an intermediate APP in horses. The physiological role is suggested to be
binding hemoglobin, to be bacteriostatic, stimulate angiogenesis and immunomodulation
(Eaton et al., 1982; Delanghe et al., 1998). In horses, HP increase in serum has been studied
in viral infections and following surgery (Kent and Goodal, 1991). HP has also observed
during non-septic arthritis (Hulten et al., 2010) and saw a rise over baseline at 24h after
induction of disease. Fibrinogen is used as a general indicator for inflammation in horses,
and the measurement is easy even in less furnished laboratory (Borges et al., 2007). Lately
it has suggested to be a good tool in prognosis, like determine delayed complications post-
surgery (De Czar et al., 2019). The physiological role of fibrinogen in APR is noted, since
universally in all inflamed or injured tissues will eventually find fibrin deposits. Fibrinogen
is a large part of the reparative pathway that aims to contain the inflamed area, stop bleeding
and prevent microbial infection (Luyendyk et al., 2019). Fibrinogen is the most used clinical
APP in equine medicine, but it has drawbacks like high concentrations in healthy patients,
peak values are 2-4 times of normal concentration and show a slow decline during recovery
(Allen and Kold, 1988).
1.2.3. SAA in equines
SAA as major APP in horses (Nunokawa et al., 1993; Hultén et al., 1999; Hultén et al.,
2010; Cray, 2012; De Cozar et al., 2019; Witkowska-Piłaszewicz et al., 2019). Typical
concentrations of normal clinical status range from 0 to 20 mg/l (Nunokawa et al., 1993,
Hultén et al., 1999). Plasma concentrations of SAA has reported to increase the 100-1000
times normal range when APR is inflicted (Jacobsen and Andersen, 2010). The level of
plasma concentration is related to the size of damage affected on the tissues (Satué et al.,
2013; De Cozar et al., 2019) and can show clinically marked increase within six hours from
induction of APR (Nunokawa et al., 1993). Although a major part of SAA is produced in
the liver like other APP (Hultén et al., 1999; Gruys et al., 2005), it has been demonstrated
that it is also produced extrahepatically in variety of human tissues (Urieli-Shoval et al.,
1998). Extrahepatic production has been also proven in uterus, adipose tissue and mammary
gland of cattle (Berg et al., 2011). SAA isoforms are also secreted into colostrum with high
concentrations in equine and bovine species (McDonald et al., 2001; Orro et al., 2008).
Christoffersen et al. (2010) demonstrated that equine endometrium associated with
13
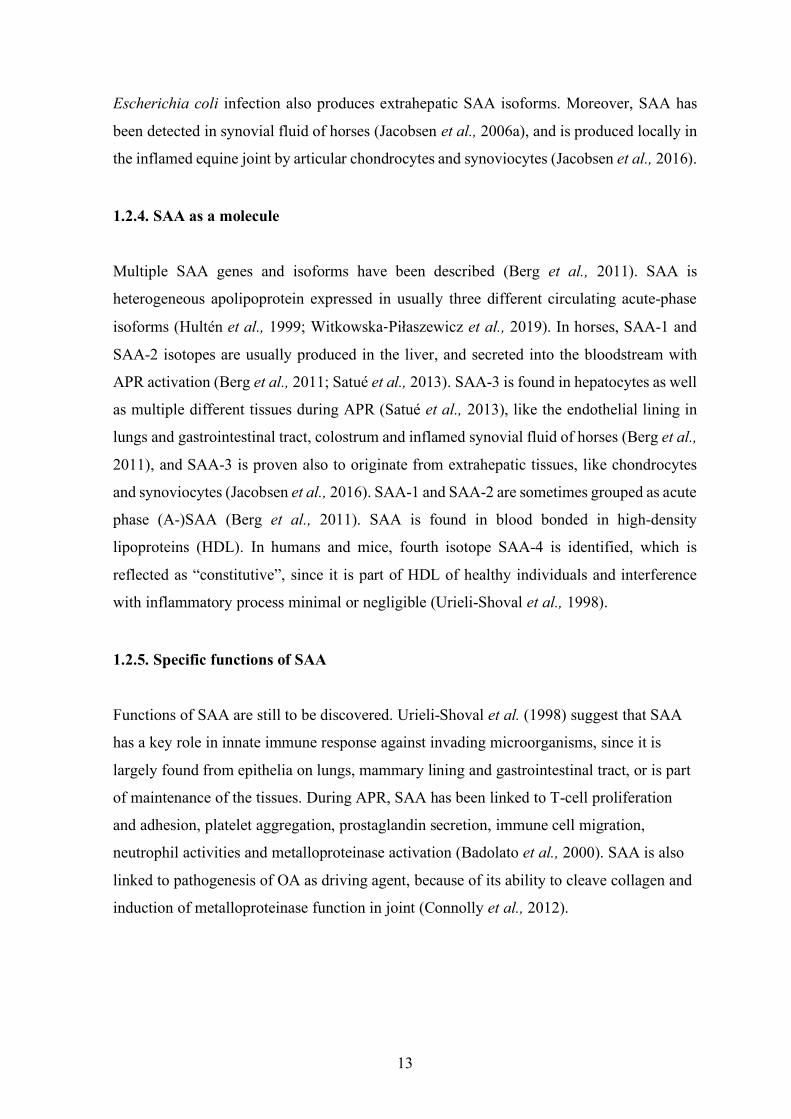
Escherichia coli infection also produces extrahepatic SAA isoforms. Moreover, SAA has
been detected in synovial fluid of horses (Jacobsen et al., 2006a), and is produced locally in
the inflamed equine joint by articular chondrocytes and synoviocytes (Jacobsen et al., 2016).
1.2.4. SAA as a molecule
Multiple SAA genes and isoforms have been described (Berg et al., 2011). SAA is
heterogeneous apolipoprotein expressed in usually three different circulating acute-phase
isoforms (Hultén et al., 1999; Witkowska-Piłaszewicz et al., 2019). In horses, SAA-1 and
SAA-2 isotopes are usually produced in the liver, and secreted into the bloodstream with
APR activation (Berg et al., 2011; Satué et al., 2013). SAA-3 is found in hepatocytes as well
as multiple different tissues during APR (Satué et al., 2013), like the endothelial lining in
lungs and gastrointestinal tract, colostrum and inflamed synovial fluid of horses (Berg et al.,
2011), and SAA-3 is proven also to originate from extrahepatic tissues, like chondrocytes
and synoviocytes (Jacobsen et al., 2016). SAA-1 and SAA-2 are sometimes grouped as acute
phase (A-)SAA (Berg et al., 2011). SAA is found in blood bonded in high-density
lipoproteins (HDL). In humans and mice, fourth isotope SAA-4 is identified, which is
reflected as “constitutive”, since it is part of HDL of healthy individuals and interference
with inflammatory process minimal or negligible (Urieli-Shoval et al., 1998).
1.2.5. Specific functions of SAA
Functions of SAA are still to be discovered. Urieli-Shoval et al. (1998) suggest that SAA
has a key role in innate immune response against invading microorganisms, since it is
largely found from epithelia on lungs, mammary lining and gastrointestinal tract, or is part
of maintenance of the tissues. During APR, SAA has been linked to T-cell proliferation
and adhesion, platelet aggregation, prostaglandin secretion, immune cell migration,
neutrophil activities and metalloproteinase activation (Badolato et al., 2000). SAA is also
linked to pathogenesis of OA as driving agent, because of its ability to cleave collagen and
induction of metalloproteinase function in joint (Connolly et al., 2012).
14
1.3. Osteoarthritis
1.3.1. Physical function of joints
Joints are essential parts of any organism with bones, since joints make movement possible.
Joints or articulations consist of bones, cartilages and capsule. Bones are joint together with
muscles, ligaments and tendons, which attribute to the overall health of joints. The joint
capsule is filled with synovial fluid, which lessens friction between the two cartilages.
Synovial fluid is produced by synoviocytes, which lines the capsule. Cartilage does not
contain vessels, which is why it is dependent on synovial components to nourish and take
care of waste material. Synovia is not only found from joint, but also within tendon sheets,
invagination’s of tendons and other compartments communicating with synovial spaces of
joint, where it functions as in joints to nourish, lubricate and manage waste. Equine joints
are susceptible to traumas due to lack of physical protection, in the sense that only protection
over joints is usually a thin layer of skin. Also, horses are fairly large and active animals,
and the sporting nature of the use of the animal predisposes joint to very large physical
forces.
1.3.2. Characterization of OA
OA is a progressive degenerative aseptic joint disease with loss of articular cartilage due to
limited ability to self-repairment. The disease is multifactorial and events leading to hall-
mark changes can be initiated in any component of the articulation (Ghasem et al., 2018).
OA is affecting 60% of horses (US Department of Agriculture, 2000). Typical picture
includes progressive loss of articular cartilage, change of the cartilage matrix, remodeling of
chondral bone and growth of bony material within the joint space (Bar-Or et al., 2015).
Metacarpophalangeal joint is most commonly affected with spontaneous OA due to its close-
fitting articular surfaces and tendency to produce linear erosions (McIlwraith et al., 2012).
Fetlocks are under intense use, which is why racehorses tend to produce there OA lesions
(Santschi, 2008). Carpal joints and lately also knee joints have observed to be affected more
frequently with OA (McIlwraith et al., 2012).

15
1.3.3. Approaches to the disease
Classically there has been two approaches to OA development.
1.3.3.1. Abnormal loading of normal joint
The first option is abnormal loading of normal joint, which is typical path with high-
performance sport horses (McIlwraith at al., 2012). In racehorses, repetitive micro injuries
accumulate and compromise the integrity of joints and bones (Santschi, 2008). Typical site
for a racehorse is fetlocks and carpal joints, since the range of motion and impaction forces
are high – cyclic trauma will create microfractures, necrosis and remodeling of the
subchondral bone (Santschi, 2008; Lacourt et al., 2012). Sclerosis of subchondral bone is
suggested to cause secondary damage to the cartilage via decreased shock absorption
capacity (McIlwraith et al., 2012). Because of the physical destruction of cells, synovia will
demonstrate damage-associated molecular patterns (DAMP) and cause local APR in the
form of acute synovitis and capsulitis, which contribute to the cartilage degradation
(McIlwraith et al., 2012; Rosenberg et al., 2017). Another route to induce the inflammation
chain on the normal joint is single high force impact to any joint component, but the
incidence has a much lower rate than accumulation trauma (Santschi, 2008; McIlwraith et
al., 2012), but even though the event of the trauma is low, a high percentage of patients with
trauma will have OA afterward. Ligamentous tears and fractures can cause instability in the
joint, which in turn causes abnormal stress to the cartilage (McIlwraith et al., 2012).
1.3.3.2. Normal loading of abnormal joint
The second option is the normal loading of abnormal cartilage. Osteochondrosis (OC) is an
interspecies disease syndrome of juvenile, growing animals, including equines (Bourebaba
et al., 2019). Disease is characterized as a failure of endochondral ossification, and abnormal
chondrocyte differentiation and is one of the most common primary causes of degenerative
joint diseases in domestic species (Bourebaba et al., 2019). The consequence of OC type
cartilage is to create osteochondrosis dissecans (OCD). OCD can manifest as fissures and
focal loss of articular cartilage and even cause loose fragments to enter joint space
(Bourebaba et al., 2019). Tarso-crural joints are typical places for OC lesions that are created
within the first year of life (Bourebaba et al., 2019). From the activation of the lesion till
manifestation as arthritis might take several years, when adequate physical challenge is

16
presented on the joint (Bourebaba et al., 2019). The five main lesions associated with OC
are subchondral fractures, subchondral cysts, wear lines/chondromalacia, osteochondrosis
with synovitis and cartilage flap (Bourebaba et al., 2019).
1.3.4. Characteristics of articular cartilage
Articular cartilage is a framework of fibrillar collagen entrapping proteoglycans (Goldring
and Goldring, 2010). Normal composition includes tissue fluid, proteoglycans and collagen
(Xia et al., 2014). Dominating fraction of the three is fluid, and fluid content in the wet mass
is up to 80%. Only cell type found in articular cartilage is articular chondrocyte, which
produces the matrix holding up the cartilage (Goldring and Goldring, 2010; Xia et al., 2014).
The major type of collagen is type II, which comprises over 80% of all collagen types
(Steinert et al., 2007). Minor collagen types found in the matrix are IX, XI which are
embedded into negatively charged proteoglycans. Collagen VI is usually found
pericellularly over chondrocytes (Steinert et al., 2007). Homeostasis of chondrocytes is
possible due to high fluid content and so can be nourished without immediate blood supply
to the cartilage (Xia et al., 2014). All supply comes from synovium, which must first diffuse
into the synovial fluid and further to cartilage. Only coordinated lysis and synthesis of
extracellular matrix (ECM) by chondrocytes can maintain the cartilage composition and
turnover. All factors affecting this equilibrium usually cause chondrocytes to favor
catabolism (Steinert et al., 2007).
1.3.4.1. Organization of cartilage
Articular cartilage is not uniform homogenous mass, but it organizes into distinct regions
from superficial to deep where the chondrocytes and ECM differ morphologically and
functionally. For example, chondrocytes in the superficial zone produce lubricin, which is
in the key role of boundary lubrication (Goldring and Goldring, 2010). Most of the
chondrocytes habituate the deeper zones and are accustomed to hypoxic stress and hypoxia
is in role with articular anabolism (Goldring and Goldring, 2010). Overall, chondrocytes
have low regeneration capacity and low metabolic activity in normal joints (Xia et al., 2014).
With aging, the chondrocytes come less resilient and due to lack of efficient waste
management, the ECM will have more advanced glycation end products (AGEs) hindering
chondrocyte survival and anabolic capacity (Goldring and Goldring, 2010).

17
1.3.5. Pathogenesis of the OA
During the early phases of OA cartilage is still intact, but the composed layers of the
chondrocytes start to differ (Goldring and Goldring, 2010, Xia et al., 2014). Due to irritation,
chondrocytes exhibit a slight proliferative phase attempting self-repair. The most commonly
observed pattern is chondrocyte clustering due to cell proliferation and conjoint change in
ECM configuration (Goldring and Goldring, 2010, Xia et al., 2014). After progress, there
starts to be evidence of increased catabolic activity. As the ECM starts to disrupt, cartilage
integrity is compromised (Xia et al., 2014). Due to poor ability to regenerate, local
inflammation and loss of homeostasis chondrocytes will first start to catabolize the ECM
and then go through apoptosis or necrosis due to hypoxic stress (Steinert et al., 2007), which
will eventually cause the cartilage to be lost. In the early phases, fibrillation and fibrillary
cartilage can be found in the area under stress (Kamm et al., 2010). Because the
chondrocytes do not migrate into damaged areas, lesions found on cartilage are usually very
patchy (Steinert et al., 2007; Lacour et al., 2012). Depending on the duration and
intervention, investigated equine joints affected with OA show different depths of
histological damage on the cartilage from barely visible cartilage differentiation to full-
thickness lesions and articular calcification (Lacour et al., 2012). After the cartilage is gone,
the joint space narrows and the subchondral bones cause friction, further mechanical
destruction and pain.
1.3.6. Molecular pathways of OA
Although synovium is not usually used in the clinical diagnosis, synovium composition is
the first compartment to be affected. When cell damage is apparent, for example due to
mechanical trauma, DAMP are released into the synovium (Rosenberg et al., 2017).
Breakdown products of ECM are OA specific DAMP, for instance fibronectin and
hyaluronan. DAMP trigger the innate immunity, aka induce APR. DAMP bind to toll-like
receptors (TLR), advanced glycated end receptors (RAGE), nucleotide-binding
oligomerization domain, leucine-rich repeat and pyrin domain-containing (NLRP3)
inflammasome on macrophages and chondrocytes, and upregulate cytokines which activate
the inflammation regulator nuclear factor-kappa B (NF-κB) (Kalaitzoglou et al., 2017;
Rosenberg et al., 2017). DAMP receptor binding is more precisely indicated in table 1. The
main cytokines in OA are IL-1" and TNF-α (Kamm et al., 2010; Jacobsen et al., 2016). In
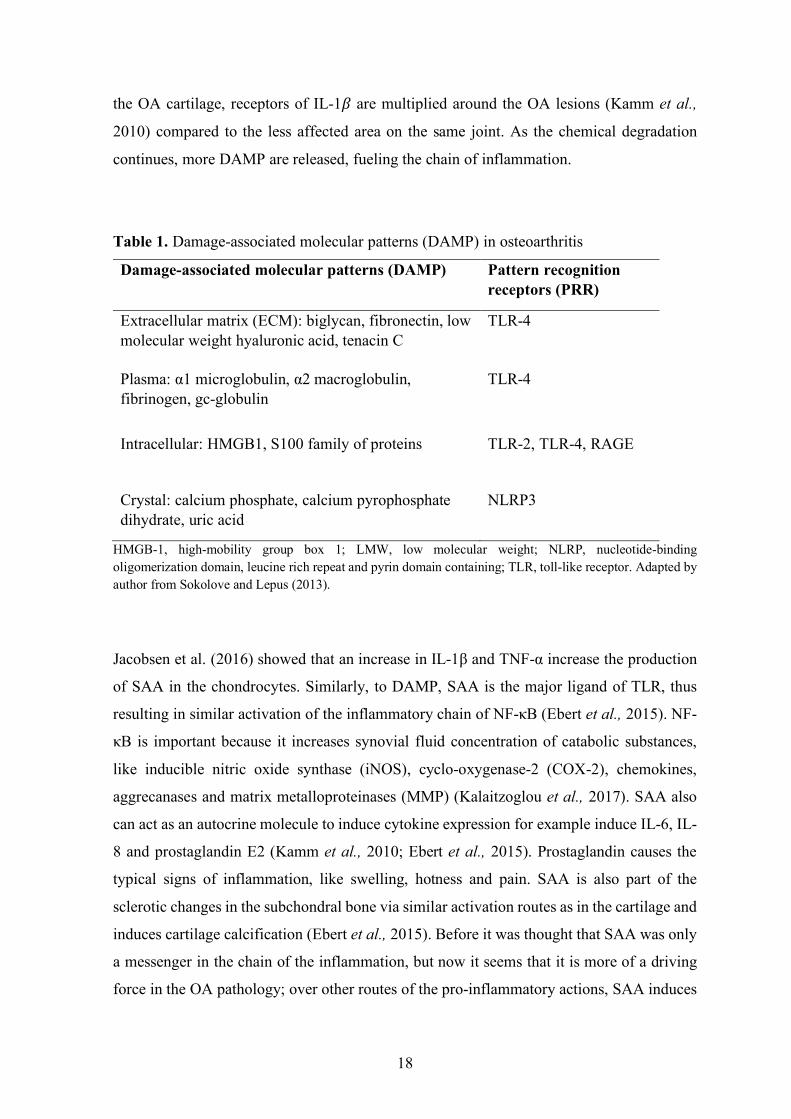
18
the OA cartilage, receptors of IL-1" are multiplied around the OA lesions (Kamm et al.,
2010) compared to the less affected area on the same joint. As the chemical degradation
continues, more DAMP are released, fueling the chain of inflammation.
Table 1. Damage-associated molecular patterns (DAMP) in osteoarthritis
Damage-associated molecular patterns (DAMP) Pattern recognition receptors (PRR)
Extracellular matrix (ECM): biglycan, fibronectin, low molecular weight hyaluronic acid, tenacin C
TLR-4
Plasma: α1 microglobulin, α2 macroglobulin, fibrinogen, gc-globulin
TLR-4
Intracellular: HMGB1, S100 family of proteins TLR-2, TLR-4, RAGE
Crystal: calcium phosphate, calcium pyrophosphate dihydrate, uric acid
NLRP3
HMGB-1, high-mobility group box 1; LMW, low molecular weight; NLRP, nucleotide-binding oligomerization domain, leucine rich repeat and pyrin domain containing; TLR, toll-like receptor. Adapted by author from Sokolove and Lepus (2013).
Jacobsen et al. (2016) showed that an increase in IL-1β and TNF-α increase the production
of SAA in the chondrocytes. Similarly, to DAMP, SAA is the major ligand of TLR, thus
resulting in similar activation of the inflammatory chain of NF-κB (Ebert et al., 2015). NF-
κB is important because it increases synovial fluid concentration of catabolic substances,
like inducible nitric oxide synthase (iNOS), cyclo-oxygenase-2 (COX-2), chemokines,
aggrecanases and matrix metalloproteinases (MMP) (Kalaitzoglou et al., 2017). SAA also
can act as an autocrine molecule to induce cytokine expression for example induce IL-6, IL-
8 and prostaglandin E2 (Kamm et al., 2010; Ebert et al., 2015). Prostaglandin causes the
typical signs of inflammation, like swelling, hotness and pain. SAA is also part of the
sclerotic changes in the subchondral bone via similar activation routes as in the cartilage and
induces cartilage calcification (Ebert et al., 2015). Before it was thought that SAA was only
a messenger in the chain of the inflammation, but now it seems that it is more of a driving
force in the OA pathology; over other routes of the pro-inflammatory actions, SAA induces
19
the production TNF-α in chondrocytes and synoviocytes (Connolly et al., 2012; Ebert et al.,
2015). TNF-α is not constantly expressed in the joint, but only when it is firstly induced or
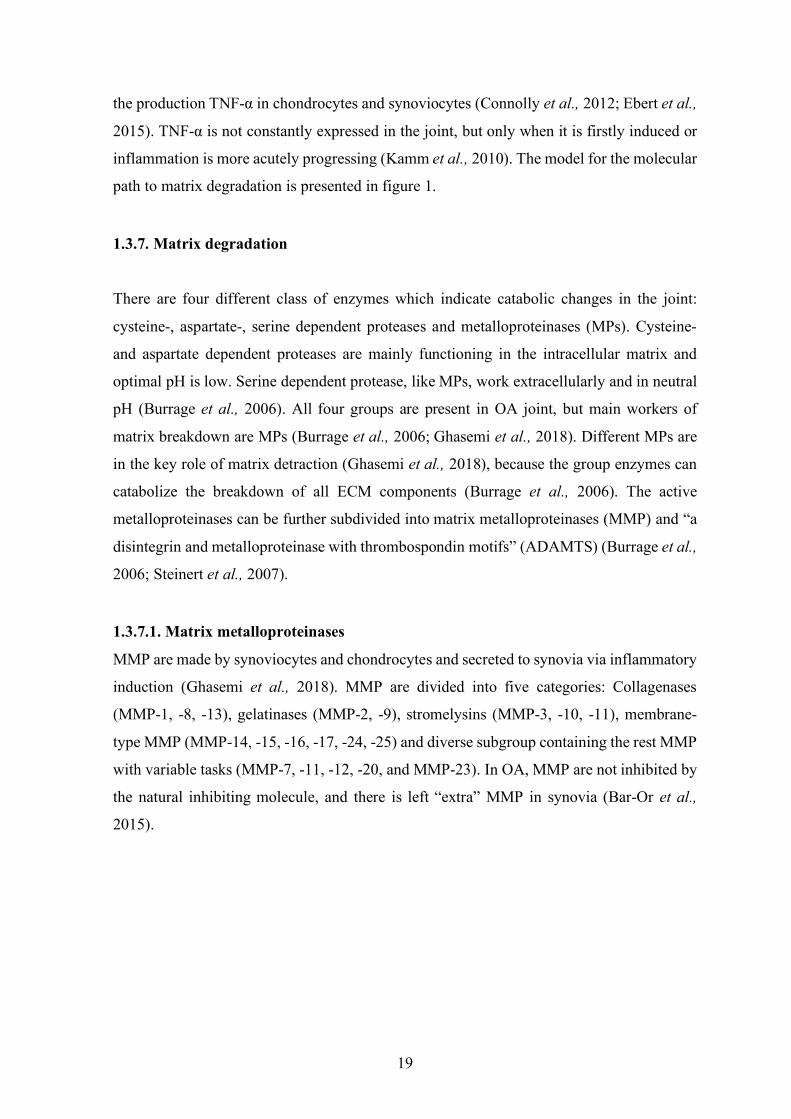
inflammation is more acutely progressing (Kamm et al., 2010). The model for the molecular
path to matrix degradation is presented in figure 1.
1.3.7. Matrix degradation
There are four different class of enzymes which indicate catabolic changes in the joint:
cysteine-, aspartate-, serine dependent proteases and metalloproteinases (MPs). Cysteine-
and aspartate dependent proteases are mainly functioning in the intracellular matrix and
optimal pH is low. Serine dependent protease, like MPs, work extracellularly and in neutral
pH (Burrage et al., 2006). All four groups are present in OA joint, but main workers of
matrix breakdown are MPs (Burrage et al., 2006; Ghasemi et al., 2018). Different MPs are
in the key role of matrix detraction (Ghasemi et al., 2018), because the group enzymes can
catabolize the breakdown of all ECM components (Burrage et al., 2006). The active
metalloproteinases can be further subdivided into matrix metalloproteinases (MMP) and “a
disintegrin and metalloproteinase with thrombospondin motifs” (ADAMTS) (Burrage et al.,
2006; Steinert et al., 2007).
1.3.7.1. Matrix metalloproteinases
MMP are made by synoviocytes and chondrocytes and secreted to synovia via inflammatory
induction (Ghasemi et al., 2018). MMP are divided into five categories: Collagenases
(MMP-1, -8, -13), gelatinases (MMP-2, -9), stromelysins (MMP-3, -10, -11), membrane-
type MMP (MMP-14, -15, -16, -17, -24, -25) and diverse subgroup containing the rest MMP
with variable tasks (MMP-7, -11, -12, -20, and MMP-23). In OA, MMP are not inhibited by
the natural inhibiting molecule, and there is left “extra” MMP in synovia (Bar-Or et al.,
2015).
20
Figure 1. Diagram showing simplified acute phase response (APR) in joint with osteoarthritis (OA). Abbreviations: IL1 - interleukin-1; TNFα - tumor necrosis factor-α; SAA - serum amyloid A; MMP - Matrix metalloproteinases; DAMP - Damage-associated molecular pattern. Adapted by author from Kamm et al. (2010), McIlwraith at al. (2012) and Ebert et al. (2015).
21
1.3.7.2. Collagen destruction
Collagen cleaving is almost exclusively mediated by MMP (Burrage et al., 2006). The major
part of the ECM of joint cartilage is made out of collagen II, which is a fibrillar triple helix
molecule. Collagenases, mainly MMP-13 make initial cleavage of the triple helix fibril in
between Gly775 and Leu776, which makes the molecule denature and lose the coiled
structure. Each collagenase can cleave the collagen triple helix, although there is some
substrate preference. Collagenases can also cleave collagen types I and III, which means the
ligaments supporting joint could be degraded by MMP as well. After collagen II is cleaved,
gelatinases further degrade the collagen/gelatin (Burrage et al., 2006). Collagen type IV is
mainly broken down by gelatinases, which comprise the basement layer of the chondrocytes
(Kvist et al., 2008).
1.3.7.3. Role of disintegrin and metalloproteinase with thrombospondin motifs
ADAMTS are a group of extracellular enzymes, which function include cleaving collagen
propeptides, inhibiting angiogenesis, and degrading cartilage proteoglycans (Porter et al.,
2005). Especially the ADAMTS-4 and -5, also known as aggrecanase-1 and -2, have been
linked into the pathogenesis of OA and TNF-alpha and IL-1beta upregulate the aggrecanases
(Porter et al.,2005; Kamm et al., 2010). It has noted that in the equine OA that when TNF-
alpha is increased, also ADAMTS-5 is highly increased in synovia (Kamm et al., 2010).
ADAMTS have role in collagen processing as procollagen N-protease (Porter et al., 2005).
1.3.8. Clinical diagnosis of OA in equines
Clinical diagnostics in equine OA start with lameness detection and grading. Typically,
assessment of lameness is varying, synovial effusion is present and there is reaction to
flexion. First-line imaging, usually radiology, reveals osteophytosis, sclerosis of
subchondral bone, occasionally cyst-like lesions and lysis in the subchondral bone, and ends-
stage joint also narrowing of the joint space (McIlwraith et al., 2012). Cartilage can be
observed with magnetic resonance imaging (MRI), which can deliver more precise
information early into the disease and provide an excellent tool for assessing joint (Smith et
al., 2016), but is rarely used due to economical restrictions. Diagnosis is usually based on
hall-mark findings of the disease.
22
In the case of OC and OCD, radiological findings are usually a way to diagnose. If possible,
computed tomography may be used to give more precise information, for example to locate
joint mice before arthroscopic removal (Lim et al., 2017).
As mentioned before, OA does not cause changes in the cartilage or the bone immediately,
but the chemical composition of synovia is usually changed drastically. Synovial sampling
is rarely used to support diagnosis, unlike in equine septic arthritis. Research to find a good
marker for realistic prognosis and progression of the disease is a hot topic in both equine and
human medicine (McIlwraith et al., 2018; Sofat et al., 2019).
1.4. Conclusions of literature review
Equine aseptic joint diseases are a large group of conditions with heterogeneous origins with
all the same result: OA. OA is driven by low-grade inflammatory response in the affected
joint and cause progressive, irreversible destruction of the joint. APR is part of the innate
immunity and is responsible for the molecular changes in the synovial fluid as well as the
systemic circulation. APR is communicating with cytokines and APP, which work as
messengers and activate extracellular matrix degradation factor within the synovial
compartments. Investigation of APP concentration in the OA joint might reveal new
unpursued clinical applications like early diagnostic markers and effective interventions.
Especially SAA has proven to be very central to the pathogenesis of OA and thus be a
potential marker protein of the future OA patients. More research is required to set standards
for SAA to further implicate it to clinical use.
23
2. AIM OF THE STUDY
Aim of this study was to investigate SAA concentrations synovial samples from horse joints
with different articular pathologies and compare these results to the synovial samples from
joints without pathologies. Additionally, synovial SAA concentrations were compared
between lame and sound horses.
24
3. MATERIALS AND METHODS
3.1. Animals and samples
The animals of the present study were client-owned and presented to the equine clinic in
Western-Finland and municipal practice in Northern-Finland. The samples were collected
both from orthopedic patients and euthanized patients in the period of 3 years starting from
autumn 2016 lasting to autumn of 2019. Horses with lameness of aseptic joint disease origin
and who were scheduled to have articular surgery or puncture were selected to the study
group. Control group included patients euthanized for other reasons than orthopedic
problems, or clinically healthy joints sampled on orthopedic patients. A total of 21 synovial
fluid samples were collected. The collection and data surveys (Appendix 1) was done by
attending veterinarian. Attendance to study was on a volunteer basis and all samples were
collected with owners’ consent.
3.1.1. Inclusion criteria for study group
Horses which needed the intervention of aseptic joint disease were enrolled to study group.
Aseptic joint disease pathology should be based on anamnesis, palpation, lameness
examination, local blocks and imaging. All horses included in the study group should be
spontaneously lame or reacted positively to the flexion test.
3.1.2. Diagnosing joint pathologies
When diagnosing orthopedic problems, all started with the evaluation of the horse standing
afar. Then the horse was clinically examined and joints palpated. Typical signs of
inflammation, like heat, redness, swelling and pain was detected by palpation. Then patients’
gait was evaluated.

25
Aseptic joint diseases all have a common factor of causing pain and loss of normal function
due to it. Usually the level and origin of pain are evaluated by assessing patients’ gait
deviation from normal. Because every patient and veterinarian are individual, standardized
lameness scoring is used to reduce the subjectivity of the evaluator. The lameness scale used
in this study is presented in table 2.
Table 2. Description of used scale for lameness (L-score)
L-score Description
0 Lameness not perceptible under any circumstances
1 Lameness is difficult to observe and is not consistently apparent, regardless of
circumstances
2 Lameness is difficult to observe at a walk or when trotting in a straight line but
consistently apparent under certain circumstances (e.g. weight-carrying,
circling, inclines, hard surface, etc.)
3 Lameness is consistently observable at a trot under all circumstances
4 Lameness is obvious at a walk
5 Lameness produces minimal weight bearing in motion and/or at rest or a
complete inability to move
If the hypothesized location of pain was not clear or otherwise not readily apparent
pathologies wanted to be found, a flexion test was performed on the joints of interest to get
a marked reaction on the pathologic one. When there was a clear perception of location, this
hypothesis was to be tested by performing diagnostic nerve and joint blocks. When the site
of pain was clear, imaging was used to define the reason for lameness. Arthritis and
osteochondrotic lesions were diagnosed with radiographic findings.
Meniscal tears are hard to diagnose without physically opening the joint. These cases were
identified with radiographic changes and specialized ultrasound examination was performed
after lameness examination and positive local nerve blocks. Enrolled horses were scheduled
for surgical removal of torn material and thus diagnosis was always confirmed.

26
3.1.3. Inclusion criteria for control group
Patients that were to be euthanized without systemic, severe infectious or inflammatory
disease can donate control synovial sample from joint deemed clinically normal. The initial
control group included three euthanized horses. Two of the horses were euthanized due to
eye disease, and the third was euthanized due to severe meniscal tear in one stifle joint.
Control samples were taken from joints, which were determined clinically healthy based on
clinical examination and anamnesis. All control horses submitted more than one sample,
originating from different joints. One horse, horse 8 gave samples both for control and study
group.
3.1.4. Synovial sampling and storage
Synovial samples were collected in an aseptic manner co-joined with intra-articular
interventions of disease. Tapping the joint was performed with needle and synovia either
dripped free flow or was aspired to syringe. Control samples were collected after euthanasia.
All samples were transferred to the identified Eppendorf tube and frozen within 4h of
sampling. Storage temperature was held below -20°C until laboratory analysis.
3.2. Description of study population
A total of 12 horses were enrolled in the study. Enrolled horses were allocated to the study
or control group by the inclusion criteria. The study group included 11 samples which were
collected from 10 horses allocated to the pathologic group. Horse 8 donated samples on two
different occasions for the pathologic group. The control group consisted of 8 samples,
collected from 3 horses. The survey was conducted by attending veterinarians at enrolment.
The collected data consisted of age, gender, lameness score, affected joint, study group
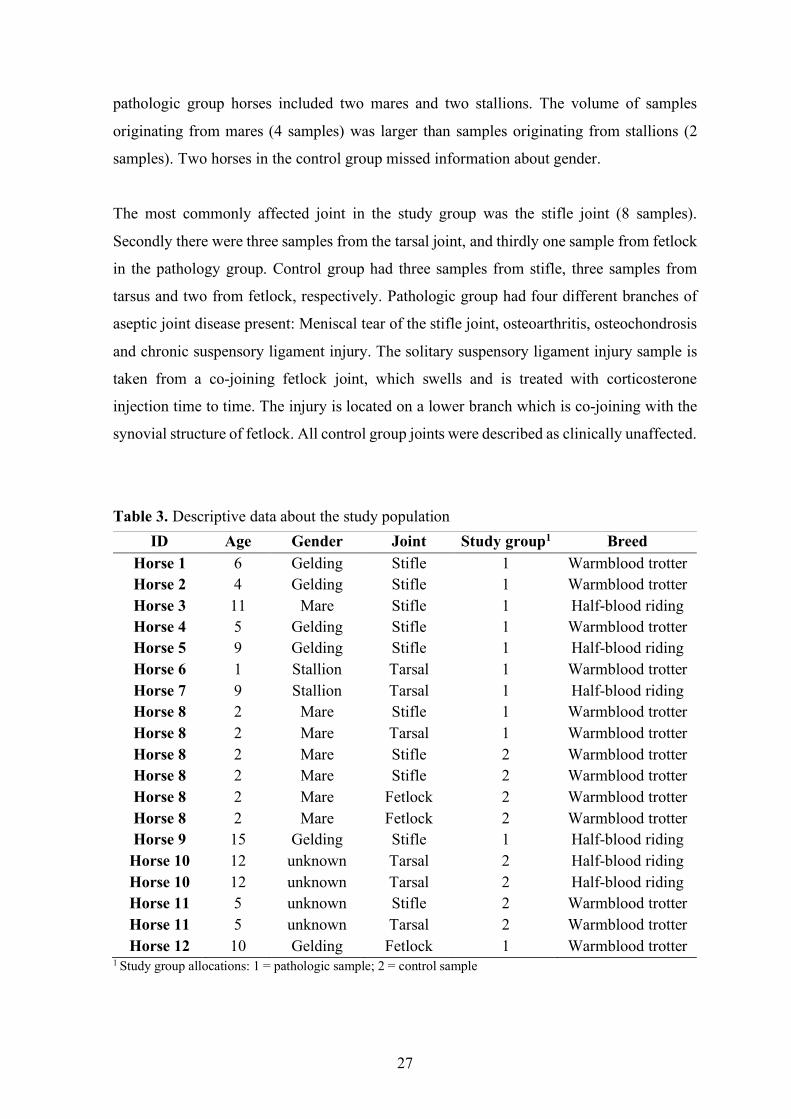
allocation and diagnosis. Descriptive data about the enrolled animals are presented in table
3.
The age of the study subjects varied from 1 year to 15 years old. The average age was 6.7
years. The most prevalent gender in the pathologic group was gelding (n = 6). Other
27
pathologic group horses included two mares and two stallions. The volume of samples
originating from mares (4 samples) was larger than samples originating from stallions (2
samples). Two horses in the control group missed information about gender.
The most commonly affected joint in the study group was the stifle joint (8 samples).
Secondly there were three samples from the tarsal joint, and thirdly one sample from fetlock
in the pathology group. Control group had three samples from stifle, three samples from
tarsus and two from fetlock, respectively. Pathologic group had four different branches of
aseptic joint disease present: Meniscal tear of the stifle joint, osteoarthritis, osteochondrosis
and chronic suspensory ligament injury. The solitary suspensory ligament injury sample is
taken from a co-joining fetlock joint, which swells and is treated with corticosterone
injection time to time. The injury is located on a lower branch which is co-joining with the
synovial structure of fetlock. All control group joints were described as clinically unaffected.
Table 3. Descriptive data about the study population
1 Study group allocations: 1 = pathologic sample; 2 = control sample
ID Age Gender Joint Study group1 Breed Horse 1 6 Gelding Stifle 1 Warmblood trotter Horse 2 4 Gelding Stifle 1 Warmblood trotter Horse 3 11 Mare Stifle 1 Half-blood riding Horse 4 5 Gelding Stifle 1 Warmblood trotter Horse 5 9 Gelding Stifle 1 Half-blood riding Horse 6 1 Stallion Tarsal 1 Warmblood trotter Horse 7 9 Stallion Tarsal 1 Half-blood riding Horse 8 2 Mare Stifle 1 Warmblood trotter Horse 8 2 Mare Tarsal 1 Warmblood trotter Horse 8 2 Mare Stifle 2 Warmblood trotter Horse 8 2 Mare Stifle 2 Warmblood trotter Horse 8 2 Mare Fetlock 2 Warmblood trotter Horse 8 2 Mare Fetlock 2 Warmblood trotter Horse 9 15 Gelding Stifle 1 Half-blood riding
Horse 10 12 unknown Tarsal 2 Half-blood riding Horse 10 12 unknown Tarsal 2 Half-blood riding Horse 11 5 unknown Stifle 2 Warmblood trotter Horse 11 5 unknown Tarsal 2 Warmblood trotter Horse 12 10 Gelding Fetlock 1 Warmblood trotter
28
3.2.1. Description of control group
The two horses included in the control group were euthanized due to complicated eye
disease. Anamnesis or diagnostic descriptions were not submitted with these individuals,
because they fit in the initial inclusion criteria for the control group. Eye disease in equines
can persist a very long time, and some horses do not respond to treatment, after which
options are surgical enucleation or euthanasia. It is not known, whether these horses were
trial treated topically for a long period before euthanasia, but is the most likely scenario.
Horse number 8 gave samples for both pathologic group and non-pathologic group. Horse
no 8 originally had osteochondrotic lesion in the tarsal joint, which was sampled and locally
treated. Other joints were also investigated intensely compared to eye-diseased counterparts.
Somewhat later on the same year, the horse no 8 got also meniscal rupture of the stifle, which
was severe enough to be the cause of euthanasia for this horse. The stifle joint was sampled
on the onset of the lameness, and the patient was followed for a short period in hopes of
improvement. No improvement was observed after which the horse was euthanized and
joints deemed healthy were sampled after euthanasia.
3.3. Laboratory analysis
SAA concentrations of the synovial samples were determined by using a commercially
available analysis kit (PhaseTM Range Multispecies SAA Elisa, Tridelta Development Ltd,
Ireland). Assay is based on chromatographic change of the reagent wells on identifying the
tested substance. This kit uses a method referred to as “sandwich” ELISA-method.
Manufacturer instructions for equine serum and plasma samples were used.
All samples were thawed to room temperature before analysis. Initially dilution 1:100 was
used for all synovial samples. Two samples results were over the highest standard (2.0 mg/l
with dilution 1:100) and these samples were re-assayed using sample dilution 1:50. The
results were read with a spectrophotometer at 450 nm, using 630 nm as reference. The
detection limit of the assay was 0.1 mg/l (reported by the manufacturer for serum samples).
29
3.4. Statistical analysis
Initially synovial SAA concentrations were compared between joint pathology groups.
Synovial samples were dived into five groups according to the joint pathologies (table 4 and
figure 2). Samples from horses 1, 2, 5, 9 and 12 (solitary sample of suspensory ligament
injury of horse 12) were included in the osteoarthritis group (n = 5). Horse 2 had a
combination pathology of osteoarthritis and meniscal tear. This case was handled more as
osteoarthritis as it was the most acute problem of this horse. Samples from horses 3, 4 and 8
were included in a group of meniscal tears (n = 3). Osteochondrosis lesions were found from
horses 6, 7 and 8 forming third group. Four samples from 2 horses euthanized due to eye
disease (horses 11 and 12) were treated as a separate group. Non-parametric Kruskal-Wallis
test followed by Tukey post-hoc pairwise comparison was used to compare synovial SAA
concentrations between described joint pathology and no-pathology groups. Wilcoxon rank-
sum test was used to compare no pathology group (n = 4) with all joint pathology synovial
samples (expect 4 samples from horses 11 and 12; n = 11).
Synovial samples were also divided into 4 groups by lameness score (L-score)(table 4 and
figure 3). These groups were sound group (n = 6), L-score 1 (n = 3), L-score 2 (n = 4) and
L-score 3 (n = 2). Horses 11 and 12 samples were excluded from this analysis and the
Kruskal-Wallis test followed by Tukey post-hoc pairwise comparison was used to compare
the groups’ synovial SAA concentrations. Wilcoxon rank-sum test was used to compare no
lameness group samples (n = 6) with all samples from L-score 1, 2 and 3 groups (n = 9).
Samples from horses 11 and 12 were not included in this analysis.
Statistical software WINKS SDA 7.0 (TexaSoft, Cedar Hill, USA) was used for described
nonparametric tests. The level of significance was set at 5% (p ≤ 0.05).

30
4. RESULTS
Concentrations of SAA were detected from both the study group and the control group (table
4). Synovial SAA concentrations in all samples and lameness scores by joints are presented
in table 4. All horses in the study group were determined lame spontaneously, or had a
positive flexion test. Only two horses administered in the study group were not
spontaneously lame and both of those horses had osteochondrosis lesions.
Table 4. Synovial serum amyloid A (SAA) concentrations found in samples, presented with lameness score and joint pathology
ID Joint L-score SAA mg/l Joint pathology Horse 1 Stifle 2 0.31 Osteoarthritis Horse 5 Stifle 1 0.60 Osteoarthritis Horse 9 Stifle 2 0.43 Osteoarthritis Horse 2 Stifle 1 0.10 Osteoarthritis, meniscal tear
Horse 12 Fetlock 2 0.31 Chronic suspensory injury1 Horse 3 Stifle 3 0.61 Meniscal tear Horse 4 Stifle 1 0.44 Meniscal tear Horse 8 Stifle 3 0.36 Meniscal tear Horse 6 Tarsal 0 0.20 Osteochondrosis Horse 7 Tarsal 2 0.19 Osteochondrosis Horse 8 Tarsal 0 0.28 Osteochondrosis Horse 8 Stifle 0 0.14 No pathology Horse 8 Stifle 0 0.15 No pathology Horse 8 Fetlock 0 0.10 No pathology Horse 8 Fetlock 0 0.22 No pathology
Horse 10 Tarsal 0 0.40 No pathology2 Horse 10 Tarsal 0 0.72 No pathology2
Horse 11 Stifle 0 3.24 No pathology2
Horse 11 Tarsal 0 3.13 No pathology2
1 Horse 12 was allocated into group osteoarthritis due to nature of the pathology, which is similar to osteoarthritis 2 Samples were excluded from the statistical analysis, since the horses 10 and 11 are likely to have acute phase response systemically from the stress and pain caused by ocular disease

31
Synovial SAA concertation varied within the study group from smaller than the detection
limit of 0.10 mg/l to 0.61 mg/l. All the horses can be divided into smaller populations by
pathology group; Arthritis, meniscal tear, osteochondrosis and no-pathology. In the arthritis
group (n = 5), horse 2 had a result of 0.10 mg/l which could be interpreted as a value under
the detection limit. Other horses gained higher values, scoring values from 0.31 mg/l to 0.60
mg/l. All samples with osteoarthritis diagnosis originate from the stifle, except for one
sample from the fetlock joint of horse 12. The osteoarthritis group had the largest range of
results in the samples. In the meniscal tear group (n = 3) results had a range from 0.36 to
0.61 mg/l. The lamest horses were found in the meniscal tear group. Osteochondrosis group
(n = 3) results were more homogenous and varied from 0.19 mg/l to 0.28 mg/l (table 4, figure
2).
Figure 2. Synovial concentrations of serum amyloids A (SAA) by joint pathology groups: 0 - no pathology; 1 - osteoarthritis; 2 - meniscal injury; 3 - osteochondrosis; 4 - no pathology, euthanasia due to eye disease.
Control group involved 3 horse individuals and eight samples. Two horses, both euthanized
due to eye disease, got relatively high concentrations in all samples. Synovial SAA
concentrations in two tarsal joints from horse 10 were 0.40 mg/l and 0.72 mg/l. The SAA
concentrations in two samples from the horse 11 had the highest results of the study (3.24
mg/l and 3.13 mg/l in stifle and tarsal joints respectively). Because of the highest
0 1 2 3 40.0
0.2
0.4
0.6
0.8
1.02.03.04.0
Single horses
Horse nr 10Horse nr 8
Horse nr 11
Joint pathology group
Syno
vial
SAA
(mg/
l)

32
concentrations, these 4 samples were grouped into a separate study group (no pathology,
euthanasia due to eye disease group, figure 2) and were not considered as control samples.
The rest of the control samples (no pathology group) consisted of horse 8 synovial fluid
samples (n = 4), which had relatively low concentrations of SAA. Horse 8 had 2 samples,
both from stifle and 2 samples both from fetlock joints, with an average concentration of
0.15 mg/l. The lowest value in this group was 0.10 mg/l, and this result should be interpreted
as below detection limit (table 4).
Overall Kruskal-Wallis test was significant (p = 0.014) when all joint pathology groups’
synovial SAA concentrations were compared. In post-hoc pairwise comparison only
significant difference was between no pathology and no pathology, euthanasia due to eye
disease group (p ≤ 0.05). There was a significant difference (p = 0.037) when comparing
synovial SAA concentrations between joint pathologies (all pathology groups, n = 11) and
no pathology group (n = 4, samples from two horses euthanized due to eye disease were not
included in this comparison) with Wilcoxon rank-sum test (figure 2).
Figure 3. Synovial concentrations of serum amyloids A (SAA) by lameness score (L-score): 0 = no lameness; 1 - lameness is difficult to observe, not consistently apparent; 2 - lameness is difficult to observe at a walk or when trotting in a straight line but consistently apparent under certain circumstances; 3 - lameness is consistently observable at a trot under all circumstances. Results from two horses euthanized because of chronic eye problem are not presented.
0 1 2 30.0
0.1
0.2
0.3
0.4
0.5
0.6
0.7Single horsesHorse nr 8
L-score
Syno
vial
SAA
(mg/
l)

33
There were no significant differences when synovial SAA concentrations were compered
between L-score groups (figure 3). Significant difference was if SAA concentrations in L-
score 0 group (n = 6) were compared with all lame horses (n = 9) samples (Wilcoxon rank-
sum test, p = 0.034).
34
5. DISCUSSION
Equine OA and conditions leading to it are a common problem. The United States
Agricultural Department (2000) estimated that 60% of horses are affected by OA of different
origins, which is very high morbidity for a single pathology. The problems leading to high
morbidity lies in the changed purpose of horses, which nowadays are more high performing
athletes than companion or production animals. Similarly, it has been found that more and
more foals are diagnosed with congenital joint diseases like OCD (Wilson, 2012; Bourebaba
et al., 2019). Highest morbidities are found within restricted gene pools of closed horse
breeds like Arabic horses and quarter horses (Steel et al. 2019). Rising morbidity is implied
to be affected by narrowing of the genepool of young high performing horses, also (Russel
et al., 2016).
OA requires sensitive marker (Jacobsen et al., 2006b) and the possibility of SAA being one
was charted in this study. The main aim of this study was to investigate whether SAA
concentration would significantly differ in OA-joint from a healthy joint and if the clinical
appearance of the joint, interpreted as lameness score, would reflect to the concentrations.
SAA has established a good status being a marker of inflammation in joints (Connolly et al.,
2012; Jacobsen et al., 2016). Strong evidence is gaining how SAA is contributing to the
chain of the pathology rather than just being an innocent bystander (de Seny et al., 2013;
Jacobsen et al., 2016). Previously SAA measurement in synovia has been proven to be a
useful tool for differentiating septic joint infections from aseptic joint inflammation in
equines (Jacobsen et al., 2006b, Robinson et al., 2017). Even though the non-induced aseptic
pathologies have been studied in the same study, used test have been too robust to measure
difference between aseptic pathologies and non-pathologic joint.
Handling of the OA patients is a conundrum. Visibility of the destruction will come apparent
in radiographs after the bony structures are already exposed and cartilage is severely
destroyed. Cartilage has a poor ability to self-repair, which is why the disease progression is
hard to hinder or reverse. With early diagnosis and intervention of the OA there would be a
35
possibility to slow down the progression and thus avoid cartilage damage, which is why the
idea of creating a new tool for prognosis and monitoring of the aseptic inflammation in the
joints is intriguing. Of course, this would require a normalized scale to be used as a reference
(Jacobsen et al.,2006b). A scale of a normal joint and a diseased one would provide an easier
decision whether to intervene in a joint or not. Additionally, it could be used as a prognostic
indicator for other synovia related diseases, like meniscal tear. The definitive diagnosis of
meniscal tear of the stifle joint is impossible without keyhole arthroscopy (Dubuc et al.,
2018). Invasive procedure cause inflammation and trauma on the synovial membrane, which
has the inevitable consequence of arthritis (Allen and Kold, 1988; Dubuc et al., 2018). By
evaluating the inflammatory status of the synovial cavity, stronger evidence and confidence
can be established to perform the surgery.
Previous findings in equine and human joints (Jacobsen et al., 2010; Sokolove et al., 2013;
Jacobsen et al., 2016; Bourebaba et al., 2019) suggested that SAA will be found in synovia
of aseptically inflamed joint. Although the kit used in this study is meant for serum, it is
justified to be used with the synovial fluid as well and the results are reliable. This study
gives good insight that measurable amounts of SAA can be present in the joints, as most of
the samples did demonstrate. One sample of the study group and one from the control group
had a result of 0.10 mg/l. These should be interpreted as lower than the detection limit since
the sensitivity of the assay used in the study was 0.10 mg/l. Still, the small sample size might
have not revealed the underlying problems of using this kit, which is why results are to be
trusted with caution.
Largest challenge in the study was to collect suitable samples. As said before, aseptic joint
diseases are very common. Too often lame horses, other than high performance athletes, are
not radiographed and diagnosis is only presumed. Large-scale study should be conducted in
a clinical setting with larger patient inflow, owners committed to diagnostics and
veterinarians skilled to perform them and interventions required. Control samples were even
harder to obtain. Full orthopedic diagnostic procedure and exclusion of pathology in the
sampled joints are not economically and ethically feasible because the control subjects are
to be euthanized. Moreover, the euthanized horses are stressed, diseased and might have
APR systemically affecting the results from synovial samples. For these reasons study
population in the study was unfortunately very restricted in size and thus the results cannot
be interpreted as statistical evidence. Restricted sample size and narrow scale of

36
concentration of SAA found in the samples would require a large sample size to be able to
show a significant difference. In the statistical analysis, all samples were handled as
independent from each other, but since there were multiple samples from some individuals
this conjecture is not fully correct.
This brings us to question of the horses 10 and 11. These horses were euthanized due to eye
disease unresponsive to treatment. Both horses gained very high results in all synovial
samples, the results of these horses can be viewed in figure 2. In both cases, a similar level
of results were obtained from two different asymptomatic joints within the same individual.
It is highly unlikely to get high results by local production of SAA within the joint without
septic involvement (Jacobsen et al., 2006b) and even more unlikely to get similar levels in
both sampled joints with separate pathology. These results should thus be interpreted as
systemic APR involvement in the synovia, rather than local inflammation. Equine as flight
animals depends on the vision very much and it could be concluded that loss of sight causes
very high stress to the animal. Ocular injuries are also very painful. This combination can
very much be enough to initiate APR in horse. Samples from horses 10 and 11 were thus
excluded from aseptic joint pathology statistical analysis, since the condition of these horses
was systemically affecting the joint cavity. These horses are perfect example of error which
can be obtained by using euthanized animals in the control group.
Rest of the control samples originated from horse 8. Horse number 8 is a very interesting
individual in this study. Within the same individual we have samples from OC joint,
meniscal tear in stifle joint and multiple normal control samples. The OC lesion was first
pathology diagnosed and sampled in this horse. All sites commonly affected by OC were
radiographed and examined after the first lesion was found. Thus, the horse 8 was very well-
investigated compared to horses 10 and 11. All the control samples taken from horse 8 had
similar low results. Horse 8 has thus strong evidence that the joints categorized as unaffected
by pathology match that description and the samples were used as a controls for other horses.
Ideally, all study group samples should have a matching sample from a healthy joint. Best
comparison is always a sample from the same patient, because it limits possible variables
caused by individual differences. With horse number 8, we can cross-reference the study
samples and control samples without the error caused by variables. Pathologic samples
obtained from horse 8 had a higher concentration of SAA than the unaffected joints did,
which does support the study hypothesis.

37
The rest of the study population included four different pathologies: OA, stifle meniscal tear,
OC lesions and chronic suspensory ligament injury with fetlock swelling and lameness. All
of these pathologies can be included in the aseptic joint diseases and all of these cause pain
and inflammation in the synovial compartment (Dubuc et al., 2018; McIlwraith et al., 2018;
Bourebaba et al., 2019).
The group of osteoarthritis samples and meniscal tear samples had very similar results. Both
groups had higher values than the control samples on average. The nature of both pathologies
is related to trauma and destruction of cells within the synovial compartment. This is a very
predictable trend since, as mentioned before in the literature review, SAA production is
strongly triggered by exposed cell components (Rosenberg et al., 2017). The meniscal tear
could have even higher values because it is a pronouncedly acute and traumatic event to the
synovial compartment, but in this study such spiked values were missed. The reason could
lie in the anatomy of the equine stifle. It is a very stable structure and the meniscal tear can
persist in the joint for some period before signs get alarming the owner. This could slow the
process of getting diagnosis or interventions, which is why the local APR and top APP values
have passed before sampling.
Osteoarthritis is a disease in which the inflammation cycle is going on all the time but has
variation in the intensity of the signs (Kamm et al., 2010). OA in horses is treated with anti-
inflammatory medications and the most common intervention is the intra-articular injection
of corticosteroids to suppress the inflammation and signs. In the osteoarthritis group the
lameness and other signs of inflammation are especially important because the signs indicate
that inflammation is active. If animals would have been included in the OA group only based
on radiographic findings, the possible effect of past treatments might have played a role in
the results. The interesting deviation from the results can be seen with the horse 2 sample.
The horse with both OA and meniscal tear was only subtly lame and had concentration of
SAA under detection limit, which raises the question was this horse treated with
corticosteroids intra-articularly close before sampling. This cannot be known for sure, but
yet again the clinical picture corresponded to SAA concentration within the synovial cavity.
All horses that were involved in the OA group were spontaneously lame, which reflect also
higher scores of SAA in the other than horse 2.

38
From the lameness dot analysis (figure 3) we can see that more lame horses had higher scores
of SAA. Pain and inflammation go hand in hand (Zhang et al., 2007) and SAA would seem
to follow that trend. A combination of severe clinical picture and traumatic pathology
produced the highest SAA concentrations in the synovial compartments in this study.
Systemic inflammation and stress give of course higher SAA results (Jacobsen and
Andersen, 2010), but this is most probably due to liver-origin SAA that is transported
throughout the body. To minimize the error of having to be sure that the animal is not having
concurrent systemic APR, all horses should have been also tested with SAA samples from
the serum (Witkowska-Piłaszewicz et al., 2019). These samples were not taken, because
orthopedic patients are rarely investigated with blood analysis and blood collection for study
purposes only is not justified from the ethical point of view. The way around this issue could
have been found in the analysis of synovial samples: systemic reaction is lacking probably
the extra-hepatic form of SAA which is theoretically more important in the local pathology
of the joint (Jacobsen et al. 2016), than hepatic SAA. Unfortunately, the kit used in this study
could not differentiate between extrahepatic SAA-3 and hepatic origin SAA-1 or SAA-2. By
separating these isoforms, it might have been easier to differentiate systemic effects from
local inflammation. Evidence is lacking whether synoviocytes produce SAA-3 in systemic
APR as well, since the exact details within the joint during systemic APR is not fully known.
This would be an interesting topic for further investigations.
Notably lower levels of SAA were found from OC group than from other investigated groups
with pathologies. This is an interesting finding, because generally in patients with OC lesions
like subchondral cysts, joint mice, cartilage flaps and joint wear lines seem to have a very
variable clinical picture (Steel et al., 2019). The findings raise a question, does the presence
of OC lesion cause inflammation in the joint per se? OC lesions are formed with
multifactorial origin and the adverse effect of these lesions is variable (Steel et al.,2019;
Bourebaba et al., 2019). The group with OC in this study did not generally exhibit severe
spontaneous lameness, although one of the horses had scored as high as 2. OC results were
very homogenous within the group. There was a trend of OC joints having higher SAA
concentrations than the comparison in the controls. Again, interpretation must be done
carefully because of the small sample size. This finding could suggest that the presence of
the OC lesions is not equivalent to active joint inflammation but subclinical inflammation is
smoldering in the joint. I hypothesize that with a larger sample size, a significantly higher
SAA concentration could be found when compared to normal joint controls. In individuals

39
with OC, the lesion could be considered a risk factor in the future to create a clinical
inflammation and cause of OA in the joint.
Horse number 12 was an interesting addition to the otherwise classical aseptic synovial
diseases since the suspensory ligament is not usually thought of as part of the synovial
compartment. The horse 12 had several years old suspensory ligament branch injury, which
caused intermitted lameness from time to time. Generally, the lameness was associated with
fetlock joint swelling in the patient which is why the fetlock joint was tapped and treated
with corticosteroids. The suspensory ligament (Musculus interosseous medius) runs distally
in the metacarpal /-tarsal region, arising from third metatarsal bone and distal row or carpal/
tarsal bones. In the distal quadrant of metacarpus/-tarsus, the suspensory ligament bifurcates
into the medial and lateral branch. The branches insert into proximal sesamoid groove,
intersesamoid groove, and partially blend into long extensor tendon. The primary insertions
are part of the metacarpo-/metatarsophalangeal joint capsule and are considered subsynovial
structures (Minshall et al., 2010). Injury of the synovial membrane will cause strong
inflammatory reaction in the joint, and OA in long run (Rosenberg et al., 2017). Thus,
articular involvement should be suspected with a suspensory ligament injury. This is why
the horse 12 was handled as part of OA group in the statistical analysis. In this study, only
one fetlock with suspensory injury was tested. The SAA concentration was higher than the
compared control sample from the fetlock of horse 8. More samples are required to acquire
a stronger conclusion concerning the pathology and SAA.
Although statically findings are not significant and statistical analysis has other issues like
mentioned before, some trends could be carefully established from the results: Pathology in
the joint associated with physical damage on the joint structure, like meniscal tear and OA
produced highest concentrations of SAA. Although OC samples had only moderate amounts,
healthy counterparts had even lower amounts.
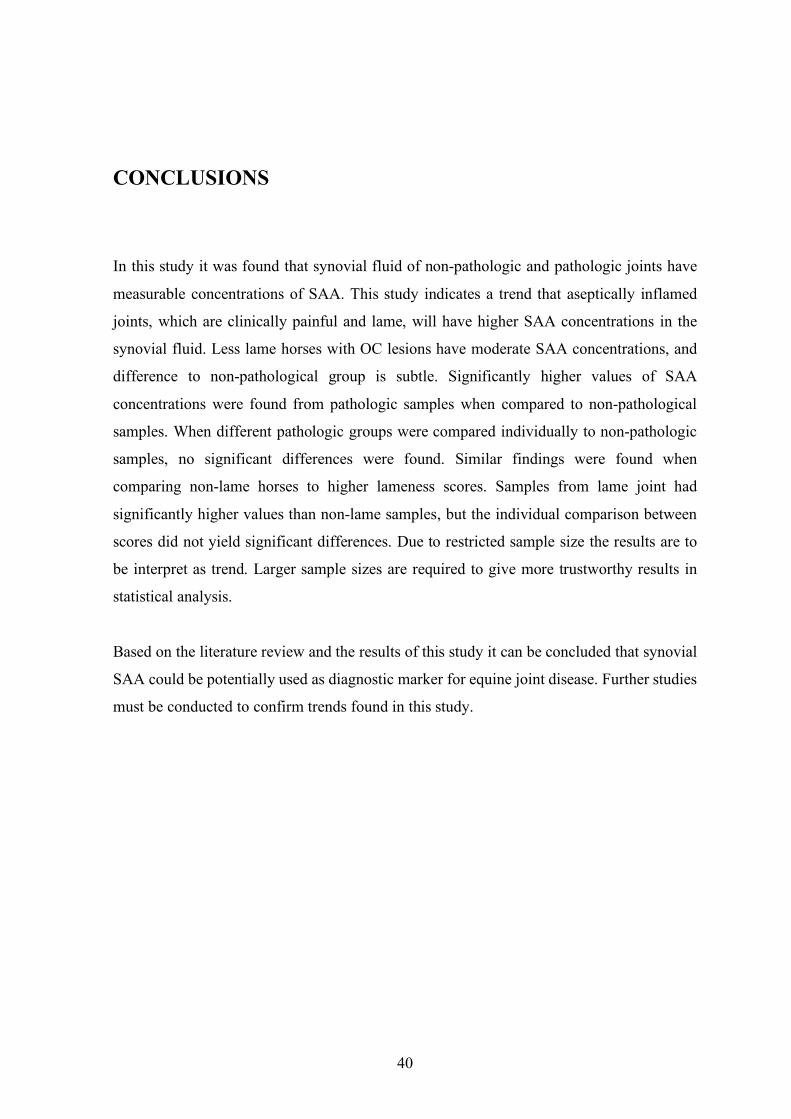
40
CONCLUSIONS
In this study it was found that synovial fluid of non-pathologic and pathologic joints have
measurable concentrations of SAA. This study indicates a trend that aseptically inflamed
joints, which are clinically painful and lame, will have higher SAA concentrations in the
synovial fluid. Less lame horses with OC lesions have moderate SAA concentrations, and
difference to non-pathological group is subtle. Significantly higher values of SAA
concentrations were found from pathologic samples when compared to non-pathological
samples. When different pathologic groups were compared individually to non-pathologic
samples, no significant differences were found. Similar findings were found when
comparing non-lame horses to higher lameness scores. Samples from lame joint had
significantly higher values than non-lame samples, but the individual comparison between
scores did not yield significant differences. Due to restricted sample size the results are to
be interpret as trend. Larger sample sizes are required to give more trustworthy results in
statistical analysis.
Based on the literature review and the results of this study it can be concluded that synovial
SAA could be potentially used as diagnostic marker for equine joint disease. Further studies
must be conducted to confirm trends found in this study.

41
ÜLDKOKKUVÕTE
Sünoovia seerumi amüloid A (SAA) kui võimalik diagnostiline marker
hobuse degeneratiivsete liigesehaiguste korral
Erinevate aseptiliste põhjustega liigesehaigused on hobustel väga levinud. Üheks selliseks
liigesehaiguseks on osteoartriit (OA) mida iseloomustab paiksed põletikulised protsessid
mille tulemusena toimub liigese järkjärguline hävimine ning selliste haigusprotsesside
objektiivseks jälgimiseks on vaja mõõdetavaid markereid. Ägeda järgu valk, seerumi
amüloid A-d (SAA) toodetakse süsteemselt põletikuvastuse ajal maksas ja SAA sisalduse
mõõtmine veres on kasutusel hobuste üldise põletikuvastuse mõõdikuna. Samas toodavad
seda valku koekahjustuse korral ka paiksed koed. SAA-d toodetakse kondrotsüütide poolt
liigeses ja seega on potentsiaalselt võimalik kasutada liigesevedeliku SAA-d diagnostilise
markerina ka hobuse liigesehaiguste korral.
Antud uuringu käigus koguti liigesehaigusega hobuste liigestest 11 sünoviaalproovi ja
mittepatoloogilistest liigestest 8 proovi. Proove oli hobuste põlve- (n = 10), kanna- (n = 6)
ja randmeliigesest (n = 3). Diagnoositi 4-ja erinevat patoloogiat: osteoartriit (OA),
osteokondroos (osteochondrosis; OC), meniski rebend ja üks proov oli kroonilise
tugisidemete kahjustusega randmeliigesest. Viimati nimetatud proov liideti andmete
analüüsiks OA rühmaga.
Liigeseproovide SAA sisaldus määrati ELISA testiga mille avastamispiir oli 0.1 mg/l. OA
rühma (n = 5) ja meniski rebendi rühma (n = 3) sünoovia SAA kontsentratsioonid olid
kõrgemad, vastavalt 0,1-0,60 mg/l ja 0,36-0,61 mg/l. OC rühmas olid madalamad tulemused
(0,20-0,28 mg/l). Kahe hobuse 4 liigeseproovi eemaldati kontrollproovide rühmast
võimaliku süsteemse põletikuvastuse tõttu ja nende proovide tulemusi käsitleti eraldi
rühmana (0.4-3.24 mg/l). Ilma liigese patoloogiata rühmas (n = 4) olid madalaimad sünoovia
SAA kontsentratsioonid (0,1-0,22 mg/l). Nende rühmade SAA kontsentratsioonid ei
erinenud omavahel oluliselt, välja arvatud ilma patoloogiata liigeseproovid ja võimaliku
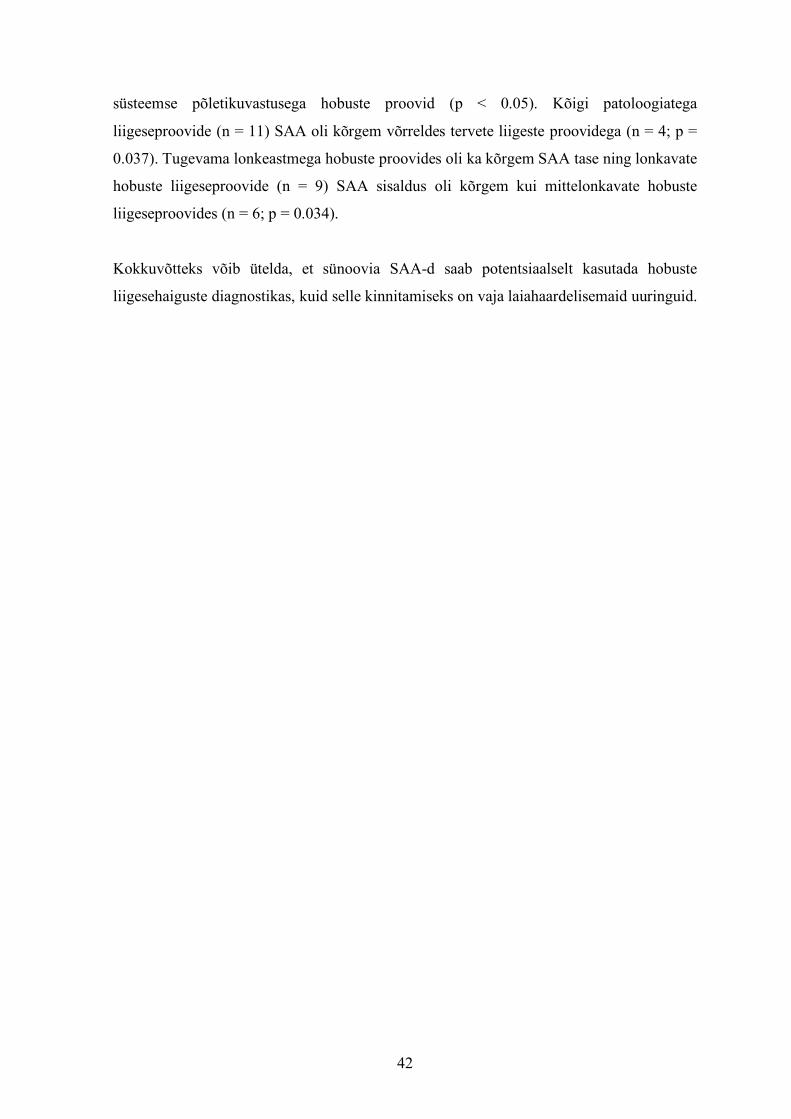
42
süsteemse põletikuvastusega hobuste proovid (p < 0.05). Kõigi patoloogiatega
liigeseproovide (n = 11) SAA oli kõrgem võrreldes tervete liigeste proovidega (n = 4; p =
0.037). Tugevama lonkeastmega hobuste proovides oli ka kõrgem SAA tase ning lonkavate
hobuste liigeseproovide (n = 9) SAA sisaldus oli kõrgem kui mittelonkavate hobuste
liigeseproovides (n = 6; p = 0.034).
Kokkuvõtteks võib ütelda, et sünoovia SAA-d saab potentsiaalselt kasutada hobuste
liigesehaiguste diagnostikas, kuid selle kinnitamiseks on vaja laiahaardelisemaid uuringuid.
43
ACKNOWLEDGEMENTS
Greatest thanks to my supervisor Professor Toomas Orro who has guided me from the start.
Without his involvement, I would not have any results on this study, nor would I have been
able to figure out how to make study in the first place. Secondly, I am grateful to my
colleagues Kristiina Ertola and her staff, and Paula Korpela who collected me the samples.
I would also like to thank my significant other, Isto Talvio, who always pushes me to do the
best I can do, and whom without I would have given up a hundred times before this moment.
Thanks to all of my friends who have shared this experience of becoming a veterinarian.

44
REFERENCES
Allen, B.V. and Kold, S.E. (1988). Fibrinogen response to surgical tissue trauma in the horse. Equine Veterinary Journal, 20, pp. 441-443.
Badolato, R., Wang, J.M., Stornello, S.L., Ponzi, A.N., Duse, M. and Musso, T. (2000). Serum amyloid A is an activator of PMN antimicrobial functions: induction of degranulation, phagocytosis, and enhancement of anti-Candida activity. Journal of Leukocyte Biology, 67, pp. 381-386.
Bar-Or, D., Rael, L.T., Thomas, G.W. and Brody, E.N. (2015). Inflammatory pathways in knee osteoarthritis: potential targets for treatment. Current Rheumatology Reviews, 11, pp. 50-58.
Belgrave, R.L., Dickey, M.M., Arheart, K.L. and Cray, C. (2013). Assessment of serum amyloid A testing of horses and its clinical application in a specialized equine practice. Journal of the American Veterinary Medical Association, 243, pp. 113-119.
Berg, L.C., Thomsen, P.D., Andersen, P.H., Jensen, H.E. and Jacobsen, S. (2011). Serum amyloid A is expressed in histologically normal tissues from horses and cattle. Veterinary Immunology and Immunopathology, 144, pp. 155-159.
Borges, A.S., Divers, T.J., Stokol, T. and Mohammed, O.H. (2007). Serum iron and plasma fibrinogen concentrations as indicators of systemic inflammatory diseases in horses. Journal of Veterinary Internal Medicine, 21, pp. 489-494.
Bourebaba, L., Röcken, M. and Marycz, K. (2019). Osteochondritis dissecans (OCD) in horses – Molecular background of its pathogenesis and perspectives for progenitor stem cell therapy. Stem Cell Reviews and Reports, 15, pp. 374-390.
Burrage, P.S., Mix, K.S. and Brinckerhoff, C.E. (2006). Matrix metalloproteinases: Role in arthritis. Frontiers in Bioscience, 11, 529.
Christoffersen, M., Baagoe, C.D., Jacobsen, S., Bojesen A.M., Petersen, M.R. and Lehn-Jensen, H. (2010). Evaluation of the systemic acute phase response and endometrial gene expression of serum amyloid A and pro- and anti-inflammatory cytokines in mares with experimentally induced endometritis. Veterinary Immunology and Immunopathology, 138, pp. 95-105.
Cray, C., Zaias, J. and Altman, N. (2009). Acute phase response in animals: A rewiew. Comparative Medicine, 59, pp. 517-526.
Cray, C. (2012). Acute phase proteins in animals. Progress in Molecular Biology and Translational Science, 105, pp. 113-150.
45
Connolly, M., Mullan, R.H., McCormick, J., Matthews, C., Sullivan, O., Kennedy, A., FitzGerald, O., Poole, A.R., Bresnihan, B., Veale, D.J. and Fearon, U. (2012). Acute-phase serum amyloid A regulates tumor necrosis factor α and matrix turnover and predicts disease progression in patients with inflammatory arthritis before and after biologic therapy. Arthritis & Rheumatism, 64, pp. 1035-1045.
Delanghe, J., Langlois, M., Ouyang, J., Claeys, G., De Buyzere, M. and Wuyts, B. (1998). Effect of haptoglobin phenotypes on growth of Streptococcus pyogenes. Clinical Chemistry and Laboratory Medicine, 36, pp. 691-696.
De Cozar, M., Sherlock, C., Knowles, E. and Mair, T. (2019). Serum amyloid A and plasma fibrinogen concentrations in horses following emergency exploratory celiotomy. Equine Veterinary Journal, 52, pp. 59-66.
De Seny, D., Cobraiville, G., Charlier, E., Neuville, S., Esser, N., Malaise, D., Malaise, O., Calvo, F.Q., Relic, B. and Malaise, M.G. (2013). Acute-phase serum amyloid A in osteoarthritis: Regulatory mechanism and proinflammatory properties. PLoS ONE, 8, e66769.
Dubuc, J., Girard, C., Richard, H., De Lasalle, J. and Laverty, S. (2018). Equine meniscal degeneration is associated with medial femorotibial osteoarthritis. Equine Veterinary Journal. 50, pp. 133–140
Eaton, J.W., Brandt, P., Mahoney, J.R. and Lee, J.T. Jr. (1982). Haptoglobin: a natural bacteriostat. Science, 215, pp. 691-693.
Ebert, R., Benisch, P., Krug, M., Zeck, S., Meißner-Weigl, J., Steinert, A., Rauner, M., Hofbauer, L. and Jakob, F. (2015). Acute phase serum amyloid A induces proinflammatory cytokines and mineralization via toll-like receptor 4 in mesenchymal stem cells. Stem Cell Research, 15, pp. 231-239.
Ghasemi, S., Sardari, K., Mirshokraei, P. and Hassanpour, H. (2018). In vitro study of matrix metalloproteinases 1, 2, 9, 13 and serum amyloid A mRNAs expression in equine fibroblast-like synoviocytes treated with doxycycline. Canadian Journal of VeterinaryRresearch, 82 pp. 82–88.
Goldring, M.B. and Goldring, S.R. (2010). Articular cartilage and subchondral bone in the pathogenesis of osteoarthritis. Annals of the New York Academy of Sciences, 1192, pp. 230-237.
Gruys, E., Toussaint, M.J., Niewold, T.A. and Koopmans, S.J. (2005). Acute phase reaction and acute phase proteins. Journal of Zhejiang University Science B, 6, pp. 1045-1056.
Hultén, C., Grönlund, U., Hirvonen, J., Tulamo, R.M., Suominen, M.M., Marhaug, G. and Forsberg, M. (2010). Dynamics in serum of the inflammatory markers serum amyloid A (SAA), haptoglobin, fibrinogen and α2-globulins during induced noninfectious arthritis in the horse. Equine Veterinary Journal, 34, pp. 699-704.
Hultén, C., Tulamo, R.M., Suominen, M.M., Burvall, K., Marhaug, G. and Forsberg, M. (1999). A non-competitive chemiluminescence enzyme immunoassay for the equine
46
acute phase protein serum amyloid A (SAA) – a clinically useful inflammatory marker in the horse. Veterinary Immunology and Immunopathology, 68, pp. 267-281.
Jacobsen, S. and Andersen, P.H. (2010). The acute phase protein serum amyloid A (SAA) as a marker of inflammation in horses. Equine Veterinary Education, 19, pp. 38-46.
Jacobsen, S., Ladefoged, S. and Berg, L.C. (2016). Production of serum amyloid A in equine articular chondrocytes and fibroblast-like synoviocytes treated with proinflammatory cytokines and its effects on the two cell types in culture. American Journal of Veterinary Research, 77, pp. 50-58.
Jacobsen, S., Niewold, T.A., Halling-Thomsen, M., Nanni, S., Olsen, E., Lindegaard, C. and Andersen, P.H. (2006a). Serum amyloid A isoforms in serum and synovial fluid in horses with lipopolysaccharide-induced arthritis. Veterinary Immunology and Immunopathology, 110, pp. 325-330.
Jacobsen, S., Thomsen, M.H. and Nanni, S. (2006b). Concentrations of serum amyloid A in serum and synovial fluid from healthy horses and horses with joint disease. American Journal of Veterinary Research, 67, pp. 1738-1742.
Kalaitzoglou, E., Griffin, T.M. and Humphrey, M.B. (2017). Innate immune responses and osteoarthritis. Current Rheumatology Reports, 19, 45.
Kamm, J.L., Nixon, A.J. and Witte, T.H. (2010). Cytokine and catabolic enzyme expression in synovium, synovial fluid and articular cartilage of naturally osteoarthritic equine carpi. Equine Veterinary Journal, 42, pp. 693-699.
Kent, J.E. and Goodall, J. (1991). Assessment of an immunoturbidimetric method for measuring equine serum haptoglobin concentrations. Equine Veterinary Journal, 23, pp. 59-66.
Korhonen, R., Lahti, A., Kankaanranta, H. and Moilanen, E. (2005). Nitric oxide production and signaling in inflammation. Current Drug Target -Inflammation & Allergy, 4, pp. 471-479.
Kvist, A.J, Nyström, A., Hultenby, K., Sasaki, T., Talts, J.F. and Aspberg, A. (2008). The major basement membrane components localize to the chondrocyte pericellular matrix — A cartilage basement membrane equivalent? Matrix Biology, 27, pp. 22-33.
Lacourt, M., Gao, C., Li, A., Girard, C., Beauchamp, G., Henderson, J.E. and Laverty, S. (2012). Relationship between cartilage and subchondral bone lesions in repetitive impact trauma-induced equine osteoarthritis. Osteoarthritis and Cartilage, 20, pp. 572-583.
Lim, C.K., Hawkins, J.F., Vanderpool, A.L., Heng, H.G., Gillespie Harmon, C.C. and Lenz, S.D. (2017). Osteochondritis dissecans-like lesions of the occipital condyle and cervical articular process joints in a Saddlebred colt horse. Acta Veterinaria Scandinavica, 59, 76.
Luyendyk, J.P, Schoenecker, J.G. and Flick, M.J. (2019). The multifaceted role of fibrinogen in tissue injury and inflammation. Blood, 133, pp. 511-520.
47
McDonald, T.L., Larson, M.A, Mack, D.R and Weber, A. (2001). Elevated extrahepatic expression and secretion of mammary-associated serum amyloid A 3 (M-SAA3) into colostrum. Veterinary Immunology and Immunopathology, 83, pp. 203-211.
McIlwraith, C.W., Frisbie, D.D. and Kawcak, C.E. (2012). The horse as a model of naturally occurring osteoarthritis. Bone & Joint Research, 1, pp. 297-309.
McIlwraith, C.W, Kawcak, C.E., Frisbie, D.D., Little, C.B., Clegg, P.D., Peffers, M.J., Karsdal, M.A, Ekman, S., Laverty, S., Slayden, R.A., Sandell, L.J., Lohmander, L.S. and Kraus, V.B. (2018). Biomarkers for equine joint injury and osteoarthritis. Journal of Orthopaedic Research, 36, pp. 823-831.
Minshall, G.J, & Wright, I.M. (2010). Arthroscopic diagnosis and treatment of intra-articular Insertional injuries of the suspensory ligament branches in 18 horses. Equine Veterinary Journal, 38, pp. 10-14.
Murata, H., Shimada, N. and Yoshioka, M. (2004). Current research on acute phase proteins in veterinary diagnosis: an overview. The Veterinary Journal, 168, pp. 28-40.
Nunokawa, Y., Fujinaga, T., Taira, T., Okumura, M., Yamashita, K., Tsunoda, N. and Hagio, M. (1993). Evaluation of serum amyloid A protein as an acute-phase reactive protein in horses. The Journal of Veterinary Medical Science, 55, pp. 1011-1016.
Orro, T., Jacobsen, S., LePage, J.P., Niewold, T., Alasuutari, S. and Soveri, T. (2008). Temporal changes in serum concentrations of acute phase proteins in newborn dairy calves. The Veterinary Journal, 176, pp. 182-187.
Petersen, H.H., Nielsen, J.P. and Heegaard, P.M. (2004). Application of acute phase protein measurements in veterinary clinical chemistry. Veterinary Research, 35, pp. 163-187.
Porter, S., Clark, I.M., Kevorkian, L. and Edwards, D.R. (2005). The ADAMTS metalloproteinases. Biochemical Journal, 386, pp. 15-27.
Robinson, C.S., Singer, E.R., Piviani, M. and Rubio-Martinez, L.M. (2017). Are serum amyloid A or D-lactate useful to diagnose synovial contamination or sepsis in horses? Veterinary Record, 181, pp. 425-425.
Rosenberg, J.H., Rai, V., Dilisio, M.F. and Agrawal, D.K. (2017). Damage-associated molecular patterns in the pathogenesis of osteoarthritis: potentially novel therapeutic targets. Molecular and Cellular Biochemistry, 434, pp. 171-179.
Russell, J., Matika, O., Russell, T., & Reardon, R. (2016). Heritability and prevalence of selected osteochondrosis lesions in yearling Thoroughbred horses. Equine Veterinary Journal, 49, pp. 282-287.
Santschi, E.M. (2008). Articular fetlock injuries in exercising horses. Veterinary Clinics of North America: Equine Practice, 24, pp. 117-132.
Satué, K., Calvo, A. and Gardón, J.C. (2013). Factors influencing serum amyloid type A (SAA) concentrations in horses. Open Journal of Veterinary Medicine, 3, pp. 58-66.

48
Schrödl, W., Büchler, R., Wendler, S., Reinhold, P., Muckova, P., Reindl, J. and Rhode, H. (2016). Acute phase proteins as promising biomarkers: Perspectives and limitations for human and veterinary medicine. Proteomics - Clinical Applications, 10, pp. 1077-1092.
Smith, A.D., Morton, A.J., Winter, M.D., Colahan, P.T., Ghivizzani, S., Brown, M.P., Hernandez, J.A. and Nickerson, D.M. (2016). Magnetic resonance imaging scoring of an experimental model of post-traumatic osteoarthritis in the equine carpus. Veterinary Radiology & Ultrasound, 57, pp. 502-514.
Sofat, N., Ejindu, V., Heron, C., Harrison, A., Koushesh, S., Assi, L., Kuttapitiya, A., Whitley, G.S. and Howe, F.A. (2019). Biomarkers in painful symptomatic knee OA demonstrate that MRI assessed joint damage and type II collagen degradation products are linked to disease progression. Frontiers in Neuroscience, 13, 1016.
Sokolove, J. and Lepus, C.M. (2013). Role of inflammation in the pathogenesis of osteoarthritis: latest findings and interpretations. Therapeutic Advances in Musculoskeletal Disease, 5, pp. 77-94.
Steel, C., Devery, S., Hance, S., Adkins, A., & Hitchens, P. (2019). Fragmentation of the dorsal distal aspect of the talus on weanling survey and pre-sale radiographs of juvenile Thoroughbreds: prevalence and 2- and 3-year-olds racing performance. Australian Veterinary Journal, 97, pp. 68-74.
Steinert, A.F., Ghivizzani, S.C., Rethwilm, A., Tuan, R.S., Evans, C.H. and Nöth, U. (2007). Major biological obstacles for persistent cell-based regeneration of articular cartilage. Arthritis Research & Therapy, 9, 213.
Stuehr, D.J. and Marletta, M.A. (1985). Mammalian nitrate biosynthesis: mouse macrophages produce nitrite and nitrate in response to Escherichia coli lipopolysaccharide. Proceedings of the National Academy of Sciences, 82, pp. 7738-7742.
United States Department of Agriculture, (2000) Lameness and laminitis in U.S. Horses. National Animal Health Monitoring System. http://www.aphis.usda.gov/animal_health/nahms/equine/downloads/equine98/Equine98_
dr_Lameness.pdf (date last accessed 05. November 2019).
Urieli-Shoval, S., Cohen, P., Eisenberg, S. and Matzner, Y. (1998). Widespread expression of serum amyloid A in histologically normal human tissues: predominant localization to the epithelium. Journal of Histochemistry & Cytochemistry, 46, pp. 1377-1384.
Wilson, D. (2012). Clinical veterinary advisor. San Louis (Missouri, Estados Unidos): Elsevier/Saunders, Chapter: Osteoarthritis p. 416.
Witkowska-Piłaszewicz, O.D., Żmigrodzka, M., Winnicka, A., Miśkiewicz, A., Strzelec, K. and Cywińska, A. (2019). Serum amyloid A in equine health and disease. Equine Veterinary Journal, 51, pp.293-298.
Zhang, J.M. and An, J. (2007). Cytokines, inflammation, and pain. International Anesthesiology Clinics, 45, pp. 27-37.

49
Xia, B., Di Chen, Zhang, J., Hu, S., Jin, H. and Tong, P. (2014). Osteoarthritis pathogenesis: A review of molecular mechanisms. Calcified Tissue International, 95, pp. 495-505

50
APPENDIXES
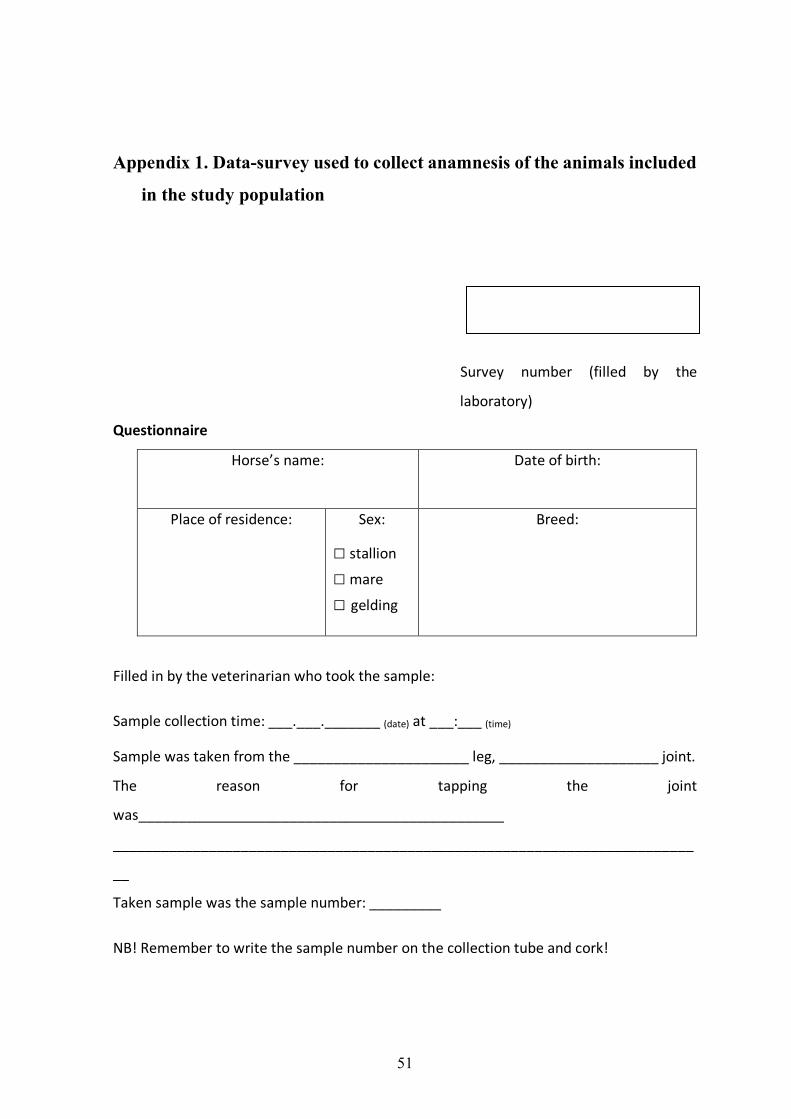
51
Appendix 1. Data-survey used to collect anamnesis of the animals included
in the study population
Survey number (filled by the
laboratory)
Questionnaire
Horse’s name:
Date of birth:
Place of residence: Sex:
□ stallion
□ mare
□ gelding
Breed:
Filled in by the veterinarian who took the sample:
Sample collection time: ___.___._______ (date) at ___:___ (time)
Sample was taken from the ______________________ leg, ____________________ joint.
The reason for tapping the joint
was______________________________________________
_________________________________________________________________________
__
Taken sample was the sample number: _________
NB! Remember to write the sample number on the collection tube and cork!
52
Appendix 2. Non-exclusive license for depositing the final thesis and
opening it for the public and the supervisor’s confirmation for allowing
the thesis for the defense Hereby I, Kia Reetta Katariina Pekkonen 07/12/1993
1. grant Eesti Maaülikool, the Estonian University of Life Sciences, a free-of-charge non-exclusive licence to store the final thesis titled Synovial serum amyloid A (SAA) as a potential marker of equine degenerative joint disease, supervised by Professor Toomas Orro for 1.1. preservation; 1.2. depositing a digital copy of the thesis in the archive of DSpace and 1.3. opening it for the public on the Web until the validity of the term of protection of copyright.
2. I am aware that the author retains the same rights as listed in point 1;
3. I confirm that by being issued the CC license no rights deriving from the Personal
Data Protection Act and the Intellectual Property Rights Act have been infringed. Author of the final thesis ______________________________ signature In Tartu, 17.05.2020 _________________________________________________________________ The core supervisor’s approval for the final thesis to be allowed for defense This is to confirm that the final thesis is allowed for defense. Toomas Orro ……………………………….. Supervisor’s name and signature Date …… ……………………