SWIBER HOLDINGS LIMITEDswiber.listedcompany.com/newsroom/20100813_201220...swiber holdings limited...
24
SWIBER HOLDINGS LIMITED Financial Statements And Dividends Announcement For The Second Quarter And Half Year Ended 30 June 2010
Transcript of SWIBER HOLDINGS LIMITEDswiber.listedcompany.com/newsroom/20100813_201220...swiber holdings limited...

SWIBER HOLDINGS LIMITED
Financial Statements And Dividends Announcement
For The Second Quarter And Half Year Ended
30 June 2010
1
SWIBER HOLDINGS LIMITED (Co Reg No. 200414721N)
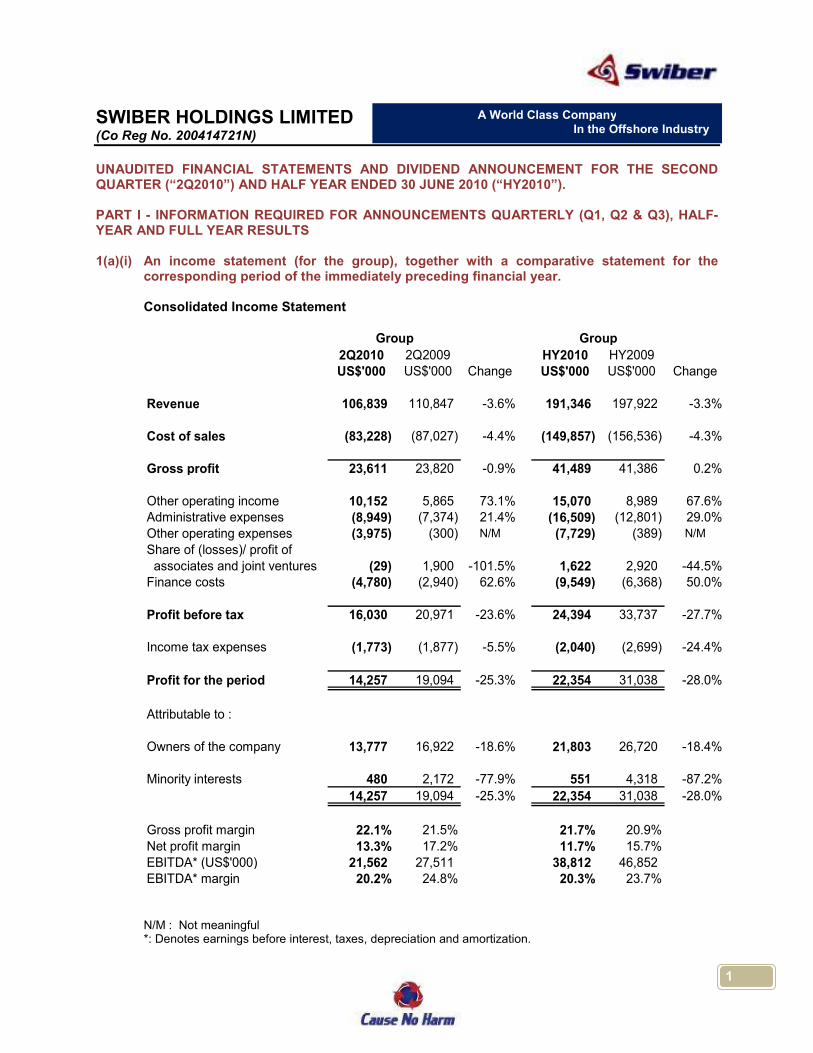
UNAUDITED FINANCIAL STATEMENTS AND DIVIDEND ANNOUNCEMENT FOR THE SECOND QUARTER (“2Q2010”) AND HALF YEAR ENDED 30 JUNE 2010 (“HY2010”). PART I - INFORMATION REQUIRED FOR ANNOUNCEMENTS QUARTERLY (Q1, Q2 & Q3), HALF-YEAR AND FULL YEAR RESULTS 1(a)(i) An income statement (for the group), together with a comparative statement for the
corresponding period of the immediately preceding financial year.
Consolidated Income Statement
2Q2010 2Q2009 HY2010 HY2009US$'000 US$'000 Change US$'000 US$'000 Change
Revenue 106,839 110,847 -3.6% 191,346 197,922 -3.3%
Cost of sales (83,228) (87,027) -4.4% (149,857) (156,536) -4.3%
Gross profit 23,611 23,820 -0.9% 41,489 41,386 0.2%
Other operating income 10,152 5,865 73.1% 15,070 8,989 67.6%Administrative expenses (8,949) (7,374) 21.4% (16,509) (12,801) 29.0%Other operating expenses (3,975) (300) N/M (7,729) (389) N/M
Share of (losses)/ profit of associates and joint ventures (29) 1,900 -101.5% 1,622 2,920 -44.5%Finance costs (4,780) (2,940) 62.6% (9,549) (6,368) 50.0%
Profit before tax 16,030 20,971 -23.6% 24,394 33,737 -27.7%
Income tax expenses (1,773) (1,877) -5.5% (2,040) (2,699) -24.4%
Profit for the period 14,257 19,094 -25.3% 22,354 31,038 -28.0%
Attributable to :
Owners of the company 13,777 16,922 -18.6% 21,803 26,720 -18.4%
Minority interests 480 2,172 -77.9% 551 4,318 -87.2%
14,257 19,094 -25.3% 22,354 31,038 -28.0%
Gross profit margin 22.1% 21.5% 21.7% 20.9%Net profit margin 13.3% 17.2% 11.7% 15.7%EBITDA* (US$'000) 21,562 27,511 38,812 46,852 EBITDA* margin 20.2% 24.8% 20.3% 23.7%
Group Group
N/M : Not meaningful *: Denotes earnings before interest, taxes, depreciation and amortization.
A World Class Company In the Offshore Industry
2
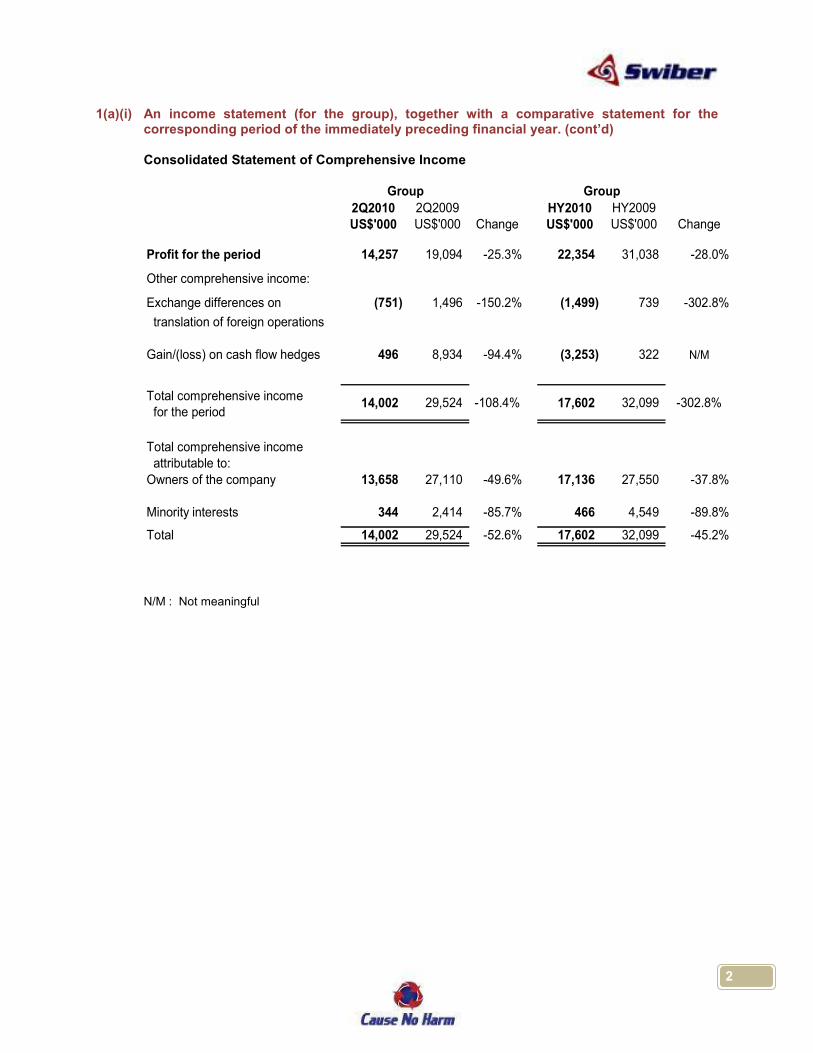
1(a)(i) An income statement (for the group), together with a comparative statement for the corresponding period of the immediately preceding financial year. (cont’d)
Consolidated Statement of Comprehensive Income
2Q2010 2Q2009 HY2010 HY2009
US$'000 US$'000 Change US$'000 US$'000 Change
Profit for the period 14,257 19,094 -25.3% 22,354 31,038 -28.0%
Other comprehensive income:
Exchange differences on (751) 1,496 -150.2% (1,499) 739 -302.8%
translation of foreign operations
Gain/(loss) on cash flow hedges 496 8,934 -94.4% (3,253) 322 N/M
Total comprehensive income for the period
Total comprehensive income attributable to:
Owners of the company 13,658 27,110 -49.6% 17,136 27,550 -37.8%
Minority interests 344 2,414 -85.7% 466 4,549 -89.8%
Total 14,002 29,524 -52.6% 17,602 32,099 -45.2%
-302.8%
Group Group
14,002 29,524 -108.4% 17,602 32,099
N/M : Not meaningful
3
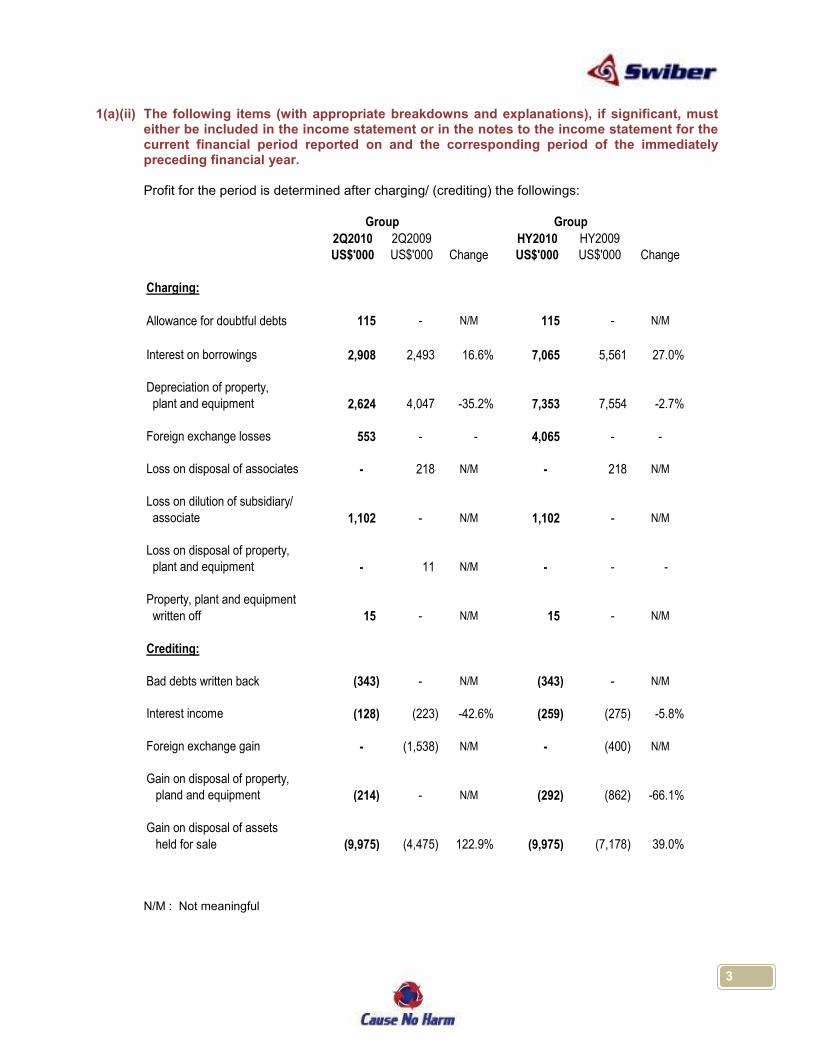
1(a)(ii) The following items (with appropriate breakdowns and explanations), if significant, must either be included in the income statement or in the notes to the income statement for the current financial period reported on and the corresponding period of the immediately preceding financial year.
Profit for the period is determined after charging/ (crediting) the followings:
2Q2010 2Q2009 HY2010 HY2009US$'000 US$'000 Change US$'000 US$'000 Change
Charging:
Allowance for doubtful debts 115 - N/M 115 - N/M
Interest on borrowings 2,908 2,493 16.6% 7,065 5,561 27.0%
Depreciation of property, plant and equipment 2,624 4,047 -35.2% 7,353 7,554 -2.7%
Foreign exchange losses 553 - - 4,065 - -
Loss on disposal of associates - 218 N/M - 218 N/M
Loss on dilution of subsidiary/ associate 1,102 - N/M 1,102 - N/M
Loss on disposal of property, plant and equipment - 11 N/M - - -
Property, plant and equipment
written off 15 - N/M 15 - N/M
Crediting:
Bad debts written back (343) - N/M (343) - N/M
Interest income (128) (223) -42.6% (259) (275) -5.8%
Foreign exchange gain - (1,538) N/M - (400) N/M
Gain on disposal of property, pland and equipment (214) - N/M (292) (862) -66.1%
Gain on disposal of assets
held for sale (9,975) (4,475) 122.9% (9,975) (7,178) 39.0%
Group Group
N/M : Not meaningful
4
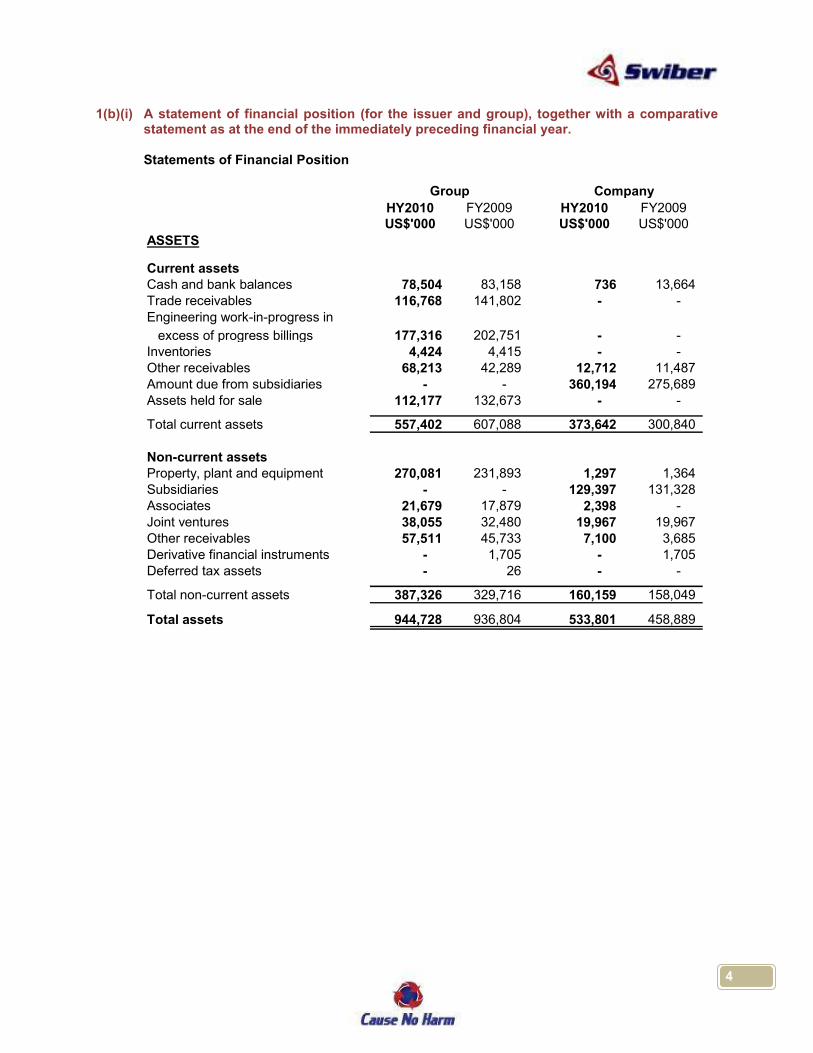
1(b)(i) A statement of financial position (for the issuer and group), together with a comparative statement as at the end of the immediately preceding financial year.
Statements of Financial Position
HY2010 FY2009 HY2010 FY2009US$'000 US$'000 US$'000 US$'000
ASSETS
Current assets Cash and bank balances 78,504 83,158 736 13,664 Trade receivables 116,768 141,802 - -
Engineering work-in-progress in
excess of progress billings 177,316 202,751 - - Inventories 4,424 4,415 - - Other receivables 68,213 42,289 12,712 11,487 Amount due from subsidiaries - - 360,194 275,689 Assets held for sale 112,177 132,673 - -
Total current assets 557,402 607,088 373,642 300,840
Non-current assets Property, plant and equipment 270,081 231,893 1,297 1,364 Subsidiaries - - 129,397 131,328 Associates 21,679 17,879 2,398 - Joint ventures 38,055 32,480 19,967 19,967 Other receivables 57,511 45,733 7,100 3,685 Derivative financial instruments - 1,705 - 1,705 Deferred tax assets - 26 - -
Total non-current assets 387,326 329,716 160,159 158,049
Total assets 944,728 936,804 533,801 458,889
Group Company
5
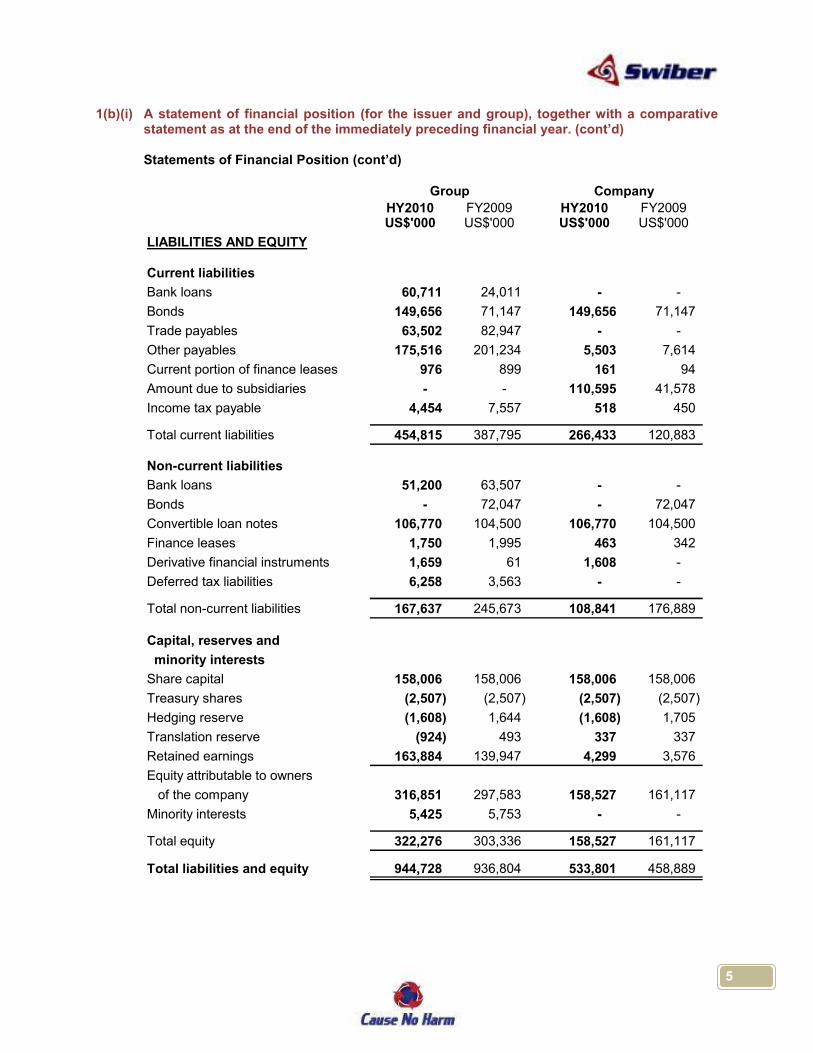
1(b)(i) A statement of financial position (for the issuer and group), together with a comparative statement as at the end of the immediately preceding financial year. (cont’d)
Statements of Financial Position (cont’d)
HY2010 FY2009 HY2010 FY2009US$'000 US$'000 US$'000 US$'000
LIABILITIES AND EQUITY
Current liabilities
Bank loans 60,711 24,011 - -
Bonds 149,656 71,147 149,656 71,147
Trade payables 63,502 82,947 - -
Other payables 175,516 201,234 5,503 7,614
Current portion of finance leases 976 899 161 94
Amount due to subsidiaries - - 110,595 41,578
Income tax payable 4,454 7,557 518 450
Total current liabilities 454,815 387,795 266,433 120,883
Non-current liabilities
Bank loans 51,200 63,507 - -
Bonds - 72,047 - 72,047
Convertible loan notes 106,770 104,500 106,770 104,500
Finance leases 1,750 1,995 463 342
Derivative financial instruments 1,659 61 1,608 -
Deferred tax liabilities 6,258 3,563 - -
Total non-current liabilities 167,637 245,673 108,841 176,889
Capital, reserves and
minority interests
Share capital 158,006 158,006 158,006 158,006
Treasury shares (2,507) (2,507) (2,507) (2,507)
Hedging reserve (1,608) 1,644 (1,608) 1,705
Translation reserve (924) 493 337 337
Retained earnings 163,884 139,947 4,299 3,576
Equity attributable to owners
of the company 316,851 297,583 158,527 161,117
Minority interests 5,425 5,753 - -
Total equity 322,276 303,336 158,527 161,117
Total liabilities and equity 944,728 936,804 533,801 458,889
Group Company
6
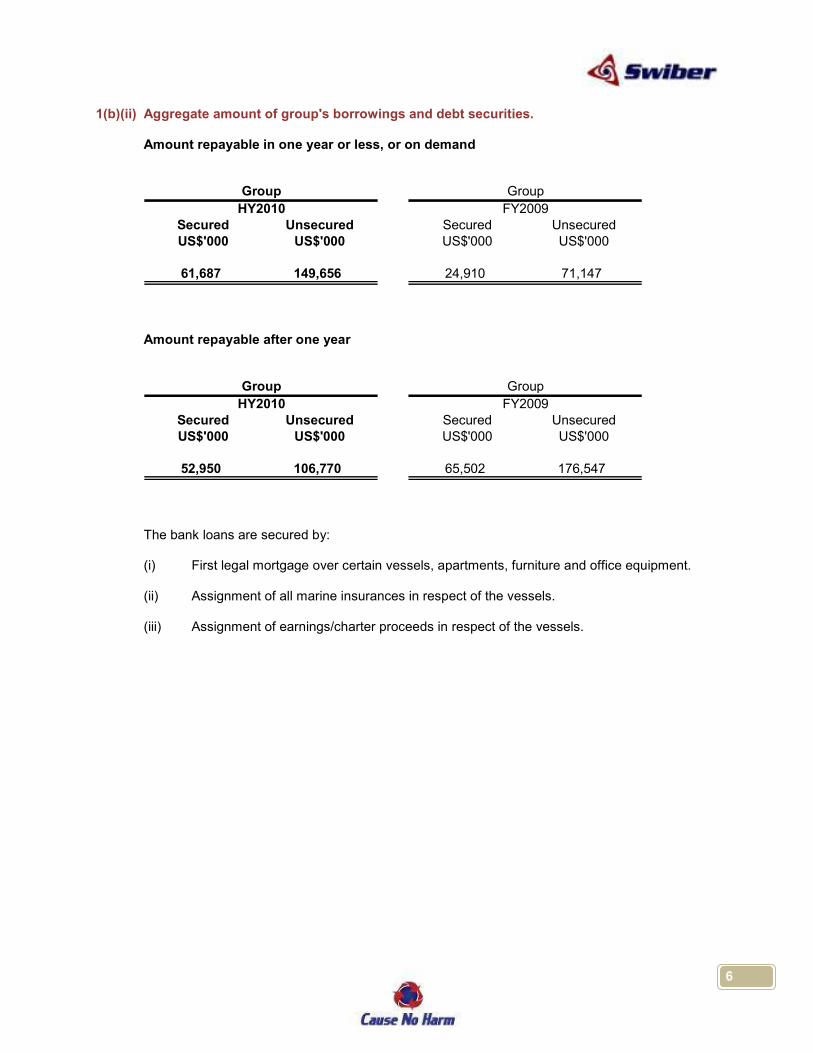
1(b)(ii) Aggregate amount of group's borrowings and debt securities. Amount repayable in one year or less, or on demand
Secured Unsecured Secured UnsecuredUS$'000 US$'000 US$'000 US$'000
61,687 149,656 24,910 71,147
Group Group
HY2010 FY2009
Amount repayable after one year
Secured Unsecured Secured UnsecuredUS$'000 US$'000 US$'000 US$'000
52,950 106,770 65,502 176,547
Group Group
HY2010 FY2009
The bank loans are secured by:
(i) First legal mortgage over certain vessels, apartments, furniture and office equipment.
(ii) Assignment of all marine insurances in respect of the vessels. (iii) Assignment of earnings/charter proceeds in respect of the vessels.
7
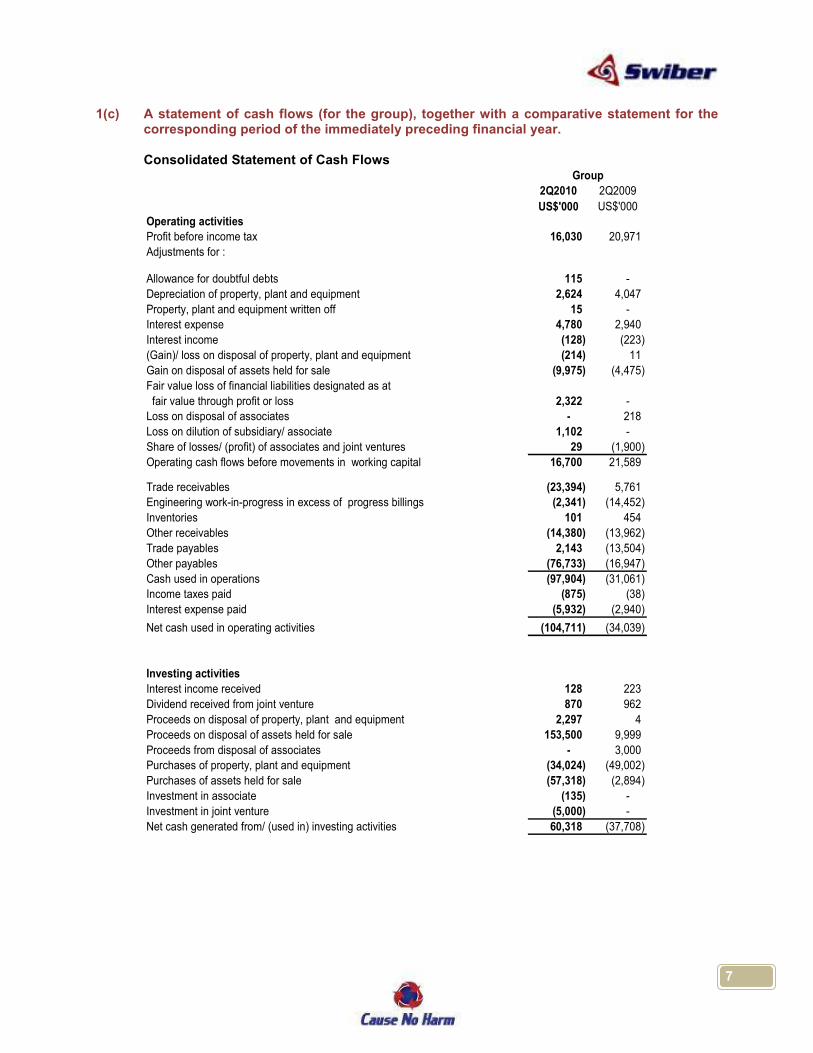
1(c) A statement of cash flows (for the group), together with a comparative statement for the corresponding period of the immediately preceding financial year.
Consolidated Statement of Cash Flows
2Q2010 2Q2009
US$'000 US$'000
Operating activities
Profit before income tax 16,030 20,971
Adjustments for :
Allowance for doubtful debts 115 -
Depreciation of property, plant and equipment 2,624 4,047
Property, plant and equipment written off 15 -
Interest expense 4,780 2,940
Interest income (128) (223)
(Gain)/ loss on disposal of property, plant and equipment (214) 11
Gain on disposal of assets held for sale (9,975) (4,475)
Fair value loss of financial liabilities designated as at
fair value through profit or loss 2,322 -
Loss on disposal of associates - 218
Loss on dilution of subsidiary/ associate 1,102 -
Share of losses/ (profit) of associates and joint ventures 29 (1,900)
Operating cash flows before movements in working capital 16,700 21,589
Trade receivables (23,394) 5,761
Engineering work-in-progress in excess of progress billings (2,341) (14,452)
Inventories 101 454
Other receivables (14,380) (13,962)
Trade payables 2,143 (13,504)
Other payables (76,733) (16,947)
Cash used in operations (97,904) (31,061)
Income taxes paid (875) (38)
Interest expense paid (5,932) (2,940)
Net cash used in operating activities (104,711) (34,039)
Investing activities
Interest income received 128 223
Dividend received from joint venture 870 962
Proceeds on disposal of property, plant and equipment 2,297 4
Proceeds on disposal of assets held for sale 153,500 9,999
Proceeds from disposal of associates - 3,000
Purchases of property, plant and equipment (34,024) (49,002)
Purchases of assets held for sale (57,318) (2,894)
Investment in associate (135) -
Investment in joint venture (5,000) -
Net cash generated from/ (used in) investing activities 60,318 (37,708)
Group
8
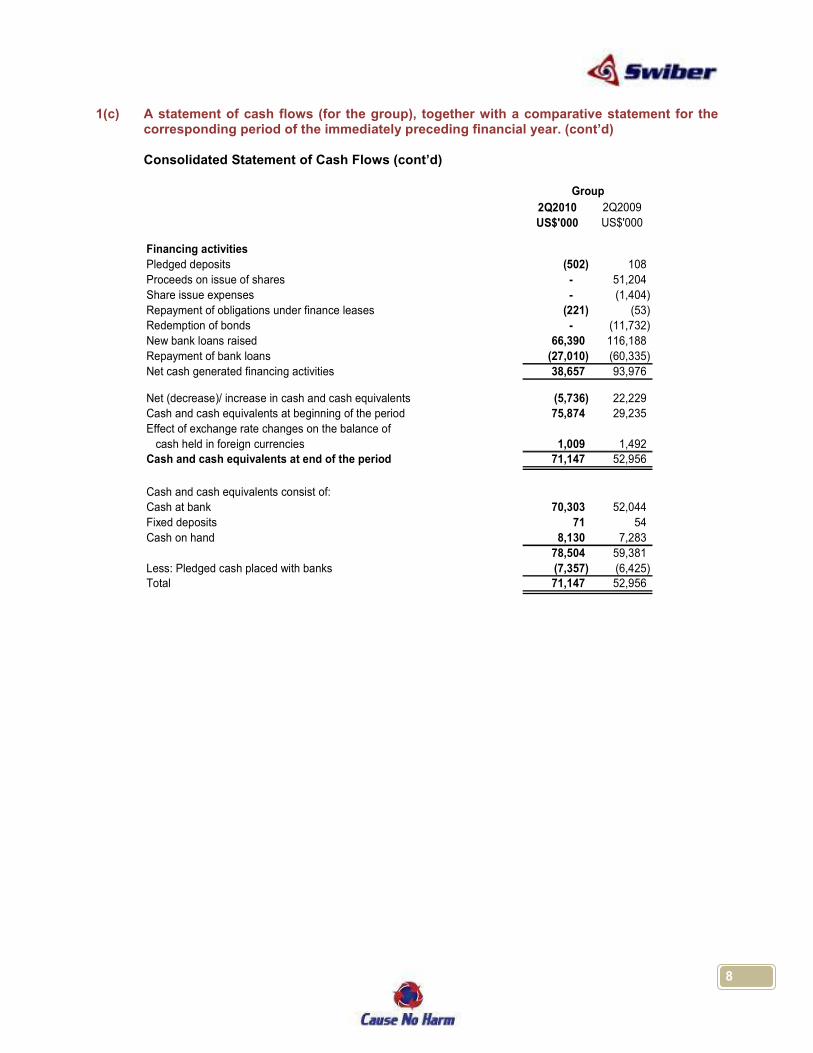
1(c) A statement of cash flows (for the group), together with a comparative statement for the corresponding period of the immediately preceding financial year. (cont’d)
Consolidated Statement of Cash Flows (cont’d)
2Q2010 2Q2009
US$'000 US$'000
Financing activities
Pledged deposits (502) 108
Proceeds on issue of shares - 51,204
Share issue expenses - (1,404)
Repayment of obligations under finance leases (221) (53)
Redemption of bonds - (11,732)
New bank loans raised 66,390 116,188
Repayment of bank loans (27,010) (60,335)
Net cash generated financing activities 38,657 93,976
Net (decrease)/ increase in cash and cash equivalents (5,736) 22,229
Cash and cash equivalents at beginning of the period 75,874 29,235
Effect of exchange rate changes on the balance of
cash held in foreign currencies 1,009 1,492
Cash and cash equivalents at end of the period 71,147 52,956
Cash and cash equivalents consist of:
Cash at bank 70,303 52,044
Fixed deposits 71 54
Cash on hand 8,130 7,283
78,504 59,381
Less: Pledged cash placed with banks (7,357) (6,425)
Total 71,147 52,956
Group
9
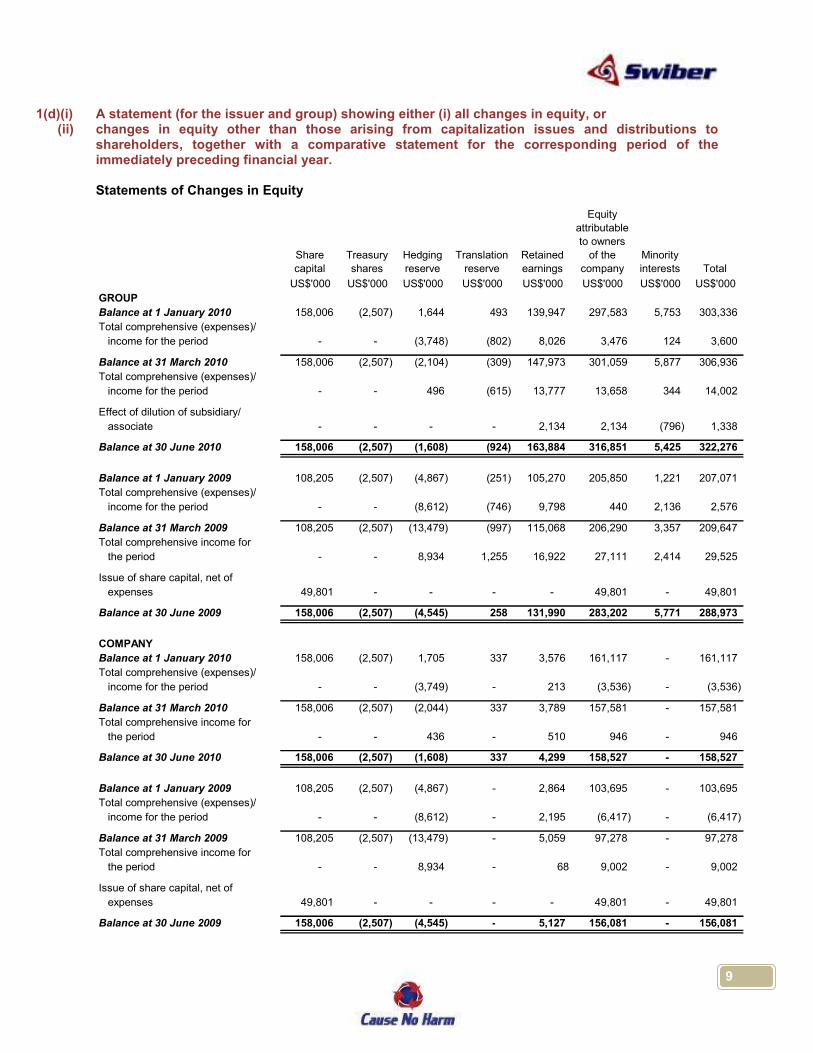
1(d)(i) A statement (for the issuer and group) showing either (i) all changes in equity, or (ii) changes in equity other than those arising from capitalization issues and distributions to
shareholders, together with a comparative statement for the corresponding period of the immediately preceding financial year.
Statements of Changes in Equity
Share
capital
Treasury
shares
Hedging
reserve
Translation
reserve
Retained
earnings
Equity
attributable
to owners
of the
company
Minority
interests Total
US$'000 US$'000 US$'000 US$'000 US$'000 US$'000 US$'000 US$'000
GROUP
Balance at 1 January 2010 158,006 (2,507) 1,644 493 139,947 297,583 5,753 303,336
Total comprehensive (expenses)/
income for the period - - (3,748) (802) 8,026 3,476 124 3,600
Balance at 31 March 2010 158,006 (2,507) (2,104) (309) 147,973 301,059 5,877 306,936
Total comprehensive (expenses)/
income for the period - - 496 (615) 13,777 13,658 344 14,002
Effect of dilution of subsidiary/
associate - - - - 2,134 2,134 (796) 1,338
Balance at 30 June 2010 158,006 (2,507) (1,608) (924) 163,884 316,851 5,425 322,276
Balance at 1 January 2009 108,205 (2,507) (4,867) (251) 105,270 205,850 1,221 207,071
Total comprehensive (expenses)/
income for the period - - (8,612) (746) 9,798 440 2,136 2,576
Balance at 31 March 2009 108,205 (2,507) (13,479) (997) 115,068 206,290 3,357 209,647
Total comprehensive income for
the period - - 8,934 1,255 16,922 27,111 2,414 29,525
Issue of share capital, net of
expenses 49,801 - - - - 49,801 - 49,801
Balance at 30 June 2009 158,006 (2,507) (4,545) 258 131,990 283,202 5,771 288,973
COMPANY
Balance at 1 January 2010 158,006 (2,507) 1,705 337 3,576 161,117 - 161,117
Total comprehensive (expenses)/
income for the period - - (3,749) - 213 (3,536) - (3,536)
Balance at 31 March 2010 158,006 (2,507) (2,044) 337 3,789 157,581 - 157,581
Total comprehensive income for
the period - - 436 - 510 946 - 946
Balance at 30 June 2010 158,006 (2,507) (1,608) 337 4,299 158,527 - 158,527
Balance at 1 January 2009 108,205 (2,507) (4,867) - 2,864 103,695 - 103,695
Total comprehensive (expenses)/
income for the period - - (8,612) - 2,195 (6,417) - (6,417)
Balance at 31 March 2009 108,205 (2,507) (13,479) - 5,059 97,278 - 97,278
Total comprehensive income for
the period - - 8,934 - 68 9,002 - 9,002
Issue of share capital, net of
expenses 49,801 - - - - 49,801 - 49,801
Balance at 30 June 2009 158,006 (2,507) (4,545) - 5,127 156,081 - 156,081
10
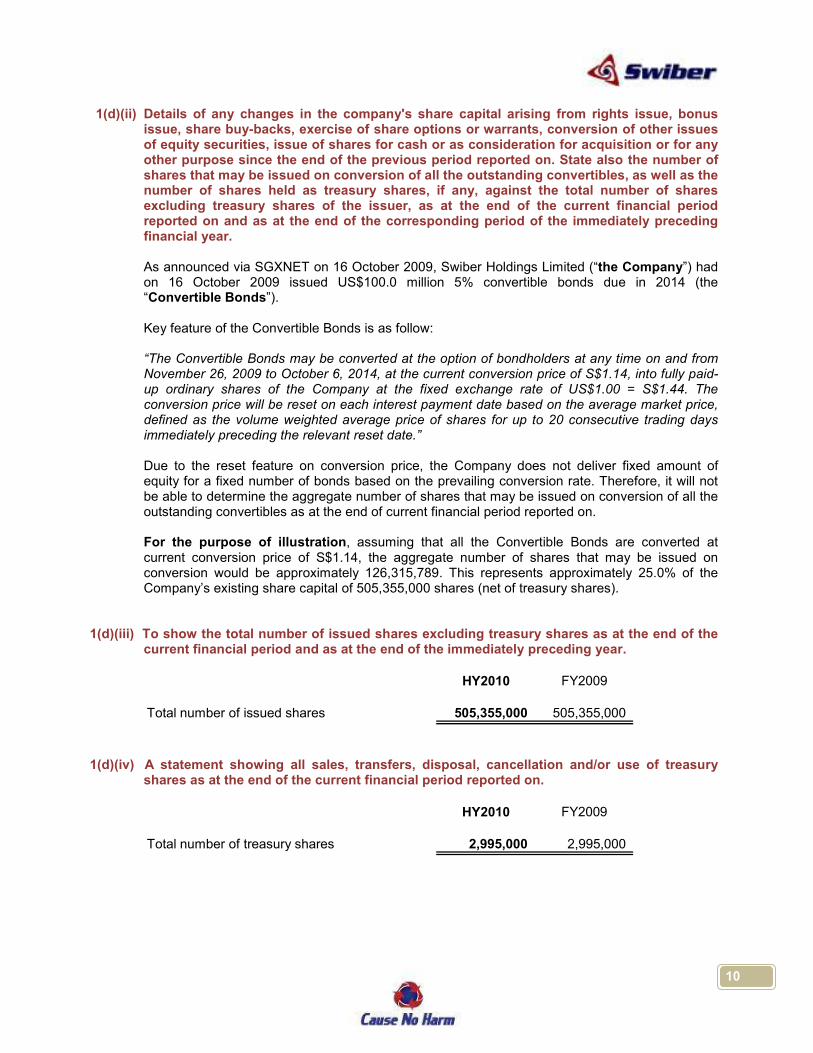
1(d)(ii) Details of any changes in the company's share capital arising from rights issue, bonus issue, share buy-backs, exercise of share options or warrants, conversion of other issues of equity securities, issue of shares for cash or as consideration for acquisition or for any other purpose since the end of the previous period reported on. State also the number of shares that may be issued on conversion of all the outstanding convertibles, as well as the number of shares held as treasury shares, if any, against the total number of shares excluding treasury shares of the issuer, as at the end of the current financial period reported on and as at the end of the corresponding period of the immediately preceding financial year.
As announced via SGXNET on 16 October 2009, Swiber Holdings Limited (“the Company”) had on 16 October 2009 issued US$100.0 million 5% convertible bonds due in 2014 (the “Convertible Bonds”). Key feature of the Convertible Bonds is as follow:
“The Convertible Bonds may be converted at the option of bondholders at any time on and from November 26, 2009 to October 6, 2014, at the current conversion price of S$1.14, into fully paid-up ordinary shares of the Company at the fixed exchange rate of US$1.00 = S$1.44. The conversion price will be reset on each interest payment date based on the average market price, defined as the volume weighted average price of shares for up to 20 consecutive trading days immediately preceding the relevant reset date.”
Due to the reset feature on conversion price, the Company does not deliver fixed amount of equity for a fixed number of bonds based on the prevailing conversion rate. Therefore, it will not be able to determine the aggregate number of shares that may be issued on conversion of all the outstanding convertibles as at the end of current financial period reported on.
For the purpose of illustration, assuming that all the Convertible Bonds are converted at current conversion price of S$1.14, the aggregate number of shares that may be issued on conversion would be approximately 126,315,789. This represents approximately 25.0% of the Company’s existing share capital of 505,355,000 shares (net of treasury shares).
1(d)(iii) To show the total number of issued shares excluding treasury shares as at the end of the current financial period and as at the end of the immediately preceding year.
HY2010 FY2009
Total number of issued shares 505,355,000 505,355,000
1(d)(iv) A statement showing all sales, transfers, disposal, cancellation and/or use of treasury
shares as at the end of the current financial period reported on.
HY2010 FY2009
Total number of treasury shares 2,995,000 2,995,000

11
2. Whether the figures have been audited or reviewed and in accordance with which auditing standard or practice.
Except for the comparative balance sheets of the Company and its subsidiaries (“the Group”) and of the Company as at 31 December 2009, the financial statements have not been audited or reviewed by the Company's auditors.
3. Where the figures have been audited or reviewed, the auditors' report (including any qualifications or emphasis of a matter).
Not applicable. 4. Whether the same accounting policies and methods of computation as in the issuer's
most recently audited annual financial statements have been applied. The Group has applied the same accounting policies and methods of computation in the
preparation of the financial statements for the current financial period as those applied in the financial statement for the year ended 31 December 2009.
5. If there are any changes in the accounting policies and method of computation, including
any required by an accounting standard, what has changed, as well the reasons for, and the effect of, the change.
The Group has adopted the new or revised Financial Reporting Standard (“FRS”) and the
interpretation of FRS that become effective for the entities with financial period commencing 1 January 2010. The adoption of these new and revised FRSs have no material impact to the result of the Group and of the Company for the second quarter and half year ended 30 June 2010.
6. Earnings per ordinary share of the group for the current financial period reported on and
the corresponding period of the immediately preceding financial year, after deducting any provision for preference dividends.
2Q2010 2Q2009 HY2010 HY2009
Net profit after tax attributable to owners of the Company (US$'000) 13,777 16,922 21,803 26,720
Earnings per sharea) Based on weighted average number of ordinary shares on issue (US$ cents) 2.7 3.8 4.3 6.2 b) Based on fully diluted basis (US$ cents) 2.4 3.8 3.8 6.2
Weighted average number of shares applicable to basic earnings per share ('000) 505,355 441,663 505,355 431,565
Weighted average numner of shares based on fully diluted basis ('000) 631,637 441,663 631,637 431,565
Group Group
12
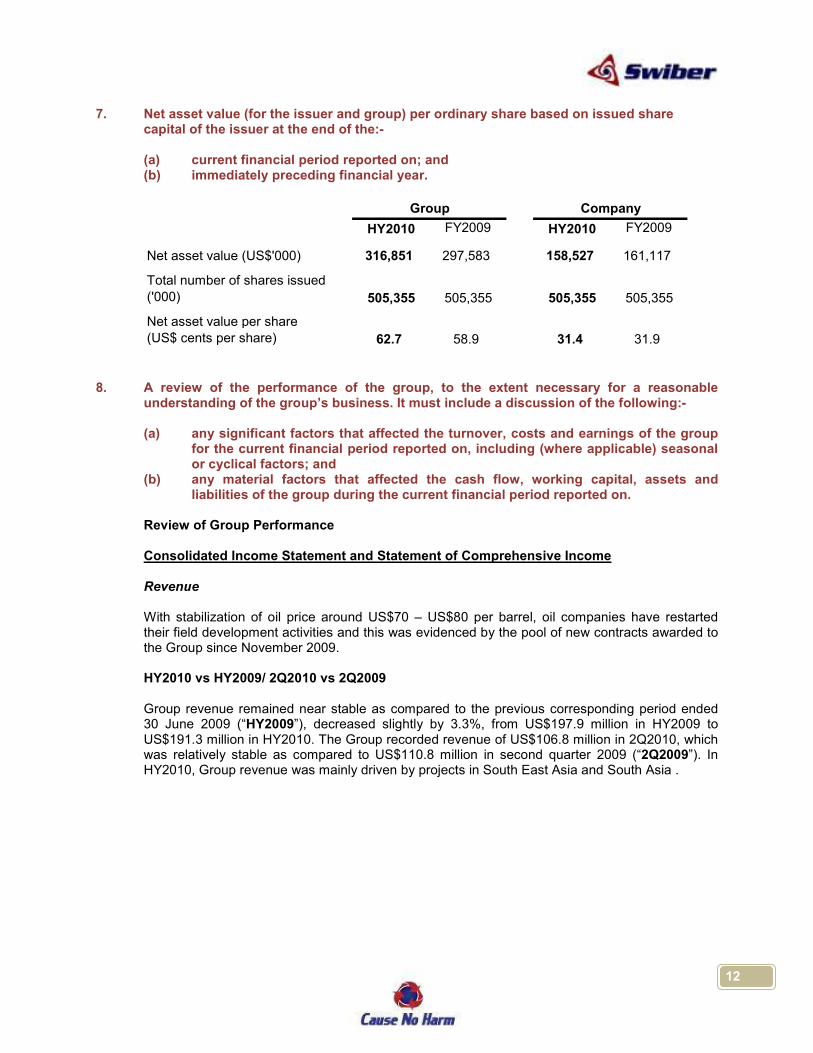
7. Net asset value (for the issuer and group) per ordinary share based on issued share capital of the issuer at the end of the:-
(a) current financial period reported on; and (b) immediately preceding financial year.
HY2010 FY2009 HY2010 FY2009
Net asset value (US$'000) 316,851 297,583 158,527 161,117
Total number of shares issued
('000) 505,355 505,355 505,355 505,355
Net asset value per share
(US$ cents per share) 62.7 58.9 31.4 31.9
Group Company
8. A review of the performance of the group, to the extent necessary for a reasonable understanding of the group’s business. It must include a discussion of the following:-
(a) any significant factors that affected the turnover, costs and earnings of the group
for the current financial period reported on, including (where applicable) seasonal or cyclical factors; and
(b) any material factors that affected the cash flow, working capital, assets and liabilities of the group during the current financial period reported on.
Review of Group Performance Consolidated Income Statement and Statement of Comprehensive Income
Revenue With stabilization of oil price around US$70 – US$80 per barrel, oil companies have restarted their field development activities and this was evidenced by the pool of new contracts awarded to the Group since November 2009. HY2010 vs HY2009/ 2Q2010 vs 2Q2009 Group revenue remained near stable as compared to the previous corresponding period ended 30 June 2009 (“HY2009”), decreased slightly by 3.3%, from US$197.9 million in HY2009 to US$191.3 million in HY2010. The Group recorded revenue of US$106.8 million in 2Q2010, which was relatively stable as compared to US$110.8 million in second quarter 2009 (“2Q2009”). In HY2010, Group revenue was mainly driven by projects in South East Asia and South Asia .
13
8. A review of the performance of the group, to the extent necessary for a reasonable understanding of the group’s business. It must include a discussion of the following:- Cost of sales and gross profit
HY2010 vs HY2009
In consistent with a lower proportion of revenue, cost of sales decreased by US$6.6 million or 4.3%, from US$156.5 million in HY2009 to US$149.9 million in HY2010. Cost of sales comprises mainly charter hire, sub-contractor cost, material cost, salaries and labour related cost and consumables. Notwithstanding the drop in revenue, gross profit margin remained stable, 20.9% in HY2009 and 21.7% in HY2010.
2Q2010 vs 2Q2009
As the Group recorded lower revenue in 2Q2010, cost of sales decreased by US$3.8 million by or 4.4%, from US$87.0 million in 2Q2009 to US$83.2 million in 2Q2010. Gross profit margin remained stable, 21.5% in 2Q2009 and 22.1% in 2Q2010.
Other operating income
The breakdown of other operating income is as follows:
Group 2Q2010 2Q2009 HY2010 HY2009 US$’000 US$’000 US$’000 US$’000 Gain on disposal of property, plant and equipment 214 - 292 862 Gain on disposal of assets held for sale 9,975 4,475 9,975 7,178 Interest income 128 223 259 275 Foreign exchange gain - 1,537 - 400 Others (165) (370) 4,544 274 10,152 5,865 15,070 8,989
HY2010 vs HY2009
Included in others was US$3.6 million gain arose from termination of cross currency interest rate
swap contract (“swap contracts”) relating to the Multicurrency Medium Term Notes (“MTN”) series 1 and 2 in first quarter 2010 (“1Q2010”). The Group utilized swap contracts to hedge significant future transactions and cash flows on its fixed and floating rate MTN, and the changes of fair value of these swap contracts are recognized in hedging reserve (other comprehensive income). As a result of the termination of swap contracts in 1Q2010, the gain in hedging reserve is recognized and was reclassified to profit and loss.
Gain on disposal of assets held for sale increased by US$2.8 million, from US$7.2 million in HY2009 to US$10.0 million in HY2010. The increase was due to sales of a Diving Support Vessel (“DSV”) under a sale and leaseback transaction and a barge to a joint venture.
14
8. A review of the performance of the group, to the extent necessary for a reasonable understanding of the group’s business. It must include a discussion of the following:- (cont’d)
Other operating income (cont’d)
2Q2010 vs 2Q2009 For 2Q2010, total other operating income increased by US$4.3 million or 73.1%, from US$5.9 million in 2Q2009 to US$10.2 million in 2Q2010 due mainly to the deliveries of two vessels in 2Q2010 as mentioned above.
Administrative expenses
HY2010 vs HY2009/ 2Q2010 vs 2Q2009
Administrative expenses for HY2010 increased by US$3.7 million or 29.0%, from US$12.8 million in HY2009 to US$16.5 million in HY2010. As for 2Q2010, administrative expenses increased by US$1.5 million or 21.4%, from US$7.4 million in HY2009 to US$8.9 million in HY2010. The increase was due mainly to increase in business development cost, staff related costs, higher office and administrative expenses as more employees were hired to support the Group business expansion. As at 30 June 2010 and 30 June 2009, the Group has 1,224 and 918 employees, respectively.
Other operating expenses
The breakdown of other operating expenses is as follows: Group 2Q2010 2Q2009 HY2010 HY2009 US$’000 US$’000 US$’000 US$’000 Fair value loss on financial liabilities designated as at fair value through profit or loss 2,270 - 2,270 - Foreign exchange losses 553 - 4,065 - Loss on disposal of associates - 218 - 218 Loss on dilution of subsidiary/ associate 1,102 - 1,102 - Others 50 82 292 171 3,975 300 7,729 389
HY2010 vs HY2009/ 2Q2010 vs 2Q2009
Other operating expenses for HY2010 increased by US$7.3 million, from US$389,000 in HY2009 to US$7.7 million in HY2010. As for 2Q2010, other operating expenses increased by US$3.7 million, from approximately US$300,000 in 2Q2009 to US$4.0 million in 2Q2010. The increase was due mainly to:
15
8. A review of the performance of the group, to the extent necessary for a reasonable understanding of the group’s business. It must include a discussion of the following:- (cont’d)
HY2010 vs HY2009/ 2Q2010 vs 2Q2009 (cont’d) Other operating expenses (cont’d) (i) increase in net foreign exchange losses of US$4.1 million. The foreign exchange losses
mainly arose from the unwinding of cash flow hedges in relation to the MTN series 1 and series 2 in 1Q2010. As a result of unwinding the cash flow hedges, the Company revalued the MTN series 1 and series 2 that are denominated in Singapore dollar at quarter end exchange rate and the said foreign exchange differences were recognized in income statement; and
(ii) changes in fair value of financial derivative embedded in the Convertible Bonds issued in fourth quarter of 2009 of US$2.3 million, such changes in fair value was accounted for at fair value through profit or loss in 2Q2010. The fair value of financial derivative embedded in the Convertible Bonds is reviewed periodically.
(iii) Loss on dilution of subsidiary/ associate of US$1.1 million. The loss was the result of the Company not participating in the share issue of a formerly subsidiary, namely PT Swiber Berjaya (“PTSB”) on a pro-rata basis. In 2Q2010, PTSB increased its paid up and issue share capital by allotting 2,500 ordinary shares for approximately USD138,000 to the Company (the “Subscription”), and 4,500 ordinary shares for approximately US$248,000 to other existing shareholder of PTSB. Following the Share Increase, PTSB has an issued and paid up share capital of IDR5,000,000,000 divided into 10,000 ordinary shares and the Company’s interest in PTSB was reduced to 49%. Thus, PTSB has ceased to be a subsidiary and become an associated company of the Company.
Share of (losses)/ profit from associates and joint ventures
HY2010 vs HY2009 Share of profit of associates and joint ventures decreased by US$1.3 million or 44.5%, from US$2.9 million in HY2009 to US$1.6 million in HY2010. The decrease was due mainly to share of losses from a joint venture of approximately US$1.0 million. The said joint venture commenced operation at end of 1Q2010 and was under operating deficit during the period under review as a result of high operation expenditure at the initial stage of operation. Excluding the abovementioned joint venture, other associates and joint ventures continue to deliver positive results except for few associates and joint ventures which are still in its start-up phase and recorded small operating losses. 2Q2010 vs 2Q2009 For 2Q2010, the Group recorded US$29,000 share of losses from associates and joint ventures, as compared to share of profit from associates and joint ventures of US$1.9 million in 2Q2009. Total profit contribution from associate and joint ventures in 2Q2010 was approximately US$960,000 but was offset with share of losses from few associates and joint ventures of approximately US$989,000 as mentioned above.
16
8. A review of the performance of the group, to the extent necessary for a reasonable understanding of the group’s business. It must include a discussion of the following:- (cont’d) Finance costs HY2010 vs HY2009/ 2Q2010 vs 2Q2009 Finance cost for HY2010 increased by US$3.1 million or 50.0%, from US$6.4 million in HY2009 to US$9.5 million in HY2010. As for 2Q2010, finance costs increased by US$1.9 million or 62.6%, from US$2.9 million in 2Q2009 to US$4.8 million in 2Q2010. The higher interest expense incurred was due mainly to the issuance of the US$100 million 5% Convertible Bond in the fourth quarter of financial year 2009.
Profit before taxation
HY2010 vs HY2009/ 2Q2010 vs 2Q2009
Profit before taxation for HY2010 decreased by US$9.3 million or 27.7%, from US$33.7 million in HY2009 to US$24.4 million in HY2010. As for 2Q2010, profit before taxation decreased by US$5.0 million or 23.6%, from US$21.0 million in 2Q2009 to US$16.0 million in 2Q2010. The decrease mainly attributed to higher operating expenses.
Statement of Financial Position
Trade receivables
Trade receivables decreased by US$25.0 million from US$141.8 million as at 31 December 2009 to US$116.8 million as at 30 June 2010. The decrease was due mainly to collection from customers. Subsequent to 30 June 2010, the Group received settlement of approximately US$50.0 million from its customers. The Company has carefully assessed the trade receivables and believes that there is no significant change in credit quality. Engineering work in progress in excess of progress billing
Engineering work-in-progress in excess of progress billing (“EWIP”) decreased by US$25.5
million from US$202.8 million as at 31 December 2009 to US$177.3 million as at 30 June 2010. The decrease was due mainly to:
(i) combination of different projects being executed and timing difference between the billing and
revenue recognized for projects in progress; and
(ii) completion of several projects.
EWIP also included deferred cost relating to a project in South Asia which has been deferred in FY2009 due to changes of scope and with the change, the Group was awarded additional works by the oil major. The work is expected to commence in fourth quarter of 2010 and is expected to be completed in first quarter of 2011.
Subsequent to 30 June 2010, progress billing of approximately US$54.0 million has been
approved for billing by customers for work performed.
17
8. A review of the performance of the group, to the extent necessary for a reasonable understanding of the group’s business. It must include a discussion of the following:- (cont’d)
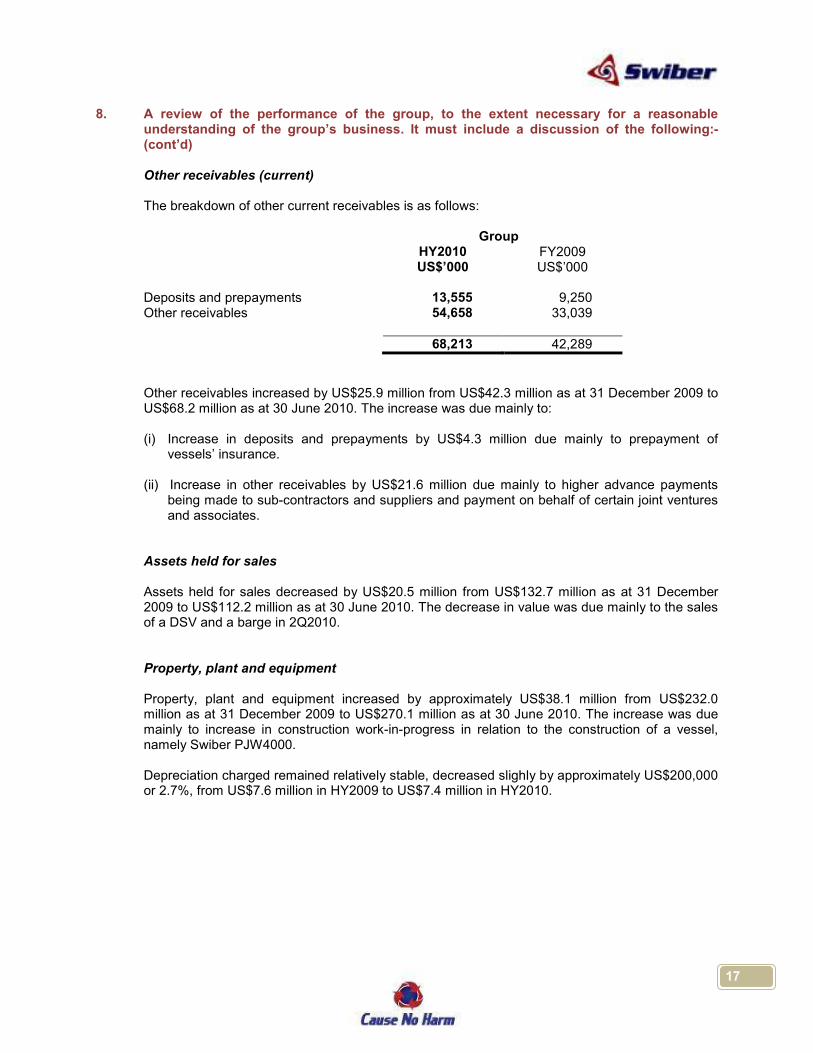
Other receivables (current)
The breakdown of other current receivables is as follows:
Group
HY2010 FY2009 US$’000 US$’000 Deposits and prepayments 13,555 9,250 Other receivables 54,658 33,039 68,213 42,289
Other receivables increased by US$25.9 million from US$42.3 million as at 31 December 2009 to US$68.2 million as at 30 June 2010. The increase was due mainly to: (i) Increase in deposits and prepayments by US$4.3 million due mainly to prepayment of
vessels’ insurance.
(ii) Increase in other receivables by US$21.6 million due mainly to higher advance payments being made to sub-contractors and suppliers and payment on behalf of certain joint ventures and associates.
Assets held for sales
Assets held for sales decreased by US$20.5 million from US$132.7 million as at 31 December 2009 to US$112.2 million as at 30 June 2010. The decrease in value was due mainly to the sales of a DSV and a barge in 2Q2010. Property, plant and equipment
Property, plant and equipment increased by approximately US$38.1 million from US$232.0 million as at 31 December 2009 to US$270.1 million as at 30 June 2010. The increase was due mainly to increase in construction work-in-progress in relation to the construction of a vessel, namely Swiber PJW4000. Depreciation charged remained relatively stable, decreased slighly by approximately US$200,000 or 2.7%, from US$7.6 million in HY2009 to US$7.4 million in HY2010.

18
8. A review of the performance of the group, to the extent necessary for a reasonable understanding of the group’s business. It must include a discussion of the following:- (cont’d) Other receivables (non-current) The breakdown of other non-current receivables is as follows: Group HY2010 FY2009 US$’000 US$’000 Deposits and prepayments 20,061 27,883 Other receivables 37,450 17,850 57,511 45,733
Other non-current receivables increased by US$11.8 million from US$45.7 million as at 31 December 2009 to US$57.5 million as at 30 June 2010. The net increase was due to partial offsetting of the followings: (i) decrease in deposits and prepayments by US$7.8 million. Deposits and prepayments mostly
comprise of prepayment of vessels conversion and pre-operating cost and were amortized over the term of the charter; and
(ii) increase in other receivables of US$19.6 million. Other receivables pertain mainly to seller credits granted under the sales and leaseback transactions. The Group has entered into sales and lease back agreements (“Agreements”) with several outside parties, under the Agreements, the Group has granted each buyer of the vessel credit facilities in connection with their purchase of vessel. The seller credits shall serve as security for the obligations of the Group under the respective bareboat charter parties. These deposits will be refunded in the event that the Company decides not to seek for renewal upon the expiry of the Agreement. As such, the seller credits are recorded as deposits in other receivables.
Total current and non-current borrowings
Total current and non-current borrowings include bank loans, bonds, convertible loan notes and finance leases. Total current and non-current borrowings increased by US$33.0 million from US$338.1 million as at 31 December 2009 to US$371.1 million as at 30 June 2010. Net gearing ratio was 0.84 times as at 31 December 2009, 0.81 times as at 31 March 2010 and 0.91 times as at 30 June 2010.
19
8. A review of the performance of the group, to the extent necessary for a reasonable understanding of the group’s business. It must include a discussion of the following:- (cont’d)
Total current and non-current borrowings (cont’d)
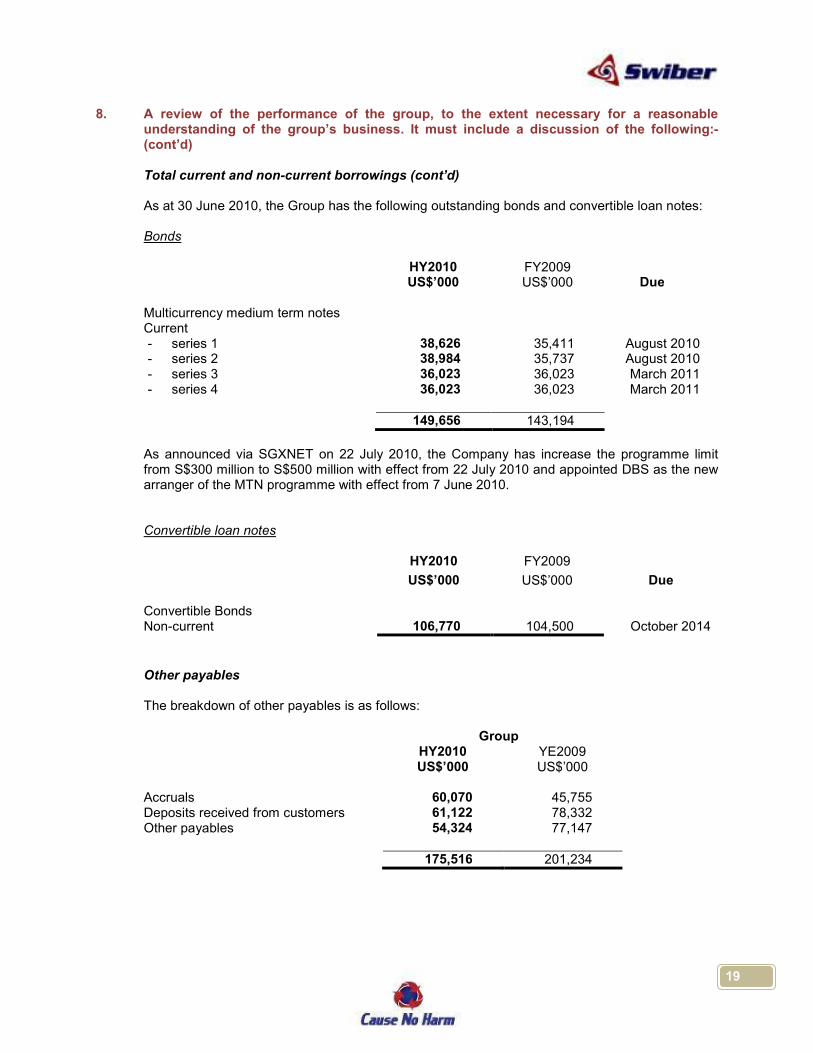
As at 30 June 2010, the Group has the following outstanding bonds and convertible loan notes:
Bonds
HY2010 FY2009 US$’000 US$’000 Due Multicurrency medium term notes Current - series 1 38,626 35,411 August 2010 - series 2 38,984 35,737 August 2010 - series 3 36,023 36,023 March 2011 - series 4 36,023 36,023 March 2011 149,656 143,194
As announced via SGXNET on 22 July 2010, the Company has increase the programme limit
from S$300 million to S$500 million with effect from 22 July 2010 and appointed DBS as the new arranger of the MTN programme with effect from 7 June 2010.
Convertible loan notes HY2010 FY2009
US$’000 US$’000 Due Convertible Bonds Non-current 106,770 104,500 October 2014
Other payables
The breakdown of other payables is as follows: Group HY2010 YE2009 US$’000 US$’000 Accruals 60,070 45,755 Deposits received from customers 61,122 78,332 Other payables 54,324 77,147 175,516 201,234
20
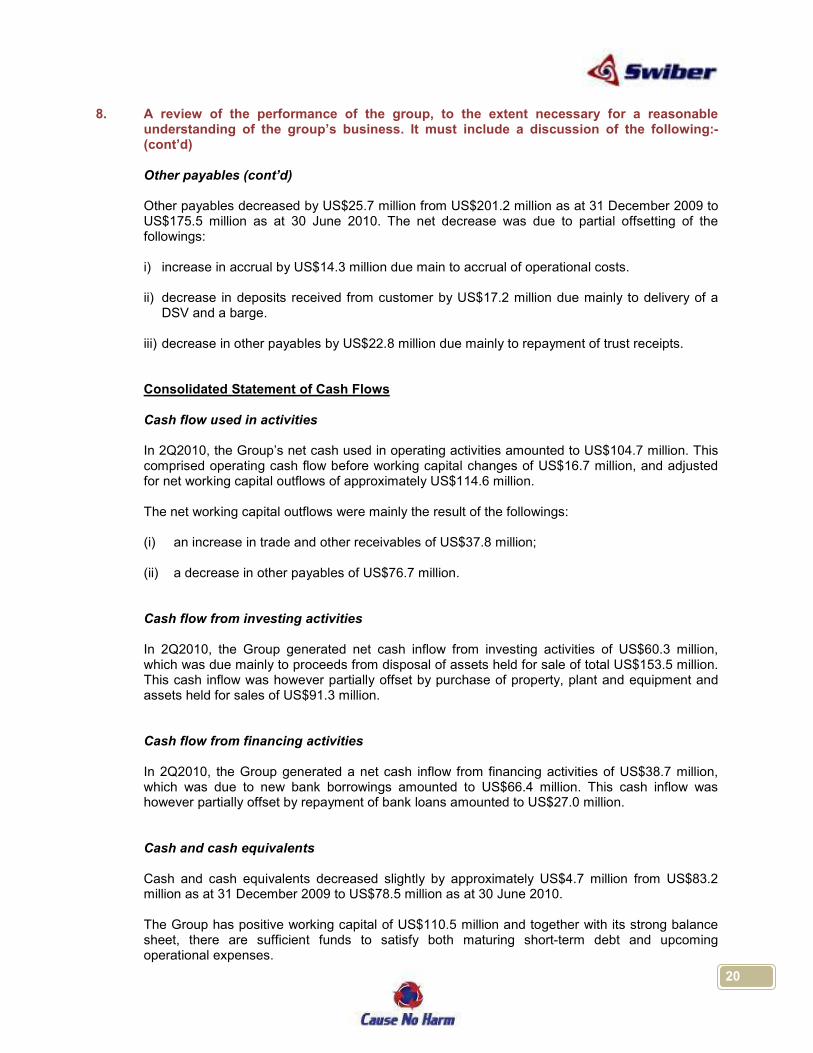
8. A review of the performance of the group, to the extent necessary for a reasonable understanding of the group’s business. It must include a discussion of the following:- (cont’d) Other payables (cont’d) Other payables decreased by US$25.7 million from US$201.2 million as at 31 December 2009 to US$175.5 million as at 30 June 2010. The net decrease was due to partial offsetting of the followings: i) increase in accrual by US$14.3 million due main to accrual of operational costs.
ii) decrease in deposits received from customer by US$17.2 million due mainly to delivery of a
DSV and a barge.
iii) decrease in other payables by US$22.8 million due mainly to repayment of trust receipts.
Consolidated Statement of Cash Flows
Cash flow used in activities
In 2Q2010, the Group’s net cash used in operating activities amounted to US$104.7 million. This comprised operating cash flow before working capital changes of US$16.7 million, and adjusted for net working capital outflows of approximately US$114.6 million. The net working capital outflows were mainly the result of the followings: (i) an increase in trade and other receivables of US$37.8 million;
(ii) a decrease in other payables of US$76.7 million. Cash flow from investing activities
In 2Q2010, the Group generated net cash inflow from investing activities of US$60.3 million, which was due mainly to proceeds from disposal of assets held for sale of total US$153.5 million. This cash inflow was however partially offset by purchase of property, plant and equipment and assets held for sales of US$91.3 million. Cash flow from financing activities In 2Q2010, the Group generated a net cash inflow from financing activities of US$38.7 million, which was due to new bank borrowings amounted to US$66.4 million. This cash inflow was however partially offset by repayment of bank loans amounted to US$27.0 million.
Cash and cash equivalents Cash and cash equivalents decreased slightly by approximately US$4.7 million from US$83.2 million as at 31 December 2009 to US$78.5 million as at 30 June 2010. The Group has positive working capital of US$110.5 million and together with its strong balance sheet, there are sufficient funds to satisfy both maturing short-term debt and upcoming operational expenses.
21
9. Where a forecast, or a prospect statement, has been previously disclosed to shareholders, any variance between it and the actual results.
Not applicable.
10. A commentary at the date of announcement of the significant trends and competitive
conditions of the industry in which the group operates and any known factors or events that may affect the group in the next reporting period and the next 12 months.
The Group is encouraged by the increasing activities in the oil and gas sector supported by stable
oil prices. The Group is cautiously optimistic about the long-term outlook of the offshore industry, remain prudent in managing its business operations and cost efficiencies; and continuously exploring new opportunities to leverage on the strong track record. As of August 2010, the Group has an order book of approximately US$915 million and the order book is expected to contribute to the Group’s results, barring unforeseen circumstances.
The Company’s subsidiary, Kreuz Holdings Limited (“KHL”), was successfully listed on the
Official List of the Catalist board of the Singapore Exchange Securities Trading Limited (the "SGX-ST") on 29 July 2010. The successful initial public offering of KHL is a major milestone in the Company’s corporate history. KHL plans to expand its range of services through the acquisition of new operating assets, intensify its marketing and bidding efforts, increasing its penetration in its existing markets as well as explore opportunities in new markets.
11. Dividend
(a) Current Financial Period Reported On
Any dividend recommended for the current financial period reported on? No.
(b) Corresponding Period of the Immediately Preceding Financial Year
Any dividend declared for the corresponding period of the immediately preceding financial year? No.
(c) Date Payable
Not applicable.
(d) Book Closure Date. Not applicable.
12. If no dividend has been declared/recommended, a statement to that effect. No dividend for the six months ended 30 June 2010 is declared or recommended.
22
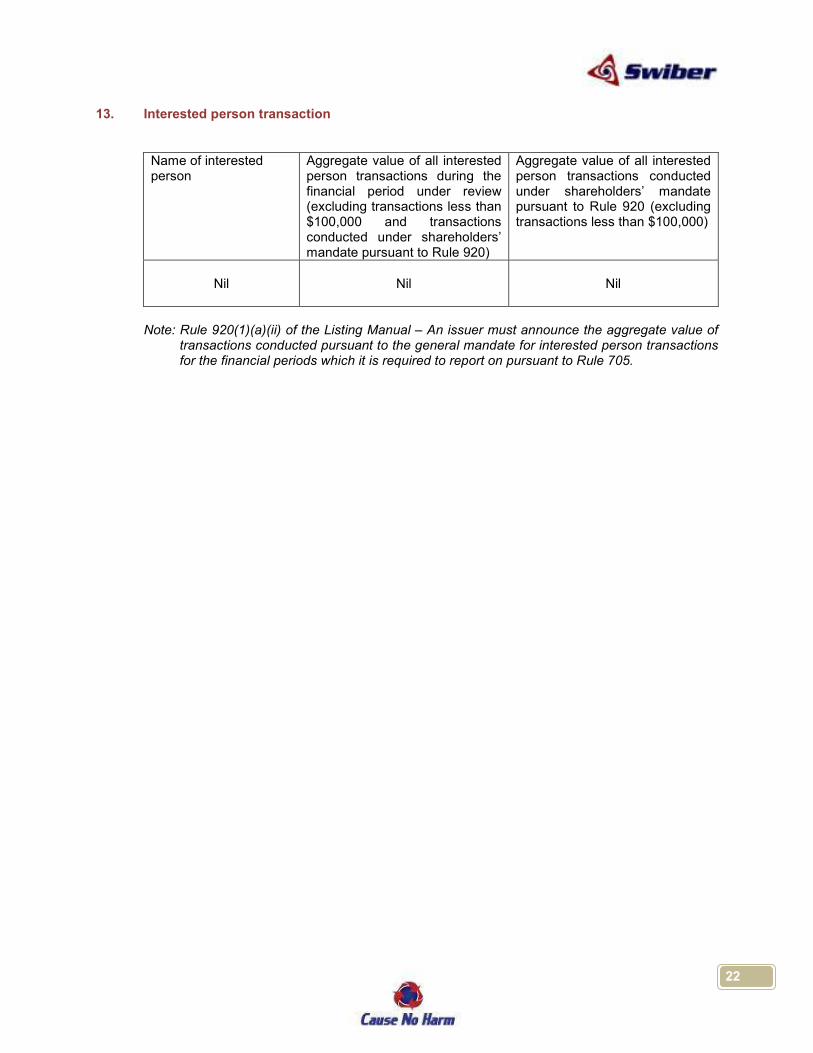
13. Interested person transaction
Name of interested person
Aggregate value of all interested person transactions during the financial period under review (excluding transactions less than $100,000 and transactions conducted under shareholders’ mandate pursuant to Rule 920)
Aggregate value of all interested person transactions conducted under shareholders’ mandate pursuant to Rule 920 (excluding transactions less than $100,000)
Nil
Nil
Nil
Note: Rule 920(1)(a)(ii) of the Listing Manual – An issuer must announce the aggregate value of
transactions conducted pursuant to the general mandate for interested person transactions for the financial periods which it is required to report on pursuant to Rule 705.

23
STATEMENT BY DIRECTORS PURSUANT TO RULE 705(5) OF THE LISTING MANUAL
On behalf of the Board of Directors of the Company, we confirm, to the best of our knowledge, nothing has come to the attention of the Board of Directors of the Company which may render the second quarter and six months’ financial results for the period ended 30 June 2010 to be false or misleading in any material respect. On behalf of the Board of Directors Goh Kim Teck, Raymond Wong Chin Sing, Francis Director Director BY ORDER OF THE BOARD Lee Bee Fong Company secretary 13 August 2010