Swallowing Outcomes in Head & Neck Cancer Jo Patterson Macmillan Speech & Language...
30
Swallowing Outcomes in Head & Neck Cancer Jo Patterson Macmillan Speech & Language Therapist/Research Fellow
-
Upload
clarissa-grant -
Category
Documents
-
view
220 -
download
0
Transcript of Swallowing Outcomes in Head & Neck Cancer Jo Patterson Macmillan Speech & Language...

Swallowing Outcomes in Head & Neck Cancer
Jo Patterson
Macmillan Speech & Language Therapist/Research Fellow
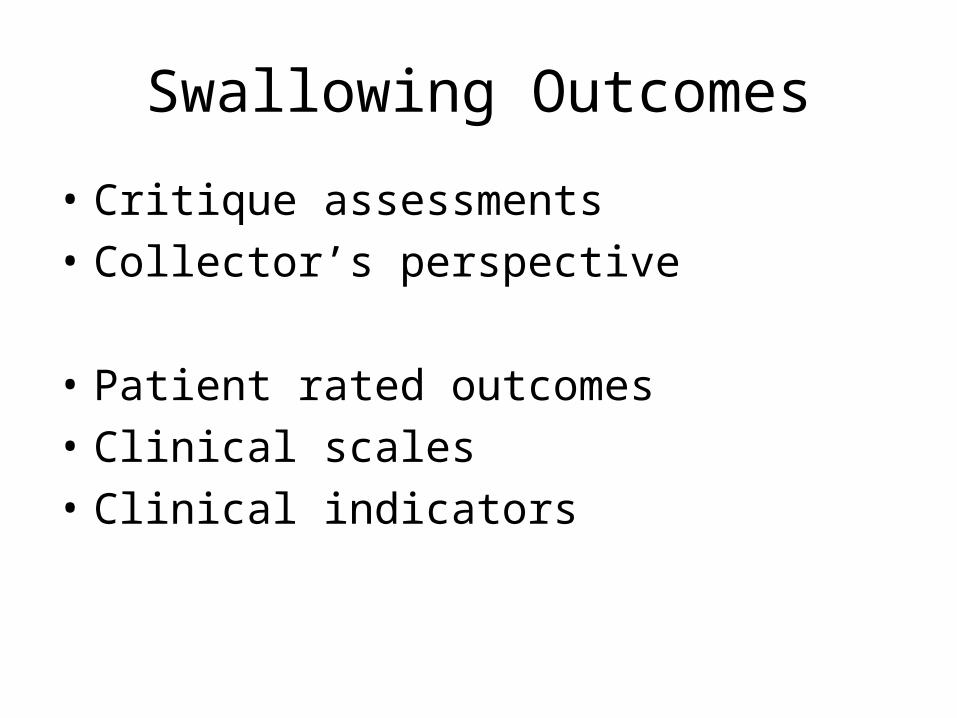
Swallowing Outcomes
• Critique assessments
• Collector’s perspective
• Patient rated outcomes
• Clinical scales
• Clinical indicators

Patient reported outcomes
• SWAL-QOL / SWAL-CARE
• M.D.Anderson Dysphagia Inventory

SWAL-QOL (McHorney 2002)
• Devised from patient focus group (N=549, 14.5% head & neck cancer)
• Good correlation with UWQOL (Lovell 2005)
• Moderately related to pathophysiology

Measurement tool• SWAL-QOL 2002 (44 items, 11 domains)
general burden* (fatigue)food selection* (sleep)eating duration (communication)eating desirefear of eatingmental health*social function*symptom frequency
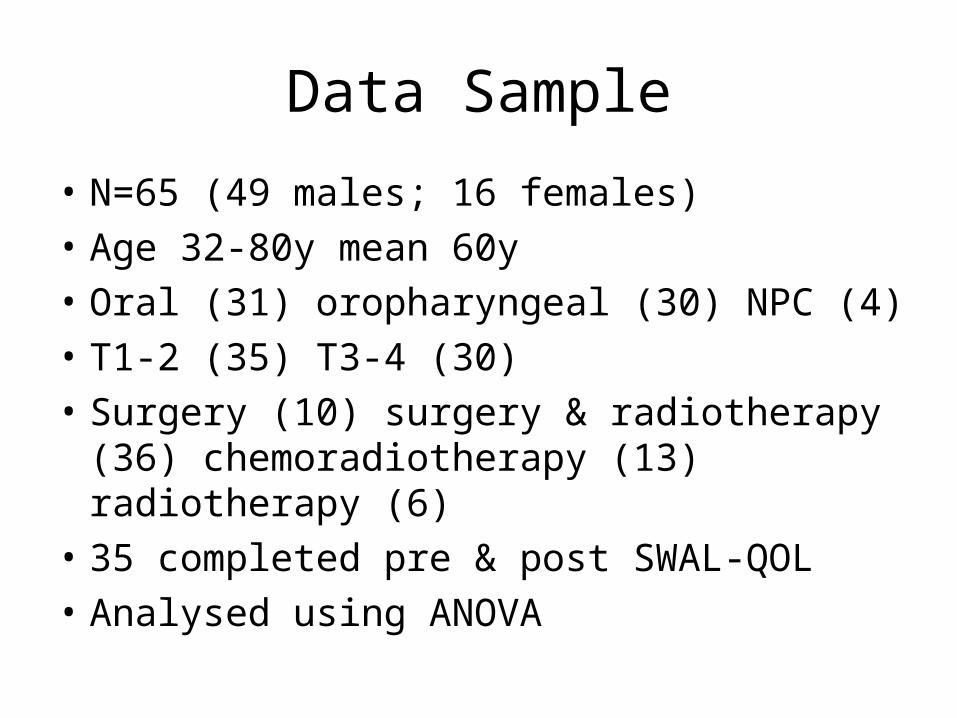
Data Sample
• N=65 (49 males; 16 females)
• Age 32-80y mean 60y
• Oral (31) oropharyngeal (30) NPC (4)
• T1-2 (35) T3-4 (30)
• Surgery (10) surgery & radiotherapy (36) chemoradiotherapy (13) radiotherapy (6)
• 35 completed pre & post SWAL-QOL
• Analysed using ANOVA
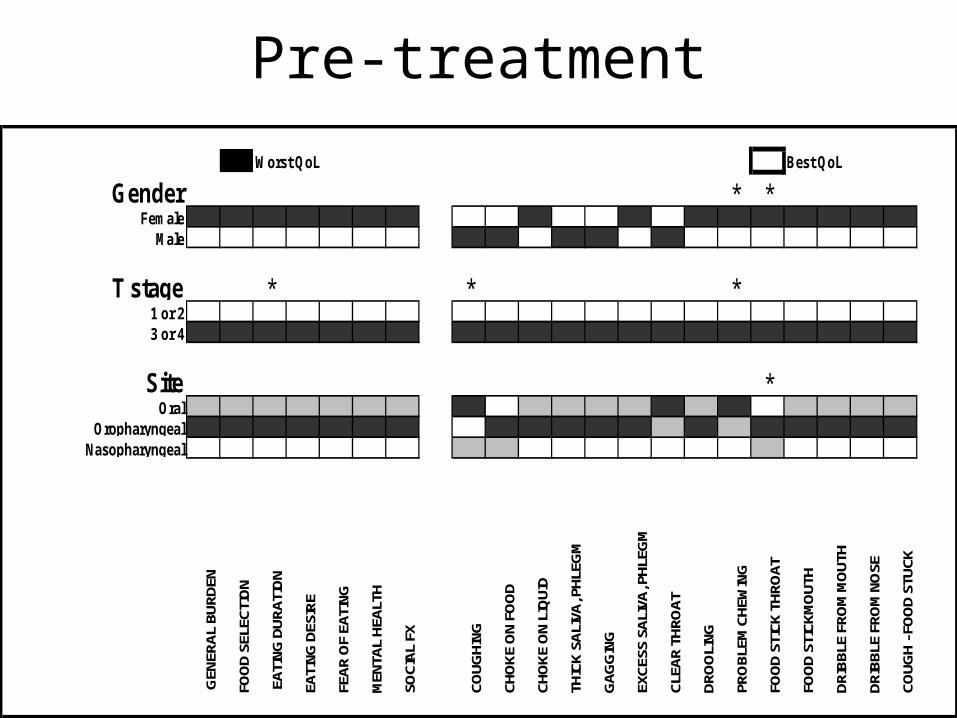
Pre-treatment
Worst QoL Best QoL
Gender * *Female
Male
T stage * * *1 or 23 or 4
Site *Oral
OropharyngealNasopharyngeal
GEN
ERAL
BUR
DEN
FOO
D SE
LECT
ION
EAT
ING
DUR
ATIO
N
EATI
NG D
ESIR
E
FEAR
OF
EATI
NG
MEN
TAL
HEAL
TH
SOCI
AL F
X
COUG
HING
CHO
KE O
N FO
OD
CHO
KE O
N LI
QUI
D
THIC
K SA
LIVA
, PHL
EGM
GAG
GIN
G
EXCE
SS S
ALIV
A, P
HLEG
M
CLEA
R TH
ROAT
DRO
OLI
NG
PRO
BLEM
CHE
WIN
G
FOO
D ST
ICK
THRO
AT
FOO
D ST
ICKM
OUT
H
DRIB
BLE
FRO
M M
OUT
H
DRIB
BLE
FRO
M N
OSE
COUG
H - F
OO
D ST
UCK

6 months post treatmentWorst QoL Best QoL
Gender *Female
Male
T stage1 or 23 or 4
Site *Oral
OropharyngealNasopharyngeal
Treatment *Surgery
Surgery & RadiotherapyChemoradiotherapy
Radiotherapy
GE
NE
RA
L B
UR
DE
N
FO
OD
SE
LE
CT
ION
EA
TIN
G D
UR
AT
ION
EA
TIN
G D
ES
IRE
FE
AR
OF
EA
TIN
G
ME
NT
AL
HE
AL
TH
SO
CIA
L F
X
CO
UG
HIN
G
CH
OK
E O
N F
OO
D
CH
OK
E O
N L
IQU
ID
TH
ICK
SA
LIV
A, P
HL
EG
M
GA
GG
ING
EX
CE
SS
SA
LIV
A, P
HL
EG
M
CL
EA
R T
HR
OA
T
DR
OO
LIN
G
PR
OB
LE
M C
HE
WIN
G
FO
OD
ST
ICK
TH
RO
AT
FO
OD
ST
ICK
MO
UT
H
DR
IBB
LE
FR
OM
MO
UT
H
DR
IBB
LE
FR
OM
NO
SE
CO
UG
H -
FO
OD
ST
UC
K

Collector’s perspective
• Author’s report 14 mins to complete – much longer needed
• Difficult to analyse – many components
• Good sections – includes symptoms
• Not to be done cross-sectional

M.D. Anderson Dysphagia Inventory (Chen 2001)
• 20 items (sub-groups emotion, physical, function)
• Devised from professionals (SALTs & Surgeons)• Good reliability• Correlates with UWQOL• No association with aspiration (Gillespie 2005)• Used as outcome for swallowing exercises
(Kulbersh 2006)

MDADI pre & post CRT Demographics
T1 T2 T3 T4 Tx
Orophx 6 9 7 24 -
Hypophx 2 3 6 6 -
Larynx 23 6 11 4 -
U/k 1° - - - - 9
Total = 116

Comparison pre & post

Collector’s perspective
• 10 mins to complete
• ‘no opinion’ poses difficulties
• Difficult to use on someone without swallowing difficulties
• Difficult to use on NBM patients
• One item complex double negative
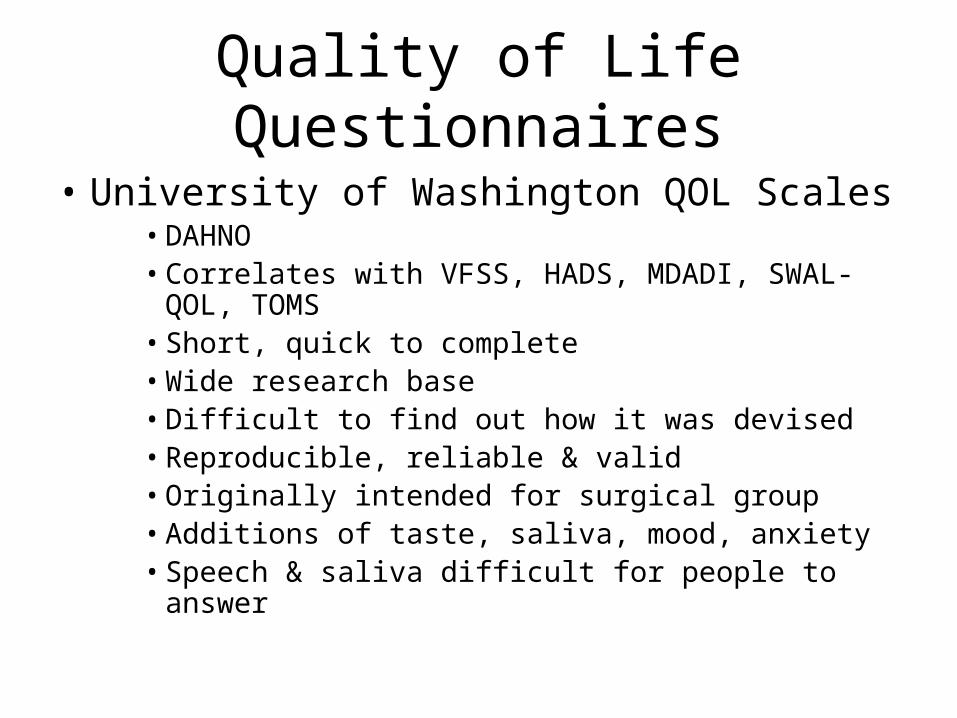
Quality of Life Questionnaires
• University of Washington QOL Scales• DAHNO• Correlates with VFSS, HADS, MDADI, SWAL-
QOL, TOMS• Short, quick to complete• Wide research base• Difficult to find out how it was devised• Reproducible, reliable & valid• Originally intended for surgical group• Additions of taste, saliva, mood, anxiety• Speech & saliva difficult for people to answer
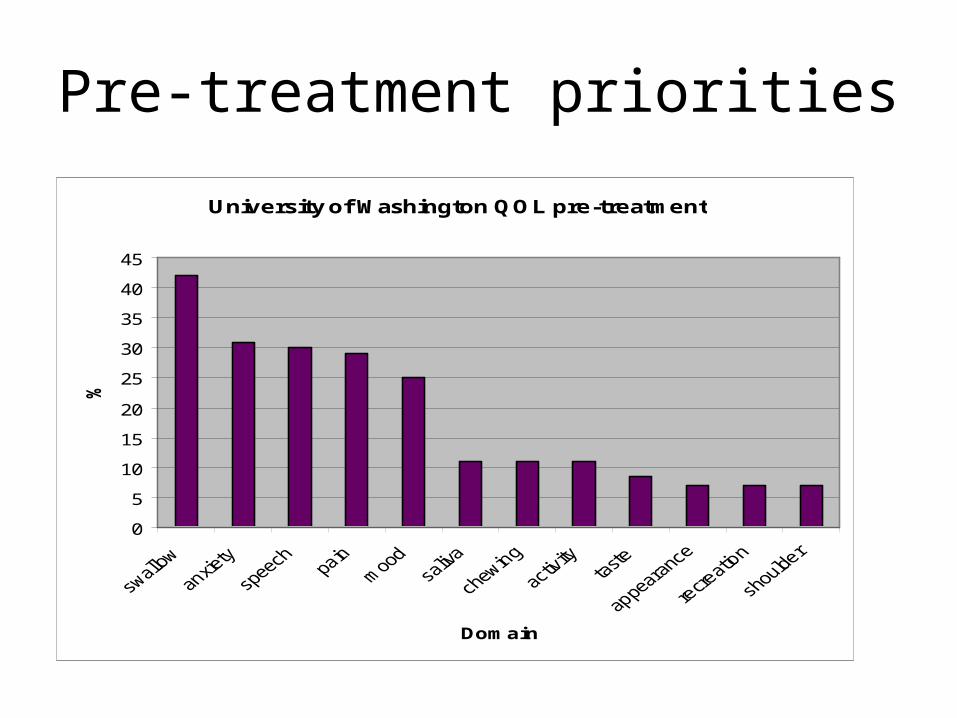
Pre-treatment priorities
University of Washington QOL pre-treatment
0
5
10
15
20
25
30
35
40
45
Domain
%

Clinical Scales
• Performance Status Scales (List ’90)
• Therapy Outcome Measures (TOMS)
• FIGS
Performance Status Scales (List 1990)
• Developed by surgeons, oncologists & SALTs• Purpose; research & clinical• Normalcy of diet, eating in public,
communication• Rated by ‘health professionals’• High reliability• Correlates with QOL• Included in DAHNO dataset

Diet scale pre vs. 3 months post ChemoradiotherapyPerformance Status Scale pre to 3 month difference
0
10
20
30
40
50
60
70
80
90
100
NPC Unknown Orophx Hypophx Larynx
Site
Sco
re d
iffe
ren
ce

Collectors perspective
• Quick
• Can be done by other staff
• Some diets difficult to grade
• Can give false positive results
• Gradations ?equal
• Large literature base for comparison
• ?swallowing outcome

Therapy Outcome Measures(Enderby ’77)
10 core patients specific scales
• ‘Laryngectomy’ only scale specific to H&NC
• Scales on voice, dysarthria, phonology & dysphagia
• Pilot study Radford et al 2003– Correlates with UWQOL scales– ?modification for H&NC

Functional Intraoral Glasgow Scale (FIGS)(Goldie 2006)
• Originated Canniesburn Hospital
• 3 scales – chew, swallow & speech
• Total score of all 3 items

Clinical Indicators
• Aspiration / penetration
• Residue
• Swallowing efficiency
• Feeding tube dependency

Aspiration / Penetration
• H&NC literature focuses on aspiration
• Penetration / aspiration scale (Rosenbek)– Increases reliability of findings– One score– Requires instrumental assessment– ?meaningful to clinical picture / patient

% Aspiration Post CRT
010
203040
506070
8090
100
Nguyen Kotz Smith Pauloski Graner Eisbruch Chang
% aspiration
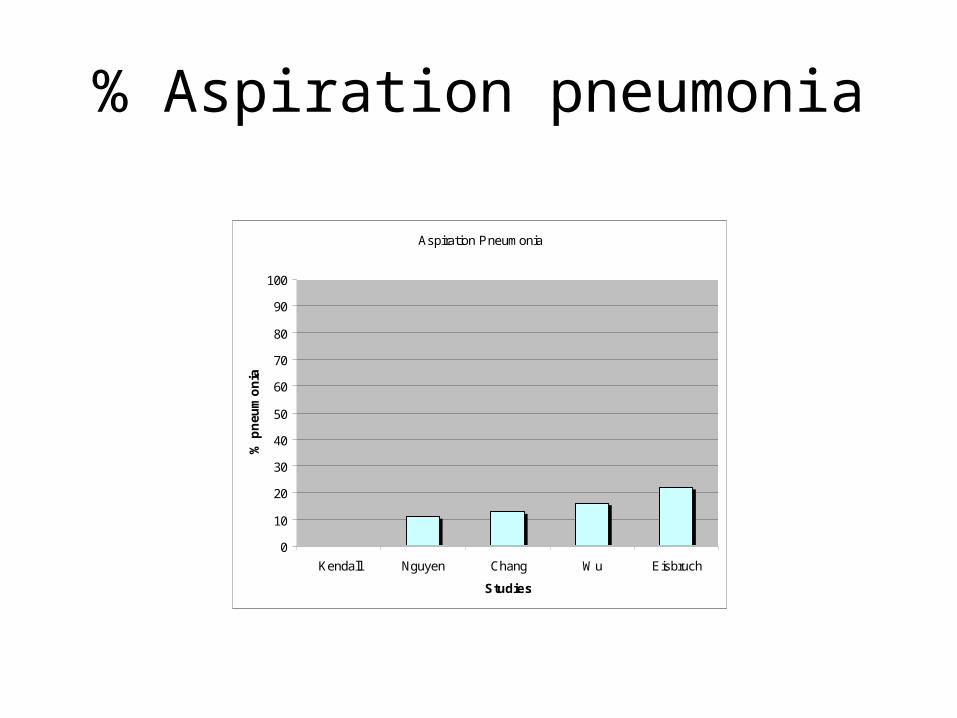
% Aspiration pneumonia
Aspiration Pneumonia
0
10
20
30
40
50
60
70
80
90
100
Kendall Nguyen Chang Wu Eisbruch
Studies
% p
neu
mo
nia

Swallowing Efficiency
• Residue
• Oropharyngeal swallowing efficiency
• Water swallow test
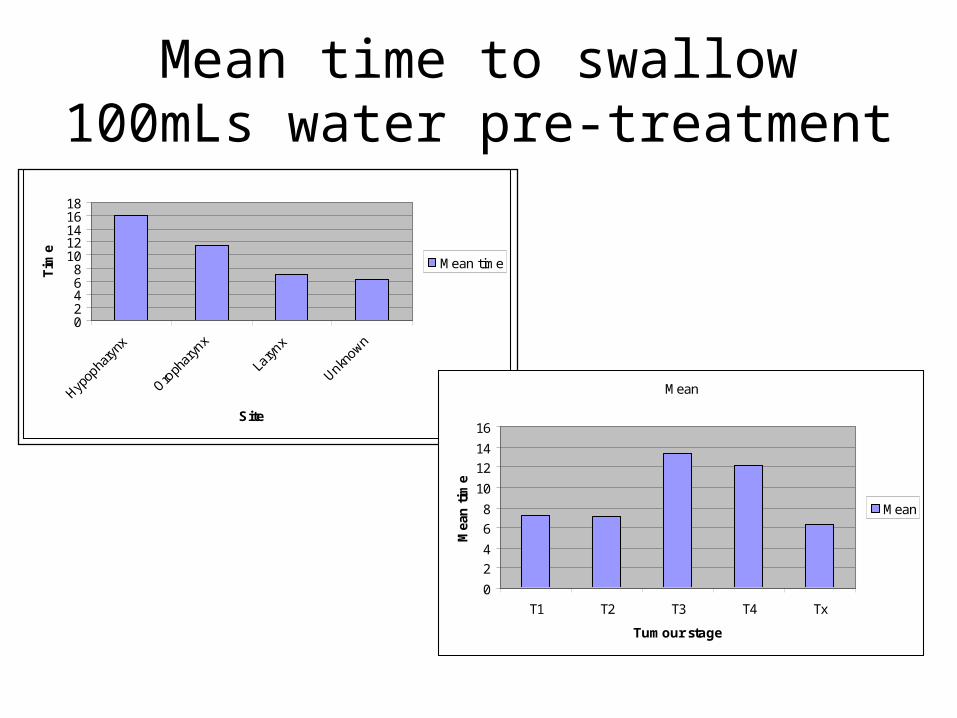
Mean time to swallow 100mLs water pre-treatment
Mean time
02468
1012141618
Hypop
hary
nx
Oroph
aryn
x
Laryn
x
Unknown
Site
Tim
e
Mean time
Mean
0
2
4
6
8
10
12
14
16
T1 T2 T3 T4 Tx
Tumour stage
Mea
n t
ime
Mean

Tube feeding
NPC T.Base U/k 1° Total
No Peg 4 12 11 27(40%)
0-4week - 5 - 5(12%)
4-12wks 1 1 1 3(7%)
12-24wks 1 7 1 9(22%)
24-52wks 4 11 2 17(14%)
>52wks - 6 1 7(17%)
Total 10 42 16 68

DAHNO
• Was the patient seen for pre treatment SALT assessment?
• PSS Normalcy of Diet
• Weight
• Type & timing of nutritional support

Summary
• Choice of measures• One-dimensional, cross-sectional misleading• Needs to be longitudinal, set time points• Simple / collectable• What questions to ask of the data• It will require dedicated time• ?interventions• DAHNO