Sustainable Stormwater Funding for the Upper Charles River
54
Horsley Witten Group, Inc. Horsley Witten Group, Inc. Sustainable Stormwater Funding for the Upper Charles River Steering Committee Meeting #3 February 09, 2011
Transcript of Sustainable Stormwater Funding for the Upper Charles River

Horsley Witten Group, Inc.Horsley Witten Group, Inc.
Sustainable Stormwater
Funding for the Upper
Charles River
Steering Committee Meeting #3
February 09, 2011

Horsley Witten Group, Inc.Horsley Witten Group, Inc.
Meeting Post-Script
The costs presented herein and at the Feb 9, 2011 Steering Committee Mtg in Franklin,
MA, should be viewed as preliminary and based on best professional estimates for
calculating a planning level boundary for implementing phosphorous controls in the
three towns of Bellingham, Franklin and Milford. These initial estimates are likely to
be refined in the coming weeks and months.
The lower and upper cost limits are necessary to „calibrate‟ a cost of storm water
services range for use in providing meaningful revenue projections for this storm
water utility project. Without the counter-balancing revenue context however, some
attendees may have viewed the presented upper threshold costs as a determination
of immediate out-of-pocket expense. In all probability, this would be an incorrect
interpretation of the presented information.
This post-script is intended to clarify that the case studies used to illustrate the upper
cost limit represent high-end scenarios under an assumption that requisite
phosphorous load reductions cannot be achieved from other less technically or
otherwise less logistically-complicated areas, such as the range of non-structural
measures.
Draft findings that incorporate the revenue-side calculus of this analysis will be presented
at a future Steering Committee meeting (TBA).
R. Cody, EPA Region 1

Horsley Witten Group, Inc.Horsley Witten Group, Inc.
Agenda
1:00-1:20 Review on-going assessment of existing
program costs
1:20-1:45 Review approach for estimating
compliance costs of TMDL/Small MS4
Stormwater GP
1:45-2:15 Examples of TP reduction:
- 15 North Main St – Bellingham;
- Milford Public Library and vicinity;
- Spruce Pond Brook subwatershed – Franklin.
2:15-2:45 Open Discussion; Input from potentially
regulated DD properties
2:45 – 3:00 Survey of stormwater infrastructure on DD
properties

Horsley Witten Group, Inc.Horsley Witten Group, Inc.
Stormwater Program Cost Centers
• Administrative;
• Billing and Finance;
• Regulation/Enforcement;
• Engineering/Master Planning;
• Operations and Implementation;
• Monitoring

Horsley Witten Group, Inc.Horsley Witten Group, Inc.
Administrative Costs(for example)
General Stormwater Program Administrationincludes admin support and direct costs(mailings, budget prep,
collection of filling and enforcement fees, etc)
Legal Support Services legal review of regulatory changes, permits, etc
Inter-Agency Coordination (MA hwy, CRWA, EPA) information sharing; meeting to review and coordinate programs
Inter-Municipal Coordination (adj. Towns) information sharing; meeting to review and coordinate programs
Emergency/Disaster Management Coordinationspecific coordination with emergency personal and community
response
NPDES NOI and SWMP admin tasks associated with preparation of SWMP and permits
NPDES Annual Reportingpreparing and submitting annual reports; or reviewing reports
prepared by others
NPDES MS4 Public Education Programscoordinating with outreach and ed. Providers, press releases, event
coordination, volunteer coord.
NPDES MS4 Public Involvement Programs includes stormwater advisory committee meetings
NPDES MS4 & SPCC Training preparing, providing, or attending trainings
RDA Compliancethe administrative component of RDA compliance, tracking and
communicating with permittees, processing paperwork, etc
Certified Municipal Phosphorous Program (CMPP) administering CMPP program
Grants Program (s319, 604b, CZM) applying for grants

Horsley Witten Group, Inc.Horsley Witten Group, Inc.
Operations and Implementation(for example)
Operations and Maintenance Management construction oversight , project bidding, etc
CIP/Infrastructure Implementationconstruction costs (design and engineering in previous section);
could be % of large road project (for example)
PCP implementation retrofitting
Voluntary CMPP/RDA implementation retrofitting
IDDE elimination of IDDEs
Storm Sewer and Culvert Maintenance/Repair equipment, labor, transport and disposal
Inlet, Catch Basin, and Manhole Cleaning equipment, labor, transport and disposal & repair
Stormwater BMP Facility Maintenance equipment, materials, labor, transport and disposal associated with
maintenance and repair
Street Sweeping equipment, labor, transport and disposal
Fall Leaf-pickup equipment, labor, transport and disposal
Maintenance/Repair/Installation of ESC practices includes cleanup of sediment and repair of eroded areas
Stream Restoration/Stabilization equipment, materials, labor, transport and disposal
Ditch and Channel Maintenance equipment, labor, transport and disposal
Waterfowl & Pet Waste Management Programs equipment, labor, materials
Public Assistance Programequipment, labor, materials for rainbarrel, disconnection,
raingarden programs
Emergency Drainage Repairs allowance for unexpected repairs
Land, Easement, and Rights Acquisition

Horsley Witten Group, Inc.Horsley Witten Group, Inc.
Preliminary Program Assessment and
Costs• Bellingham: $303,000/year
– Basic program (mech. street sweeping - most streets,
some cb cleaning, SM insp/maint. could improve)
– Modest mapping
• Franklin: $712,000/year
– Basic program (regen. street sweeping – all streets, cb
cleaning, I&I program, SM insp/maint. could improve)
– Good mapping
• Milford: $578,000/year
– Basic program (regen. street sweeping – all streets, cb
cleaning, leaf pick-up, SM insp/maint. could improve)
– Need more mapping (GIS)

Horsley Witten Group, Inc.Horsley Witten Group, Inc.
Future Cost Items (not related to TMDL compliance)
• Update written Stormwater Mgmt Plan;
• Increased reporting/record keeping on annual reports;
• Targeted public education (2 messages to 4 audiences) and
report results;
• Illicit discharge priority catchment assessments (including
SSOs);
• Detailed outfall monitoring for both dry and wet weather;
• Written IDDE program with mapping and prioritization of
problem catchments;
• Complete stormwater system mapping (all
pipes/manholes/inlets/structures. Catch basin
inspection/cleaning/inspection data;
Horsley Witten Group, Inc.Horsley Witten Group, Inc.
Future Cost Items(continued)
• Track # of site plan reviews, inspections, enforcement
actions;
• ID/rank retrofit opportunities for municipally owned
facilities;
• Develop a SWPPP for municipally owned facilities;
• Complete a code review and update/report;
• Impervious cover/DCIA tracking;
• Street sweeping optimization(2 times/yr);
• Written O&M procedures for municipal activities for trash,
pet wastes, leaf litter control, fertilizer use & yard wastes;
• Pet waste & waterfowl mgmt plans.

Horsley Witten Group, Inc.Horsley Witten Group, Inc.
Sample EPA Guidance Documents

Horsley Witten Group, Inc.Horsley Witten Group, Inc.
Phosphorus Control Cost Items
• Phosphorus control plan (PCP);
• Phosphorus control mapping of priority areas;
• Off-site phosphorus mitigation plan (trading);
and
• Increased/targeted public education on
phosphorus control and increased public
involvement.
Both structural and non-structural practices
can be used to achieve phosphorus reduction.

Horsley Witten Group, Inc.Horsley Witten Group, Inc.
Relationship between DD’s and MS4s
Phosphorus removal requirements:
• Bellingham = 52%
• Franklin = 52%
• Milford = 57%
• DD sites = 65%
Town
Area
(ac)(1)
Imp Area
(ac)(2)
Existing
Load
(#/yr)
TMDL
Allowable
Load
(#/yr)
Required
Load
Reduction
(#/yr)
Bellingham 6116 918 2024 975 1049
Franklin 15539 2364 4650 2228 2422
Milford 8101 1662 3313 1426 1887
(1) from Attachement 3 to RDA Factsheet (Table 6)
(2) from Optimization Study Table 2-1
PHOSPHORUS LOADING REQUIRED REDUCTION
Note: DD phosphorus
removal is nested within
MS4 total removal

Horsley Witten Group, Inc.Horsley Witten Group, Inc.
Structural Mgmt Practices
Currently referenced
in RDA docs
• Infiltration (trenches/basins/chambers);
• Porous Pavement;
• Bioretention;
• Gravel Wetlands;
• Wet Ponds;
• Dry Ponds; and
• Water Quality Swales.
Suggestions to add
to the list
• Constructed Surface
Wetlands;
• Dry Swales;
• Green Roofs;
• Sand/organic Filters;
• Adaptations;
– Foundation Planters;
– Extended Tree Pits;
– Filter Strips

Horsley Witten Group, Inc.Horsley Witten Group, Inc.
Bioswales
Detention Basins
Infiltration Practices
Bioretention

Horsley Witten Group, Inc.Horsley Witten Group, Inc.Open Channels
Permeable Pavements
Constructed Wetlands
Sand Filters

Horsley Witten Group, Inc.Horsley Witten Group, Inc.
Existing Structural Practices(how to account for them)
• Divide into 2 Groups (before/after 2000)
– BMPs constructed after year 2000:
• Credit practices based on WQ storage provided
using performance curves (RDA, Appendix D,
Attachment 3);
– BMPs constructed before year 2000:
• No credit for TP removal.
Adjust non-structural limitations based on
year practice was constructed.

Horsley Witten Group, Inc.Horsley Witten Group, Inc.
Non-Structural Mgmt Practices
Currently referenced
in GP docs
• Street sweeping;
• Catch basin cleaning;
• Fertilizer reduction; and
• Leaf litter pickup.
Suggestions to add
to the list
• Soil restoration;
• Reforestation;
• Urban tree planting;
• Disconnection credits;
• Precipitation
Harvesting (reuse); and
• Impervious cover
reduction.

Horsley Witten Group, Inc.Horsley Witten Group, Inc.
Non-Structural Practices(how to account for them)
• Consider re-evaluation of credit for street
sweeping based on actual loads collected
versus street sweeping frequency and
prescribed reduction percentage;
• Consider re-evaluation of credit for leaf
pick-up based on actual load collected
versus area of program and prescribed
reduction percentage.
Method provided by Schueler, 2011.

Horsley Witten Group, Inc.Horsley Witten Group, Inc.
Methods/Approaches to estimate cost
of compliance with future GPs
1. EPA/HW GIS/Spreadsheet parcel-by-parcel
assessment;
2. Unit costs
– Cost per acre of impervious treated;
– Cost per pound of phosphorus removed.
3. Comparison to other recent retrofit work
(with multipliers to account for land use
variability)
4. Actual retrofit assessment in each town.
Horsley Witten Group, Inc.Horsley Witten Group, Inc.
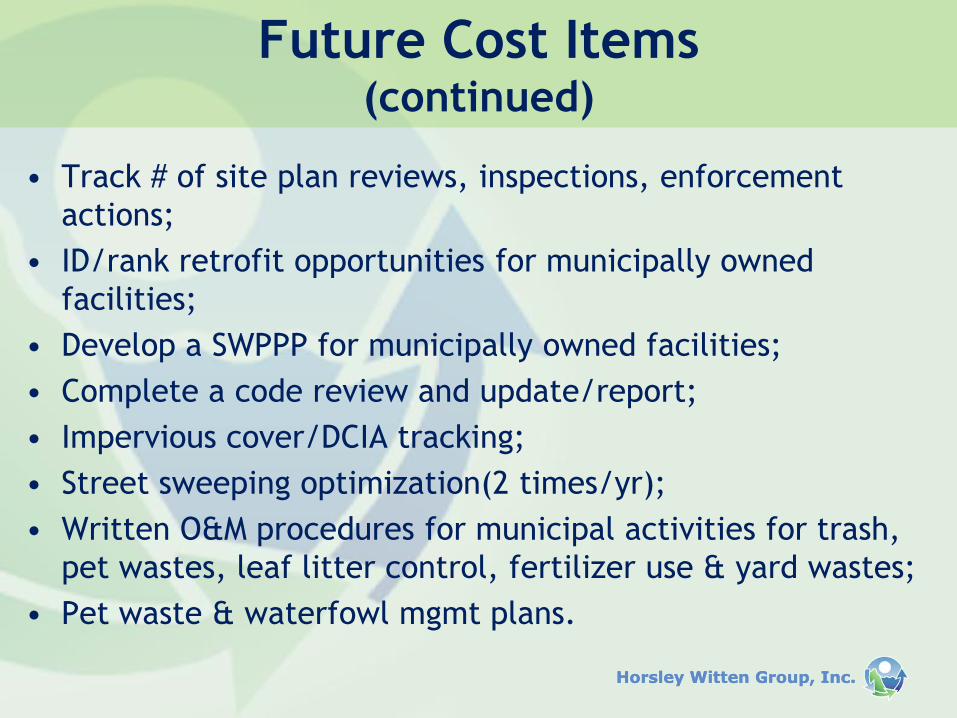
1. GIS-Based: Management Categories

Horsley Witten Group, Inc.Horsley Witten Group, Inc.
Capital Costs for Implementation
Table 3: Unit Construction Costs for Various Structural BMPs
BEST MANAGEMENT PRACTICE unit construction cost ($/ft3)
INFILTRATION BASIN 10.80
RAIN GARDEN 13.50
INFILTRATION TRENCH 21.60
INFILTRATION CHAMBER 32.40
BIOFILTRATION 27.00
GRAVEL WETLAND 21.60
From N. Pickering, 2010
Note: Costs are for retrofit facilities (2x new const) & 35% mark-up for soft costs

Horsley Witten Group, Inc.Horsley Witten Group, Inc.
Source of Cost DataBMP Units
New? New New Retrofit Spreadsheet Retrofit
TT (2010) EPA (1999) CWP (2007) CWP (2007) CWP (2007) HW (2010)Pond retrofits per ft3 treated - - - 3* -
Retention/detention basins per ft3 treated 1.57 0.5-10 1.4** 7 (5x) 3 -
Constructed wetland per ft3 treated 1.77 0.6-1.25 1.1** 7.7 (7x) 7 -
Gravel wetland per ft3 treated ? ? ? ? -
Gravel wetland per ft2 - - - - 25
Wet pond per ft3 treated - - 3.1** 7.1 (2.3x) 5 -
Raingarden per ft3 treated - - 4 - 30 -
Raingarden per ft2 - - - - 30
Bioretention per ft3 treated 3.2 5.3 7.5 10 (lg) - 30 (sm) 11 -
Bioretention per ft2 - - - - 30
Planters/Street Bioretention per ft3 treated - - - 26-30 -
Treepits per ft3 treated - - 70* - 26 -
Tree Planter per ft2 - - - - 50
Dry wells per ft3 treated - - 12 - 12 -
Infiltration basin per ft3 treated - 1.3 7.5 15 (2x) 15 -
Infiltration basin per ft2 - - - - 20
Infiltration trench per ft3 treated 2.88 4 ? ? -
Infiltration trench per ft2 - - - - 20
Underground infiltration per ft3 treated - - - - -
Stormwater filters per ft3 treated - - 52 - 20 -
Sand filter per ft3 treated 3.48 3-6 -
Filter Strip per ft2 - 0-1.3 6 - 6 -
Grass swale per ft2 0.45 0.5 - - 13 -
Water quality swale per ft3 treated - - 4-8 12 (2x) -
Porous pavement per ft2 1.52 - - - -
Permeable pavers per ft2 - - 10 - -
Permeable pavers per ft3 treated - - 120 - 120 -
Greenroofs per ft3 treated - - 225-360 - 170 -
D&E included No? No No No No?
Land costs included No? No Yes? No? No?
Base Year for Costs 2010? 1997 2006 2006 2010
*not in calcs, only in Table E4
** estimated from $/ac imp costs
and WQV
References
TT, 2010. Optimal Stormwater Management Plan Alternatives (combined data from the 3 refs below). TetraTech.
EPA, 1999. Preliminary Data Summary of Urban Stormwater Best Management Practices. US Env Protection Agency.
CWP, 2007. Manual 3: Urban stormwater retrofit practices. Appendix. Center for Wtershd Protection.
NCSU, 2003. An Evaluation of Costs and Benefits of Structural Stormwater Best Management Practices in N Carolina. NC State Univ.
HW, 2010. Personal Communication. Horsley Witten.

Horsley Witten Group, Inc.Horsley Witten Group, Inc.
2. Unit Costs: Data from Mid-Atlantic
Region (and elsewhere, as applicable)
From T. Schueler, 2011
Horsley Witten Group, Inc.Horsley Witten Group, Inc.
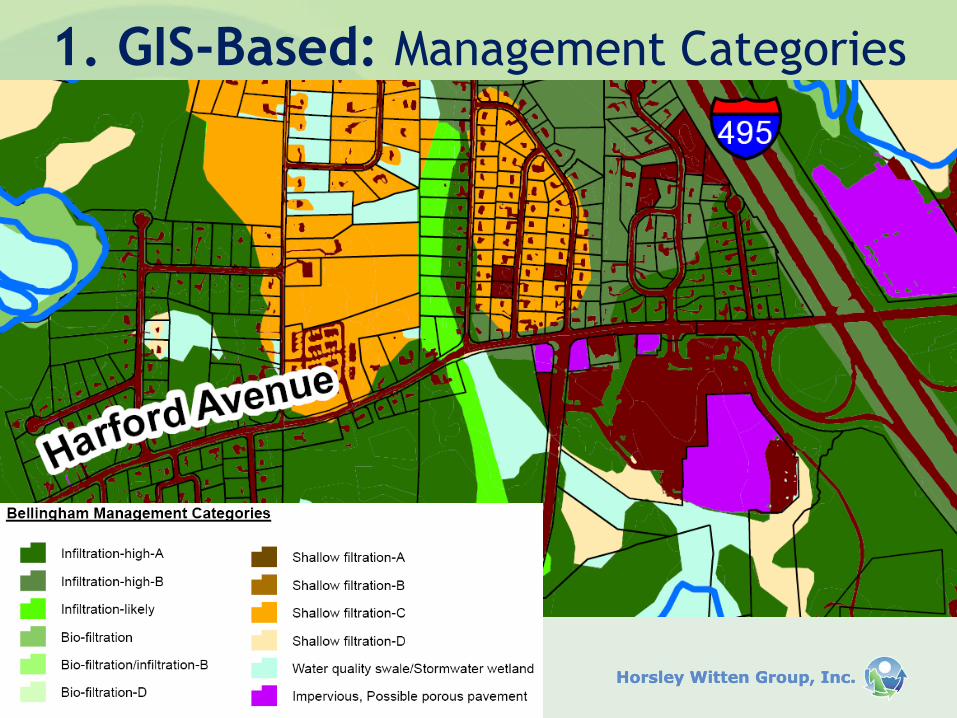
3. Comparison to similar watershed: Spruce Pond Brook Subwatershed in Franklin, MA

Horsley Witten Group, Inc.Horsley Witten Group, Inc.
3 Upper Charles River Communities

Horsley Witten Group, Inc.Horsley Witten Group, Inc.
4. Retrofit examples from each town: to help confirm implementation costs
• Bellingham: Designated Discharge property –
older shopping center (prior to 1997 Stormwater
Policy Manual) – among the more challenging of
the DD properties;
• Milford: Dense urban center developed long
before modern stormwater management –
among the most challenging retrofit areas;
• Franklin: Subwatershed scale of mixed land
uses, range of age over a 1.1 square mile area –
fairly typical of the 3 communities.

Horsley Witten Group, Inc.Horsley Witten Group, Inc.
15 North Main St. Bellingham, MA

Horsley Witten Group, Inc.Horsley Witten Group, Inc.
15 North Main St.
Bellingham
LOAD
Area (acres)TP Load (lb/year)
Reduction required (%)
Reduction Needed (lb/yr)
Impervious areas 6.39 14.25 65 9.26Pervious areas 1.17 0.32 65 0.21Woods 0.98 0.00 0 0.00
Total 8.55 14.57 65 9.47

Horsley Witten Group, Inc.Horsley Witten Group, Inc.
Soils suitable for infiltration
A
A
D
Horsley Witten Group, Inc.Horsley Witten Group, Inc.
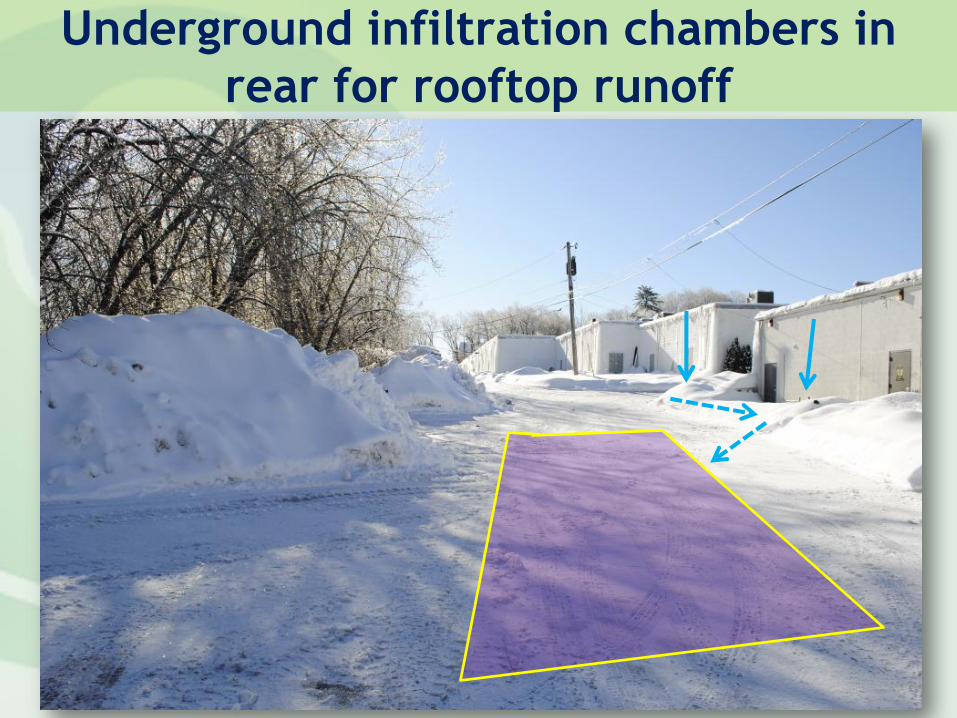
Underground infiltration chambers in
rear for rooftop runoff

Horsley Witten Group, Inc.Horsley Witten Group, Inc.
Infiltrating bioretention
Impervious Removal
Reforestation/Canopy Interception
Porous pavement spillover parking stalls

Horsley Witten Group, Inc.Horsley Witten Group, Inc.
Infiltrating bio at existing low point

Horsley Witten Group, Inc.Horsley Witten Group, Inc.
15 N Main Street, Bellingham
Retrofit Concept

Horsley Witten Group, Inc.Horsley Witten Group, Inc.
15 N Main Street, Bellingham MA
• Total site area: 8.55 acres (6.39 IA)
• Total Area treated: 5.21 acres
• Total IA treated: 4.44 acres
• TP Removal: 9.47 lbs/yr (65% reduction)
• Construction Cost: $580,000
• Unit cost: $90,400/IA; $68,000/acre

Horsley Witten Group, Inc.Horsley Witten Group, Inc.
Milford Public
Library
Milford, MA
Horsley Witten Group, Inc.Horsley Witten Group, Inc.
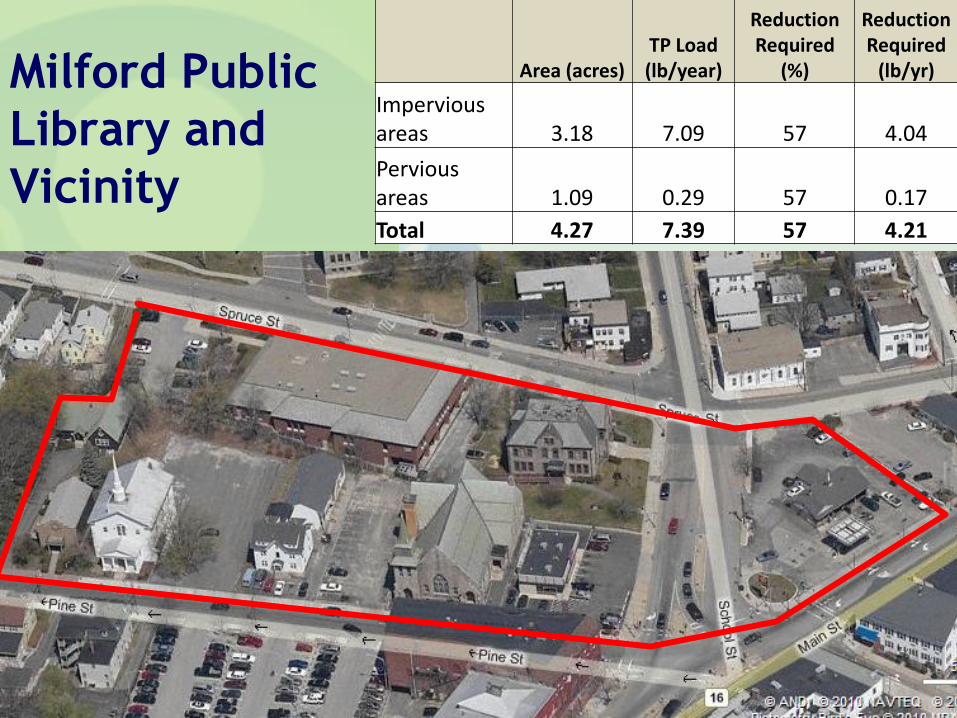
Milford Public
Library and
Vicinity
Area (acres)TP Load (lb/year)
Reduction Required
(%)
Reduction Required
(lb/yr)
Impervious areas 3.18 7.09 57 4.04
Pervious areas 1.09 0.29 57 0.17
Total 4.27 7.39 57 4.21
Horsley Witten Group, Inc.Horsley Witten Group, Inc.
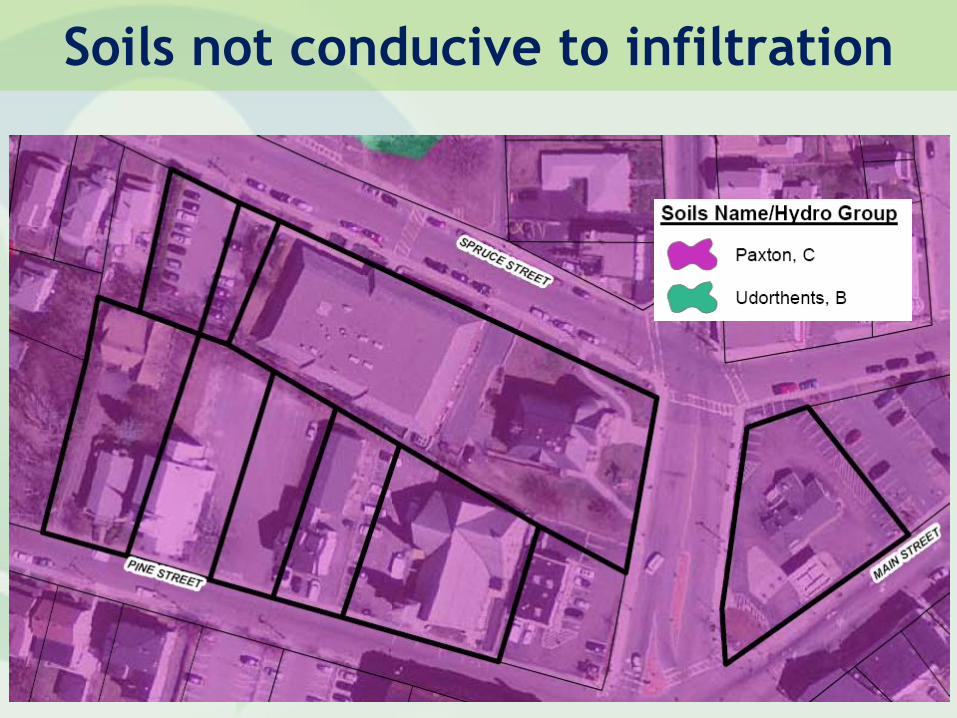
Soils not conducive to infiltration

Horsley Witten Group, Inc.Horsley Witten Group, Inc.
Bioretention
for large
Church parking
lot
Bioretention at
Milford Public
Library parking
area

Horsley Witten Group, Inc.Horsley Witten Group, Inc.
Bioretention to capture
portion of School St.
runoff

Horsley Witten Group, Inc.Horsley Witten Group, Inc.
Porous asphalt
at small
parking lot on
Pine St.
Foundation
planters at
Library

Horsley Witten Group, Inc.Horsley Witten Group, Inc.
Milford Library Vicinity
Retrofit Concept

Horsley Witten Group, Inc.Horsley Witten Group, Inc.
Milford Library Vicinity
• Total site area: 4.27 acres (3.18 IA)
• Total area treated: 3.07 acres
• Total IA treated: 2.30 acres
• TP removal: 4.21 lbs/yr (% reduction)
• Construction cost: $480,000
• Unit cost: $150,000/imp acre; $112,000/ acre

Horsley Witten Group, Inc.Horsley Witten Group, Inc.
Spruce Pond
Brook
Franklin, MA

Horsley Witten Group, Inc.Horsley Witten Group, Inc.
Sub-watershed Drainage Areas
51 total drainage
areas
DAs selected:
(1) To capture RDA sites (2+
acres impervious cover)
(2) Based on natural
topography and existing
stormwater infrastructure
Courtesy CRWA

Horsley Witten Group, Inc.Horsley Witten Group, Inc.
Wachusett Street Drainage Area
Courtesy CRWA

Horsley Witten Group, Inc.Horsley Witten Group, Inc.
CRWA Stormwater PlanParmenter School

Horsley Witten Group, Inc.Horsley Witten Group, Inc.
New Bioretention Facility
Parmenter School

Horsley Witten Group, Inc.Horsley Witten Group, Inc.
CRWA Stormwater PlanFletcher Field Parking Lot

Horsley Witten Group, Inc.Horsley Witten Group, Inc.
Bioretention Area
Fletcher Field

Horsley Witten Group, Inc.Horsley Witten Group, Inc.
Proposed Drainage Area Retrofits: BMP Approach
Plan S0 Plan S2

Horsley Witten Group, Inc.Horsley Witten Group, Inc.
Spruce Pond Brook Subwatershed Restoration
Estimated Cost Range
51 potential catchments for stormwater
improvements
• Field Verified Assessment Method
– 28 sites selected
– ~ $4.9 m/1.1 sq mi ($7,040/ac or $28,080/IA)
• Optimized
– 41 sites selected
– ~ $3.1 m ($4,500/ac or $ 17,770/IA)
Actual implementation cost likely in between.

Horsley Witten Group, Inc.Horsley Witten Group, Inc.
Summary
Range of Implementation costs for 3 examples:
$28,000 to $150,000/Impervious Acre
• Consistent with other studies/analyses;
• These estimates use conservative assumptions;
• Not necessarily the least expensive measures – many
options available – optimization analysis likely to save $;
• Final cost estimates will apply multipliers based on land
use/drainage area/physical constraints;
• Future implementation costs can be reduced as
“implementers” become more experienced;
• Non-structural measures may be very cost effective,
particularly if widespread.

Horsley Witten Group, Inc.Horsley Witten Group, Inc.
Immediate Next Steps
• Preliminary cost of future service for each town;
• Input from towns and regulated DD properties;
• Coordinate with EPA on inclusion/refinement of
additional management measures;
• Refine cost of future service estimates and range
for each town;
• Offer cost implications for regional cooperation and
CMPP; and
• Concurrently, proceed with revenue assessments.

Horsley Witten Group, Inc.Horsley Witten Group, Inc.
Designated Discharge Properties
• Provide stakeholder input – assess
concerns;
• How can they help?
– Location of existing BMPs (lat. & long.);
– Type of existing BMPs and age;
– Current non-structural control measures.