Sustainable mobility
93
SUSTAINABLE MOBILITY and ENERGY EFFICIENCY in NEW DEVELOPMENTS in BANGALORE Does it make Business Sense? Roundtable Discussion and Workshop 18 June 2014
-
Upload
lakshmi-rajagopalan -
Category
Documents
-
view
13 -
download
1
description
Roundtable on sustainable mobility
Transcript of Sustainable mobility

SUSTAINABLE MOBILITY and
ENERGY EFFICIENCY in NEW
DEVELOPMENTS in BANGALORE
Does it make Business Sense?
Roundtable Discussion and Workshop
18 June 2014


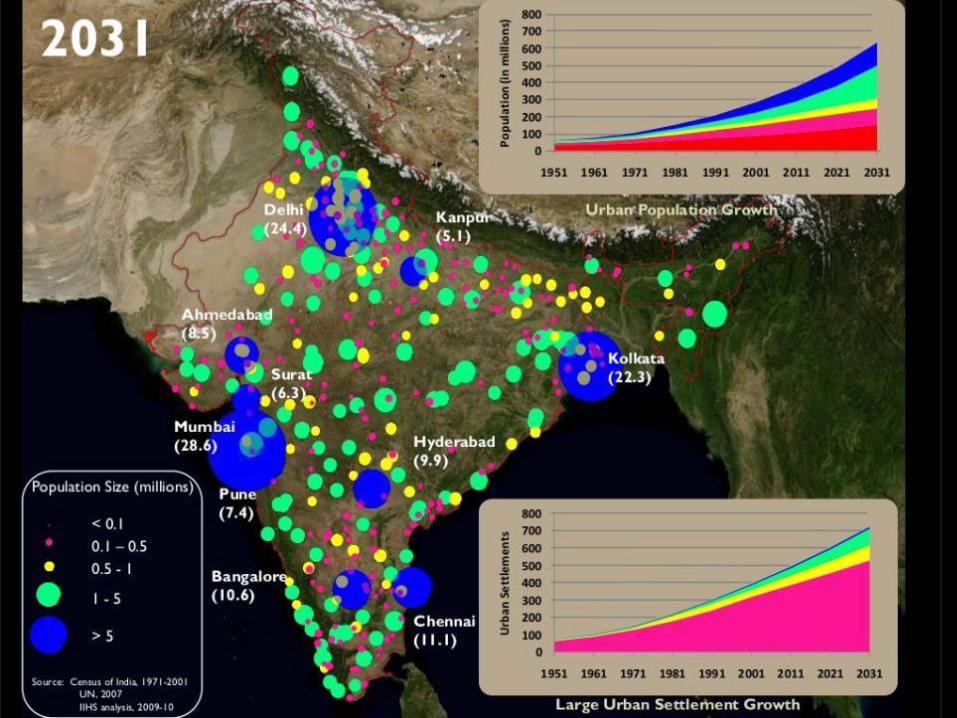
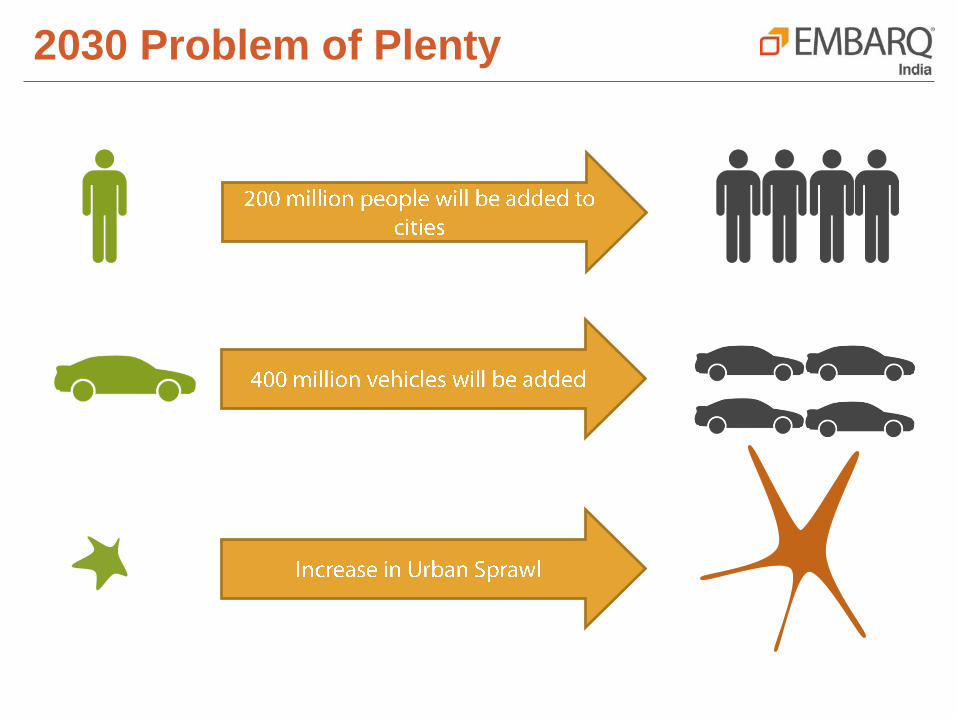
2030 Problem of Plenty

Current Issues Faced by Cities

Issues: Road Safety
140,000 deaths/year in India due to
road traffic crashes

Issues: Air Pollution
http://www.topnews.in/law/files/delhi-pollution.jpg
627,426 premature deaths/year in
India due to air pollution

Issues: Physical Inactivity
http://www.topnews.in/law/files/delhi-pollution.jpgSource: http://www5.imperial.ac.uk/medicine/metabolic_risks/bmi/
436,122 premature deaths/year in India

Parking
Traffic Clogging
Time taken by occupants to move in and out of
Townships
Islands of Prosperity– gated communities
Liveability of the township in long run ……….
Issues……. And More

With 70% of built stock yet to be built
there are is an opportunity to do
things the right way or let them go
horribly wrong!

Where Does the Heart of Problem lie………?

Bangalore photo credit: EMBARQ India

Western Express Highway at Bandra East, Mumbai photo credit: EMBARQ India
Traffic Woes!
No matter where you live or who
you are…

Gurgaon
Is this Good for Real Estate
Business in Long Run ?


Car Centric Design…..
Car Centric
Design Attracts
More Cars and
Roads
Spiral of Destruction

People Centric Design….

Invert the Pyramid

Strategy & Recommendations
Non- motorized modes
of transport
Creating open/ public
spaces
Transit and integration
of networks
Mixed use
Parking and
demand management

People Centric Cities….


Work Done with Developers…
201320122011 2014
Design Audits
of Townships
Integration of
Mobility in
Designing
ConnectKaro
Surveys
ConnectKaro
Mumbai
Roundtable
• Covered 3
townships in
different states
• Knowledge
exists but
application a
problem
• Multi-stakeholder
consultations
• Institutionalization
of knowledge and
coordination
• Develop
indicators and
benchmarks
• Understanding
perspective of
Developers on
Parking Regulations

Within the next 5 years we intend to reach out and impact:
Vision for Real Estate Development
1 Million Homes
5 Million People
250 Developments

What Needs to be Done…
Peer Learning Platform
Develop Benchmarks and Assess Impacts of Current Travel & Energy use Patterns
Document Best Practices and Publish Case Studies
Develop Tools and Impart Training to Developers

Agenda for Today
SESSION 1: Roundtable discussion
a) Mobility and Real Estate Development
b) Business case for Sustainability and Energy efficiency, and
c) Market Trends and Government incentives
SESSION 2 : Workshop
a) Findings from Consumer Surveys and Township Audits
b) Dialogue between participants to synthesize discussions and come up with a set of priorities for the way forward
c) Interactive Design Review Session for interested participants

Share Your Ideas, Suggestions…
Please put your thoughts on the POST ITs provided

SESSION 1
Mobility & Real Estate Development

Mobility & Real Estate Development
What challenges
does the real estate
business face due to
increasing traffic and
mobility issues in
Bangalore?
Would designing
developments with
mobility as a strong
focus increase the
demand for such
properties?Source: archive.citycaucus.com

Mobility & Real Estate Development
To what extent do
real estate
developers consider
upcoming transit
stations in locating
new developments in
Bangalore?
Does this make
economic sense and
why?

Mobility & Real Estate Development
What gaps or
opportunities exist in
the current policy
frameworks that
create barriers to
offering more
sustainable mobility
options?
(related to building
codes, FAR and other
regulations)

TEA BREAK(15min)

SESSION 1
Business Case for Sustainability
& Energy Efficiency

Business Case for Sustainability
& Energy Efficiency
70% of the infrastructure that will exist in India in 2030 will be
built between 2012-2030.
Energy Efficiency investments can save an amount (USD 14
billion) equal to health & education spending combined per
annum in India.
Commercial buildings malls, hotels, IT centers, multi-
specialty hospitals) will require 13% more energy each year
Overall electrical energy requirement in megacities like
Bangalore expected to increase by 7% annually -- means a
doubling of requirement in 10 years!

Energy Efficiency in Buildings
Estimated Benefits and Savings
Payback period estimated at 3-7 years for LEED gold or
platinum certifications.
20-30% of water saved
30-50% of electricity saved
Costs increased by 2-3% for Gold LEED certification
In Brazil, almost 10% higher ROI on new green buildings,
and 19% higher ROI for remodelling

Business Case for Sustainability
& Energy Efficiency
What gaps/opportunities exist in the current codes and policy frameworks to achieve greater energy efficiency in new developments?
Is there a business case for increasing energy efficiency in new developments and building green?
What mechanisms can be introduced to ensure that energy
efficiency is sustained in the developments post occupancy?

SESSION 1
Current Market Trends &
Government Incentives

Current Market Trends & Government
Incentives
What are the current market trends for sustainable
developments? Are buyers aware of the existing rating
systems? What are some of the methods adopted to create
awareness amongst buyers?

Energy Efficiency - Incentives
By Government By Banks/Investors GRIHA/LEED
• Property Tax Breaks
• MNRE Provides:
registration fees,
architect/design fees,
property tax rebates,
annual awards,
training/workshops/
publications.
• ECBC adoption by
additional states
• Enforcement of
current building codes
would result in a 50%
reduction in energy
usage
• SBI gave Mahindra
World a 0.5% interest
rate reduction for
building green
• Banks which support,
finance, and provide
grants for green
incentives: State Bank
of India, Industrial
Development Bank of
India, Bank of Baroda,
ICICI
• Bank of America
provides grants for an
Affordable Green
Neighborhoods
program
• GRIHA grants a 5% FAR
increase in many
localities
• Pimpri Chinchwad 5%
FAR bonus, 1-5% extra
ground coverage,
permission charge
discounts, property tax
reductions

Current Market Trends & Government
Incentives
What are the current market trends for sustainable
developments? Are buyers aware of the existing rating
systems? What are some of the methods adopted to create
awareness amongst buyers?
Would developers be open to adopt an incentive based
model for achieving sustainability within developments? Are
there examples of such policies that have succeeded
elsewhere?

LUNCH
Google Group : Sustainable Developers
https://groups.google.com/forum/#!forum/sustai
nable-developers

Household Survey Results
Identifying Travel Patterns and Preferences

Survey captures
Household demographic data
Travel activities per household in a typical week
Transport mode preferences
Residents’ perceptions of the urban environment in which
they live
Attitudes towards transport facilities and options
Perceptions on sustainable practices
6 Developments, 446 respondents
Household Surveys

Survey Projects – Location Plan
34 acres site area
~2000 res. units
~ 8500 people
~ 3000 cars
250 acres site area
750 villas
2040 apartments
~ 13,300 people
~ 4200 cars
15 acres site area
896 res.units
~ 3800 people
~ 1350 cars
326 acres site area~1911 res. units
~ 8500 people
~ 2000 cars
34 acres site area
2500 res.units
~ 11,000 people
~ 3000 cars 3.5 acres site area
~220 res. units
~ 8500 people
~ 3000 cars
L&T South City
Adarsh Palm Retreat
Ittina Abby
Ideal Homes
Godrej Woodsman
Platinum City

Primary Travel Mode - All Trips
58% work trips => 64% by car
42% additional trips => 74% by car
63% - concerned about travel
expense

Primary Travel Mode – Additional Trips
56% - local shopping/grocery store
24% - visiting friends
20% - other

Additional Trip Distances and Times
46% Trips were less than 5 kilometres
64% trips had travel times (one-way) less than 30 minutes
65% of the respondents preferred to stay within the
community for shopping

Reason for Mode Choice
Comfort (50%) and safety (42%) were cited by most
respondents as their reason for choosing their current
mode.
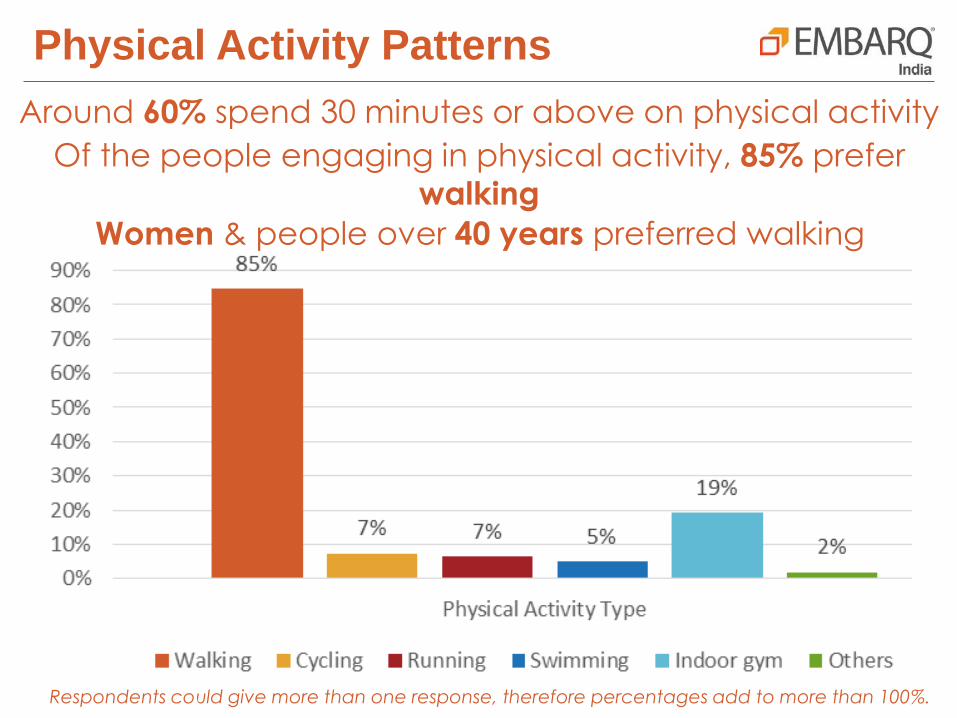
Physical Activity Patterns
Around 60% spend 30 minutes or above on physical activity
Respondents could give more than one response, therefore percentages add to more than 100%.
Of the people engaging in physical activity, 85% prefer
walking
Women & people over 40 years preferred walking

Why did we move here?
49% - Presence of open spaces and safe environment
38% - Green and sustainable practices followed
21% - Distance to retail and shopping

Levels of Satisfaction/Concern
57% were dissatisfied over the availability of retail within the
community and wanted to see a variety of accessible retail
and amenity shops within the community => Demand
for Mixed Use!
80% were satisfied with green practices followed within the
community
90% expressed satisfaction with the quality and safety of
open spaces within the community
69% expressed concern over safety of household members
during travel to and from the community

Levels of Satisfaction/Concern
43% were dissatisfied with access to public transit from
community
57% expressed concern over the road and pedestrian
network and associated infrastructure
60% face heavy congestion during their commute to work
52% felt that their community environment impacts their
transportation choices

I would walk more if……
33% - if footpaths were available
28% - better maintenance
26% - if it is was safer

I would cycle more…..
27% - lack of cycling infrastructure – lanes & parking
10% - distance to destinations
10% - not owning a cycle currently

I would use public transit more….
35% - absence of shuttle services from residence
34% - lack of better public transit quality and connectivity
20% - safety

Energy efficiency : thinking
beyond building envelopes
BRIDGING GAPS IN NON-MOTORISED
MOBILITYDesign audit of integrated developments in Bangalore for mobility
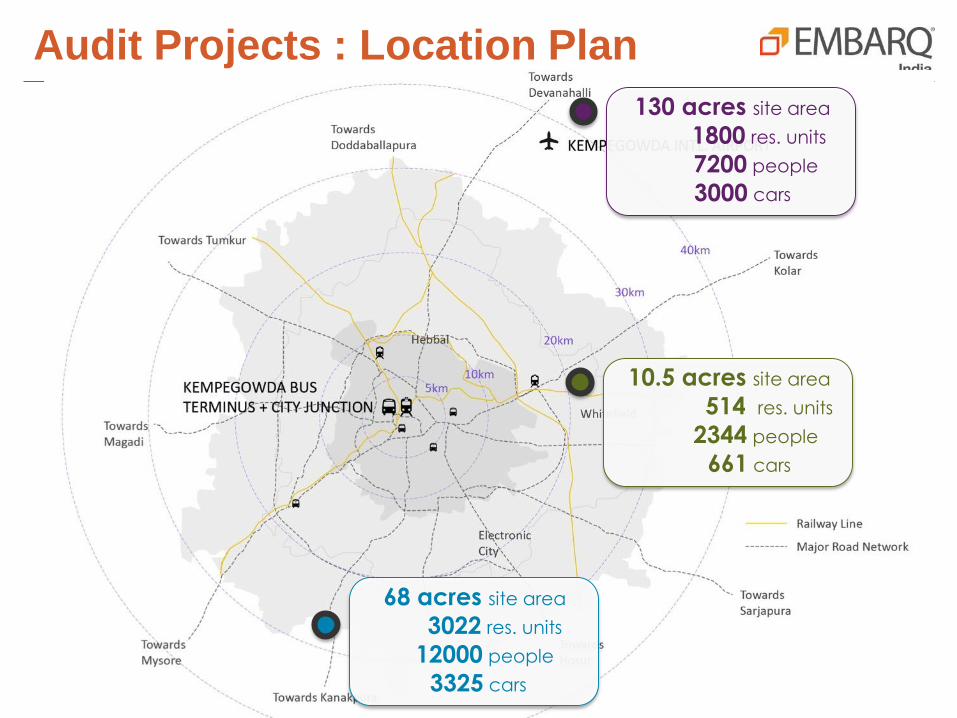
Audit Projects : Location Plan
130 acres site area
1800 res. units
7200 people
3000 cars
10.5 acres site area
514 res. units
2344 people
661 cars
68 acres site area
3022 res. units
12000 people
3325 cars

Mobility
From the development to a point of destination
Within the development
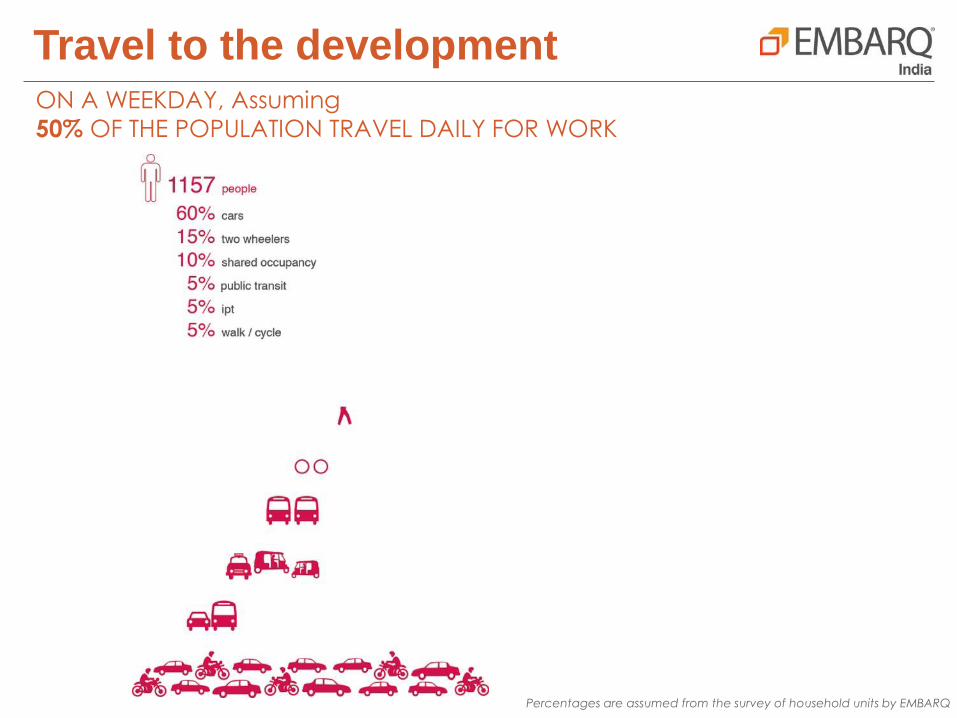
Travel to the developmentON A WEEKDAY, Assuming
50% OF THE POPULATION TRAVEL DAILY FOR WORK
Percentages are assumed from the survey of household units by EMBARQ

Travel to the development
Percentages are assumed from the survey of household units by EMBARQ
Assuming
30% OF CHILDREN TRAVEL TO SCHOOL DAILY

Travel to the development
Percentages are assumed from the survey of household units by EMBARQ
Assuming
50% OF UNITS EMPLOY HOUSE-HELP WHO TRAVEL TO WORK
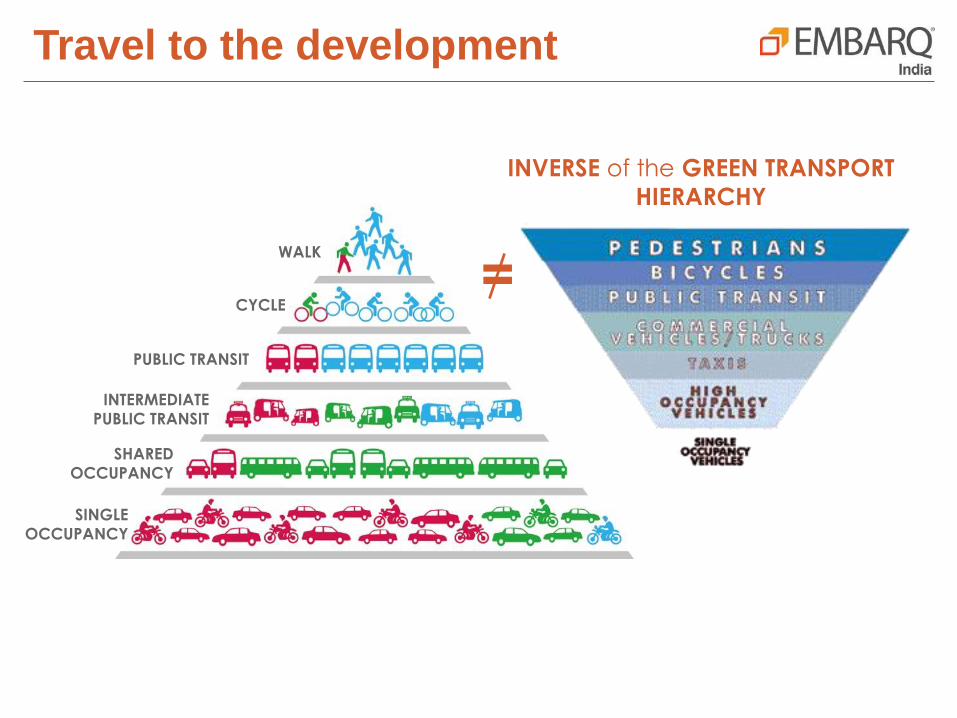
Travel to the development
WALK
CYCLE
PUBLIC TRANSIT
INTERMEDIATE
PUBLIC TRANSIT
SHARED
OCCUPANCY
SINGLE
OCCUPANCY
INVERSE of the GREEN TRANSPORT
HIERARCHY
=

Travel within the Site
1.5km
Club House
Retail Spaces
Schools
Hospital
Offices
Open Space
Residential Units
Radii of Chinnaswamy Stadium = 0.15km
1.5km = 10 x

Accessibility
SERVICE
CORE
DESTINATION
350 – 550m
10 -15 mins
TIME TAKEN FROM FARTHEST BUILDING TO THE DESTINATION IN A STRAIGHT LINE
SERVICE
CORE
DESTINATIONPARKING
PODIUMRAMP
ACCESS
AGE +
MULTIPLE
CHILDREN
LACK OF
SEGREGATIONROAD
CROSSING
FACTORS INHIBITING SMOOTH PEDESTRIAN MOVEMENT
Though walking distances amenities are within the accepted limits, the added
considerations of safety, luggage to be carried, state of infrastructure and age make
car trips more favorable for short trips
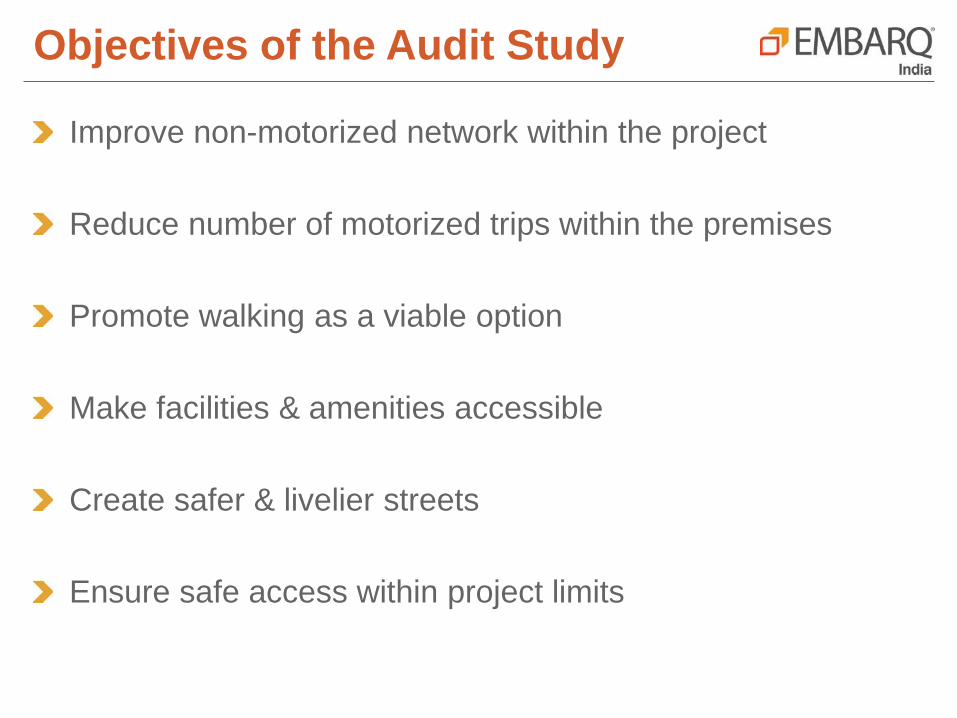
Objectives of the Audit Study
Improve non-motorized network within the project
Reduce number of motorized trips within the premises
Promote walking as a viable option
Make facilities & amenities accessible
Create safer & livelier streets
Ensure safe access within project limits

Design Principles
Divide and distribute
Discretionary walking tripsMaintain the
green hierarchy
Build for people
and not for cars
MEGASCALE MESOSCALE MICROSCALE

Strategies and Recommendations
LINKS
NODES
INTERSECTIONS
NETWORK
ACCESS TO THE
PREMISES
The recommendations are made in the
following categories of intervention

Strategies and Recommendations
Developing Alternate Networks for Vehicular
Circulation
Pedestrian : New Networks + Integration of
Networks through open spaces
Feeder Network : Buses + Cycling
Trip Reduction Measures
LINKS
NODES
INTERSECTIONS
ACCESS TO THE
PREMISES
NETWORK

Alternate Networks
Public Transit
Bus Stop
Feeder Bus + School Bus RouteLocate Feeder Bus stops 250m apart for easy access to all
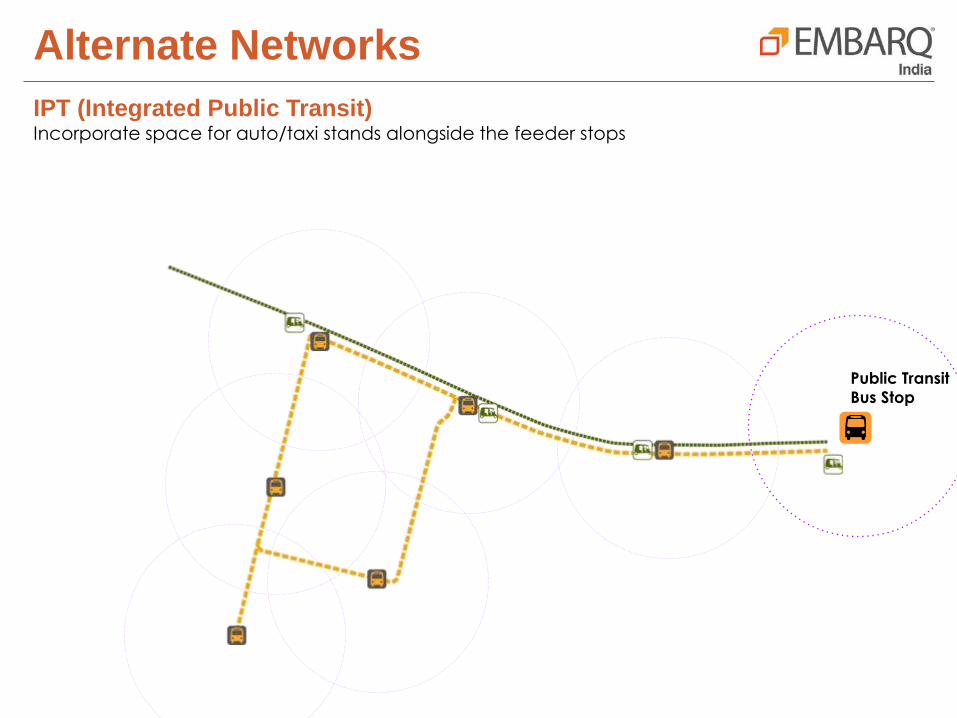
Alternate Networks
IPT (Integrated Public Transit)Incorporate space for auto/taxi stands alongside the feeder stops
Public Transit
Bus Stop

Alternate Networks
Pedestrian and Cycling Allocate space for cycle stands and well shaded pathways
Public Transit
Bus Stop

Strategies and Recommendations
Prioritizing existing pedestrian links
Creating dedicated pedestrian
pathways along ramps
Enhanced Links for connectivity
through development
Pavement Design / Treatment
NODES
INTERSECTIONS
NETWORK
ACCESS TO THE
PREMISES
LINKS

Existing Road Network – NMT Network
As per IRC 103-2012,

Existing Road Network – NMT Network
Analyzing the road network for pedestrian facilities – Sidewalk analysis
Width Greater than 0.9m
Width Equals to or less than 0.9m
No dedicated pedestrian paths

Corridor Preference MatrixSUB ARTERIAL
COLLECTOR LOCAL
ROAD ELEMENT
18.0m 20.0m 14.5m 9.5m 12.5m 9.0m 8.5m 8.0m 3.5m
PRIORITY Mobility Mobility + Access Access
Footpath ✔ ✔ ✔ ✔ ✔ ✔ Shared Path
Bicycle Path ✔ ✔ ✔ ✔ Shared Path
Public Transit ✔
(Shared)Feeder Network – Shared Path
Parking
Bicycle ✔ ✕ ✕ ✕ ✕ ✔ ✕ ✕ ✕
2 wheelers ✕ ✕ ✕ ✕ ✕ ✔ ✕ ✕ ✔
3 wheelers ✔ ✕ ✕ ✕ ✕ ✕ ✕ ✕ ✕
4 wheelers ✕ ✕ ✕ ✕ ✕ ✔ ✕ ✕ ✔
Traffic Calming
✔ ✔ ✔ ✔ ✔ ✔ ✔ ✔ ✔
Median ✔ ✔ ✕ ✕ ✕ ✕ ✕ ✕ ✕

Existing Road Sections : 18m

Redesigned Road Sections : 18m CDP
1.5
Ped
1.4
Cycle 6.0m carriageway 0.8
Med 6.0m carriageway
1.4
Cycle1.5
Ped
Reducing median width
Retain the carriageway
Introduce dedicated cycle track
Move the planting to within
plot
Design tree planting considering shading

Strategies and Recommendations
Introduce Traffic Calming Measures at
Junctions
Ensure continuous pavements at ramp
& basement entry points
Use of Traffic Visibility Mirrors at blind
spots
LINKS
NODES
NETWORK
ACCESS TO THE
PREMISES
INTERSECTIONS

Redesigned Intersections
EXISTING INTERSECTION
Images from HSR NIP – used to indicate suggested strategy

Redesigned Intersections
PROPOSED INTERSECTION
Images from HSR NIP – used to indicate suggested strategy

Strategies and Recommendations
Improve activities & facilities along
pedestrian links – provide benches,
dustbins, water fountains, lighting
Activate existing spaces through good
programmed space design
Opportunity for utilizing the residual
spaces
LINKS
INTERSECTIONS
NETWORK
ACCESS TO THE
PREMISES
NODES

Concerns…
Introducing a centrally located convenience store within the development
Ensures that people walk more within the development
Reduction in trips for daily use
Saves time
Safe

Locating Convenience Retail
Identify Residual Space within the Development
Images from L&T South City – used to indicate suggested strategy

Locating Convenience Retail
Proposed Reuse
Images from L&T South City – used to indicate suggested strategy

Strategies and Recommendations
Improve Facilities along Main Street –Dedicated Space for Auto Rickshaws, Bus Pick Up & Drop Offs
Introducing directional signage at entrance points to reduce wayfinding trip lengths within the campus
Improving the signage within the campus
Use of Alternative signage methods that are visually legible
LINKS
NODES
INTERSECTIONS
NETWORK
ACCESS TO THE
PREMISES

Access Point to Development
Improve Facilities along
Main Entrance – Dedicated
Space for Auto Rickshaws,
Bus Pick Up & Drop Offs
DROP-OFF
PICK-UP
Images from Adarsh Palm Retreat– used to indicate suggested strategy
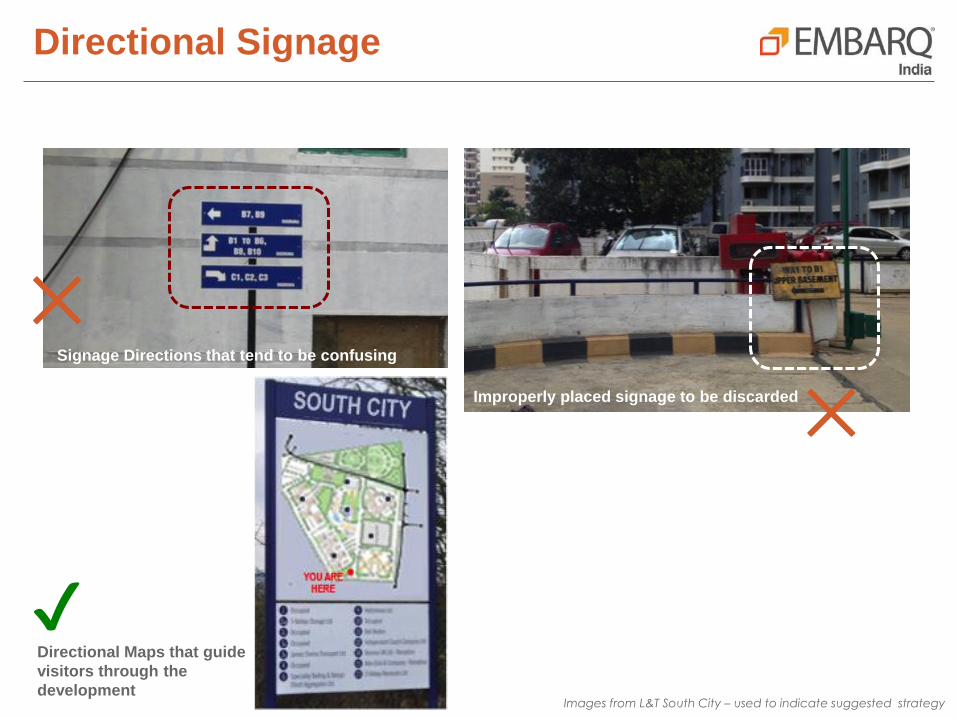
Directional Signage
Signage Directions that tend to be confusing
Improperly placed signage to be discarded
Directional Maps that guide
visitors through the
development
✔
✕
✕
Images from L&T South City – used to indicate suggested strategy

Building Signage
Alternative signage methods that are visually legible
Building Numbers can be painted on the darker facáde colour for better visibility
Images from L&T South City – used to indicate suggested strategy

Measuring the Impact
Reduction in the trip distances.
Number of increased walking trips pre and post implementation
Reduced the car usage with in the development
Reduction in emissions due to increased walking trips, cycle usage and
trips by transport systems.
User rating on the quality of space pre and post implementation.

Dialogue on Way Forward
Best Practice Guidebook

TEA BREAK(30min)

Interactive Design Review
Session
Mobility Challenges

Google Group : Sustainable Developers
https://groups.google.com/forum/#!forum/sustai
nable-developers
THANK YOU