Sustainable Finance and Fintech: progress and innovation ...
45
Sustainable Finance and Fintech: progress and innovation, 6 February 2020 1 Servizio Studi – Equity Research Sustainable Finance and Fintech: progress and innovation 6 February 2020 Sala Assemblee via Fratelli Gabba
Transcript of Sustainable Finance and Fintech: progress and innovation ...

Sustainable Finance and Fintech: progress and innovation, 6 February 2020
1 Servizio Studi – Equity Research
Sustainable Finance and Fintech: progress and innovation
6 February 2020 Sala Assemblee via Fratelli Gabba

Sustainable Finance and Fintech: progress and innovation, 6 February 2020
2 Servizio Studi – Equity Research
6 February 2020 Sala Assemblee via Fratelli Gabba
Sustainable Finance and Fintech: progress and innovation, 6 February 2020
3 Servizio Studi – Equity Research
Summary
Centrale del Latte d’Italia 4 MailUp 24 CNH Industrial 6 NB Aurora 26 Elettra Investimenti 8 NEXI 28 Equita Group 10 Notorious Pictures 30 Ferrari 12 Piaggio 32 First Capital 14 Reply 34 Gefran 16 SIT 36 Grifal 18 Spactiv 38 Leone Film Group 20 TraWell 40 LU-VE 22
Disclaimer 42
Team 44
Please note: all the reccomandations, estimates and target prices refer to our latest published reports on every single stock available
on www.ubibanca.com/equity-research.

Sustainable Finance and Fintech: progress and innovation, 6 February 2020
4 Servizio Studi – Equity Research
Centrale del Latte d’Italia 03 February 2020 – 5:30 PM SELL TARGET PRICE: 2.03 MARKET PRICE: 2.46
Food & Beverage
Data
Shares outstanding (m): 14.00
Market Cap. (EURm): 34.44
Enterprise Value (EURm): 121.70
Av. Daily Trad. Vol. (000): 7.6
Reuters/Bloomberg: CLI.MI CLI IM
52-Week Range (EUR): 2.4 2.9
Source: FactSet
Performance
1m 3m 12m
Absolute 1.7% -3.9% -9.9%
Rel. to FTSE IT 3.0% -6.3% -22.7%
Graph Area Absolute/Relative 12 M
Source: FactSet
Graph Shareholders’ Structure
Source: Company data
Company profile Centrale del Latte d’Italia is the third largest milk company in Italy after Parmalat and Granarolo and the market leader in the regions where it is present
(Piedmont, Liguria, Tuscany and Veneto). The group produces and distributes milk (fresh, ESL and UHT), milk derivatives, vegetable drinks, salads, cured meats, eggs and pasta. It has four plants, a fleet of >300 self-cooling vehicles, and 413
employees. Its four brands are well known and can demand a premium price and have increased their market shares in recent years (now at 7.7% in the fresh milk and 4% in UHT). As for distribution channels, >50% of revenues come from mass
retail, 36% from traditional trade and around 7% from private label. CLI was listed
on the Milan Stock Exchange in 2000 and moved to the STAR segment in 2001.
Recent development Despite the poor volume trend (value of production was down 1.3% in 3Q19
and 1.8% in 9M19) and soaring fresh milk price (+14.8% in 3Q19), CLI was able to increase EBITDA by 16% in 3Q19 (after the sharp slowdown of 1H19) thanks to effective cost cutting actions implemented in the past few months. However,
higher D&A costs led to breakeven at EBIT level while pre-tax result was negative for EUR0.45 million (EUR4.2 million in the first nine months) and net debt remained stable at EUR84.8 million (including EUR4.8 million for the adoption of
IFRS 16). The company guided for the last quarter of the year financial results similar to 3Q19, thus implying a revenues slowdown of around 2% in the full year
with an EBITDA margin around 4% (compared with 4.3% in 2018). Considering
that: 1) cash flow generation should remain negative in the full year, 2) the investment plan for the revamping of the Turin plant is proceeding, 3) the risk of breaking the existing covenants on the banks financing and on the 2017-24 bond, the company confirmed significant capital and financial strengthening within year-
end, which in our view could translate in a capital increase which could generate a significant dilution for existing shareholders. A capital increase of EUR5.0 million was already approved by the Board for Centrale del Latte di Vicenza.
Corporate Governance
Does the company have a combined Chairman/CEO? Yes
Percentage of independent directors 46.15% (6 out of 13)
Does the company have loyalty shares? No
Does major shareholders have a “shareholders pact” in place? Yes
Are “poison pill” or “change of control” clauses adopted? No
Potential dilution from stock options outstanding + not yet granted? No
CEO remuneration detail (fixed salary) EUR0.57 million
Chairman remuneration detail (fixed salary) EUR0.37 million
Is the share price included in the MBO criteria? No
Percentage of treasury shares 0.0%
Climate related risk
Has the company defined GHG-emissions targets? No
How does the company assess climate-related risk? No
Social Responsibilities
Does the company publish a separated Sustainability report? No
Does the company have a Chief SRI/CSR officer (or a committee)? No
Does the Chief SRI/CSR officer votes in any of the committee? NA
Is the Investor Relation officer a different person from CFO (or other officers)?
Yes
Is the ESG strategy integrated in the Business Plan (or in the group strategy)?
No
Does the company have an ethical code? Yes
Percentage of female directors 38.46% (5 out of 13)
How is the cybersecurity issue managed? Not disclosed
SWOT Analysis
Strengths Weaknesses
• Leading position where it is present and strong brand awareness
• Increasing product diversification
• Low NWC and negative operating working capital
• Declining consumption of fresh and UHT milk in Italy
• Continuous price pressure from large distributors
• Lower innovation and marketing capacity than larger companies
Opportunities Threats
• The restructuring of the Turin production facility
• Cost synergies with Centrale del Latte di Firenze
• Agreement with Alibaba to distribute UHT milk in China
• Strong volatility of the raw milk price
• Private label competition and potential entry of large multinationals
• Strong price power of mass retail chains
2,200
2,700
3,200
CDL FTSE Italia All-Share
Fin, Centr. Latte Torino;
39,3%
Comune di
Firenze; 12,3%Fidi Toscana; 6,8%
Comune di
Pistoia; 5,3%
Free float; 36,3%

Sustainable Finance and Fintech: progress and innovation, 6 February 2020
5 Servizio Studi – Equity Research
Centrale del Latte d’Italia
Income Statement Financial Ratios
(EURm, %) 2018A 2019E 2020E 2021E (%) 2018A 2019E 2020E 2021E
Net Revenues 183.14 180.36 185.33 193.24 ROE 0.6% -4.1% -3.7% -2.4%
EBITDA 7.79 7.21 7.72 9.35 Net Fin. Debt / Equity (x) 1.2 1.3 1.4 1.3
EBITDA margin 4.3% 4.0% 4.2% 4.8% Net Fin. Debt / EBITDA (x) 9.5 11.3 10.4 8.2
EBIT 0.85 -2.32 -1.56 -0.02 Capex / Sales 8.9% 8.4% 4.0% 3.0%
EBIT margin 0.5% -1.3% -0.8% -0.0% Pay Out Ratio 0.0% 0.0% 0.0% 0.0%
Profit before taxes -0.40 -4.18 -3.60 -2.01
Taxes 0.80 1.67 1.44 0.60
Net Income 0.40 -2.51 -2.16 -1.41
Per Share Data
(EUR) 2018A 2019E 2020E 2021E
EPS 0.03 -0.18 -0.15 -0.10
Growth Rates DPS 0.00 0.00 0.00 0.00
(%) 2018A 2019E 2020E 2021E BVPS 4.55 4.37 4.22 4.12
Growth Group Net Sales 0.5% -1.5% 2.8% 4.3%
Growth EBITDA 7.6% -7.5% 7.1% 21.2%
Growth EBIT 29.0% nm nm nm
Growth Net Profit nm nm nm nm Stock Market Ratios* *((Priced(Priced
(x) 2018A 2019E 2020E 2021E
P/E nm nm nm nm
P/OpCFPS 7.6 4.5 4.2 3.5
Balance Sheet P/BV 0.7 0.6 0.6 0.6
(EURm) 2018A 2019E 2020E 2021E Dividend Yield (%) 0.0% 0.0% 0.0% 0.0%
Capital Employed 137.52 142.50 139.52 133.95 EV/Sales
0.7 0.7 0.7 0.6
Shareholders’ Equity 63.72 61.22 59.06 57.65 EV/EBITDA 15.7 16.9 15.7 12.5
Net Financial Debt / (Cash) 73.80 81.29 80.46 76.30 EV/EBIT nm nm nm nm
* Priced on 31 January 2020
Source: Company data, UBI Banca estimates 2018 Stock Market Ratios based on average 2018 price
Sustainable Finance and Fintech: progress and innovation, 6 February 2020
6 Servizio Studi – Equity Research
CNH Industrial 03 February 2020 – 5:30 PM TARGET PRICE: 10.00 MARKET PRICE: 8.58
Capital Goods
Data
Shares outstanding (m): 1,340.2
Market Cap. (EURm): 11,411
Enterprise Value (EURm): 13,227
Av. Daily Trad. Vol. (‘000): 1,278
Reuters/Bloomberg: CNHI.MI CNHI IM
52-Week Range (EUR): 8.53 11.99
Source: FactSet
Performance
1m 3m 12m
Absolute -13.3% -13.1% -1.6%
Rel. to FTSE IT -11.7% -14.3% -16.6%
Graph Area Absolute/Relative 12 M
Source: FactSet
Graph Shareholders’ Structure
Source: Company data
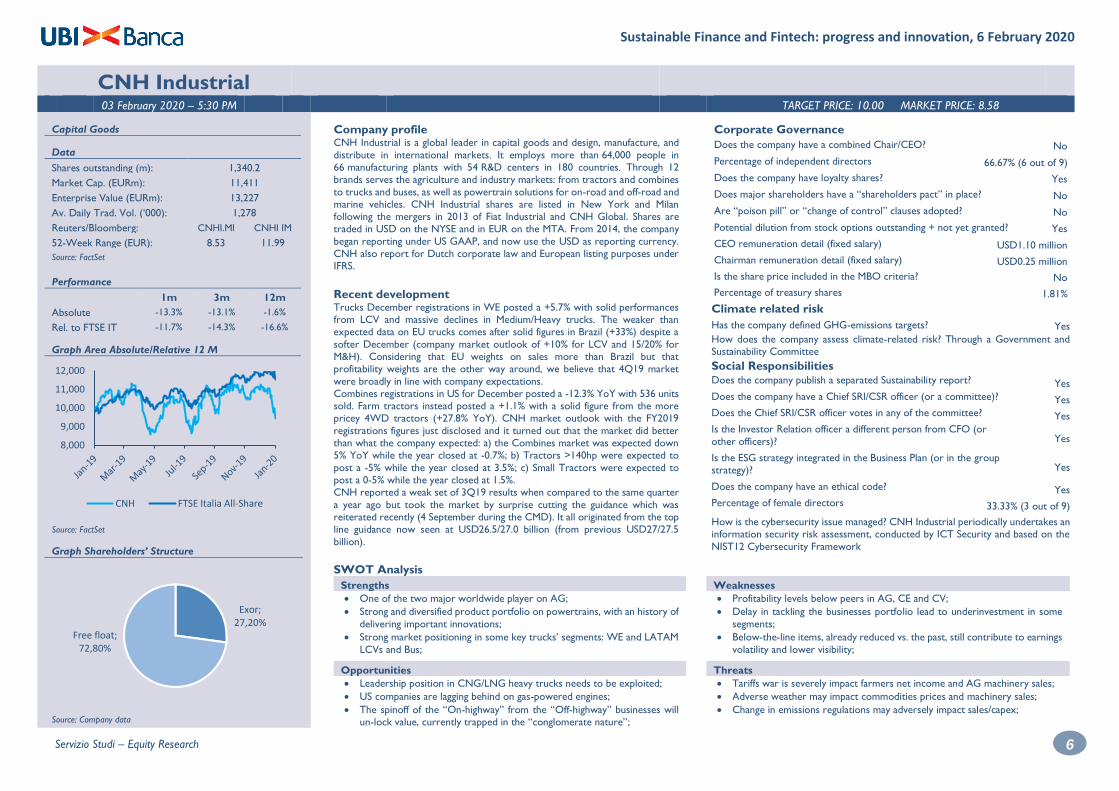
Company profile CNH Industrial is a global leader in capital goods and design, manufacture, and
distribute in international markets. It employs more than 64,000 people in 66 manufacturing plants with 54 R&D centers in 180 countries. Through 12 brands serves the agriculture and industry markets: from tractors and combines
to trucks and buses, as well as powertrain solutions for on-road and off-road and marine vehicles. CNH Industrial shares are listed in New York and Milan following the mergers in 2013 of Fiat Industrial and CNH Global. Shares are traded in USD on the NYSE and in EUR on the MTA. From 2014, the company
began reporting under US GAAP, and now use the USD as reporting currency.
CNH also report for Dutch corporate law and European listing purposes under IFRS.
Recent development Trucks December registrations in WE posted a +5.7% with solid performances from LCV and massive declines in Medium/Heavy trucks. The weaker than expected data on EU trucks comes after solid figures in Brazil (+33%) despite a
softer December (company market outlook of +10% for LCV and 15/20% for M&H). Considering that EU weights on sales more than Brazil but that profitability weights are the other way around, we believe that 4Q19 market
were broadly in line with company expectations. Combines registrations in US for December posted a -12.3% YoY with 536 units sold. Farm tractors instead posted a +1.1% with a solid figure from the more
pricey 4WD tractors (+27.8% YoY). CNH market outlook with the FY2019
registrations figures just disclosed and it turned out that the market did better than what the company expected: a) the Combines market was expected down 5% YoY while the year closed at -0.7%; b) Tractors >140hp were expected to
post a -5% while the year closed at 3.5%; c) Small Tractors were expected to post a 0-5% while the year closed at 1.5%. CNH reported a weak set of 3Q19 results when compared to the same quarter
a year ago but took the market by surprise cutting the guidance which was reiterated recently (4 September during the CMD). It all originated from the top line guidance now seen at USD26.5/27.0 billion (from previous USD27/27.5
billion).
Corporate Governance
Does the company have a combined Chair/CEO? No
Percentage of independent directors 66.67% (6 out of 9)
Does the company have loyalty shares? Yes
Does major shareholders have a “shareholders pact” in place? No
Are “poison pill” or “change of control” clauses adopted? No
Potential dilution from stock options outstanding + not yet granted? Yes
CEO remuneration detail (fixed salary) USD1.10 million
Chairman remuneration detail (fixed salary) USD0.25 million
Is the share price included in the MBO criteria? No
Percentage of treasury shares 1.81%
Climate related risk
Has the company defined GHG-emissions targets? Yes
How does the company assess climate-related risk? Through a Government and Sustainability Committee
Social Responsibilities
Does the company publish a separated Sustainability report? Yes
Does the company have a Chief SRI/CSR officer (or a committee)? Yes
Does the Chief SRI/CSR officer votes in any of the committee? Yes
Is the Investor Relation officer a different person from CFO (or
other officers)? Yes
Is the ESG strategy integrated in the Business Plan (or in the group strategy)? Yes
Does the company have an ethical code? Yes
Percentage of female directors 33.33% (3 out of 9)
How is the cybersecurity issue managed? CNH Industrial periodically undertakes an information security risk assessment, conducted by ICT Security and based on the
NIST12 Cybersecurity Framework
SWOT Analysis
Strengths Weaknesses
• One of the two major worldwide player on AG;
• Strong and diversified product portfolio on powertrains, with an history of
delivering important innovations;
• Strong market positioning in some key trucks’ segments: WE and LATAM
LCVs and Bus;
• Profitability levels below peers in AG, CE and CV;
• Delay in tackling the businesses portfolio lead to underinvestment in some
segments;
• Below-the-line items, already reduced vs. the past, still contribute to earnings
volatility and lower visibility;
Opportunities Threats
• Leadership position in CNG/LNG heavy trucks needs to be exploited;
• US companies are lagging behind on gas-powered engines;
• The spinoff of the “On-highway” from the “Off-highway” businesses will un-lock value, currently trapped in the “conglomerate nature”;
• Tariffs war is severely impact farmers net income and AG machinery sales;
• Adverse weather may impact commodities prices and machinery sales;
• Change in emissions regulations may adversely impact sales/capex;
Exor; 27,20%
Free float; 72,80%
8,000
9,000
10,000
11,000
12,000
CNH FTSE Italia All-Share

Sustainable Finance and Fintech: progress and innovation, 6 February 2020
7 Servizio Studi – Equity Research
CNH Industrial
Income Statement Financial Ratios
(USDm, %) 2018A 2019E 2020E 2021E (%) 2018A 2019E 2020E 2021E
Net Revenues 29.706 28.520 29.422 30.480 ROE 21,1% 23,7% 16,8% 17,1%
EBITDA 2.671 2.495 2.666 2.873 Net Fin. Debt / Equity (x) 0,12 0,08 0,03 (0,01)
EBITDA margin 9,0% 8,7% 9,1% 9,4% Net Fin. Debt / EBITDA (x) 0,22 0,22 0,09 (0,02)
EBIT 2.101 1.891 2.088 2.298 Capex / Sales 2,0% 2,2% 3,5% 3,7%
EBIT margin 7,1% 6,6% 7,1% 7,5% Pay Out Ratio 25,2% 20,9% 30,5% 30,8%
Profit before taxes 1.566 1.373 1.702 1.995
Taxes (417) 165 (454) (532)
Net Income 1.068 1.503 1.220 1.429
Per Share Data
(USD) 2018A 2019E 2020E 2021E
EPS 0,79 1,11 0,90 1,06
Growth Rates DPS 0,198 0,232 0,275 0,325
(%) 2018A 2019E 2020E 2021E BVPS 3,7 4,7 5,4 6,2
Growth Group Net Sales 7,2% -4,0% 3,2% 3,6%
Growth EBITDA 15,1% -6,6% 6,9% 7,7%
Growth EBIT 28,2% -10,0% 10,4% 10,0%
Growth Net Profit n.m. 40,6% -18,8% 17,2% Stock Market Ratios
(x) 2018A 2019E 2020E 2021E
P/E 15,1 8,5 10,5 8,9
P/OpCFPS 13,9 15,6 7,6 7,0
Balance Sheet P/BV 3,18 2,01 1,75 1,53
(USDm) 2018A 2019E 2020E 2021E Dividend Yield (%) 1,7% 2,5% 2,9% 3,5%
Capital Employed 23.710 24.594 24.582 24.703 EV/Sales
0,65 0,55 0,52 0,49
Shareholders’ Equity 5.043 6.312 7.246 8.338 EV/EBITDA 6,79 5,87 5,37 4,88
Net Financial Debt / (Cash) 600 537 227 (59) EV/EBIT 11,45 10,41 8,97 7,79
* Priced on 31 January 2020
Source: Company data, UBI Banca estimates 2018 Stock Market Ratios based on average 2018 price
Sustainable Finance and Fintech: progress and innovation, 6 February 2020
8 Servizio Studi – Equity Research
Elettra Investimenti 03 February 2020 – 5:30 PM TARGET PRICE: 11.81 MARKET PRICE: 8.60
Energy Services
Data
Shares outstanding (m): 3.8
Market Cap. (EURm): 33.0
Enterprise Value (EURm): 53.6
Av. Daily Trad. Vol. (000): 4.8
Reuters/Bloomberg: ELIN.MI ELIN IM
52-Week Range (EUR): 8.4 10.1
Source: FactSet
Performance
1m 3m 12m
Absolute 1.8% -3.4% -11.2%
Rel. to FTSE IT 3.1% -5.8% -23.8%
Graph Area Absolute/Relative 12 M
Source: FactSet
Graph Shareholders’ Structure
Source: Company data
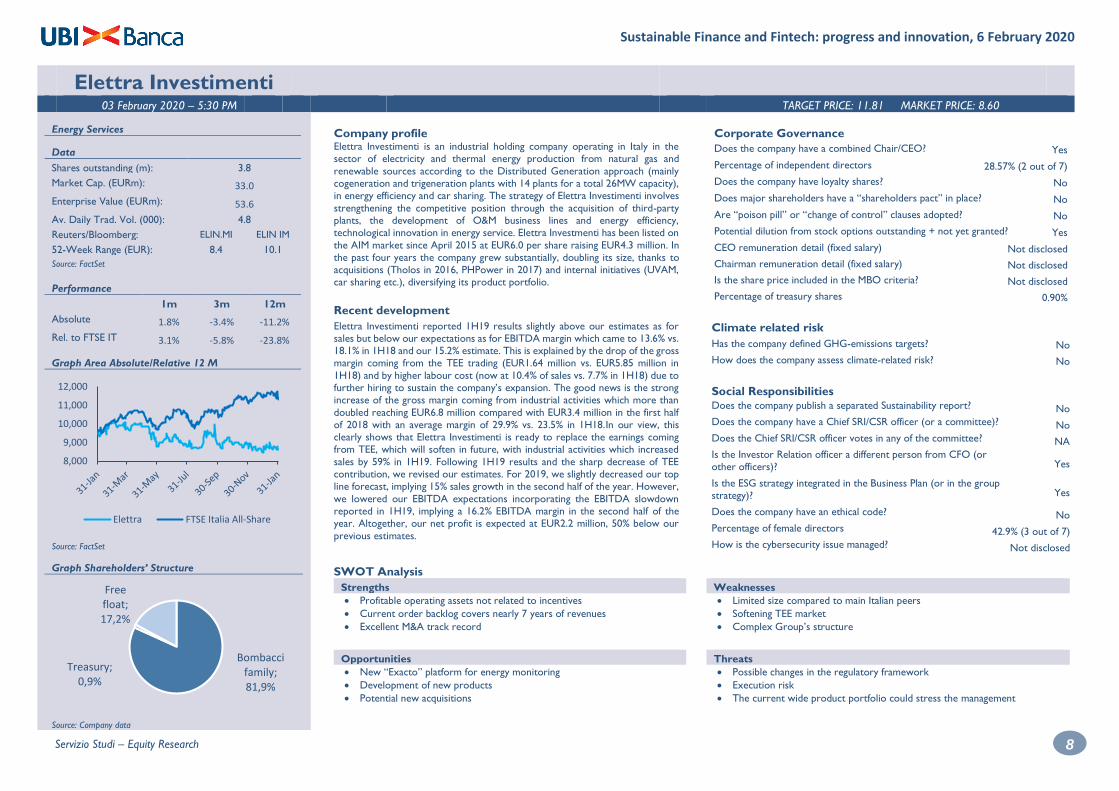
Company profile Elettra Investimenti is an industrial holding company operating in Italy in the sector of electricity and thermal energy production from natural gas and
renewable sources according to the Distributed Generation approach (mainly cogeneration and trigeneration plants with 14 plants for a total 26MW capacity), in energy efficiency and car sharing. The strategy of Elettra Investimenti involves
strengthening the competitive position through the acquisition of third-party plants, the development of O&M business lines and energy efficiency, technological innovation in energy service. Elettra Investmenti has been listed on
the AIM market since April 2015 at EUR6.0 per share raising EUR4.3 million. In
the past four years the company grew substantially, doubling its size, thanks to acquisitions (Tholos in 2016, PHPower in 2017) and internal initiatives (UVAM, car sharing etc.), diversifying its product portfolio.
Recent development
Elettra Investimenti reported 1H19 results slightly above our estimates as for sales but below our expectations as for EBITDA margin which came to 13.6% vs. 18.1% in 1H18 and our 15.2% estimate. This is explained by the drop of the gross margin coming from the TEE trading (EUR1.64 million vs. EUR5.85 million in
1H18) and by higher labour cost (now at 10.4% of sales vs. 7.7% in 1H18) due to further hiring to sustain the company’s expansion. The good news is the strong increase of the gross margin coming from industrial activities which more than
doubled reaching EUR6.8 million compared with EUR3.4 million in the first half
of 2018 with an average margin of 29.9% vs. 23.5% in 1H18.In our view, this clearly shows that Elettra Investimenti is ready to replace the earnings coming from TEE, which will soften in future, with industrial activities which increased
sales by 59% in 1H19. Following 1H19 results and the sharp decrease of TEE contribution, we revised our estimates. For 2019, we slightly decreased our top line forecast, implying 15% sales growth in the second half of the year. However,
we lowered our EBITDA expectations incorporating the EBITDA slowdown reported in 1H19, implying a 16.2% EBITDA margin in the second half of the year. Altogether, our net profit is expected at EUR2.2 million, 50% below our
previous estimates.
Corporate Governance
Does the company have a combined Chair/CEO? Yes
Percentage of independent directors 28.57% (2 out of 7)
Does the company have loyalty shares? No
Does major shareholders have a “shareholders pact” in place? No
Are “poison pill” or “change of control” clauses adopted? No
Potential dilution from stock options outstanding + not yet granted? Yes
CEO remuneration detail (fixed salary) Not disclosed
Chairman remuneration detail (fixed salary) Not disclosed
Is the share price included in the MBO criteria? Not disclosed
Percentage of treasury shares 0.90%
Climate related risk
Has the company defined GHG-emissions targets? No
How does the company assess climate-related risk? No
Social Responsibilities
Does the company publish a separated Sustainability report? No
Does the company have a Chief SRI/CSR officer (or a committee)? No
Does the Chief SRI/CSR officer votes in any of the committee? NA
Is the Investor Relation officer a different person from CFO (or other officers)?
Yes
Is the ESG strategy integrated in the Business Plan (or in the group strategy)?
Yes
Does the company have an ethical code? No
Percentage of female directors 42.9% (3 out of 7)
How is the cybersecurity issue managed? Not disclosed
SWOT Analysis
Strengths Weaknesses
• Profitable operating assets not related to incentives
• Current order backlog covers nearly 7 years of revenues
• Excellent M&A track record
• Limited size compared to main Italian peers
• Softening TEE market
• Complex Group’s structure
Opportunities Threats
• New “Exacto” platform for energy monitoring
• Development of new products
• Potential new acquisitions
• Possible changes in the regulatory framework
• Execution risk
• The current wide product portfolio could stress the management
8,000
9,000
10,000
11,000
12,000
Elettra FTSE Italia All-Share
Bombacci family; 81,9%
Treasury; 0,9%
Free float; 17,2%

Sustainable Finance and Fintech: progress and innovation, 6 February 2020
9 Servizio Studi – Equity Research
Elettra Investimenti
Income Statement Financial Ratios
(EURm, %) 2018A 2019E 2020E 2021E (%) 2018A 2019E 2020E 2021E
Net Revenues 55.0 61.5 60.3 61.9 ROE 9.0% 14.1% 15.7% 16.0%
EBITDA 8.5 9.2 9.9 10.4 Net Fin. Debt / Equity (x) 1.0 1.1 1.2 1.2
EBITDA margin 15.4% 15.0% 16.4% 16.8% Net Fin. Debt / EBITDA (x) 1.7 2.0 2.1 2.2
EBIT 3.7 4.2 4.7 5.1 Capex / Sales 13.7% 11.6% 13.9% 15.5%
EBIT margin 6.8% 6.8% 7.8% 8.2% Pay Out Ratio 73.4% 68.9% 64.7% 65.8%
Profit before taxes 3.1 3.7 4.3 4.7
Taxes -1.8 -1.5 -1.6 -1.8
Net Income 1.3 2.2 2.7 2.9
Per Share Data
(EUR) 2018A 2019E 2020E 2021E
EPS 0.34 0.58 0.69 0.76
Growth Rates DPS 0.25 0.40 0.45 0.50
(%) 2018A 2019E 2020E 2021E BVPS 3.80 4.13 4.43 4.74
Growth Group Net Sales 17.0% 11.7% -1.9% 2.7%
Growth EBITDA -28.0% 8.6% 7.5% 5.0%
Growth EBIT -47.5% 11.8% 12.9% 7.3%
Growth Net Profit -70.6% 70.6% 19.6% 9.3% Stock Market Ratios
(x) 2018A 2019E 2020E 2021E
P/E 29.5 14.8 12.4 11.3
P/OpCFPS 10.4 3.9 4.5 3.8
Balance Sheet P/BV 2.7 2.1 1.9 1.8
(EURm) 2018A 2019E 2020E 2021E Dividend Yield (%) 2.5% 4.7% 5.2% 5.8%
Capital Employed 30.2 34.9 38.5 42.3 EV/Sales
1.0 0.9 0.9 0.9
Shareholders’ Equity 14.6 15.9 17.0 18.2 EV/EBITDA 6.6 5.8 5.7 5.6
Net Financial Debt / (Cash) 14.8 18.2 20.8 23.4 EV/EBIT 15.1 12.9 11.9 11.6
* Priced on 31 January 2020
Source: Company data, UBI Banca estimates 2018 Stock Market Ratios based on average 2018 price

Sustainable Finance and Fintech: progress and innovation, 6 February 2020
10 Servizio Studi – Equity Research
Equita Group 03 February 2020 – 5:30 PM TARGET PRICE: 3.37 MARKET PRICE: 2.84
Investment Banking
Data
Shares outstanding (m): 45.5
Market Cap. (EURm): 129.1
Enterprise Value (EURm): NA
Av. Daily Trad. Vol. (‘000): 26.1
Reuters/Bloomberg: EQUI.I EQUI IM
52-Week Range (EUR): 2.43 3.27
Source: FactSet
Performance
1m 3m 12m
Absolute -0.4% 13.6% 7.2%
Rel. to FTSE IT 1.2% 12.4% -26.1%
Graph Area Absolute/Relative 12 M
Source: FactSet
Graph Shareholders’ Structure
Source: Company data
Company profile Equita is the leading boutique in Italy with distinctive features like the largest
trading floor in Italy, a top-ranked research team and clear positioning in the mid-
market segment. In the last ten years, Equita has grown its investment banking
division from scratch and also developed an Alternative Asset Management
(AAM) division business, which, starting from portfolio management, has grown
into private debt and private equity. The diversification effort included also the
entrance into retail trading on equities and bonds and the extension of the Global
markets activities to derivatives, ETFs and, more important, fixed incomes and
market making. Equita today operates three different business lines: a) Global
Markets (65% of 9M2019 Net Revenues); b) Investment Banking (27%); c) AAM
(8%). In 2017 it listed on the AIM segment and, in 2018, it moved to the STAR.
Recent development
Last November management presented a mid-long term business plan, in our view, to give more visibility on what the shape of the group will be once all the recent initiatives will reach a cruise speed: a) Global market: end-markets are still seen tough and the revenues growth toward the high end of the EUR30/34
million range (between 40% and 45% of total revenues) should be driven by cross-selling and diversification; b) IB: the plan assumes a EUR30/34 million revenues target (again 40-45% of total) which means at least doubling from the
EUR15 million expected for this year, but the 2022 target is more realistic if seen in the context of the EUR26 million achieved only one year ago; c) AAM: the launch of the SGR should ease the AuM growth towards the EUR2 billion
targeted with revenues being 10% of total (EUR8-11 million).
In the third quarter of 2019 Equita financials showed, finally, some signs of stabilization with a EUR1,6 million net profit, +4% vs. the 3Q18 figure. Revenues were up YoY thanks to market shares gains in Global Markets and despite negative m-t-m of Equita's SPAC. In the wording of the 3Q19 release, it seems
clear how management perceives a stabilization in market conditions, specifically in Investment Banking.
Corporate Governance
Does the company have a combined Chair/CEO? No
Percentage of independent directors 12.86% (3 out of 7)
Does the company have loyalty shares? Yes
Does major shareholders have a “shareholders pact” in place? Yes
Are “poison pill” or “change of control” clauses adopted? No
Potential dilution from stock options outstanding + not yet granted? Yes
CEO remuneration detail (fixed salary) EUR0.65 million
Chairman remuneration detail (fixed salary) EUR0.24 million
Is the share price included in the MBO criteria? No
Percentage of treasury shares 9.1%
Climate related risk
Has the company defined GHG-emissions targets? No
How does the company assess climate-related risk? No
Social Responsibilities
Does the company publish a separated Sustainability report? No
Does the company have a Chief SRI/CSR officer (or a committee)? Yes
Does the Chief SRI/CSR officer votes in any of the committee? Yes
Is the Investor Relation officer a different person from CFO (or other officers)?
Yes
Is the ESG strategy integrated in the Business Plan (or in the group strategy)?
Yes
Does the company have an ethical code? Yes
Percentage of female directors 28.57% (2 out of 7)
How is the cybersecurity issue managed? Not disclosed
SWOT Analysis
Strengths Weaknesses
• Leading position in the cash-equity Italian market;
• Experienced management with an entrepreneurial attitude;
• High employees’ retention rates;
• Sales & Trading and Proprietary Trading businesses are volatile;
• Revenues are Italy-centric (i.e. from Italian customers/Italian assets/stocks);
• Its small size compared to International players/some Italian players;
Opportunities Threats
• Higher cross-selling;
• Development of AAM, which could add visibility to revenues;
• The company has enough resources to grow in-organically;
• Reputational risk;
• Key people risk (mitigated by shareholders pacts)
• Country risk.
2,200
2,700
3,200
3,700
Equita FTSE Italia All-Share
Management and
employees; 53,90%
Treasury shares; 9,10%
Free float; 37,00%

Sustainable Finance and Fintech: progress and innovation, 6 February 2020
11 Servizio Studi – Equity Research
Equita Group
Income Statement Financial Ratios
(EURm, %) 2018A 2019E 2020E 2021E (%) 2018A 2019E 2020E 2021E
Net Revenues 59,8 52,5 57,6 61,7 RoE 13,8% 10,4% 13,0% 14,5%
Personnel Costs 27,4 24,2 26,0 28,0 RoTE 20,4% 14,8% 19,1% 21,6%
Administrative Expenses 16,8 16,6 16,8 16,9 Cost/Income 73,9% 77,6% 74,3% 72,7%
Profit Before Taxes 15,6 11,8 14,8 16,9 Comp/Revenues 45,8% 46,0% 45,2% 45,3%
% on Net Revenues 26,1% 22,4% 25,7% 27,3% RoE/CoE (x)
1,97 1,48 1,85 2,06
Income Taxes 4,5 3,7 4,5 5,1
Group Net Profit 11,0 8,1 10,3 11,7
Net Income Adjusted 12,0 8,1 10,3 11,7
Per Share Data
(EUR) 2018A 2019E 2020E 2021E
EPS Adjusted 0,26 0,18 0,23 0,26
Growth Rates DPS 0,22 0,20 0,22 0,25
(%) 2018A 2019E 2020E 2021E BVPS ex treasury 1,76 1,72 1,75 1,78
Growth Group Net Sales 10,9% -12,2% 9,7% 7,2%
Growth EBITDA 1,6% -24,5% 25,8% 13,8%
Growth EBIT 0,2% -26,3% 26,7% 13,8%
Growth Net Profit 6,6% -32,0% 26,7% 13,8% Stock Market Ratios
(x) 2018A 2019E 2020E 2021E
P/E (x) 13,2 15,8 12,5 11,0
P/E Adjusted (x) 12,2 15,8 12,5 11,0
Balance Sheet P/BV (x) 1,8 1,6 1,6 1,6
(EURm) 2018A 2019E 2020E 2021E P/TBV (x) 2,2 2,0 2,0 2,0
Shareholders’ Equity 80,1 78,2 79,4 81,1 Dividend Yield (%) 6,9% 7,1% 7,7% 8,6%
RWA 218,2 212,9 224,9 236,2 RoE/CoE (x) 2,0 1,5 1,9 2,1
RoTE 20,4% 14,8% 19,1% 21,6% Payout 90,7% 111,9% 97,1% 95,0%
* Priced on 31 January 2020
Source: Company data, UBI Banca estimates 2018 Stock Market Ratios based on average 2018 price

Sustainable Finance and Fintech: progress and innovation, 6 February 2020
12 Servizio Studi – Equity Research
Ferrari 03 February 2020 – 5:30 PM TARGET PRICE: 180 MARKET PRICE: 152.5
Branded Goods
Data
Shares outstanding (m): 179.7
Market Cap. (EURm): 28,643
Enterprise Value (EURm): 27,427
Av. Daily Trad. Vol. (‘000): 429.0
Reuters/Bloomberg: RACE.MI RACE IM
52-Week Range (EUR): 96.7 158.7
Source: FactSet
Performance
1m 3m 12m
Absolute 3.1% 6.3% 40.4%
Rel. to FTSE IT 4.6% 5.1% 25.4%
Graph Area Absolute/Relative 12 M
Source: FactSet
Graph Shareholders’ Structure
Source: Company data
Company profile
Ferrari builds cars unique in terms of their performance, innovations, technology, driving pleasure and design. Those cars are acknowledged the world over as the pinnacle of Made in Italy achievement. Almost half of them are sold in Europe
with another third sold in US. The company has a record-braking presence in racing being the only constructor to have taken part in every single edition of the F1 championship since its launch (with 15 drivers’ world titles and 16
constructors’ world title). It employees almost 4,000 people and sells almost 10,000 cars in more than 60 countries through a dealer network that surpassed
the 200 stores mark.
Recent development
At the end of January Ferrari has been named the most influential brand of the world (for the second consecutive year) by Brand Finance. In a December 2019 interview, CEO Mr. Camilleri stated that Ferrari won't have its first fully electric model ready until after 2025 as the battery technology
requires more development, pushing back expectations. He also hinted at strong FY2019 results but statement was too generic to have a read-across from it. Ferrari reported a solid set of results in 3Q19 showing sound YoY growth (+13%
in units and +14% revenues for cars & spare parts), nice price/mix improvement (+5.1% to EUR286K), margins expansion (70bps at EBITDA level) and above all
impressive cash flow generation, despite heavy investments (EUR40 million
increase in R&D alone). The cash generation was probably the biggest surprise in this set of results: Net Industrial Debt reached the EUR369 million mark, in line with our estimates, but with more share buyback than expected (EUR93 million delta).
Corporate Governance
Does the company have a combined Chair/CEO? No
Percentage of independent directors 66.7% (8 out of 12)
Does the company have loyalty shares? Yes
Does major shareholders have a “shareholders pact” in place? Yes
Are “poison pill” or “change of control” clauses adopted? No
Potential dilution from stock options outstanding + not yet granted? Yes
CEO remuneration detail (fixed salary) EUR0.27 million
Chairman remuneration detail (fixed salary) EUR0.08 million
Is the share price included in the MBO criteria? Yes
Percentage of treasury shares 3.38%
Climate related risk
Has the company defined GHG-emissions targets? No
How does the company assess climate-related risk? Through Governance and Sustainability Committee
Social Responsibilities
Does the company publish a separated Sustainability report? Yes
Does the company have a Chief SRI/CSR officer (or a committee)? Yes
Does the Chief SRI/CSR officer votes in any of the committee? Yes
Is the Investor Relation officer a different person from CFO (or
other officers)? Yes
Is the ESG strategy integrated in the Business Plan (or in the group strategy)?
Yes
Does the company have an ethical code? Yes
Percentage of female directors 33.33% (4 out of 12)
How is the cybersecurity issue managed? Compliance with GDPR, it adopted a progressive approach to ensure compliance with data protection law requirements,
such as the implementation of ICT and security systems
SWOT Analysis
Strengths Weaknesses
• Unmatchable brand image, the world's most recognizable brand;
• Unique racing heritage;
• Loyal and growing customer base composed of UHNWI.
• Exposure to exchange rate fluctuations;
• Product category not ideal to benefit from growth in Chinese's HNWI;
• 100% reliance on a single plant (Maranello, Modena only for chassis);
Opportunities Threats
• Personalization increasing more than we estimate;
• Volumes increases;
• Efficiencies higher than expected also on F1;
• Trade war may impact volumes or margins and, with a single plant, is impossible to balance-out also in the long run;
• Need to maintain a proper balance between exclusivity and growth;
• Lack of wins in F1;
104,000
124,000
144,000
164,000
Ferrari FTSE Italia All-Share
Exor; 24,0%
Piero Ferrari; 10,2%
Treasury shares; 4,2%
Free float; 61,6%

Sustainable Finance and Fintech: progress and innovation, 6 February 2020
13 Servizio Studi – Equity Research
Ferrari
Income Statement Financial Ratios
(EURm, %) 2018A 2019E 2020E 2021E (%) 2018A 2019E 2020E 2021E
Net Revenues 3.419,9 3.721,3 4.182,4 4.735,9 ROE 58,1% 37,9% 33,0% 30,2%
EBITDA 1.134,5 1.280,6 1.460,0 1.715,7 Net Fin. Debt / Equity (x) (0,3) (0,2) 0,0 0,2
EBITDA margin 33,2% 34,4% 34,9% 36,2% Net Fin. Debt / EBITDA (x) (0,4) (0,3) 0,0 0,4
EBIT 826,0 925,6 1.033,7 1.213,5 Capex / Sales 18,6% 18,9% 17,8% 13,7%
EBIT margin 24,2% 24,9% 24,7% 25,6% Pay Out Ratio 24,6% 28,3% 30,0% 30,0%
Profit before taxes 803,0 883,3 1.012,8 1.202,8
Taxes (16,0) (176,8) (193,1) (233,7)
Net Income 787,0 706,5 819,7 969,1
Per Share Data
(EUR) 2018A 2019E 2020E 2021E
EPS 4,2 3,8 4,4 5,2
Growth Rates DPS 1,0 1,1 1,3 1,5
(%) 2018A 2019E 2020E 2021E BVPS 7,18 9,93 13,23 17,08
Growth Group Net Sales 0,1% 8,8% 12,4% 13,2%
Growth EBITDA 9,5% 12,9% 14,0% 17,5%
Growth EBIT 6,6% 12,1% 11,7% 17,4%
Growth Net Profit 46,5% (10,2%) 16,0% 18,2% Stock Market Ratios
(x) 2018A 2019E 2020E 2021E
P/E 25,3 40,5 34,9 29,6
P/OpCFPS 38,8 27,8 26,9 18,3
Balance Sheet P/BV 14,7 10,6 8,0 6,2
(EURm) 2018A 2019E 2020E 2021E Dividend Yield (%) 1,0% 0,7% 0,9% 1,0%
Capital Employed 2.487 2.993 3.190 3.258 EV/Sales
5,8 7,5 6,6 5,7
Shareholders’ Equity 1.349 1.861 2.480 3.204 EV/EBITDA 17,4 21,7 18,8 15,6
Net Financial Debt / (Cash) (1.133) (1.127) (704) (49) EV/EBIT 23,9 30,1 26,5 22,1
* Priced on 31 January 2020
Source: Company data, UBI Banca estimates 2018 Stock Market Ratios based on average 2018 price
Sustainable Finance and Fintech: progress and innovation, 6 February 2020
14 Servizio Studi – Equity Research
First Capital 03 February 2020 – 5:30 PM TARGET PRICE: 16.80 MARKET PRICE: 12.00
Financial Holding
Data
Shares outstanding (m): 2.55
Market Cap. (EURm): 30.6
NAV (EURm): 46.5
Av. Daily Trad. Vol. (‘000): 1,2
Reuters/Bloomberg: FICM.MI FICM.IM
52-Week Range (EUR): 9.9 12.5
Source: FactSet
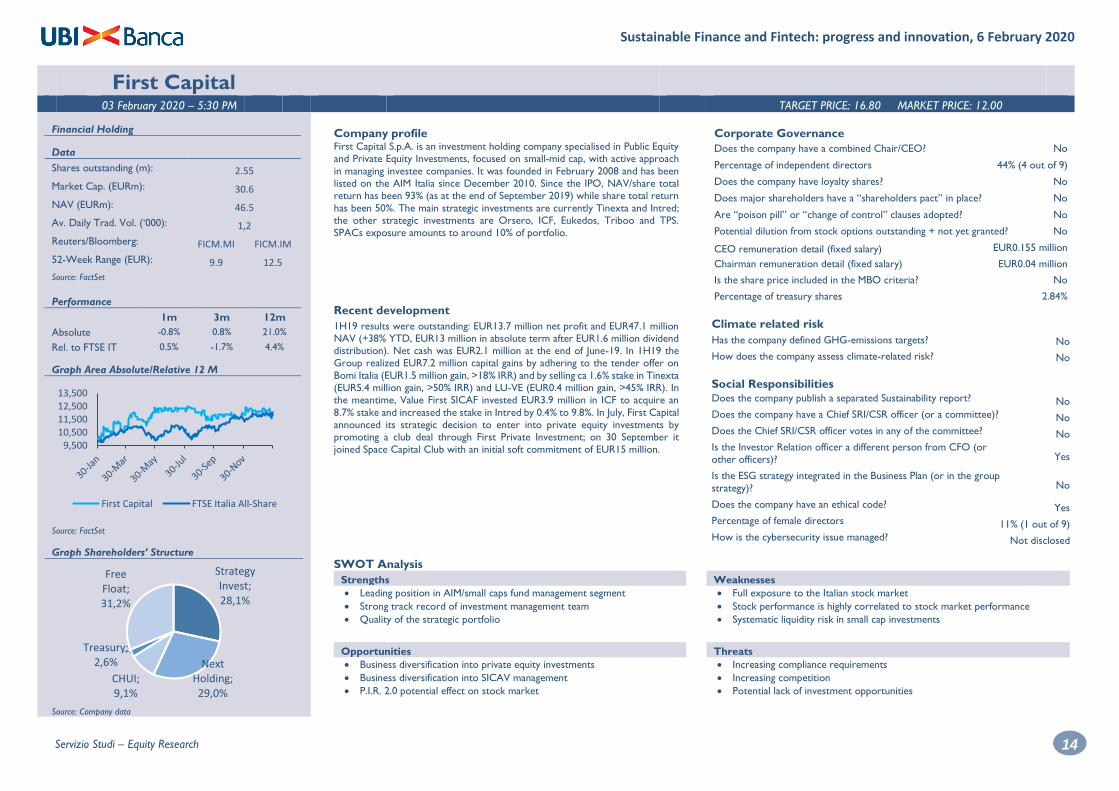
Performance
1m 3m 12m
Absolute -0.8% 0.8% 21.0%
Rel. to FTSE IT 0.5% -1.7% 4.4%
Graph Area Absolute/Relative 12 M
Source: FactSet
Graph Shareholders’ Structure
Source: Company data
Company profile First Capital S.p.A. is an investment holding company specialised in Public Equity and Private Equity Investments, focused on small-mid cap, with active approach
in managing investee companies. It was founded in February 2008 and has been listed on the AIM Italia since December 2010. Since the IPO, NAV/share total return has been 93% (as at the end of September 2019) while share total return
has been 50%. The main strategic investments are currently Tinexta and Intred; the other strategic investments are Orsero, ICF, Eukedos, Triboo and TPS. SPACs exposure amounts to around 10% of portfolio.
Recent development
1H19 results were outstanding: EUR13.7 million net profit and EUR47.1 million NAV (+38% YTD, EUR13 million in absolute term after EUR1.6 million dividend distribution). Net cash was EUR2.1 million at the end of June-19. In 1H19 the Group realized EUR7.2 million capital gains by adhering to the tender offer on
Bomi Italia (EUR1.5 million gain, >18% IRR) and by selling ca 1.6% stake in Tinexta (EUR5.4 million gain, >50% IRR) and LU-VE (EUR0.4 million gain, >45% IRR). In the meantime, Value First SICAF invested EUR3.9 million in ICF to acquire an
8.7% stake and increased the stake in Intred by 0.4% to 9.8%. In July, First Capital
announced its strategic decision to enter into private equity investments by promoting a club deal through First Private Investment; on 30 September it joined Space Capital Club with an initial soft commitment of EUR15 million.
Corporate Governance
Does the company have a combined Chair/CEO? No
Percentage of independent directors 44% (4 out of 9)
Does the company have loyalty shares? No
Does major shareholders have a “shareholders pact” in place? No
Are “poison pill” or “change of control” clauses adopted? No
Potential dilution from stock options outstanding + not yet granted? No
CEO remuneration detail (fixed salary) EUR0.155 million
Chairman remuneration detail (fixed salary) EUR0.04 million
Is the share price included in the MBO criteria? No
Percentage of treasury shares 2.84%
Climate related risk
Has the company defined GHG-emissions targets? No
How does the company assess climate-related risk? No
Social Responsibilities
Does the company publish a separated Sustainability report? No
Does the company have a Chief SRI/CSR officer (or a committee)? No
Does the Chief SRI/CSR officer votes in any of the committee? No
Is the Investor Relation officer a different person from CFO (or other officers)?
Yes
Is the ESG strategy integrated in the Business Plan (or in the group
strategy)? No
Does the company have an ethical code? Yes
Percentage of female directors 11% (1 out of 9)
How is the cybersecurity issue managed? Not disclosed
SWOT Analysis
Strengths Weaknesses
• Leading position in AIM/small caps fund management segment
• Strong track record of investment management team
• Quality of the strategic portfolio
• Full exposure to the Italian stock market
• Stock performance is highly correlated to stock market performance
• Systematic liquidity risk in small cap investments
Opportunities Threats
• Business diversification into private equity investments
• Business diversification into SICAV management
• P.I.R. 2.0 potential effect on stock market
• Increasing compliance requirements
• Increasing competition
• Potential lack of investment opportunities
9,50010,50011,50012,50013,500
First Capital FTSE Italia All-Share
Strategy Invest; 28,1%
Next Holding; 29,0%
CHUI; 9,1%
Treasury; 2,6%
Free Float; 31,2%

Sustainable Finance and Fintech: progress and innovation, 6 February 2020
15 Servizio Studi – Equity Research
First Capital
Income Statement Financial Ratios
(EURm, %) 2018A 2019E 2020E 2021E (%) 2018A 2019E 2020E 2021E
Dividends 0,38 0,65 0,67 0,69 Debt/Equity 0,16 -0,16 -0,18 -0,20
Other financial income 0,07 0,07 0,07 0,07 Cost/Income nm 19,2% 51,3% 52,0%
Trading profit/(loss) -1,02 15,35 2,37 2,37 ROI -5,8% 32,5% 3,4% 3,4%
Total income -0,57 16,07 3,11 3,13 ROE -6,0% 27,1% 2,4% 2,4%
D&A -0,02 -0,10 -0,10 -0,10 Pay Out Ratio 90,0% 5,4% 60,9% 63,4%
Operating (cost)/income -1,46 -3,08 -1,60 -1,63
Financial charges -0,25 -0,28 -0,12 -0,12
Pre-tax profit -2,29 12,61 1,29 1,28
Taxes 0,24 -0,16 -0,16 -0,16 Per Share Data
Net profit -2,05 12,45 1,13 1,12 (EUR) 2018A 2019E 2020E 2021E
EPS -0,80 4,87 0,44 0,44
DPS 0,25 0,26 0,27 0,28
BVPS 13,35 17,98 18,16 18,34
Balance Sheet Stock Market Ratios
(EURm) 2018A 2019E 2020E 2021E (x) 2018A 2019E 2020E 2021E
Capital Employed 39,44 38,75 38,05 37,36 P/E -12,0 2,3 27,1 27,4
Shareholders’ Equity 34,09 45,92 46,40 46,85 P/BV 0,7 0,6 0,7 0,7
Net Financial Debt / (Cash) 5,35 -7,18 -8,35 -9,50 Div Yield 2,6% 2,3% 2,2% 2,3%
* Priced on 31 January 2020
Source: Company data, UBI Banca estimates 2018 Stock Market Ratios based on average 2018 price

Sustainable Finance and Fintech: progress and innovation, 6 February 2020
16 Servizio Studi – Equity Research
Gefran 03 February 2020 – 5:30 PM TARGET PRICE: 8.98 MARKET PRICE: 6.40
Electrical equipment
Data
Shares outstanding (m): 14.4
Market Cap. (EURm): 91.4
Enterprise Value (EURm): 108.4
Av. Daily Trad. Vol. (000): 34.8
Reuters/Bloomberg: GFRN.MI GE IM
52-Week Range (EUR): 5.8 8.3
Source: FactSet
Performance
1m 3m 12m
Absolute -6.9% -7.8% -18.1%
Rel. to FTSE IT -5.7% -10.1% -29.7%
Graph Area Absolute/Relative 12 M
Source: FactSet
Graph Shareholders’ Structure
Source: Company data
Company profile Gefran is a leading industrial company specialized in three divisions: 1) Sensors
for industrial applications (44% of sales in 2018), typically for large industrial machine makers supplying the plastic industry, packaging industry, automotive, and white goods companies; 2) Systems and components for automation (27% of
sales) including the production of complete electric panels for the plastic industry, and 3) Motion Controls division (29% of sales) which produces a complete range of electric drives to regulate the speed of AC and DC motors and is specialised in inverters for industrial applications and for domestic lifts
which are progressively replacing hydraulic and mechanical devices. The company
has 10 production sites, nearly 800 employees and 70% of sales outside Italy (mainly EU, China and the US). Gefran is vertically integrated, from R&D (2 R&D
centers, with investments approaching 5% of revenues p.a.) to the commercialization of its products (100,000 references) and has a leading position for plastic processing applications. Gefran, 60% controlled by the founder’s
family, which still manages the company, was listed in 1998 and entered the STAR segment in 2001. Recently the CEO resigned and should be replaced by the end of April 2020.
Recent development The first nine months of 2019 were challenging for Gefran, which was impacted by the slowdown of the high-margin Sensors division while the order intake declined. From a geographical standpoint, all regions went down in 9M19 (Asia
by 2.7%, EU by 3.4% and other European countries by 33%) with the sole
exception of Americas (North America was up by 34% and Latam by 10.5%). Lastly, Italy positive performance (+10.1%) can be entirely ascribed to the change in scope of consolidation (consolidation of Elettropiemme). The EBITDA margin
declined to 14.3% from 15.3% in 9M18 also due to higher personnel costs while the net debt rose to EUR14.9 million (>EUR10 million more than Dec-18) mainly because of the lower cash flow, substantial investments, the dividend distribution
and the application of IFRS16. Against this backdrop, the management confirmed its guidance for higher revenues and EBITDA margin in line with 2018, implying a recovery in the last quarter of the year.
Corporate Governance
Does the company have a combined Chair/CEO? Yes
Percentage of independent directors 33.3% (3 out of 9)
Does the company have loyalty shares? No
Does major shareholders have a “shareholders pact” in place? No
Are “poison pill” or “change of control” clauses adopted? No
Potential dilution from stock options outstanding + not yet granted? No
CEO remuneration detail (fixed salary) EUR0.36 million
Chairman remuneration detail (fixed salary) EUR0.31 million
Is the share price included in the MBO criteria? No
Percentage of treasury shares 0.19%
Climate related risk
Has the company defined GHG-emissions targets? No
How does the company assess climate-related risk? The company underwent an "Energetic Audit" in order to assess the efficiency of the use of energetic resources and it committed to solve the critical issues emerged
Social Responsibilities
Does the company publish a separated Sustainability report? Yes
Does the company have a Chief SRI/CSR officer (or a committee)? Yes
Does the Chief SRI/CSR officer votes in any of the committee? Yes
Is the Investor Relation officer a different person from CFO (or
other officers)? No
Is the ESG strategy integrated in the Business Plan (or in the group strategy)?
Yes
Does the company have an ethical code? Yes
Percentage of female directors 33.3% (3 out of 9)
How is the cybersecurity issue managed? Not disclosed
SWOT Analysis
Strengths Weaknesses
• Low exposure to the Italian market (70% revenues outside Italy)
• Strong and consistent product innovation, with R&D at >5% of revenues
• Solid financial structure and attractive dividend yield
• Limited size compared to international peers
• Part of the products are now commodities, competing just on selling prices
• Persistent losses for the Motion Control division
Opportunities Threats
• Growing reference market, in particular sensors
• Potential acquisitions in new segments and/or markets
• Arrival of the new CEO
• Weaker Chinese market
• Currency fluctuations
• High competition and low entry barriers in some segments
5,000
6,000
7,000
8,000
9,000
10,000
Gefran FTSE Italia All-Share
Fingefran; 56,7%
Franceschetti Ennio; 3,5%Lazard;
2,6%
Free float; 37,2%
Sustainable Finance and Fintech: progress and innovation, 6 February 2020
17 Servizio Studi – Equity Research
Gefran
Income Statement Financial Ratios
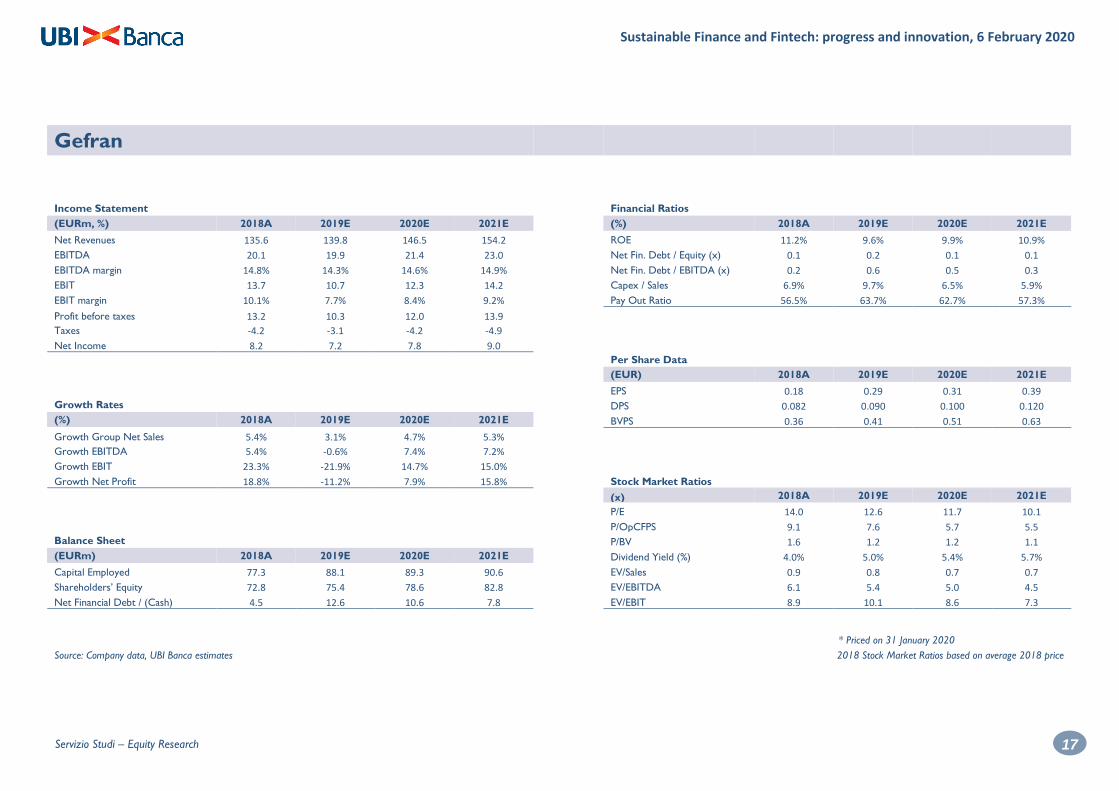
(EURm, %) 2018A 2019E 2020E 2021E (%) 2018A 2019E 2020E 2021E
Net Revenues 135.6 139.8 146.5 154.2 ROE 11.2% 9.6% 9.9% 10.9%
EBITDA 20.1 19.9 21.4 23.0 Net Fin. Debt / Equity (x) 0.1 0.2 0.1 0.1
EBITDA margin 14.8% 14.3% 14.6% 14.9% Net Fin. Debt / EBITDA (x) 0.2 0.6 0.5 0.3
EBIT 13.7 10.7 12.3 14.2 Capex / Sales 6.9% 9.7% 6.5% 5.9%
EBIT margin 10.1% 7.7% 8.4% 9.2% Pay Out Ratio 56.5% 63.7% 62.7% 57.3%
Profit before taxes 13.2 10.3 12.0 13.9
Taxes -4.2 -3.1 -4.2 -4.9
Net Income 8.2 7.2 7.8 9.0
Per Share Data
(EUR) 2018A 2019E 2020E 2021E
EPS 0.18 0.29 0.31 0.39
Growth Rates DPS 0.082 0.090 0.100 0.120
(%) 2018A 2019E 2020E 2021E BVPS 0.36 0.41 0.51 0.63
Growth Group Net Sales 5.4% 3.1% 4.7% 5.3%
Growth EBITDA 5.4% -0.6% 7.4% 7.2%
Growth EBIT 23.3% -21.9% 14.7% 15.0%
Growth Net Profit 18.8% -11.2% 7.9% 15.8% Stock Market Ratios
(x) 2018A 2019E 2020E 2021E
P/E 14.0 12.6 11.7 10.1
P/OpCFPS 9.1 7.6 5.7 5.5
Balance Sheet P/BV 1.6 1.2 1.2 1.1
(EURm) 2018A 2019E 2020E 2021E Dividend Yield (%) 4.0% 5.0% 5.4% 5.7%
Capital Employed 77.3 88.1 89.3 90.6 EV/Sales
0.9 0.8 0.7 0.7
Shareholders’ Equity 72.8 75.4 78.6 82.8 EV/EBITDA 6.1 5.4 5.0 4.5
Net Financial Debt / (Cash) 4.5 12.6 10.6 7.8 EV/EBIT 8.9 10.1 8.6 7.3
* Priced on 31 January 2020
Source: Company data, UBI Banca estimates 2018 Stock Market Ratios based on average 2018 price
Sustainable Finance and Fintech: progress and innovation, 6 February 2020
18 Servizio Studi – Equity Research
Grifal 03 February 2020 – 5:30 PM TARGET PRICE: 4.67 MARKET PRICE: 3.61
Packaging
Data
Shares outstanding (m): 10.55
Market Cap. (EURm): 38.09
Enterprise Value (EURm): 43.42
Av. Daily Trad. Vol. (000): 18.2
Reuters/Bloomberg: GRALA.MI GRAL IM
52-Week Range (EUR): 2.9 5.6
Source: FactSet
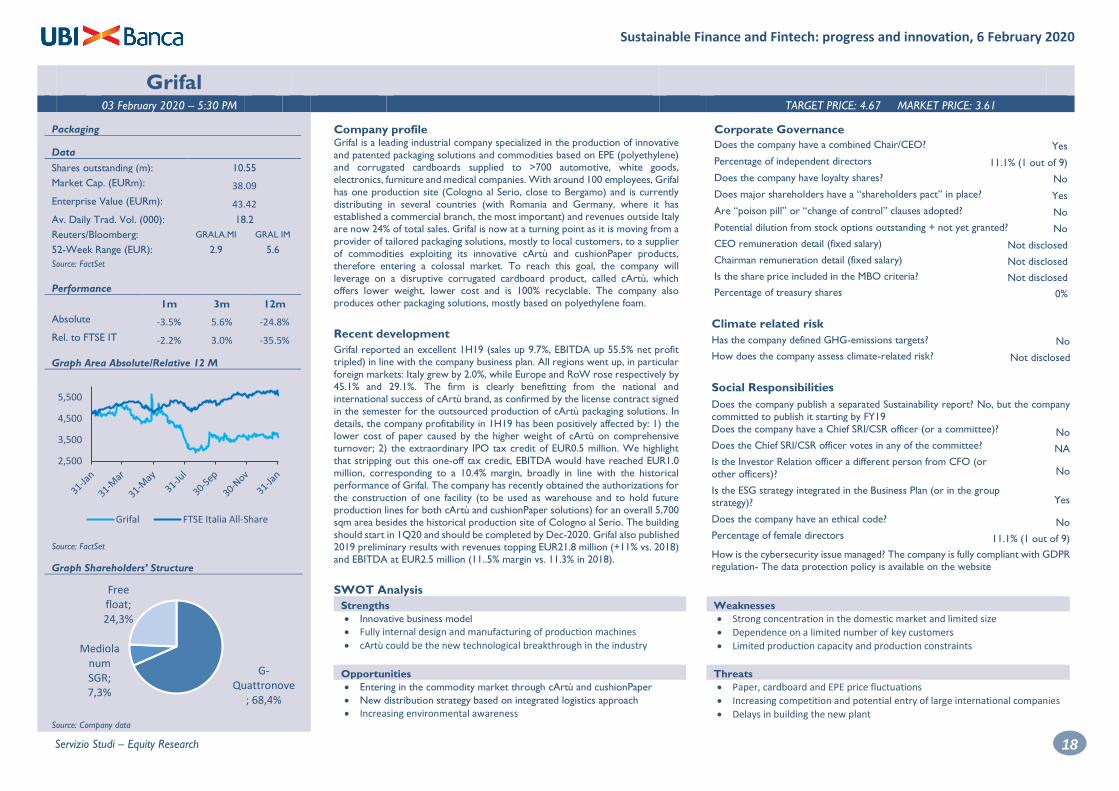
Performance
1m 3m 12m
Absolute -3.5% 5.6% -24.8%
Rel. to FTSE IT -2.2% 3.0% -35.5%
Graph Area Absolute/Relative 12 M
Source: FactSet
Graph Shareholders’ Structure
Source: Company data
Company profile Grifal is a leading industrial company specialized in the production of innovative
and patented packaging solutions and commodities based on EPE (polyethylene) and corrugated cardboards supplied to >700 automotive, white goods, electronics, furniture and medical companies. With around 100 employees, Grifal
has one production site (Cologno al Serio, close to Bergamo) and is currently distributing in several countries (with Romania and Germany, where it has established a commercial branch, the most important) and revenues outside Italy are now 24% of total sales. Grifal is now at a turning point as it is moving from a
provider of tailored packaging solutions, mostly to local customers, to a supplier
of commodities exploiting its innovative cArtù and cushionPaper products, therefore entering a colossal market. To reach this goal, the company will
leverage on a disruptive corrugated cardboard product, called cArtù, which offers lower weight, lower cost and is 100% recyclable. The company also produces other packaging solutions, mostly based on polyethylene foam.
Recent development
Grifal reported an excellent 1H19 (sales up 9.7%, EBITDA up 55.5% net profit tripled) in line with the company business plan. All regions went up, in particular
foreign markets: Italy grew by 2.0%, while Europe and RoW rose respectively by 45.1% and 29.1%. The firm is clearly benefitting from the national and international success of cArtù brand, as confirmed by the license contract signed in the semester for the outsourced production of cArtù packaging solutions. In
details, the company profitability in 1H19 has been positively affected by: 1) the lower cost of paper caused by the higher weight of cArtù on comprehensive turnover; 2) the extraordinary IPO tax credit of EUR0.5 million. We highlight
that stripping out this one-off tax credit, EBITDA would have reached EUR1.0 million, corresponding to a 10.4% margin, broadly in line with the historical performance of Grifal. The company has recently obtained the authorizations for
the construction of one facility (to be used as warehouse and to hold future production lines for both cArtù and cushionPaper solutions) for an overall 5,700 sqm area besides the historical production site of Cologno al Serio. The building
should start in 1Q20 and should be completed by Dec-2020. Grifal also published 2019 preliminary results with revenues topping EUR21.8 million (+11% vs. 2018) and EBITDA at EUR2.5 million (11..5% margin vs. 11.3% in 2018).
Corporate Governance
Does the company have a combined Chair/CEO? Yes
Percentage of independent directors 11.1% (1 out of 9)
Does the company have loyalty shares? No
Does major shareholders have a “shareholders pact” in place? Yes
Are “poison pill” or “change of control” clauses adopted? No
Potential dilution from stock options outstanding + not yet granted? No
CEO remuneration detail (fixed salary) Not disclosed
Chairman remuneration detail (fixed salary) Not disclosed
Is the share price included in the MBO criteria? Not disclosed
Percentage of treasury shares 0%
Climate related risk
Has the company defined GHG-emissions targets? No
How does the company assess climate-related risk? Not disclosed
Social Responsibilities
Does the company publish a separated Sustainability report? No, but the company
committed to publish it starting by FY19
Does the company have a Chief SRI/CSR officer (or a committee)? No
Does the Chief SRI/CSR officer votes in any of the committee? NA
Is the Investor Relation officer a different person from CFO (or
other officers)? No
Is the ESG strategy integrated in the Business Plan (or in the group strategy)?
Yes
Does the company have an ethical code? No
Percentage of female directors 11.1% (1 out of 9)
How is the cybersecurity issue managed? The company is fully compliant with GDPR regulation- The data protection policy is available on the website
SWOT Analysis
Strengths Weaknesses
• Innovative business model
• Fully internal design and manufacturing of production machines
• cArtù could be the new technological breakthrough in the industry
• Strong concentration in the domestic market and limited size
• Dependence on a limited number of key customers
• Limited production capacity and production constraints
Opportunities Threats
• Entering in the commodity market through cArtù and cushionPaper
• New distribution strategy based on integrated logistics approach
• Increasing environmental awareness
• Paper, cardboard and EPE price fluctuations
• Increasing competition and potential entry of large international companies
• Delays in building the new plant
2,500
3,500
4,500
5,500
Grifal FTSE Italia All-Share
G-Quattronove
; 68,4%
Mediolanum SGR; 7,3%
Free float; 24,3%
Sustainable Finance and Fintech: progress and innovation, 6 February 2020
19 Servizio Studi – Equity Research
Grifal
Income Statement Financial Ratios
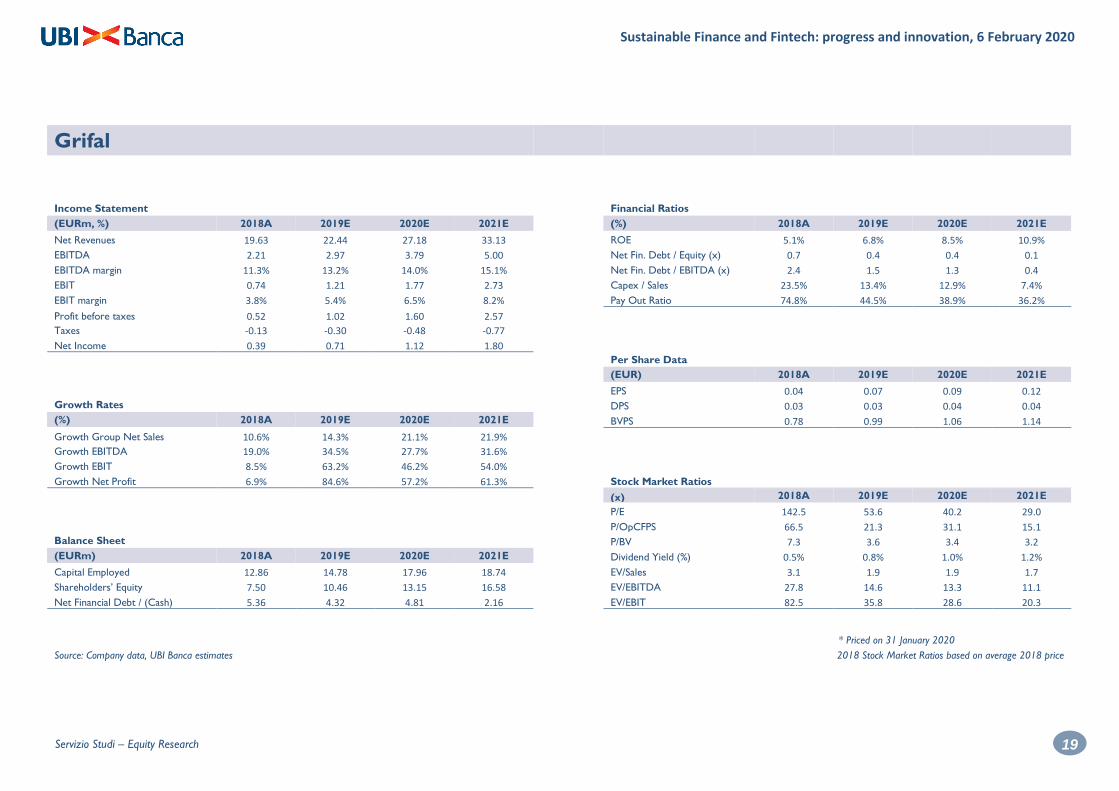
(EURm, %) 2018A 2019E 2020E 2021E (%) 2018A 2019E 2020E 2021E
Net Revenues 19.63 22.44 27.18 33.13 ROE 5.1% 6.8% 8.5% 10.9%
EBITDA 2.21 2.97 3.79 5.00 Net Fin. Debt / Equity (x) 0.7 0.4 0.4 0.1
EBITDA margin 11.3% 13.2% 14.0% 15.1% Net Fin. Debt / EBITDA (x) 2.4 1.5 1.3 0.4
EBIT 0.74 1.21 1.77 2.73 Capex / Sales 23.5% 13.4% 12.9% 7.4%
EBIT margin 3.8% 5.4% 6.5% 8.2% Pay Out Ratio 74.8% 44.5% 38.9% 36.2%
Profit before taxes 0.52 1.02 1.60 2.57
Taxes -0.13 -0.30 -0.48 -0.77
Net Income 0.39 0.71 1.12 1.80
Per Share Data
(EUR) 2018A 2019E 2020E 2021E
EPS 0.04 0.07 0.09 0.12
Growth Rates DPS 0.03 0.03 0.04 0.04
(%) 2018A 2019E 2020E 2021E BVPS 0.78 0.99 1.06 1.14
Growth Group Net Sales 10.6% 14.3% 21.1% 21.9%
Growth EBITDA 19.0% 34.5% 27.7% 31.6%
Growth EBIT 8.5% 63.2% 46.2% 54.0%
Growth Net Profit 6.9% 84.6% 57.2% 61.3% Stock Market Ratios
(x) 2018A 2019E 2020E 2021E
P/E 142.5 53.6 40.2 29.0
P/OpCFPS 66.5 21.3 31.1 15.1
Balance Sheet P/BV 7.3 3.6 3.4 3.2
(EURm) 2018A 2019E 2020E 2021E Dividend Yield (%) 0.5% 0.8% 1.0% 1.2%
Capital Employed 12.86 14.78 17.96 18.74 EV/Sales
3.1 1.9 1.9 1.7
Shareholders’ Equity 7.50 10.46 13.15 16.58 EV/EBITDA 27.8 14.6 13.3 11.1
Net Financial Debt / (Cash) 5.36 4.32 4.81 2.16 EV/EBIT 82.5 35.8 28.6 20.3
* Priced on 31 January 2020
Source: Company data, UBI Banca estimates 2018 Stock Market Ratios based on average 2018 price
Sustainable Finance and Fintech: progress and innovation, 6 February 2020
20 Servizio Studi – Equity Research
Leone Film Group 03 February 2020 – 5:30 PM TARGET PRICE: 5.80 MARKET PRICE: 4.18
Entertainment
Data
Shares outstanding (m): 14.20
Market Cap. (EURm): 59.35
Enterprise Value (EURm): 125.44
Av. Daily Trad. Vol. (000): 2.1
Reuters/Bloomberg: LFG.MI LFG IM
52-Week Range (EUR): 3.9 5.2
Source: FactSet
Performance
1m 3m 12m
Absolute -5.0% -13.6% -6.3%
Rel. to FTSE IT -3.7% -15.8% -19.6%
Graph Area Absolute/Relative 12 M
Source: FactSet
Graph Shareholders’ Structure
Source: Company data
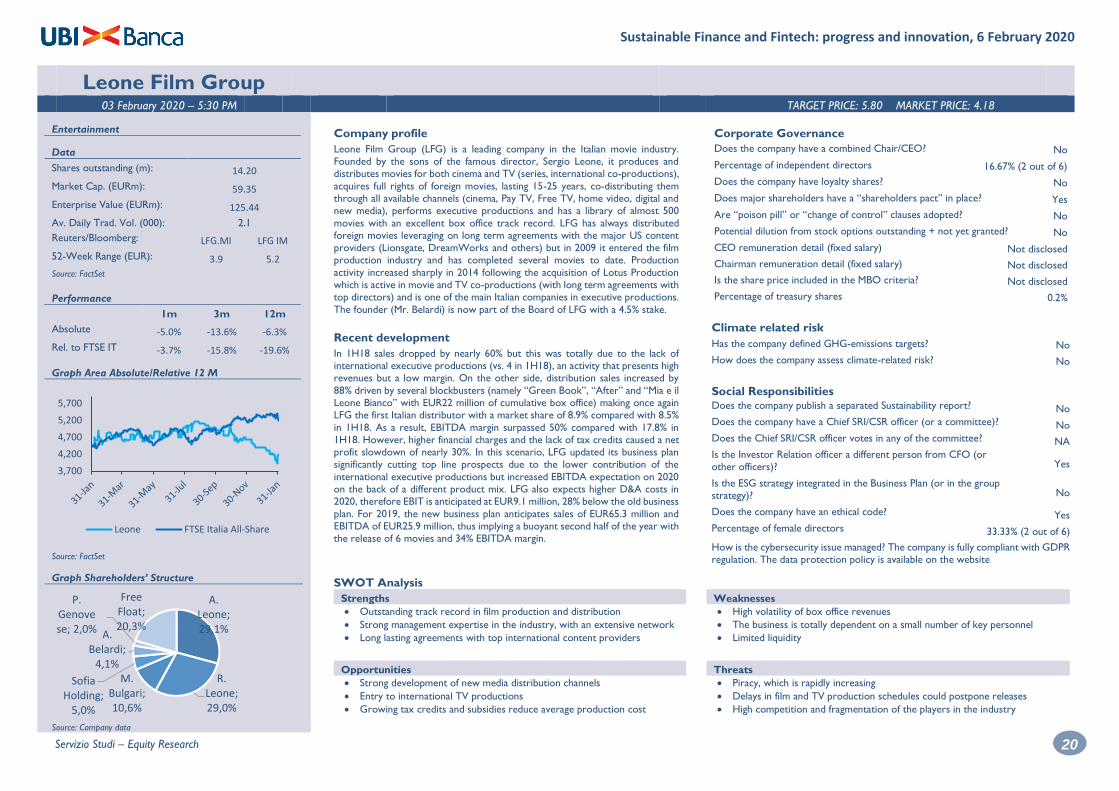
Company profile
Leone Film Group (LFG) is a leading company in the Italian movie industry. Founded by the sons of the famous director, Sergio Leone, it produces and distributes movies for both cinema and TV (series, international co-productions),
acquires full rights of foreign movies, lasting 15-25 years, co-distributing them through all available channels (cinema, Pay TV, Free TV, home video, digital and new media), performs executive productions and has a library of almost 500
movies with an excellent box office track record. LFG has always distributed foreign movies leveraging on long term agreements with the major US content
providers (Lionsgate, DreamWorks and others) but in 2009 it entered the film production industry and has completed several movies to date. Production
activity increased sharply in 2014 following the acquisition of Lotus Production which is active in movie and TV co-productions (with long term agreements with top directors) and is one of the main Italian companies in executive productions.
The founder (Mr. Belardi) is now part of the Board of LFG with a 4.5% stake.
Recent development
In 1H18 sales dropped by nearly 60% but this was totally due to the lack of international executive productions (vs. 4 in 1H18), an activity that presents high revenues but a low margin. On the other side, distribution sales increased by
88% driven by several blockbusters (namely “Green Book”, “After” and “Mia e il Leone Bianco” with EUR22 million of cumulative box office) making once again
LFG the first Italian distributor with a market share of 8.9% compared with 8.5%
in 1H18. As a result, EBITDA margin surpassed 50% compared with 17.8% in 1H18. However, higher financial charges and the lack of tax credits caused a net profit slowdown of nearly 30%. In this scenario, LFG updated its business plan significantly cutting top line prospects due to the lower contribution of the
international executive productions but increased EBITDA expectation on 2020 on the back of a different product mix. LFG also expects higher D&A costs in 2020, therefore EBIT is anticipated at EUR9.1 million, 28% below the old business
plan. For 2019, the new business plan anticipates sales of EUR65.3 million and EBITDA of EUR25.9 million, thus implying a buoyant second half of the year with the release of 6 movies and 34% EBITDA margin.
Corporate Governance
Does the company have a combined Chair/CEO? No
Percentage of independent directors 16.67% (2 out of 6)
Does the company have loyalty shares? No
Does major shareholders have a “shareholders pact” in place? Yes
Are “poison pill” or “change of control” clauses adopted? No
Potential dilution from stock options outstanding + not yet granted? No
CEO remuneration detail (fixed salary) Not disclosed
Chairman remuneration detail (fixed salary) Not disclosed
Is the share price included in the MBO criteria? Not disclosed
Percentage of treasury shares 0.2%
Climate related risk
Has the company defined GHG-emissions targets? No
How does the company assess climate-related risk? No
Social Responsibilities
Does the company publish a separated Sustainability report? No
Does the company have a Chief SRI/CSR officer (or a committee)? No
Does the Chief SRI/CSR officer votes in any of the committee? NA
Is the Investor Relation officer a different person from CFO (or other officers)?
Yes
Is the ESG strategy integrated in the Business Plan (or in the group strategy)?
No
Does the company have an ethical code? Yes
Percentage of female directors 33.33% (2 out of 6)
How is the cybersecurity issue managed? The company is fully compliant with GDPR regulation. The data protection policy is available on the website
SWOT Analysis
Strengths Weaknesses
• Outstanding track record in film production and distribution
• Strong management expertise in the industry, with an extensive network
• Long lasting agreements with top international content providers
• High volatility of box office revenues
• The business is totally dependent on a small number of key personnel
• Limited liquidity
Opportunities Threats
• Strong development of new media distribution channels
• Entry to international TV productions
• Growing tax credits and subsidies reduce average production cost
• Piracy, which is rapidly increasing
• Delays in film and TV production schedules could postpone releases
• High competition and fragmentation of the players in the industry
3,700
4,200
4,700
5,200
5,700
Leone FTSE Italia All-Share
A. Leone; 29,1%
R. Leone; 29,0%
M. Bulgari; 10,6%
Sofia Holding;
5,0%
A. Belardi;
4,1%
P. Genovese; 2,0%
Free Float; 20,3%

Sustainable Finance and Fintech: progress and innovation, 6 February 2020
21 Servizio Studi – Equity Research
Leone Film Group
Income Statement Financial Ratios
(EURm, %) 2018A 2019E 2020E 2021E (%) 2018A 2019E 2020E 2021E
Net Revenues 128.14 68.51 87.35 105.22 ROE 15.6% 10.0% 13.8% 14.0%
EBITDA 30.47 25.53 39.20 47.11 Net Fin. Debt / Equity (x) 1.1 1.2 1.2 1.1
EBITDA margin 23.8% 37.3% 44.9% 44.8% Net Fin. Debt / EBITDA (x) 1.6 2.3 1.7 1.5
EBIT 6.65 6.08 9.55 10.66 Capex / Sales 18.1% 39.4% 43.3% 38.1%
EBIT margin 5.2% 8.9% 10.9% 10.1% Pay Out Ratio 18.8% 27.1% 17.5% 15.2%
Profit before taxes 6.54 4.62 7.16 8.23
Taxes 0.25 0.09 0.14 0.16
Net Income 6.79 4.71 7.31 8.39
Per Share Data
(EUR) 2018A 2019E 2020E 2021E
EPS 0.48 0.33 0.51 0.59
Growth Rates DPS 0.09 0.09 0.09 0.09
(%) 2018A 2019E 2020E 2021E BVPS 3.07 3.31 3.73 4.24
Growth Group Net Sales 9.3% -46.5% 27.5% 20.5%
Growth EBITDA 3.6% -16.2% 53.5% 20.2%
Growth EBIT 22.7% -8.6% 57.1% 11.6%
Growth Net Profit 73.9% -30.6% 55.2% 14.8% Stock Market Ratios
(x) 2018A 2019E 2020E 2021E
P/E 10.0 12.6 8.1 7.1
P/OpCFPS 4.2 2.8 1.8 1.5
Balance Sheet P/BV 1.6 1.3 1.1 1.0
(EURm) 2018A 2019E 2020E 2021E Dividend Yield (%) 1.9% 2.2% 2.2% 2.2%
Capital Employed 93.01 105.14 118.54 128.94 EV/Sales
0.9 1.7 1.4 1.2
Shareholders’ Equity 43.57 47.00 53.03 60.14 EV/EBITDA 3.9 4.6 3.2 2.7
Net Financial Debt / (Cash) 49.42 58.14 65.51 68.80 EV/EBIT 17.7 19.4 13.1 12.1
* Priced on 31 January 2020
Source: Company data, UBI Banca estimates 2018 Stock Market Ratios based on average 2018 price

Sustainable Finance and Fintech: progress and innovation, 6 February 2020
22 Servizio Studi – Equity Research
LU-VE 03 February 2020 – 5:30 PM TARGET PRICE: 17.82 MARKET PRICE: 13.65
Heat exchangers, refrigeration
Data
Shares outstanding (m): 22.2
Market Cap. (EURm): 303.5
Enterprise Value (EURm): 462.6
Av. Daily Trad. Vol. (000): 28.1
Reuters/Bloomberg: LUVE.MI LUVE IM
52-Week Range (EUR): 10.0 14.6
Source: FactSet
Performance
1m 3m 12m
Absolute 6.6% 32.5% 36.5%
Rel. to FTSE IT 8.1% 29.3% 17.0%
Graph Area Absolute/Relative 12 M
Source: FactSet
Graph Shareholders’ Structure
Source: Company data
Company profile LU-VE is a leading producer of heat exchangers and ventilated products for non-
residential applications with revenues of EUR307 million in 2018, 16 plants (of which 7 outside Italy), 12 commercial branches abroad, and a total of 2,655 employees at Dec-18. It is also present in the niche segments of close control
and glass doors. The group, founded and still managed by Liberali family, has reported average top line growth of about 10% in the past five years and strongly expanded abroad in the past few years thanks to the acquisition of Spirotech in India, Zyklus in the US and Al Air, a true game changing-acquisition finalized in
2019 which added >EUR100 million sales. Because of its lean cost structure,
healthy operating leverage and the quality recognized by its customers, the company has maintained EBITDA margins close to 12% in the past five years. LU-
VE was listed on the AIM market following the business combination with the SPAC Industrial Star for Italy 1 in Jul-15 and moved to the MTA market segment in 2018.
Recent development
LU-VE reported a remarkable product sales growth in 2019: sales were up 29% (+38% in 4Q19), broadly in line with our forecasts. Organic growth was also
positive with an increase of 6.7% in the entire 2019 and of around 5% in 4Q19 despite the macro economic slowdown in Europe. Based on our estimates, Al Air should have reported around EUR60 million in the past eight months (this acquisition, for total consideration was EUR67.1 million corresponding to 6.5x
2018 EBITDA including an earn-out based on 2019 EBITDA, was consolidated from May 2019), implying around EUR100 million revenues in the full year, in line with LU-VE expectations. Order backlog at Dec-19 increased by 78.2% and by
13.6% organically, thus providing a positive kickoff for 2020. 1H19 was strong: EBITDA adjusted grew by >40% with 180 bps improvement in margin and all the companies acquired performed well (Spirotech was up 25%, Zyklus sales were
up 39% with EBITDA margin >15%, Al Air added EUR13.6 million of revenues in two months). In addition, all the projects underway (new plant in Poland, plant relocation in China, plant expansion in India, new plant in the US) are in line or
ahead of schedule and this should pave the way for further margins improvement in future.
Corporate Governance
Does the company have a combined Chair/CEO? No
Percentage of independent directors 15.4% (2 out of 13)
Does the company have loyalty shares? Yes
Does major shareholders have a “shareholders pact” in place? Yes
Are “poison pill” or “change of control” clauses adopted? No
Potential dilution from stock options outstanding + not yet granted? Yes
CEO remuneration detail (fixed salary) EUR0.36 million
Chairman remuneration detail (fixed salary) EUR0.25 million
Is the share price included in the MBO criteria? No
Percentage of treasury shares 0.62%
Climate related risk
Has the company defined GHG-emissions targets? No
How does the company assess climate-related risk? LU-VE minimizes the environmental impact of its production processes, implementing policies of energy efficiency, reduction of emissions, water consumption and of waste generation.
Social Responsibilities
Does the company publish a separated Sustainability report? Yes
Does the company have a Chief SRI/CSR officer (or a committee)? Not disclosed
Does the Chief SRI/CSR officer votes in any of the committee? Not disclosed
Is the Investor Relation officer a different person from CFO (or
other officers)? Yes
Is the ESG strategy integrated in the Business Plan (or in the group strategy)?
Yes
Does the company have an ethical code? Yes
Percentage of female directors 23.1% (3 out of 13)
How is the cybersecurity issue managed? Not disclosed
SWOT Analysis
Strengths Weaknesses
• Innovative products and low exposure to the Italian market
• High entry barriers
• Outstanding acquisition track record
• Net debt, after the acquisition of Ail Air, needs to be reduced
• High weight of goodwill (23% of the capital employed at Dec-18)
• Limited liquidity and free float
Opportunities Threats
• Synergies and cross selling opportunities from Al Air
• New plant in Poland should increase EBITDA margin
• Expansion in the US market thanks to Zyklus
• Raw material fluctuations (mostly copper and aluminum)
• Currency fluctuations (in particular RUB and USD)
• Integration costs of Al Air
9,00010,00011,00012,00013,00014,00015,000
LUVE FTSE Italia All-Share
Liberali family50,3%
Faggioli family17,6%
Free Float
32,2%

Sustainable Finance and Fintech: progress and innovation, 6 February 2020
23 Servizio Studi – Equity Research
LU-VE
Income Statement Financial Ratios
(EURm, %) 2018A 2019E 2020E 2021E (%) 2018A 2019E 2020E 2021E
Net Revenues 306.9 399.6 472.1 491.1 ROE 10.8% 11.8% 14.7% 13.8%
EBITDA 36.6 47.8 58.9 62.9 Net Fin. Debt / Equity (x) 0.4 0.9 0.8 0.6
EBITDA margin 11.9% 12.0% 12.5% 12.8% Net Fin. Debt / EBITDA (x) 1.7 3.1 2.4 2.0
EBIT 19.7 27.0 37.1 39.9 Capex / Sales 9.0% 6.3% 3.2% 3.1%
EBIT margin 6.4% 6.8% 7.9% 8.1% Pay Out Ratio 36.1% 34.0% 26.1% 28.9%
Profit before taxes 17.4 23.8 34.3 37.1
Taxes -1.3 -4.8 -7.9 -9.3
Net Income 15.4 18.3 25.6 26.9
Per Share Data
(EUR) 2018A 2019E 2020E 2021E
EPS 0.69 0.82 1.15 1.21
Growth Rates DPS 0.25 0.28 0.30 0.35
(%) 2018A 2019E 2020E 2021E BVPS 6.40 6.97 7.84 8.75
Growth Group Net Sales 13.6% 30.2% 18.2% 4.0%
Growth EBITDA 25.9% 30.7% 23.2% 6.7%
Growth EBIT 39.7% 37.1% 37.1% 7.7%
Growth Net Profit 173.1% 18.9% 39.6% 5.3% Stock Market Ratios
(x) 2018A 2019E 2020E 2021E
P/E 14.6 16.6 11.9 11.3
P/OpCFPS 10.7 11.8 7.2 6.3
Balance Sheet P/BV 1.6 2.0 1.7 1.6
(EURm) 2018A 2019E 2020E 2021E Dividend Yield (%) 2.5% 2.0% 2.2% 2.6%
Capital Employed 208.9 304.9 317.1 324.4 EV/Sales
8.1 9.7 7.7 7.0
Shareholders’ Equity 142.2 155.0 174.3 194.6 EV/EBITDA 15.1 17.1 12.3 11.0
Net Financial Debt / (Cash) 63.6 146.3 138.9 125.4 EV/EBIT 1.4 1.5 1.4 1.4
* Priced on 31 January 2020
Source: Company data, UBI Banca estimates 2018 Stock Market Ratios based on average 2018 price
Sustainable Finance and Fintech: progress and innovation, 6 February 2020
24 Servizio Studi – Equity Research
MailUp 03 February 2020 – 5:30 PM TARGET PRICE: 6.00 MARKET PRICE: 4.37
IT Services
Data
Shares outstanding (m): 14.97
Market Cap. (EURm): 65.4
Enterprise Value (EURm): 64.7
Av. Daily Trad. Vol. (‘000): 25.8
Reuters/Bloomberg: MAIL.MI MAIL IM
52-Week Range (EUR): 2.7 4.8
Source: FactSet
Performance
1m 3m 12m
Absolute -7,9% -3.3% 62.5%
Rel. to FTSE IT -6.3% -5.8% 45.8%
Graph Area Absolute/Relative 12 M
Source: FactSet
Graph Shareholders’ Structure
Source: Company data
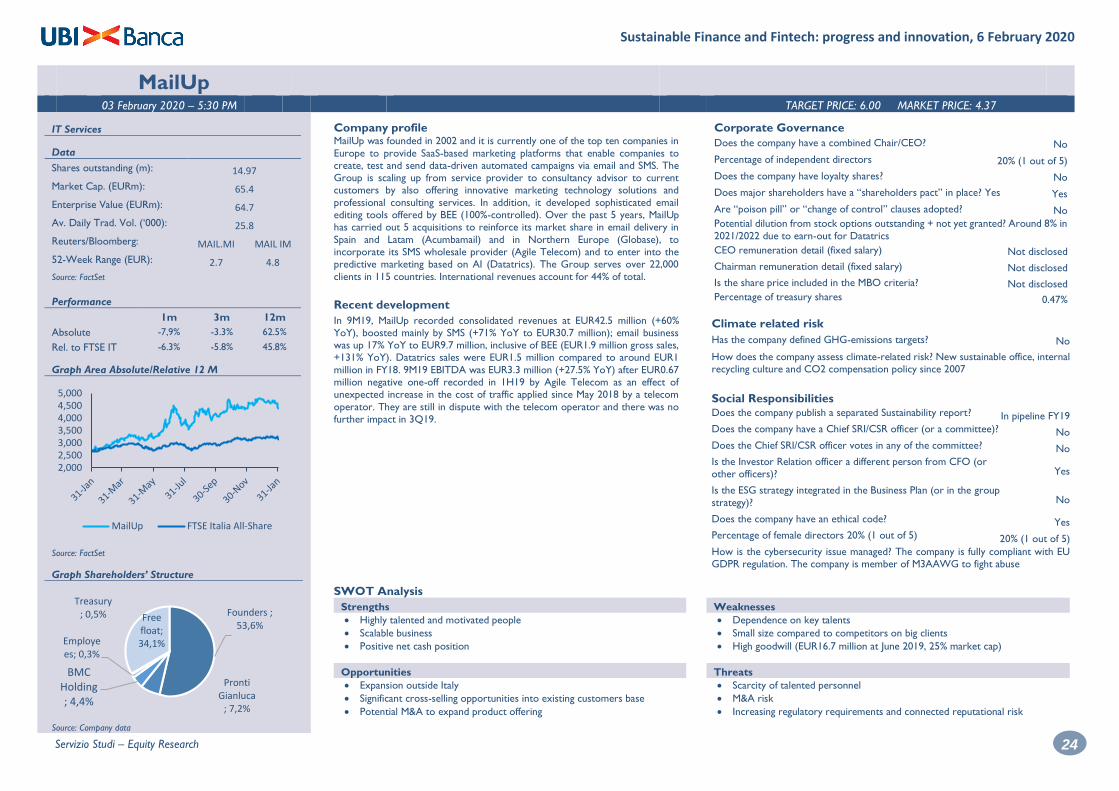
Company profile MailUp was founded in 2002 and it is currently one of the top ten companies in
Europe to provide SaaS-based marketing platforms that enable companies to create, test and send data-driven automated campaigns via email and SMS. The Group is scaling up from service provider to consultancy advisor to current customers by also offering innovative marketing technology solutions and
professional consulting services. In addition, it developed sophisticated email editing tools offered by BEE (100%-controlled). Over the past 5 years, MailUp has carried out 5 acquisitions to reinforce its market share in email delivery in
Spain and Latam (Acumbamail) and in Northern Europe (Globase), to
incorporate its SMS wholesale provider (Agile Telecom) and to enter into the predictive marketing based on AI (Datatrics). The Group serves over 22,000
clients in 115 countries. International revenues account for 44% of total.
Recent development
In 9M19, MailUp recorded consolidated revenues at EUR42.5 million (+60% YoY), boosted mainly by SMS (+71% YoY to EUR30.7 million); email business was up 17% YoY to EUR9.7 million, inclusive of BEE (EUR1.9 million gross sales, +131% YoY). Datatrics sales were EUR1.5 million compared to around EUR1
million in FY18. 9M19 EBITDA was EUR3.3 million (+27.5% YoY) after EUR0.67 million negative one-off recorded in 1H19 by Agile Telecom as an effect of unexpected increase in the cost of traffic applied since May 2018 by a telecom
operator. They are still in dispute with the telecom operator and there was no
further impact in 3Q19.
Corporate Governance
Does the company have a combined Chair/CEO? No
Percentage of independent directors 20% (1 out of 5)
Does the company have loyalty shares? No
Does major shareholders have a “shareholders pact” in place? Yes Yes
Are “poison pill” or “change of control” clauses adopted? No
Potential dilution from stock options outstanding + not yet granted? Around 8% in
2021/2022 due to earn-out for Datatrics
CEO remuneration detail (fixed salary) Not disclosed
Chairman remuneration detail (fixed salary) Not disclosed
Is the share price included in the MBO criteria? Not disclosed
Percentage of treasury shares
0.47%
Climate related risk
Has the company defined GHG-emissions targets? No
How does the company assess climate-related risk? New sustainable office, internal recycling culture and CO2 compensation policy since 2007
Social Responsibilities
Does the company publish a separated Sustainability report? In pipeline FY19
Does the company have a Chief SRI/CSR officer (or a committee)? No
Does the Chief SRI/CSR officer votes in any of the committee? No
Is the Investor Relation officer a different person from CFO (or other officers)?
Yes
Is the ESG strategy integrated in the Business Plan (or in the group
strategy)? No
Does the company have an ethical code? Yes
Percentage of female directors 20% (1 out of 5) 20% (1 out of 5)
How is the cybersecurity issue managed? The company is fully compliant with EU GDPR regulation. The company is member of M3AAWG to fight abuse
SWOT Analysis
Strengths Weaknesses
• Highly talented and motivated people
• Scalable business
• Positive net cash position
• Dependence on key talents
• Small size compared to competitors on big clients
• High goodwill (EUR16.7 million at June 2019, 25% market cap)
Opportunities Threats
• Expansion outside Italy
• Significant cross-selling opportunities into existing customers base
• Potential M&A to expand product offering
• Scarcity of talented personnel
• M&A risk
• Increasing regulatory requirements and connected reputational risk
2,0002,5003,0003,5004,0004,5005,000
MailUp FTSE Italia All-Share
Founders ; 53,6%
Pronti Gianluca
; 7,2%
BMC Holding ; 4,4%
Employees; 0,3%
Treasury; 0,5% Free
float; 34,1%

Sustainable Finance and Fintech: progress and innovation, 6 February 2020
25 Servizio Studi – Equity Research
MailUp
Income Statement Financial Ratios
(EURm, %) 2018A 2019E 2020E 2021E (%) 2018A 2019E 2020E 2021E
Net Revenues 39,0 59,9 71,3 83,1 ROE 15,6% 12,9% 18,8% 24,7%
EBITDA 3,8 4,8 7,3 9,6 Net Fin. Debt / Equity (x) -0,4 -0,1 -0,2 -0,2
EBITDA margin 9,7% 8,0% 10,2% 11,6% Net Fin. Debt / EBITDA (x) -1,7 -0,4 -0,5 -0,6
EBIT 1,9 2,4 4,5 6,4 Capex / Sales 8,5% 6,4% 6,2% 6,0%
EBIT margin 4,9% 4,0% 6,3% 7,7% Pay Out Ratio 0,0% 0,0% 0,0% 0,0%
Profit before taxes 1,9 2,4 4,5 6,4
Taxes -0,7 -1,1 -1,8 -2,3
Net Income 1,3 2,7 4,1 4,9
Per Share Data
(EUR) 2018A 2019E 2020E 2021E
EPS 0,08 0,09 0,18 0,27
Growth Rates DPS 0 0 0 0
(%) 2018A 2019E 2020E 2021E BVPS 1,07 1,15 1,34 1,61
Growth Group Net Sales 47,8% 53,5% 19,0% 16,6%
Growth EBITDA 30,0% 27,8% 50,7% 32,3%
Growth EBIT 45,9% 27,1% 85,6% 42,8%
Growth Net Profit 143,9% 103,2% 49,0% 21,8% Stock Market Ratios
(x) 2018A 2019E 2020E 2021E
P/E 27,8 48,9 24,0 16,1
P/OpCFPS 3,1 4,2 3,8 3,3
Balance Sheet P/BV 2,19 3,79 3,27 2,72
(EURm) 2018A 2019E 2020E 2021E Dividend Yield (%) 0,0% 0,0% 0,0% 0,0%
Capital Employed 9,6 15,4 16,4 18,2 EV/Sales
0,76 1,08 0,89 0,73
Shareholders’ Equity 15,9 17,3 20,0 24,0 EV/EBITDA 7,8 13,4 8,7 6,3
Net Financial Debt / (Cash) -6,4 -1,9 -3,5 -5,9 EV/EBIT 15,6 26,9 14,1 9,5
* Priced on 31 January 2020
Source: Company data, UBI Banca estimates 2018 Stock Market Ratios based on average 2018 price
Sustainable Finance and Fintech: progress and innovation, 6 February 2020
26 Servizio Studi – Equity Research
NB Aurora 03 February 2020 – 5:30 PM TARGET PRICE: 11.70 MARKET PRICE: 10.58
Financial Holding
Data
Shares outstanding (m): 15.0
Market Cap. (EURm): 158.7
Enterprise Value (EURm): 87
Av. Daily Trad. Vol. (‘000): 6.0
Reuters/Bloomberg: NBA.MI NBA IM
52-Week Range (EUR): 9.24 11.96
Source: FactSet
Performance
1m 3m 12m
Absolute 0.0% 0.0% 26.6%
Rel. to FTSE IT 1.5% -1.2% 11.6%
Graph Area Absolute/Relative 12 M
Source: FactSet
Graph Shareholders’ Structure
Source: Company data
Company profile
NB Aurora is the first permanent-capital fund listed on the Italian stock market (in the MIV segment). NB Aurora targets double digit return through minority equity investments in a portfolio of small and medium sized unlisted Italian
companies. Listed on 4 May 2018 (raising EUR151.5 million), on 25 May 2018 NB Aurora completed the acquisition of 44.55% of the unit of Fondo Italiano d’Investimento for a total consideration of EUR75.4 million (excluding
transaction costs). Out of 15 companies, 9 have been already sold for a total cash-in worth almost twice of the original investment (EUR126 million).
NB Aurora has a team of 10 fully dedicated professionals with long experience in investing together (circa 10 years).
To their credit they can leverage on the NB Private Equity platform, one of the most extensive platforms in Italy. The team track record calls for: a) a MOIC
(Multiple On Invested Capital) of 2,2x which goes to 2,0x including write-offs; b) a 17.5% gross IRR that goes to 15.8% including write-offs.
Recent development In December 2019, NB Aurora announced it has signed a binding co-investment agreement together with Eddy De Vita (a manager and entrepreneur very well known in the sector) for the acquisition, through a NewCo, of the majority stake
in Pharma Healthcare Supply Chain Expertise (PHSE). The three founding
partners will reinvest in the company by acquiring 30%, NB Aurora will invest EUR16 million and will hold 30.8% of Newco.
In September 2019, NB Aurora announced a co-investment with NB Renaissance Partners in Rino Mastrotto Group, a world leader in the production and sale of leather for the fashion, automotive and furniture sectors generating about 60% of its turnover abroad.
Corporate Governance
Does the company have a combined Chair/CEO? No
Percentage of independent directors 60% (3 out of 5)
Does the company have loyalty shares? No
Does major shareholders have a “shareholders pact” in place? No
Are “poison pill” or “change of control” clauses adopted? No
Potential dilution from stock options outstanding + not yet granted? No
CEO remuneration detail (fixed salary) Not disclosed
Chairman remuneration detail (fixed salary) EUR20k
Is the share price included in the MBO criteria? No
Percentage of treasury shares 0%
Climate related risk
Has the company defined GHG-emissions targets? No
How does the company assess climate-related risk? Not disclosed
Social Responsibilities
Does the company publish a separated Sustainability report? No
Does the company have a Chief SRI/CSR officer (or a committee)? No
Does the Chief SRI/CSR officer votes in any of the committee? No
Is the Investor Relation officer a different person from CFO (or
other officers)? No
Is the ESG strategy integrated in the Business Plan (or in the group strategy)?
Yes
Does the company have an ethical code? The company follows the Code of Conduct of Borsaitaliana Percentage of female directors 20% (1 out of 5)
How is the cybersecurity issue managed? Not disclosed
SWOT Analysis
Strengths Weaknesses
• Experienced management team with proven track record;
• Unique selling proposition positioning: invest in minority stakes of private
companies through a listed vehicle (NB Aurora itself);
• FuM growth could come only through capital increases;
• Market down cycle (i.e. when it is not convenient to exit from investments)
could reduce or even zero the capital gains pot for dividend distribution;
Opportunities Threats
• Increase the FuM would not change the structure costs proportionally thus decreasing their relative weight on the NAV;
• Potentially NB Aurora could manage third-party assets thus receiving
management/performance fees itself;
• Visibility to outside investors of some of the smaller portfolio companies may be low, thus increasing the discount to NAV;
• NB Aurora has a short track record, as a company, in investing and its ability
to deploy cash could impact the NAV discount.
8,0
9,0
10,0
11,0
12,0
NB Aurora FTSE Italia All Shares
Neuberger Berman;
4,00%
Free float;
96,00%

Sustainable Finance and Fintech: progress and innovation, 6 February 2020
27 Servizio Studi – Equity Research
NB Aurora
Income Statement Financial Ratios
(EURm, %) 2018A 2019E 2020E 2021E (%) 2018A 2019E 2020E 2021E
Realised/change in unre. Cap. gains 60,3 39,5 14,3 15,3 ROE 26,6% 16,2% 5,0% 5,6%
Interest Income 0,0 0,0 0,0 0,0 Net Fin. Debt / Equity (x) -0,51 -0,50 -0,35 -0,20
Total investment income 60,3 39,5 14,4 15,3 ROI 53,9% 32,4% 7,7% 7,0%
Total expenses 7,6 5,0 4,1 4,1 Cost/Income 12,6% 12,5% 28,5% 26,7%
Total income for the period 52,7 34,6 10,3 11,2
Other items 0,0 0,0 0,0 0,0
Total compr. income for the period 52,6 34,6 10,3 11,2
Per Share Data
(EUR) 2018A 2019E 2020E 2021E
EPS 3,47 2,28 0,68 0,74
DPS 1,06 1,06 0,85 0,30
BVPS 13,07 14,11 13,54 13,27
Balance Sheet Stock Market Ratios
(EURm) 2018A 2019E 2020E 2021E (x) 2018A 2019E 2020E 2021E
Capital Employed 97,7 106,7 133,8 161,5 P/E 3,0 4,6 15,6 14,3
Shareholders’ Equity 198,0 213,7 205,1 201,1 P/BV 0,81 0,75 0,78 0,80
Net Financial Debt / (Cash) -100,3 -107,1 -71,3 -39,6 Dividend Yield 10,0% 10,0% 8,1% 2,9%
ROI 53,9% 32,4% 7,7% 7,0%
ROE 26,6% 16,2% 5,0% 5,6%
Debt/Equity -0,51 -0,50 -0,35 -0,20
* Priced on 31 January 2020
Source: Company data, UBI Banca estimates 2018 Stock Market Ratios based on average 2018 price

Sustainable Finance and Fintech: progress and innovation, 6 February 2020
28 Servizio Studi – Equity Research
NEXI 03 February 2020 – 5:30 PM TARGET PRICE: 13.70 MARKET PRICE: 12.80
Financial Tech - Payments
Data
Shares outstanding (m): 627.8
Market Cap. (EURm): 8,036
Enterprise Value (EURm): 10,285
Av. Daily Trad. Vol. (‘000): 3,100
Reuters/Bloomberg: NEXI.MI NEXI IM
52-Week Range (EUR): 7.83 13.6
Source: FactSet
Performance
1m 3m 12m
Absolute 3.4% 38.1% -
Rel. to FTSE IT 4.7% 35.5% -
Graph Area Absolute/Relative 12 M
Source: FactSet
Graph Shareholders’ Structure
Source: Company data
Company profile With 70% market share in merchant acquiring, 60% in cards issuing and circa 150
partner banks (2018 data), Nexi is the leader in the Italian electronic payments
market, where card penetration of 26% is half the WE average. The company
operates through three divisions:
➢ Merchants Services & Solutions (48% of 2018 pro-forma revenues including
other services like HelpLine): provider of electronic payments solutions to
merchants;
➢ Cards & Digital Payments (39% of 2018 pro-forma revenues): consumer
cards, commercial cards, mobile payments and payment apps;
➢ Digital Banking Solutions (13% of pro-forma revenues): advance banking
solutions, open banking and other services.
Recent development
In December 2019, Nexi announced a reinforcement of the long-term partnership with Intesa SanPaolo “sealed” also through the acquisition of Intesa’s
merchant acquiring business and by the contextual purchase by the Italian bank of a 9.9% stake in Nexi (from Mercury UK, Nexi’s major shareholder). Nexi is buying Intesa merchant acquiring business for a total consideration of EUR1
billion plus a potential earn-out payable in 2025 (which is based on the overperformance of the merchant portfolio vs. the plan while aligning Nexi and
ISP interests). The two companies signed a marketing & distribution agreement until 2044 whereby Intesa will promote and distribute the products/solutions
developed by Nexi.
Nexi reported a solid set of 3Q19 results showing top line growth, EBITDA margin expansion (thanks to operating leverage and cost management) and positive cash generation. Management is continuing to execute on what
“promised” at the IPO and this is extremely important for a stock new to the market.
Corporate Governance
Does the company have a combined Chair/CEO? No
Percentage of independent directors 23.1% (3 out of 13)
Does the company have loyalty shares? No
Does major shareholders have a “shareholders pact” in place? Yes
Are “poison pill” or “change of control” clauses adopted? No
Potential dilution from stock options outstanding + not yet granted? Yes
CEO remuneration detail (fixed salary) EUR1.2 million
Chairman remuneration detail (fixed salary) EUR0.5 million
Is the share price included in the MBO criteria? Yes
Percentage of treasury shares 0%
Climate related risk
Has the company defined GHG-emissions targets? No
How does the company assess climate-related risk? Sustainability Report
Social Responsibilities
Does the company publish a separated Sustainability report? Yes
Does the company have a Chief SRI/CSR officer (or a committee)? Yes
Does the Chief SRI/CSR officer votes in any of the committee? Yes
Is the Investor Relation officer a different person from CFO (or
other officers)? Yes
Is the ESG strategy integrated in the Business Plan (or in the group strategy)?
No
Does the company have an ethical code? Yes
Percentage of female directors 30.8% (4 out of 13)
How is the cybersecurity issue managed? Compliance with GDPR regulation and
internal system for information security management
SWOT Analysis
Strengths Weaknesses
• Market leader in Italy, in a business where scale matters, offering full
coverage of the payment system value-chain;
• High entry barriers: much more entrenched than anyone in the Italian eco-system both at the banking and merchant level;
• Large and diversified customer base with around 150 partner banks;
• Lack of international presence;
• Low exposure to e-commerce;
• Limited direct exposure to retail customers (merchants and card holders);
Opportunities Threats
• The Italian government plans to increase the share of digital payments;
• Nexi has its app (YAP) to attract millennials to the payment market;
• Penetration of card payments could grow at a slower pace than predicted;
• In case of systemic risks, electronic payments value may decline;
• 57% of millennials do not have a bank account. In the long run, this could be a threat for the banking system and ultimately for Nexi;
6,00
8,00
10,00
12,00
14,00
Ap
r-1
9
May
-19
Jun
-19
Jul-
19
Au
g-1
9
Sep
-19
Oct
-19
No
v-1
9
Dec
-19
Jan
-20
Nexi S.p.A. FTSE Italia All-Share
Mercury; 52,40%
GIC PTE; 3,20%
Free float; 44,40%

Sustainable Finance and Fintech: progress and innovation, 6 February 2020
29 Servizio Studi – Equity Research
NEXI
Income Statement Financial Ratios
(EURm, %) 2018PF 2019E 2020E 2021E (%) 2018PF 2019E 2020E 2021E
Net Revenues 931 982 1157 1227 ROE 3,5% 8,0% 15,8% 15,6%
EBITDA 424 505 669 744 Net Fin. Debt / Equity (x) 4,2 1,1 1,4 1,0
EBITDA margin 45,6% 51,4% 57,9% 60,7% Net Fin. Debt / EBITDA (x) 5,7 3,0 3,4 2,6
EBIT 349 390 519 569 Capex / Sales 16,1% 16,6% 13,1% 12,3%
EBIT margin 37,5% 39,7% 44,9% 46,4% Pay Out Ratio 0% 0% 0% 0%
Profit before taxes 70 168 375 440
Taxes (49) (61) (126) (147)
Net Income 20 107 249 293
Per Share Data
(EUR) 2018PF 2019E 2020E 2021E
EPS 0,03 0,17 0,40 0,47
Growth Rates DPS 0,0 0,0 0,0 0,0
(%) 2018PF 2019E 2020E 2021E BVPS 0,92 2,12 2,52 2,98
Growth Group Net Sales 7,4% 5,6% 17,7% 6,1%
Growth EBITDA 14,9% 19,1% 32,5% 11,1%
Growth EBIT n.a. 11,8% 33,1% 9,5%
Growth Net Profit n.a. 438,0% 132,9% 17,3% Stock Market Ratios
(x) 2018PF 2019E 2020E 2021E
P/E n.a. 55,8 32,2 27,5
P/OpCFPS n.a. 18,53 16,2 14,0
Balance Sheet P/BV n.a. 4,5 5,1 4,3
(EURm) 2018PF 2019E 2020E 2021E Dividend Yield (%) n.a. 0,0% 0,0% 0,0%
Capital Employed 2994 2848 3830 3786 EV/Sales
n.a. 7,6 8,9 8,1
Shareholders’ Equity 576 1331 1580 1873 EV/EBITDA n.a. 14,8 15,4 13,4
Net Financial Debt / (Cash) 2418 1517 2250 1913 EV/EBIT n.a. 19,2 19,8 17,5
* Priced on 31 January 2020
Source: Company data, UBI Banca estimates 2018 Stock Market Ratios based on average 2018 price

Sustainable Finance and Fintech: progress and innovation, 6 February 2020
30 Servizio Studi – Equity Research
Notorious Pictures 03 February 2020 – 5:30 PM TARGET PRICE: 4.54 MARKET PRICE: XX.XX
Entertainment
Data
Shares outstanding (m): 22.5
Market Cap. (EURm): 53.8
Enterprise Value (EURm): 56.8
Av. Daily Trad. Vol. (000): 14.3
Reuters/Bloomberg: NPI.MI NPI IM
52-Week Range (EUR): 2.4 3.3
Source: FactSet
Performance
1m 3m 12m
Absolute -3.6% -5.2% -27.1%
Rel. to FTSE IT -2.4% -7.5% -37.5%
Graph Area Absolute/Relative 12 M
Source: FactSet
Graph Shareholders’ Structure
Source: Company data
Company profile Notorious Pictures is a leading company in the Italian movie industry: it produces and distributes movies for both cinema and TV, acquires full rights of foreign
movies, lasting 15-25 years, distributing them through all available channels (cinema, Pay TV, Free TV, home video, digital and new media), and has a library of almost 600 movies with an excellent box office track record and the control
over the entire value chain (thanks to its partnership with UCI Cinemas and The Space and its agent network). Led by Mr. Marchetti, who controls 82% of the company and has more than 20 years of experience in the industry, in 2015
Notorious Pictures entered in the international production and co-production
business (low EBITDA margin, but absence of risk and relevant tax credit), and in 2016 started the executive production activity. The company also entered the multiplex business in 2019 targeting to manage 20 multiplexes in 5 years (two
multiplexes opened up to date) reaching around 5 million of admission and is now looking at TV series production and has already closed contracts with digital media broadcaster, anticipating the evolution of the industry in the near future.
Notorious Pictures was listed in the AIM Italia market in June 2014.
Recent development
1H19 was characterized by a sharp growth of theatrical and pay TV sales (+28% and +50% respectively) driven by the releases of several blockbusters (>EUR11.4 million box office receipts or +20% vs. 1H18), but also from a declining EBITDA
margin (29.6% vs. 37.3% in 1H18) caused by a different sales mix (EUR5.5 million
for the distribution of library owned by third parties, a low-margin business, and EUR6.5 million of work in progress which will record earnings in the last part of the year) and higher labor cost, due to variable costs associated with the
production activity. EBIT, up 12%, benefitted from lower D&A costs but net result was impacted by a higher tax rate due to the lack of tax credits which, although certain, will be recorded in the second half. Net cash (EUR3.4 million
at Dec-18) turned into EUR5.2 million of net debt due to the impact of the first time adoption of IFRS 16. 2019 closed with a box office of EUR17.0 million, an increase of 20% vs. 2018 and well above the growth of the movie industry in Italy
(+14.3%). Also the first year in the multiplex business was positive: sales increased by 47% compared to 2018.
Corporate Governance
Does the company have a combined Chair/CEO? Yes
Percentage of independent directors 20% (1 out of 5)
Does the company have loyalty shares? No
Does major shareholders have a “shareholders pact” in place? No
Are “poison pill” or “change of control” clauses adopted? No
Potential dilution from stock options outstanding + not yet granted? No
CEO remuneration detail (fixed salary) EUR14k
Chairman remuneration detail (fixed salary) Combined Chair/CEO
Is the share price included in the MBO criteria? Not disclosed
Percentage of treasury shares 2.45%
Climate related risk
Has the company defined GHG-emissions targets? No
How does the company assess climate-related risk? Not disclosed
Social Responsibilities
Does the company publish a separated Sustainability report? No
Does the company have a Chief SRI/CSR officer (or a committee)? No
Does the Chief SRI/CSR officer votes in any of the committee? No
Is the Investor Relation officer a different person from CFO (or other officers)?
No
Is the ESG strategy integrated in the Business Plan (or in the group strategy)?
No
Does the company have an ethical code? Yes
Percentage of female directors 0%
How is the cybersecurity issue managed? Not disclosed
SWOT Analysis
Strengths Weaknesses
• Positive track record in film distribution and wide library
• Long-term experience of the management in the movie industry
• Sizable net cash to grab investment opportunities
• High volatility of box office revenues
• The business is dependent on a small number of key personnel
• The company was not able to finalize any acquisition since its listing
Opportunities Threats
• Entrance in the TV series production business
• Long-term agreements with new digital media players
• Development of the multiplex business
• Increasing piracy due to the digitalization process
• Sudden and unexpected film postponement
• Progressive reduction of independent distributors in Italy
2,500
3,000
3,500
Notorious Pictures S.p.A.
FTSE Italia All-Share
Treasury shares
Free Float
17,0%

Sustainable Finance and Fintech: progress and innovation, 6 February 2020
31 Servizio Studi – Equity Research
Notorious Pictures
Income Statement Financial Ratios
(EURm, %) 2018A 2019E 2020E 2021E (%) 2018A 2019E 2020E 2021E
Net Revenues 31.5 41.7 51.0 60.6 ROE 17.6% 23.2% 20.9% 22.1%
EBITDA 11.1 15.2 15.4 18.3 Net Fin. Debt / Equity (x) -0.1 0.1 0.2 0.2
EBITDA margin 35.3% 36.5% 30.1% 30.1% Net Fin. Debt / EBITDA (x) -0.3 0.2 0.4 0.4
EBIT 4.1 8.1 8.5 10.7 Capex / Sales 23.7% 30.0% 25.0% 22.3%
EBIT margin 13.2% 19.5% 16.6% 17.7% Pay Out Ratio 44.4% 30.9% 32.4% 30.8%
Profit before taxes 4.1 8.0 8.5 10.7
Taxes 0.0 -1.4 -1.5 -1.9
Net Income 4.2 6.5 6.9 8.8
Per Share Data
(EUR) 2018A 2019E 2020E 2021E
EPS 0.18 0.29 0.31 0.39
Growth Rates DPS 0.08 0.09 0.10 0.12
(%) 2018A 2019E 2020E 2021E BVPS 1.05 1.26 1.48 1.77
Growth Group Net Sales 73.9% 32.2% 22.4% 18.7%
Growth EBITDA 84.9% 36.8% 1.0% 18.8%
Growth EBIT 119.0% 96.2% 4.2% 26.4%
Growth Net Profit 181.4% 57.7% 5.9% 26.5% Stock Market Ratios
(x) 2018A 2019E 2020E 2021E
P/E 11.0 8.2 7.7 6.1
P/OpCFPS 5.7 5.8 4.7 3.8
Balance Sheet P/BV 1.9 1.9 1.6 1.4
(EURm) 2018A 2019E 2020E 2021E Dividend Yield (%) 4.0% 3.8% 4.2% 5.0%
Capital Employed 20.1 31.0 39.2 47.3 EV/Sales
1.4 1.4 1.2 1.0
Shareholders’ Equity 23.6 28.3 33.2 39.7 EV/EBITDA 3.8 3.7 3.9 3.4
Net Financial Debt / (Cash) -3.4 2.7 6.0 7.6 EV/EBIT 10.3 7.0 7.1 5.8
* Priced on 31 January 2020
Source: Company data, UBI Banca estimates 2018 Stock Market Ratios based on average 2018 price

Sustainable Finance and Fintech: progress and innovation, 6 February 2020
32 Servizio Studi – Equity Research
Piaggio 03 February 2020 – 5:30 PM TARGET PRICE: 3.20 MARKET PRICE: 2.47
Automotive
Data
Shares outstanding (m): 357.4
Market Cap. (EURm): 899
Enterprise Value (EURm): 1,282
Av. Daily Trad. Vol. (‘000): 717.2
Reuters/Bloomberg: PIA.MI PIA IM
52-Week Range (EUR): 1.89 3.16
Source: FactSet
Performance
1m 3m 12m
Absolute -10.3% -12.6% 23.1%
Rel. to FTSE IT -9.0% -15.1% 6.4%
Graph Area Absolute/Relative 12 M
Source: FactSet
Graph Shareholders’ Structure
Source: Company data
Company profile Established in 1884, the Piaggio Group is Europe’s largest scooter and motorcycle manufacturer and one of the world leaders in its sector. Today the Piaggio Group has three separate business arms: two-wheelers, light commercial vehicles and the robotics division with Piaggio Fast Forward, the Group mobility
of the future research center in Boston. In 2018, the Piaggio Group sold 603,600 vehicles worldwide, an increase of 9.2% from 552,800 in 2017. In the two-wheeler sector, Piaggio sold 393,100 vehicles
worldwide. In Europe it has a share of 25.3%. It also retained a strong presence on the North American scooter market, where its share reached 23.9% In the
commercial vehicles sector, the Group sold 210,500 vehicles. On the Indian
market for commercial vehicles, the PVPL subsidiary had an overall market share of 23.3% in three-wheelers and confirmed its leadership in the Cargo segment with a share of 44.9%.
Recent development November & December data for the Indian market (28% of group revenues in 2019E): 3 Wheelers figures were better than expected, 2 wheelers were worst than expected but, taking into account the relative size of the two businesses, the news is positive: For 3/4 wheelers Piaggio posted a +7.4% better than the -
0.2% we are estimating in 4Q19 and the “mid single-digit decline” to which the company guided during the 3Q19 conf call. For 2 wheelers the market was weak (-17.4% YoY) and Piaggio gained market share but, despite that, the sell-in
resulted in a -2.9% while we estimate for 4Q19 a +1.9%. Piaggio reported a set of 3Q19 results in line with our and consensus estimates with an excellent cash flow generation (with the surprise to our estimates being
mostly attributable to working capital). Group revenues grew (+5.3% YoY) despite a decline in units sales thus showing a sizeable price/mix/forex growth. The decline in units sales in Europe was against a solid end-market performance
and driven by destocking.
Corporate Governance
Does the company have a combined Chair/CEO? Yes
Percentage of independent directors 55.6% (5 out of 9)
Does the company have loyalty shares? No
Does major shareholders have a “shareholders pact” in place? No
Are “poison pill” or “change of control” clauses adopted? No
Potential dilution from stock options outstanding + not yet granted? No
CEO remuneration detail (fixed salary) EUR1.29 million
Chairman remuneration detail (fixed salary) Combined Chair/CEO
Is the share price included in the MBO criteria? Not disclosed
Percentage of treasury shares 0.25%
Climate related risk
Has the company defined GHG-emissions targets? No
How does the company assess climate-related risk? Carefully defining the product planning process and the technological manufacturing cycle, and by using the best
technologies and the most modern production methods
Social Responsibilities
Does the company publish a separated Sustainability report? Yes
Does the company have a Chief SRI/CSR officer (or a committee)? Yes
Does the Chief SRI/CSR officer votes in any of the committee? No
Is the Investor Relation officer a different person from CFO (or other officers)?
Yes
Is the ESG strategy integrated in the Business Plan (or in the group
strategy)? Yes
Does the company have an ethical code? Yes
Percentage of female directors 33.3% (3 out of 9)
How is the cybersecurity issue managed? Compliance with GDPR regulation
SWOT Analysis
Strengths Weaknesses
• One of the major worldwide player in the 2 wheelers sector with strong foothold in the European market;
• A major player in the Indian 3/4 wheelers market;
• An unparalleled portfolio of brands;
• Some of its competitors (Yamaha, Honda mostly) can boast massive sizes on which leverage product/technology/distribution investments;
• The company is quite levered, when compared to its peer group;
• The business is somewhat impacted by weather conditions.
Opportunities Threats
• An under-utilized production base (in Europe) with operating leverage;
• The (organized) entrance in markets like Latam, Africa and Middle East may provide opportunities not yet visible;
• Broader technological developments (electric, gas-powered 3-4 wheelers) work in favor of industry leaders like Piaggio.
• Millennials less inclined to 2 wheelers when compared to older generations;
• Past down-cycles have shown that 2 wheelers, although important, are not essential to people’s transportation needs;
• Future mobility operators may adopt the user-ship model rather than the ownership.
1,800
2,300
2,800
3,300
Piaggio & C. S.p.a. FTSE Italia All-Share
Diego Della Valle; 5,50%
Omniaholding; 53,60%
Free float; 40,90%

Sustainable Finance and Fintech: progress and innovation, 6 February 2020
33 Servizio Studi – Equity Research
Piaggio
Income Statement Financial Ratios
(EURm, %) 2018A 2019E 2020E 2021E (%) 2018A 2019E 2020E 2021E
Net Revenues 1.390 1.519 1.629 1.742 ROE 9,0% 12,6% 14,5% 17,0%
EBITDA 202 229 247 274 Net Fin. Debt / Equity (x) 1,1 1,1 0,9 0,7
EBITDA margin 14,5% 15,1% 15,2% 15,7% Net Fin. Debt / EBITDA (x) 2,1 1,9 1,6 1,3
EBIT 93 112 127 153 Capex / Sales 8,0% 8,4% 7,4% 6,6%
EBIT margin 6,7% 7,4% 7,8% 8,8% Pay Out Ratio 89,4% 69,5% 61,1% 51,2%
Profit before taxes 68 88 106 132
Taxes -32 -38 -44 -53
Net Income 36 50 62 79
Per Share Data
(EUR) 2018A 2019E 2020E 2021E
EPS 0,10 0,14 0,17 0,22
Growth Rates DPS 0,09 0,10 0,10 0,11
(%) 2018A 2019E 2020E 2021E BVPS 1,12 1,11 1,18 1,30
Growth Group Net Sales 3,5% 9,3% 7,2% 6,9%
Growth EBITDA 4,9% 13,7% 7,8% 10,8%
Growth EBIT 28,3% 20,7% 13,8% 19,7%
Growth Net Profit 80,5% 38,9% 22,7% 28,9% Stock Market Ratios
(x) 2018A 2019E 2020E 2021E
P/E 20,9 17,9 14,4 11,2
P/OpCFPS 4,8 4,2 4,8 4,4
Balance Sheet P/BV 1,9 2,3 2,1 1,9
(EURm) 2018A 2019E 2020E 2021E Dividend Yield (%) 4,3% 3,9% 4,3% 4,6%
Capital Employed 829 823 821 813 EV/Sales
0,9 0,9 0,8 0,7
Shareholders’ Equity 400 398 424 466 EV/EBITDA 5,9 5,8 5,2 4,5
Net Financial Debt / (Cash) 429 425 397 347 EV/EBIT 12,8 11,8 10,1 8,1
* Priced on 31 January 2020
Source: Company data, UBI Banca estimates 2018 Stock Market Ratios based on average 2018 price

Sustainable Finance and Fintech: progress and innovation, 6 February 2020
34 Servizio Studi – Equity Research
Reply 03 February 2020 – 5:30 PM TARGET PRICE: 71.3 MARKET PRICE:70.85
IT Services
Data
Shares outstanding (m): 37.41
Market Cap. (EURm): 2,650.5
Enterprise Value (EURm): 2,627.6
Av. Daily Trad. Vol. (m): 43.37
Reuters/Bloomberg: REY.MI REY IM
52-Week Range (EUR): 47.5 77.5
Source: FactSet
Performance
1m 3m 12m
Absolute 2,0% 21.3% 46.4% 78.4%
Rel. to FTSE IT 3.3% 18.8% 29.8% 56.6%
Graph Area Absolute/Relative 12 M
Source: FactSet
Graph Shareholders’ Structure
Source: Company data
Company profile Reply is one of the largest IT services and software providers in Italy and has a recognized operational excellence also in Germany and the UK in the most
attractive and healthiest IT market segments: big data, IoT, cloud, cybersecurity, AI and blockchain. The Group is a network of 130 highly specialized companies, which support leading industrial groups at the forefront of all major innovation
trends by offering premium services. Since its foundation in 1996, Reply has been delivering outstanding double-digit revenues growth (>21% CAGR 2000-2018) coupled with high margins (>14% on average at EBITDA level) thanks to both
organic growth and an aggressive M&A campaign: since 2006 Reply has acquired
23 companies cumulating into EUR265 million revenues and it has never paid double-digit EBIT multiples. Italy generates >60% of total revenues, Germany ca. 20% and UK 10%; US is below 5%. The Group had over 8,000 employees across
12 countries.
Recent development
9M19 closed with revenues at EUR866 million (+14.8% YoY reported, +10.2% organic), EBIT at EUR109 million (+19% YoY) and pre-tax profit at EUR108
million (+12%). In 3Q19 the organic growth in region 1 (mainly Italy) slightly declined but remained >10% (+10.5% compared to +12% in 1Q and +12.6% in 2Q), region 2 (mainly Germany) remained the greatest contributor to growth
(+36% reported, +25% organic vs +15% organic growth in 2Q and +12% in 1Q)
and UK performance improved QoQ both on revenues (EUR29.8 million vs EUR27 million in both 2Q and 3Q) and EBITDA (EUR6.2 million reported,
EUR3.5 million ex one-off vs EUR2 million in previous quarters). The net cash position was EUR53 million.
Corporate Governance
Does the company have a combined Chair/CEO? No
Percentage of independent directors 33%
Does the company have loyalty shares? Yes
Does major shareholders have a “shareholders pact” in place? Yes
Are “poison pill” or “change of control” clauses adopted? No
Potential dilution from stock options outstanding + not yet granted? No
CEO remuneration detail (fixed salary) EUR0.73m EUR0.73 million
Chairman remuneration detail (fixed salary) EUR0.6m EUR0.6 million
Is the share price included in the MBO criteria? No No
Percentage of treasury shares 0.01% 0.01%
Climate related risk
Has the company defined GHG-emissions targets? No
How does the company assess climate-related risk? No
Social Responsibilities
Does the company publish a separated Sustainability report? Yes
Does the company have a Chief SRI/CSR officer (or a committee)? No
Does the Chief SRI/CSR officer votes in any of the committee? No
Is the Investor Relation officer a different person from CFO (or other officers)?
Yes
Is the ESG strategy integrated in the Business Plan (or in the group strategy)?
No
Does the company have an ethical code? Yes
Percentage of female directors 33%
How is the cybersecurity issue managed? The Group wrote the “ICT security incident management policy” in 2018, which has been in force since January 2019 and which identifies 3 phases (identification, response and lessons learned) and the
roles and responsibilities for every phase.
SWOT Analysis
Strengths Weaknesses
• Leading Italian consulting IT company
• Solid client base: Tier-1 companies in different industries and countries
• Excellent M&A track record
• Low market share in Germany and the UK
• Low exposure to the US
• Margins already optimized
Opportunities Threats
• Potential expansion in the US market
• Expansion in EU to reinforce Germany and UK or break into France
• Expansion into partner ecosystem
• Difficulty hiring of talented personnel
• Increasing competitions
• M&A execution risk
45,000
55,000
65,000
75,000
85,000
Reply FTSE Italia All-Share
Alika; 45,1%
Founders ex Alika; 4,1%
Free float; 50,8%
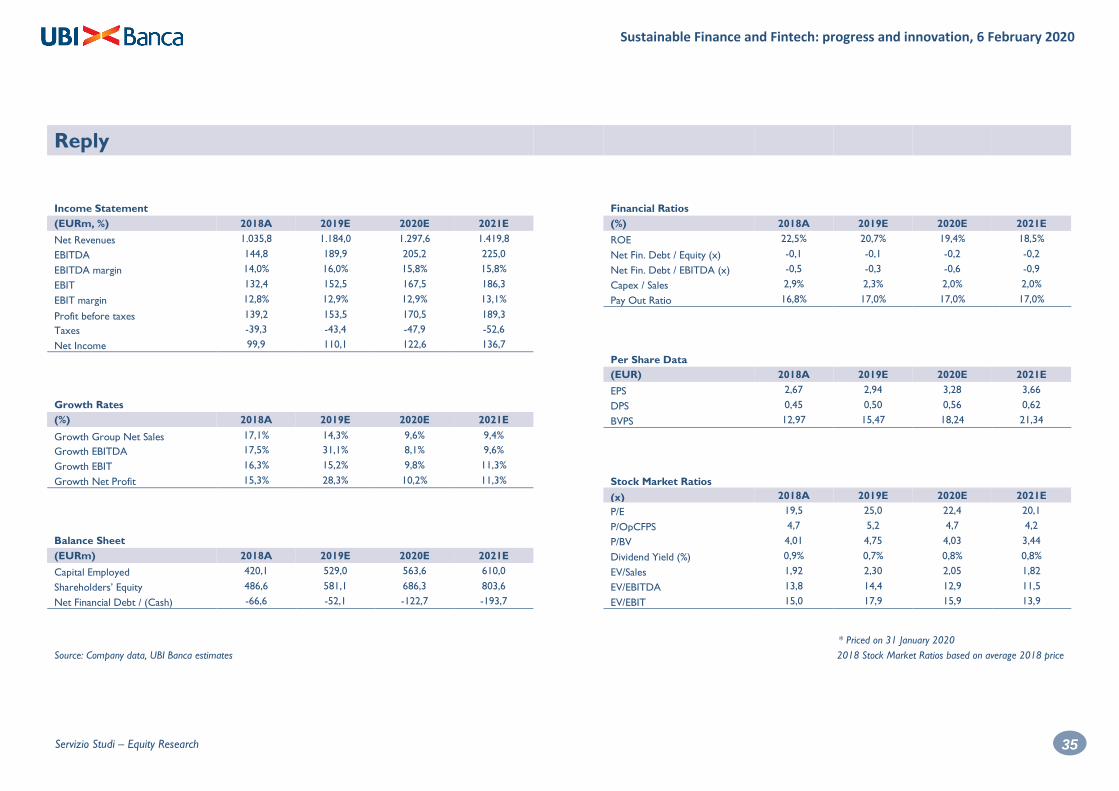
Sustainable Finance and Fintech: progress and innovation, 6 February 2020
35 Servizio Studi – Equity Research
Reply
Income Statement Financial Ratios
(EURm, %) 2018A 2019E 2020E 2021E (%) 2018A 2019E 2020E 2021E
Net Revenues 1.035,8 1.184,0 1.297,6 1.419,8 ROE 22,5% 20,7% 19,4% 18,5%
EBITDA 144,8 189,9 205,2 225,0 Net Fin. Debt / Equity (x) -0,1 -0,1 -0,2 -0,2
EBITDA margin 14,0% 16,0% 15,8% 15,8% Net Fin. Debt / EBITDA (x) -0,5 -0,3 -0,6 -0,9
EBIT 132,4 152,5 167,5 186,3 Capex / Sales 2,9% 2,3% 2,0% 2,0%
EBIT margin 12,8% 12,9% 12,9% 13,1% Pay Out Ratio 16,8% 17,0% 17,0% 17,0%
Profit before taxes 139,2 153,5 170,5 189,3
Taxes -39,3 -43,4 -47,9 -52,6
Net Income 99,9 110,1 122,6 136,7
Per Share Data
(EUR) 2018A 2019E 2020E 2021E
EPS 2,67 2,94 3,28 3,66
Growth Rates DPS 0,45 0,50 0,56 0,62
(%) 2018A 2019E 2020E 2021E BVPS 12,97 15,47 18,24 21,34
Growth Group Net Sales 17,1% 14,3% 9,6% 9,4%
Growth EBITDA 17,5% 31,1% 8,1% 9,6%
Growth EBIT 16,3% 15,2% 9,8% 11,3%
Growth Net Profit 15,3% 28,3% 10,2% 11,3% Stock Market Ratios
(x) 2018A 2019E 2020E 2021E
P/E 19,5 25,0 22,4 20,1
P/OpCFPS 4,7 5,2 4,7 4,2
Balance Sheet P/BV 4,01 4,75 4,03 3,44
(EURm) 2018A 2019E 2020E 2021E Dividend Yield (%) 0,9% 0,7% 0,8% 0,8%
Capital Employed 420,1 529,0 563,6 610,0 EV/Sales
1,92 2,30 2,05 1,82
Shareholders’ Equity 486,6 581,1 686,3 803,6 EV/EBITDA 13,8 14,4 12,9 11,5
Net Financial Debt / (Cash) -66,6 -52,1 -122,7 -193,7 EV/EBIT 15,0 17,9 15,9 13,9
* Priced on 31 January 2020
Source: Company data, UBI Banca estimates 2018 Stock Market Ratios based on average 2018 price
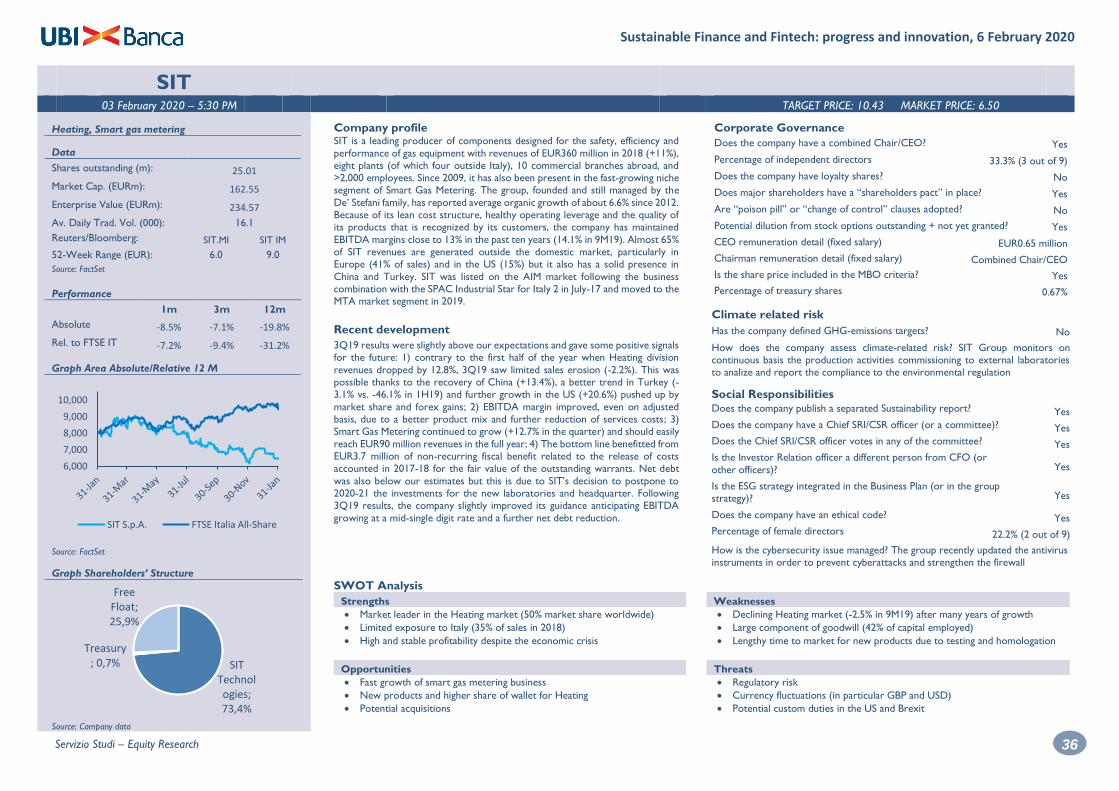
Sustainable Finance and Fintech: progress and innovation, 6 February 2020
36 Servizio Studi – Equity Research
SIT 03 February 2020 – 5:30 PM TARGET PRICE: 10.43 MARKET PRICE: 6.50
Heating, Smart gas metering
Data
Shares outstanding (m): 25.01
Market Cap. (EURm): 162.55
Enterprise Value (EURm): 234.57
Av. Daily Trad. Vol. (000): 16.1
Reuters/Bloomberg: SIT.MI SIT IM
52-Week Range (EUR): 6.0 9.0
Source: FactSet
Performance
1m 3m 12m
Absolute -8.5% -7.1% -19.8%
Rel. to FTSE IT -7.2% -9.4% -31.2%
Graph Area Absolute/Relative 12 M
Source: FactSet
Graph Shareholders’ Structure
Source: Company data
Company profile SIT is a leading producer of components designed for the safety, efficiency and
performance of gas equipment with revenues of EUR360 million in 2018 (+11%), eight plants (of which four outside Italy), 10 commercial branches abroad, and >2,000 employees. Since 2009, it has also been present in the fast-growing niche segment of Smart Gas Metering. The group, founded and still managed by the
De’ Stefani family, has reported average organic growth of about 6.6% since 2012. Because of its lean cost structure, healthy operating leverage and the quality of its products that is recognized by its customers, the company has maintained
EBITDA margins close to 13% in the past ten years (14.1% in 9M19). Almost 65%
of SIT revenues are generated outside the domestic market, particularly in Europe (41% of sales) and in the US (15%) but it also has a solid presence in
China and Turkey. SIT was listed on the AIM market following the business combination with the SPAC Industrial Star for Italy 2 in July-17 and moved to the MTA market segment in 2019.
Recent development
3Q19 results were slightly above our expectations and gave some positive signals for the future: 1) contrary to the first half of the year when Heating division
revenues dropped by 12.8%, 3Q19 saw limited sales erosion (-2.2%). This was possible thanks to the recovery of China (+13.4%), a better trend in Turkey (-3.1% vs. -46.1% in 1H19) and further growth in the US (+20.6%) pushed up by
market share and forex gains; 2) EBITDA margin improved, even on adjusted
basis, due to a better product mix and further reduction of services costs; 3) Smart Gas Metering continued to grow (+12.7% in the quarter) and should easily
reach EUR90 million revenues in the full year; 4) The bottom line benefitted from EUR3.7 million of non-recurring fiscal benefit related to the release of costs accounted in 2017-18 for the fair value of the outstanding warrants. Net debt
was also below our estimates but this is due to SIT’s decision to postpone to 2020-21 the investments for the new laboratories and headquarter. Following 3Q19 results, the company slightly improved its guidance anticipating EBITDA
growing at a mid-single digit rate and a further net debt reduction.
Corporate Governance
Does the company have a combined Chair/CEO? Yes
Percentage of independent directors 33.3% (3 out of 9)
Does the company have loyalty shares? No
Does major shareholders have a “shareholders pact” in place? Yes
Are “poison pill” or “change of control” clauses adopted? No
Potential dilution from stock options outstanding + not yet granted? Yes
CEO remuneration detail (fixed salary) EUR0.65 million
Chairman remuneration detail (fixed salary) Combined Chair/CEO
Is the share price included in the MBO criteria? Yes
Percentage of treasury shares 0.67%
Climate related risk
Has the company defined GHG-emissions targets? No
How does the company assess climate-related risk? SIT Group monitors on continuous basis the production activities commissioning to external laboratories to analize and report the compliance to the environmental regulation
Social Responsibilities
Does the company publish a separated Sustainability report? Yes
Does the company have a Chief SRI/CSR officer (or a committee)? Yes
Does the Chief SRI/CSR officer votes in any of the committee? Yes
Is the Investor Relation officer a different person from CFO (or
other officers)? Yes
Is the ESG strategy integrated in the Business Plan (or in the group strategy)?
Yes
Does the company have an ethical code? Yes
Percentage of female directors 22.2% (2 out of 9)
How is the cybersecurity issue managed? The group recently updated the antivirus instruments in order to prevent cyberattacks and strengthen the firewall
SWOT Analysis
Strengths Weaknesses
• Market leader in the Heating market (50% market share worldwide)
• Limited exposure to Italy (35% of sales in 2018)
• High and stable profitability despite the economic crisis
• Declining Heating market (-2.5% in 9M19) after many years of growth
• Large component of goodwill (42% of capital employed)
• Lengthy time to market for new products due to testing and homologation
Opportunities Threats
• Fast growth of smart gas metering business
• New products and higher share of wallet for Heating
• Potential acquisitions
• Regulatory risk
• Currency fluctuations (in particular GBP and USD)
• Potential custom duties in the US and Brexit
6,000
7,000
8,000
9,000
10,000
SIT S.p.A. FTSE Italia All-Share
SIT Technologies; 73,4%
Treasury; 0,7%
Free Float; 25,9%
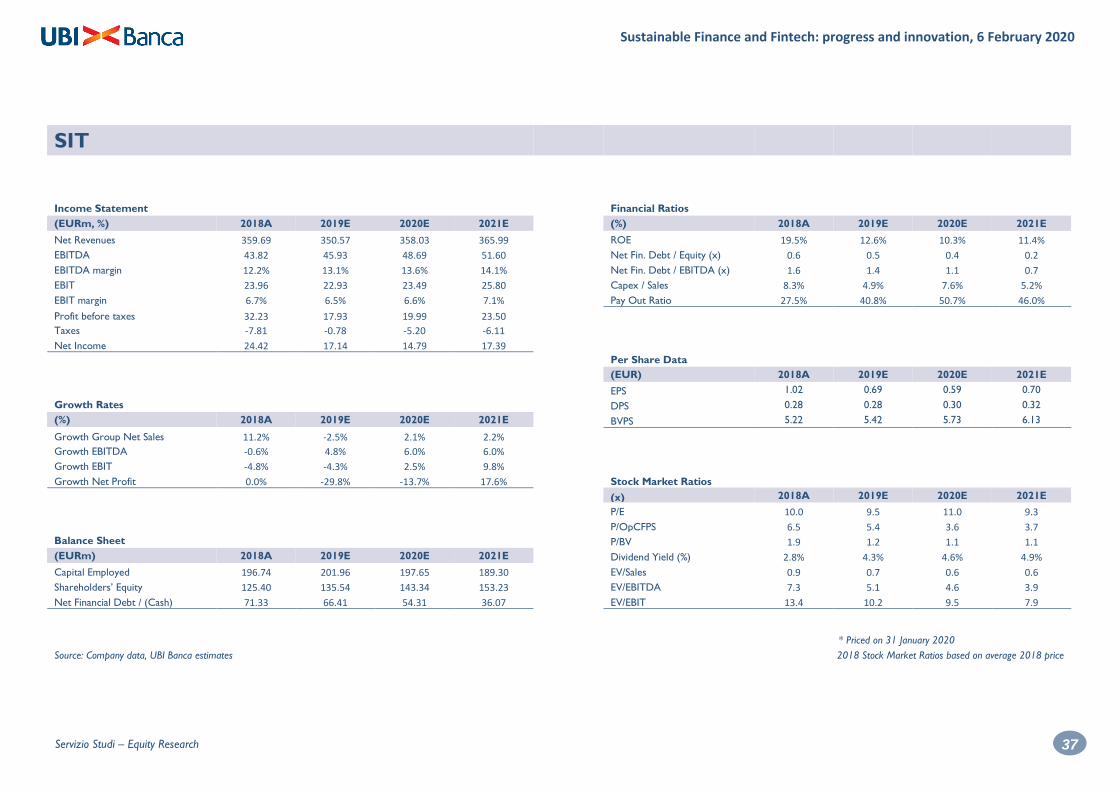
Sustainable Finance and Fintech: progress and innovation, 6 February 2020
37 Servizio Studi – Equity Research
SIT
Income Statement Financial Ratios
(EURm, %) 2018A 2019E 2020E 2021E (%) 2018A 2019E 2020E 2021E
Net Revenues 359.69 350.57 358.03 365.99 ROE 19.5% 12.6% 10.3% 11.4%
EBITDA 43.82 45.93 48.69 51.60 Net Fin. Debt / Equity (x) 0.6 0.5 0.4 0.2
EBITDA margin 12.2% 13.1% 13.6% 14.1% Net Fin. Debt / EBITDA (x) 1.6 1.4 1.1 0.7
EBIT 23.96 22.93 23.49 25.80 Capex / Sales 8.3% 4.9% 7.6% 5.2%
EBIT margin 6.7% 6.5% 6.6% 7.1% Pay Out Ratio 27.5% 40.8% 50.7% 46.0%
Profit before taxes 32.23 17.93 19.99 23.50
Taxes -7.81 -0.78 -5.20 -6.11
Net Income 24.42 17.14 14.79 17.39
Per Share Data
(EUR) 2018A 2019E 2020E 2021E
EPS 1.02 0.69 0.59 0.70
Growth Rates DPS 0.28 0.28 0.30 0.32
(%) 2018A 2019E 2020E 2021E BVPS 5.22 5.42 5.73 6.13
Growth Group Net Sales 11.2% -2.5% 2.1% 2.2%
Growth EBITDA -0.6% 4.8% 6.0% 6.0%
Growth EBIT -4.8% -4.3% 2.5% 9.8%
Growth Net Profit 0.0% -29.8% -13.7% 17.6% Stock Market Ratios
(x) 2018A 2019E 2020E 2021E
P/E 10.0 9.5 11.0 9.3
P/OpCFPS 6.5 5.4 3.6 3.7
Balance Sheet P/BV 1.9 1.2 1.1 1.1
(EURm) 2018A 2019E 2020E 2021E Dividend Yield (%) 2.8% 4.3% 4.6% 4.9%
Capital Employed 196.74 201.96 197.65 189.30 EV/Sales
0.9 0.7 0.6 0.6
Shareholders’ Equity 125.40 135.54 143.34 153.23 EV/EBITDA 7.3 5.1 4.6 3.9
Net Financial Debt / (Cash) 71.33 66.41 54.31 36.07 EV/EBIT 13.4 10.2 9.5 7.9
* Priced on 31 January 2020
Source: Company data, UBI Banca estimates 2018 Stock Market Ratios based on average 2018 price

Sustainable Finance and Fintech: progress and innovation, 6 February 2020
38 Servizio Studi – Equity Research
Spactiv 03 February 2020 – 5:30 PM MARKET PRICE: 9.85
Luxury Goods
Data
Shares outstanding (m): 9.3
Market Cap. (EURm): 91.6
Enterprise Value (EURm): 92.3
Av. Daily Trad. Vol. (‘000): 16.43
Reuters/Bloomberg: SPTV.MI SPTV IM
52-Week Range (EUR): 9.4 9.9
Source: FactSet
Performance
1m 3m 12m
Absolute 0.5% 1.0% 5.0%
Rel. to FTSE IT 1.8% -1.5% -11.6%
Graph Area Absolute/Relative 12 M
Source: FactSet
Graph Shareholders’ Structure
Source: Company data
Company profile Spactiv is a Special Purpose Acquisition Company (“SPAC”) and last September announced the business combination with Betty Blue so that the newly-merged
company will be automatically listed under the name “Elisabetta Franchi”. Betty Blue is a leading accessible luxury company operating in the womenswear market under the brand name Elisabetta Franchi. The deal attributes an equity valuation
to Elisabetta Franchi of EUR195 million implying a 2019 Adjusted EV/ EBITDA of 8.2x and Adjusted EV/EBIT of 8.9x. We believe that the acquisition of Elisabetta Franchi is a great opportunity for Spactiv shareholders for the following reasons:
(1) the expected growth at 4-5% per year of the accessible luxury sector; (2) the
strong brand recognition and competitive advantage in terms of “Made in Italy” style and quality of products; (3) the international growth potential; (4) the development of the accessories business; (5) the attractive dividend yield.
Recent development In 2018, revenues increased by 5.9% to EUR115.6 million compared to EUR109.2 million posted in 2017, while in 1H19 sales grew by 4.4% reaching the EUR57.4
million mark, reflecting an improved business and geographical positioning. Despite higher personnel costs (12.5% of sales in FY18 vs. 11.6% in Dec-17 for new hiring and full speed of 2017 DOS openings), in 2018 EBITDA overcame
EUR22 million (vs. EUR20.4 million the previous year), implying a 18.6% margin. In 1H19, after an EUR1 million non-recurring write off related to trade and
financial receivables vs. the controlled entity Betty Blue Asia Pacific Ltd., EBITDA
was up 20% to EUR9.7 million. Net Result slightly improved looking at the semester figure (EUR5.3 million in 1H19 vs. EUR5.0 million in 1H18) and was up 18% considering the full year figure (EUR15.0 million in Dec-18 vs. EUR12.0 million in Dec-17).
Corporate Governance
Does the company have a combined Chair/CEO? No
Percentage of independent directors 22% (2 out of 9) 22% (2 out of 9)
Does the company have loyalty shares? No
Does major shareholders have a “shareholders pact” in place? No
Are “poison pill” or “change of control” clauses adopted? No
Potential dilution from stock options outstanding + not yet granted? No
CEO remuneration detail (fixed salary) EUR0.3 million
Chairman remuneration detail (fixed salary) EUR0.35 million
Is the share price included in the MBO criteria? No
Percentage of treasury shares 0%
Climate related risk
Has the company defined GHG-emissions targets? No No
How does the company assess climate-related risk? No No
Social Responsibilities
Does the company publish a separated Sustainability report? No
Does the company have a Chief SRI/CSR officer (or a committee)? No
Does the Chief SRI/CSR officer votes in any of the committee? No No
Is the Investor Relation officer a different person from CFO (or other officers)? Yes
Yes
Is the ESG strategy integrated in the Business Plan (or in the group strategy)?
No
Does the company have an ethical code? Yes Yes
Percentage of female directors Not disclosed yet
How is the cybersecurity issue managed? Not disclosed, but the company is fully compliant with EU GDPR regulation
SWOT Analysis
Strengths Weaknesses
• Well established brand name in the womenswear accessible luxury
• Healthy financial structure and strong free cash flow generation
• Fast, agile production cycle, order delivery and concept store
• Lack of presence in North America (only via e-commerce) and China
• Low exposure to accessories
• Exposure to wholesale higher than competitors
Opportunities Threats
• Foreign expansion, mainly in Europe
• Reinforcing digital business, also through opening to e-tailers
• Product diversification opportunity in accessories
• Dependence from Elisabetta Franchi’s leadership (systematic risk of fashion
industry)
• Execution risk in international strategy
• Heavily exposed to domestic consumer spending
9,000
9,500
10,000
10,500
11,000
11,500
Spactiv SpA FTSE Italia All-Share
Promotori; 3,2%
Free float; 96,8%
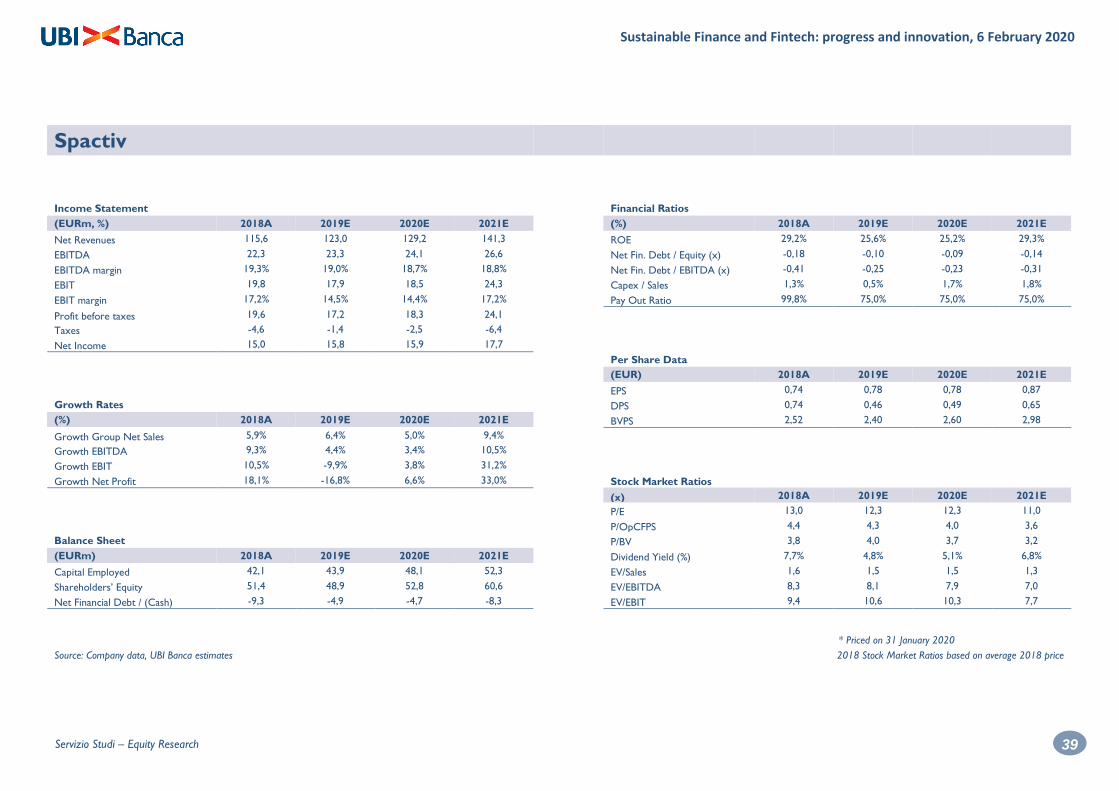
Sustainable Finance and Fintech: progress and innovation, 6 February 2020
39 Servizio Studi – Equity Research
Spactiv
Income Statement Financial Ratios
(EURm, %) 2018A 2019E 2020E 2021E (%) 2018A 2019E 2020E 2021E
Net Revenues 115,6 123,0 129,2 141,3 ROE 29,2% 25,6% 25,2% 29,3%
EBITDA 22,3 23,3 24,1 26,6 Net Fin. Debt / Equity (x) -0,18 -0,10 -0,09 -0,14
EBITDA margin 19,3% 19,0% 18,7% 18,8% Net Fin. Debt / EBITDA (x) -0,41 -0,25 -0,23 -0,31
EBIT 19,8 17,9 18,5 24,3 Capex / Sales 1,3% 0,5% 1,7% 1,8%
EBIT margin 17,2% 14,5% 14,4% 17,2% Pay Out Ratio 99,8% 75,0% 75,0% 75,0%
Profit before taxes 19,6 17,2 18,3 24,1
Taxes -4,6 -1,4 -2,5 -6,4
Net Income 15,0 15,8 15,9 17,7
Per Share Data
(EUR) 2018A 2019E 2020E 2021E
EPS 0,74 0,78 0,78 0,87
Growth Rates DPS 0,74 0,46 0,49 0,65
(%) 2018A 2019E 2020E 2021E BVPS 2,52 2,40 2,60 2,98
Growth Group Net Sales 5,9% 6,4% 5,0% 9,4%
Growth EBITDA 9,3% 4,4% 3,4% 10,5%
Growth EBIT 10,5% -9,9% 3,8% 31,2%
Growth Net Profit 18,1% -16,8% 6,6% 33,0% Stock Market Ratios
(x) 2018A 2019E 2020E 2021E
P/E 13,0 12,3 12,3 11,0
P/OpCFPS 4,4 4,3 4,0 3,6
Balance Sheet P/BV 3,8 4,0 3,7 3,2
(EURm) 2018A 2019E 2020E 2021E Dividend Yield (%) 7,7% 4,8% 5,1% 6,8%
Capital Employed 42,1 43,9 48,1 52,3 EV/Sales
1,6 1,5 1,5 1,3
Shareholders’ Equity 51,4 48,9 52,8 60,6 EV/EBITDA 8,3 8,1 7,9 7,0
Net Financial Debt / (Cash) -9,3 -4,9 -4,7 -8,3 EV/EBIT 9,4 10,6 10,3 7,7
* Priced on 31 January 2020
Source: Company data, UBI Banca estimates 2018 Stock Market Ratios based on average 2018 price

Sustainable Finance and Fintech: progress and innovation, 6 February 2020
40 Servizio Studi – Equity Research
TraWell 03 February 2020 – 5:30 PM TARGET PRICE: 78.2 MARKET PRICE: 40.5
Airport Services
Data
Shares outstanding (m): 0.62
Market Cap. (EURm): 25.1
Enterprise Value (EURm): 32.8
Av. Daily Trad. Vol. (000): 2.1
118.5Reuters/Bloomberg: TRWL.MI TWL IM
52-Week Range (EUR): 40.5 118.5
Source: FactSet
Performance
1m 3m 12m
Absolute -43.7% -52.6% -55.4%
Rel. to FTSE IT -43.4% -52.3% -56.3%
Graph Area Absolute/Relative 12 M
Source: FactSet
Graph Shareholders’ Structure
Source: Company data
Company profile Trawell is a leading service company specialising in luggage wrapping and tracing for airline passengers. It operates in 56 airports with >500 million passengers per
annum, in Italy (six airports including Rome), France (seven airports including Paris), Portugal (five airports including Lisbon), Switzerland, Poland, Canada, the US (Miami), Russia, Estonia, Latvia, Lithuania, Kyrgyzstan, Thailand and Philippines
managing about 160 wrapping machines with around 600 people. The average duration of its concessions is 2.0 years. TraWell last August distributed as a dividend 73.1% of the share capital of SOSTravel.com, (remaining a shareholder
with a stake of 11.1%) with a ratio of 7 SOSTravel.com shares every TraWell
share. SOSTravel.com, which is listed on the AIM market, distributes several innovative services (luggage tracking, refund, lost & found concierge, travel info) for airport passengers throughout the world. TraWell is 56.8% controlled by its
founder, Mr. Rudolph Gentile, and was listed on the AIM market in September 2013 and on Nasdaq in July 2019. In July TraWell finalized its stock reverse split with a 1:25 ratio.
Recent development
TraWell reported poor results in 1H19: despite the buoyant sales growth (up 22.6%), driven by the consolidation of PackandFly and Care4Bag, EBITDA dropped by 65%. EBITDA was depressed by EUR1.2 million of non-recurring costs and by lower volumes in Fiumicino as around 30% of the traffic was moved
to Terminal 1 (from Terminal 3) where TraWell is not present. Net profit
reached EUR1 million only thanks to EUR1.7 million coming from the write up of its stake in SOSTravel.com. Against this backdrop, TraWell immediately started several cost-cutting actions and closed loss-making concessions, and
profitability should recover next year and accelerate in 2021 when TraWell plans to finalise new acquisitions. The company updated its business plan, deeply cutting 2019-21 forecasts: EBITDA margin should reach 7.6% this year
(compared with 15% in 2018) progressively growing to 14.7% in 2021 while net profit expectations have been slashed by around 50% in 2019-20 and by 32% in 2021. In addition, TraWell should not distribute dividends in the next three years.
Corporate Governance
Does the company have a combined Chair/CEO? No
Percentage of independent directors 14.3% (1 out of 7)
Does the company have loyalty shares? No
Does major shareholders have a “shareholders pact” in place? No
Are “poison pill” or “change of control” clauses adopted? No
Potential dilution from stock options outstanding + not yet granted? No
CEO remuneration detail (fixed salary) EUR0.65 million
Chairman remuneration detail (fixed salary) EUR0.65 million
Is the share price included in the MBO criteria? No
Percentage of treasury shares 0%
Climate related risk
Has the company defined GHG-emissions targets? No
How does the company assess climate-related risk? Not disclosed
Social Responsibilities
Does the company publish a separated Sustainability report? No
Does the company have a Chief SRI/CSR officer (or a committee)? No
Does the Chief SRI/CSR officer votes in any of the committee? No
Is the Investor Relation officer a different person from CFO (or other officers)?
Yes
Is the ESG strategy integrated in the Business Plan (or in the group strategy)?
No
Does the company have an ethical code? Yes
Percentage of female directors 14.3% (1 out of 7)
How is the cybersecurity issue managed? Not disclosed
SWOT Analysis
Strengths Weaknesses
• Leading position in the wrapping sector
• Wide geographical diversification
• Launch of innovative products with higher value added
• Average duration of concessions is now relatively low (2.0 years)
• Goodwill (EUR22.2 million at June-19) could be written down
• No dividend should be distributed in the next three years
Opportunities Threats
• Development in Russia following the acquisition of PackandFly
• Further air passengers growth expected in the coming years
• Integration with Care4Bag
• Currency fluctuations (mainly USD and RUB)
• Strong competition for new concessions
• Geopolitical risk (e.g. terrorism attacks)
30,000
50,000
70,000
90,000
110,000
TraWell Co S.p.A. FTSE Italia All-Share
RG Holding;
56,8%
AC Hold; 9,2%
Marchin Inv.; 6,5%
Akhmedov e Fedoseev;
4,8%
Free Float; 22,8%

Sustainable Finance and Fintech: progress and innovation, 6 February 2020
41 Servizio Studi – Equity Research
TraWell
Income Statement Financial Ratios
(EURm, %) 2018A 2019E 2020E 2021E (%) 2018A 2019E 2020E 2021E
Net Revenues 43.1 46.4 48.7 61.7 ROE 8.1% 4.4% 6.8% 13.3%
EBITDA 6.5 3.5 5.8 9.3 Net Fin. Debt / Equity (x) 0.1 0.1 0.0 0.0
EBITDA margin 15.0% 7.5% 11.9% 15.0% Net Fin. Debt / EBITDA (x) 0.3 1.0 0.2 0.1
EBIT 5.0 1.9 4.5 7.9 Capex / Sales 0.3% 4.0% 3.5% 3.5%
EBIT margin 11.6% 4.1% 9.3% 12.9% Pay Out Ratio 0.0% 0.0% 0.0% 0.0%
Profit before taxes 4.6 3.0 4.1 7.5
Taxes -0.9 -0.9 -1.2 -2.3
Net Income 1.9 1.1 1.7 4.1
Per Share Data
(EUR) 2018A 2019E 2020E 2021E
EPS 3.11 1.74 2.81 6.67
Growth Rates DPS 0.00 0.00 0.00 0.00
(%) 2018A 2019E 2020E 2021E BVPS 38.26 39.12 41.04 50.04
Growth Group Net Sales 41.2% 7.7% 5.1% 26.6%
Growth EBITDA 35.4% -45.8% 66.0% 59.6%
Growth EBIT 28.4% -62.3% 141.0% 74.8%
Growth Net Profit 6.7% -44.1% 61.5% 137.7% Stock Market Ratios
(x) 2018A 2019E 2020E 2021E
P/E 30.6 23.3 14.4 6.1
P/OpCFPS 16.7 9.1 5.0 4.3
Balance Sheet P/BV 2.5 1.0 1.0 0.8
(EURm) 2018A 2019E 2020E 2021E Dividend Yield (%) 0.0% 0.0% 0.0% 0.0%
Capital Employed 28.3 30.9 30.5 36.7 EV/Sales
1.6 0.7 0.6 0.5
Shareholders’ Equity 23.7 24.3 25.4 31.0 EV/EBITDA 10.5 9.4 5.2 3.3
Net Financial Debt / (Cash) 1.8 3.4 1.2 1.3 EV/EBIT 13.6 17.4 6.7 3.8
* Priced on 31 January 2020
Source: Company data, UBI Banca estimates 2018 Stock Market Ratios based on average 2018 price

Sustainable Finance and Fintech: progress and innovation, 6 February 2020
42 Servizio Studi – Equity Research
Sustainable Finance and Fintech: progress and innovation, 6 February 2020
43 Servizio Studi – Equity Research
Disclaimer
Analysts Declaration
This research report (the “Report”) has been prepared by Marco Cristofori, Massimo Vecchio, Oriana Cardani and Dario Fasani on behalf of UBI Banca S.p.A. (“UBI Banca”) in the context of the ancillary service provided by UBI Banca named “Investment research and financial analysis or other forms of recommendation relating to transactions in financial instruments” under Paragraph 5), Section B, Annex I of the Directive 2014/65/EU (“MiFID II”). UBI Banca is an Italian bank under art. 4 (1)(27) of MiFID II and it is supervised by the European Central Bank and duly authorised to provide investment services pursuant to Article 1, Paragraph 5, letter a), b), c), c-bis), e) and f) of the Legislative Decree 24 February 1998, n° 58 under the supervision of the Italian Authority for the financial markets (Consob). UBI Banca has its head office at Piazza Vittorio Veneto 8, 24122 Bergamo.
The analysts who prepared the Report certify that:
a. The views expressed on the companies, mentioned herein (the “Companies”) accurately reflect their personal views, but do not represent the views or opinions of UBI Banca, its management or any other company which is part of or affiliated with UBI Banca group (the “UBI Banca Group”). It may be possible that some UBI Banca Group officers may disagree with the views expressed in this Report;
b. They have not received, and will not receive any direct or indirect compensation in exchange for any views expressed in this Report;
c. The analysts do not own any securities and/or any other financial instruments issued by the Companies or any financial instrument which the price depends on, or is linked to any securities and/or any financial instruments issued by the Companies.
d. Neither the analysts nor any member of the analysts’ household serve as officers, directors or advisory board members of the Companies.
e. The remuneration of the analysts is not directly tied to transactions for services for investment firms or other types of transactions it or any legal person, part of the same group performs, or to trading fees it or any legal person that is part of the same group receives.
f. Marco Cristofori is a member of AIAF; Massimo Vecchio is member of AIAF’s Directive Counsel; Oriana Cardani is a member of
AIAF, CFA charterholder.
General disclosure
This Report is for information purposes only. This Report (i) is not, nor may it be construed, to constitute, an offer for sale or subscription or of a solicitation of any offer to buy or subscribe for any securities issued or to be issued by the Companies, (ii) should not be regarded as a substitute for the exercise of the recipient’s own judgement. In addition, the information included in this Report may not be suitable for all recipients. Therefore the recipient should conduct their own investigations and analysis of the Companies and securities referred to in this document, and make their own investment decisions without undue reliance on its contents. Neither UBI Banca, nor any other company belonging to the UBI Banca Group, nor any of its directors, managers, officers or employees, accepts any direct or indirect liability whatsoever (in negligence or otherwise), and accordingly no direct or indirect liability whatsoever shall be assumed by, or shall be placed on, UBI Banca, or any other company belonging to the UBI Banca Group, or any of its directors, managers, officers or employees, for any loss, damage, cost, expense, lower earnings howsoever arising from any use of this Report or its contents or otherwise arising in connection with this Report.
The information provided and the opinions expressed in this Report are based upon information and data provided to the public by the Companies or news otherwise public, and refers to the date of publication of the Report. The sources (press publications, financial statements, current and periodic releases, as well as meetings and telephone conversations with the Companies’ representatives) are believed to be reliable and in good faith, but no representation or warranty, express or implied, is made by UBI Banca as to their accuracy, completeness or correctness. Past performance is not a guarantee of future results. Any opinions, forecasts or estimates contained herein constitute a judgement as of the date of this Report, and there can be no assurance that the future results of the Companies and/or any future events involving directly or indirectly the Companies will be consistent with any such opinions, forecasts or estimates. Any information herein is subject to change, update or amendment without notice by UBI Banca subsequent to the date of this Report, with no undertaking by UBI Banca to notify the recipient of this Report of such change, update or amendment.
Organizational and administrative arrangements to prevent conflicts of interests
UBI Banca maintains procedures and organizational mechanism (physical and non-physical barriers designed to restrict the flow of information between the unit which performs investment research activity, and other units of UBI Banca) to prevent and professionally manage conflicts of interest in relation to investment research in accordance with art. 23 of Directive 2014/65/EU and under art. 34 (3) and art. 37 of the Regulation 2017/565/EU. UBI Banca is organized in such a way as to minimize conflicts of interest and has within the meaning of art. 20 (1) of the Regulation (EU) No 596/2014/EU and has adequate control procedures in place to counter infringements of the obligations laid down in Article 20 (1) of the Regulation (EU) No 596/2014.
More specifically, UBI Banca has established, implements and maintains an effective conflicts of interests policy aimed at preventing and managing the potential conflicts of interest that could occur during the performance of the investment research services.
Insofar as the above mentioned organizational and administrative arrangements established by UBI Banca to prevent or manage potential conflicts of interests are not sufficient to ensure, with reasonable confidence, that risks of damage to the interests of the client will be prevented, UBI Banca engages to provide a clear disclosure of the specific conflicts of interests arising from the performance of investment research services, including a description of the sources of those conflicts and the steps undertaken to mitigate them, taking into account the nature of the client to whom the disclosure is being made.
For further information please see UBI Banca’s website (www.ubibanca.com/equity-research - “Informativa sintetica sull’attività di ricerca”) and (www.ubibanca.com/Mifid - “Policy sintetica conflitti di interessi”). More details about the conflicts of interests’ policy will be provided by UBI Banca upon request.
Disclosure of interests and conflicts of interests pursuant to Delegated Regulation 2016/958/EU
In relation to the Companies the following interest/conflict of interest have been found:
UBI Banca act as Specialist for Elettra Investimenti, First Capital, Gefran, Leone Film Group, LU-VE, Spactiv, TraWell;
UBI Banca acts as Corporate broker for Centrale del Latte d’Italia, Grifal, MailUp, NB Aurora, Notorious Pictures, SIT;
UBI Banca acts as Sponsor (or equivalent) for Elettra Investimenti, First Capital, Spactiv;
UBI Banca has delivered corporate finance sevices to CNH Industrial, NEXI and SIT in the last 12 months
UBI Banca may have long or short positions not exceeding the threshold of 0.5 % of the total issued share capital of the issuer.
On the basis of the checks carried out no other interest/conflict of interest arose.
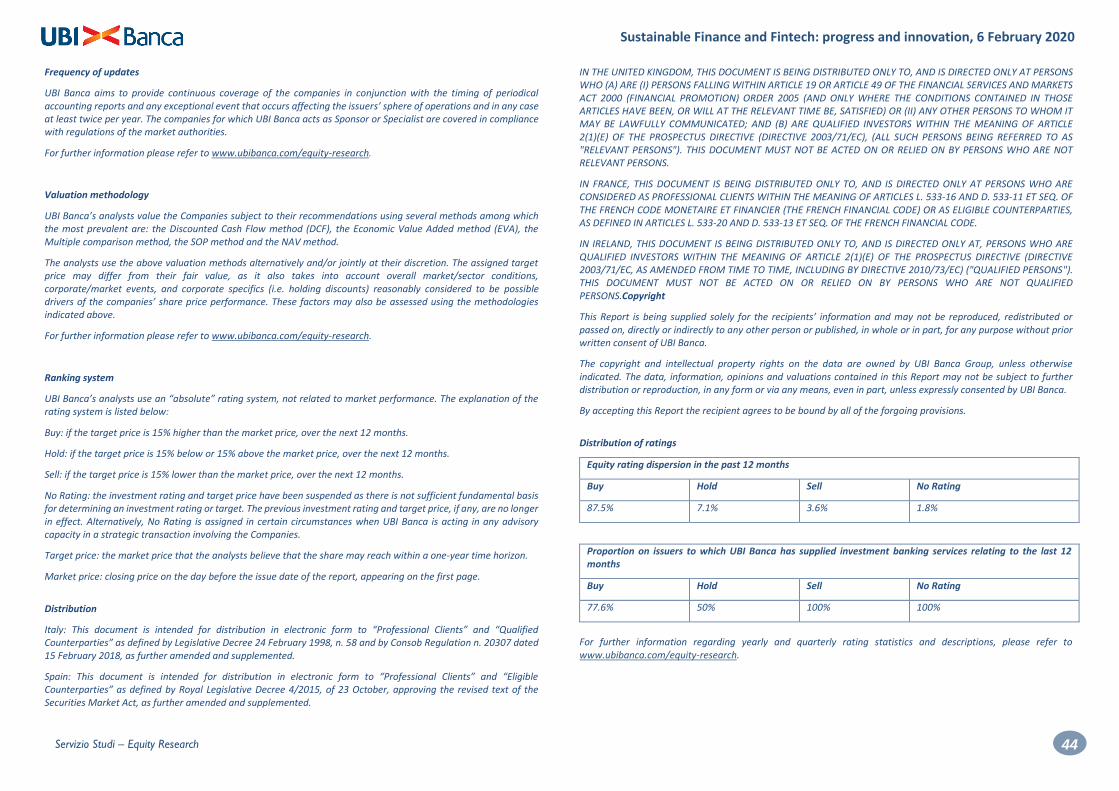
Sustainable Finance and Fintech: progress and innovation, 6 February 2020
44 Servizio Studi – Equity Research
Frequency of updates
UBI Banca aims to provide continuous coverage of the companies in conjunction with the timing of periodical accounting reports and any exceptional event that occurs affecting the issuers’ sphere of operations and in any case at least twice per year. The companies for which UBI Banca acts as Sponsor or Specialist are covered in compliance with regulations of the market authorities.
For further information please refer to www.ubibanca.com/equity-research.
Valuation methodology
UBI Banca’s analysts value the Companies subject to their recommendations using several methods among which the most prevalent are: the Discounted Cash Flow method (DCF), the Economic Value Added method (EVA), the Multiple comparison method, the SOP method and the NAV method.
The analysts use the above valuation methods alternatively and/or jointly at their discretion. The assigned target price may differ from their fair value, as it also takes into account overall market/sector conditions, corporate/market events, and corporate specifics (i.e. holding discounts) reasonably considered to be possible drivers of the companies’ share price performance. These factors may also be assessed using the methodologies indicated above.
For further information please refer to www.ubibanca.com/equity-research.
Ranking system
UBI Banca’s analysts use an “absolute” rating system, not related to market performance. The explanation of the rating system is listed below:
Buy: if the target price is 15% higher than the market price, over the next 12 months.
Hold: if the target price is 15% below or 15% above the market price, over the next 12 months.
Sell: if the target price is 15% lower than the market price, over the next 12 months.
No Rating: the investment rating and target price have been suspended as there is not sufficient fundamental basis for determining an investment rating or target. The previous investment rating and target price, if any, are no longer in effect. Alternatively, No Rating is assigned in certain circumstances when UBI Banca is acting in any advisory capacity in a strategic transaction involving the Companies.
Target price: the market price that the analysts believe that the share may reach within a one-year time horizon.
Market price: closing price on the day before the issue date of the report, appearing on the first page.
Distribution
Italy: This document is intended for distribution in electronic form to “Professional Clients” and “Qualified Counterparties” as defined by Legislative Decree 24 February 1998, n. 58 and by Consob Regulation n. 20307 dated 15 February 2018, as further amended and supplemented.
Spain: This document is intended for distribution in electronic form to “Professional Clients” and “Eligible Counterparties” as defined by Royal Legislative Decree 4/2015, of 23 October, approving the revised text of the Securities Market Act, as further amended and supplemented.
IN THE UNITED KINGDOM, THIS DOCUMENT IS BEING DISTRIBUTED ONLY TO, AND IS DIRECTED ONLY AT PERSONS WHO (A) ARE (I) PERSONS FALLING WITHIN ARTICLE 19 OR ARTICLE 49 OF THE FINANCIAL SERVICES AND MARKETS ACT 2000 (FINANCIAL PROMOTION) ORDER 2005 (AND ONLY WHERE THE CONDITIONS CONTAINED IN THOSE ARTICLES HAVE BEEN, OR WILL AT THE RELEVANT TIME BE, SATISFIED) OR (II) ANY OTHER PERSONS TO WHOM IT MAY BE LAWFULLY COMMUNICATED; AND (B) ARE QUALIFIED INVESTORS WITHIN THE MEANING OF ARTICLE 2(1)(E) OF THE PROSPECTUS DIRECTIVE (DIRECTIVE 2003/71/EC), (ALL SUCH PERSONS BEING REFERRED TO AS "RELEVANT PERSONS"). THIS DOCUMENT MUST NOT BE ACTED ON OR RELIED ON BY PERSONS WHO ARE NOT RELEVANT PERSONS.
IN FRANCE, THIS DOCUMENT IS BEING DISTRIBUTED ONLY TO, AND IS DIRECTED ONLY AT PERSONS WHO ARE CONSIDERED AS PROFESSIONAL CLIENTS WITHIN THE MEANING OF ARTICLES L. 533-16 AND D. 533-11 ET SEQ. OF THE FRENCH CODE MONETAIRE ET FINANCIER (THE FRENCH FINANCIAL CODE) OR AS ELIGIBLE COUNTERPARTIES, AS DEFINED IN ARTICLES L. 533-20 AND D. 533-13 ET SEQ. OF THE FRENCH FINANCIAL CODE.
IN IRELAND, THIS DOCUMENT IS BEING DISTRIBUTED ONLY TO, AND IS DIRECTED ONLY AT, PERSONS WHO ARE QUALIFIED INVESTORS WITHIN THE MEANING OF ARTICLE 2(1)(E) OF THE PROSPECTUS DIRECTIVE (DIRECTIVE 2003/71/EC, AS AMENDED FROM TIME TO TIME, INCLUDING BY DIRECTIVE 2010/73/EC) ("QUALIFIED PERSONS"). THIS DOCUMENT MUST NOT BE ACTED ON OR RELIED ON BY PERSONS WHO ARE NOT QUALIFIED PERSONS.Copyright
This Report is being supplied solely for the recipients’ information and may not be reproduced, redistributed or passed on, directly or indirectly to any other person or published, in whole or in part, for any purpose without prior written consent of UBI Banca.
The copyright and intellectual property rights on the data are owned by UBI Banca Group, unless otherwise indicated. The data, information, opinions and valuations contained in this Report may not be subject to further distribution or reproduction, in any form or via any means, even in part, unless expressly consented by UBI Banca.
By accepting this Report the recipient agrees to be bound by all of the forgoing provisions.
Distribution of ratings
Equity rating dispersion in the past 12 months
Buy Hold Sell No Rating
87.5% 7.1% 3.6% 1.8%
Proportion on issuers to which UBI Banca has supplied investment banking services relating to the last 12 months
Buy Hold Sell No Rating
77.6% 50% 100% 100%
For further information regarding yearly and quarterly rating statistics and descriptions, please refer to www.ubibanca.com/equity-research.

Sustainable Finance and Fintech: progress and innovation, 6 February 2020
45 Servizio Studi – Equity Research
RESEARCH DEPARTMENT Nomad - Key Executives Head of Research Department Marco Germano +39.02.7781 4651 Giovanni Barone [email protected] [email protected] Gisella Barisone +39.02.7781 4618 [email protected] Macroeconomic and Financial Industry Research Market Research Equity Research Giulio Greco +338.6235158 Enza De Vita Francesca Pascali Marco Cristofori [email protected] [email protected] [email protected] +39.02.6275 3015 [email protected] Anna Cristina Visconti Vincenzo Petrignano [email protected] [email protected] Massimo Vecchio Head of Global Markets +39.02.6275 3016 Paolo Manzoni [email protected] Alessandro Michele Ravogli [email protected] [email protected] Oriana Cardani, CFA Quantitative Analysis Paolo Leoni +39.02.6275 3017 Solutions Sales [email protected] [email protected] Francesco Martinelli Andrea Paolo Martini [email protected] Lorenzo Biagioli Dario Fasani +39.02.7781 4341 [email protected] +39.02.6275 3014 [email protected] [email protected] Debora Palmieri Roberta Pupeschi [email protected] +39.02.7781 4682 [email protected]
Stefano Ottavi +338.6639433 [email protected] Laura Katherine Milic +39.02.7781 4616 [email protected] Gabriele Edoardo Banfi +39.02.77.81 4344 [email protected]