SUSPENDED SEDIMENT AND TURBIDITY FOLLOWING ROAD CONSTRUCTION AND LOGGING IN WESTERN MONTANA
10
WATER RESOURCES BULLETIN VOL. 23, NO. 4 AMERICAN WATER RESOURCES ASSOCIATION AUGUST 1987 SUSPENDED SEDIMENT AND TURBIDITY FOLLOWING ROAD CONSTRUCTION AND LOGGING IN WESTERN MONTANA' Bruce Anderson and Donald F. Potts2 ABSTRACT: Forest management activities in a second order drainage basin increased suspended sediment yields 7.7 fold in the first year following road construction, and two-fold following logging in the second year. Sediment supply limitations resulted in poor correla- tions between sediment concentrations with discharge. Sediment transport was strongly hysteretic, with the highest sediment concen- trations occurring on the rising limbs of snowmelt hydrographs and individual peaks. In addition to discharge, hydrograph characteristics such as limb, dQ/dt, and the product of dQ/dt and limb aided in explaining variability of observed sediment concentrations. Sediment- turbidity relationships were strongly discharge dependent, reflecting the changing composition of the suspended load with stream power and sediment supplies. (KEY TERMS: suspended sediment; sediment transport; turbidity; water quality; sedimentation; watershed management; forest manage- ment.) INTRODUCTION Timber harvest and road construction in mountainous terrain are frequently cited as major contributors to increased suspended sediment concentrations and turbidity in stream systems. Elevated suspended sediment concentrations and turbidity have potentially detrimental effects on fisheries and aquatic invertebrates (Stowell, et aL, 1983), as well as causing losses in downstream water quality, reservoir storage, and recreational values. Forest management planning requires knowledge of natural and management-induced rates of sedi- ment production for the assurance of continued high quality water supplies. Additionally, most states have water quality standards addressing changes in stream turbidity, assumed to be related to suspended load. Knowledge of the temporal variability of turbidity-suspended sediment relationships is essential for compliance with these standards. Suspended sediment production and turbidity following forest management activities are well documented for small watersheds in coastal Oregon (Beschta, 1978, 1980, 1983; Paustian and Beschta, 1979; Milhous and Klingeman, 1978), and central Idaho (King, 1979; Megahan, 1975). Unfor- tunately, few data exist assessing the impact of management activities in watersheds located on Precambrian metasediments of the northern Rockies. Belt series metasediments are extensive, underlying 13.2 million acres (47 percent) of the U.S. Forest Service Northern Region forests (Snyder, 1976). Sediment studies have generally focused on either highly erodible soils or unstable terrain where mass soil movement is the dominant mechanism of sediment delivery to stream channels. On the hard metasediments of the Northern Rockies, mass failure is infrequent. Soils tend to be stable, which requires the least stringent road construction standards to minimize erosion (Packer, 1967). Sediment yields are characteristically low in forested basins with soils formed on hard sediments. Limited supplies of sediment, especially in undisturbed drainages, may result in complex patterns of sediment trans- port. The relationships between suspended sediment, tur- bidity, and discharge under such conditions are not yet well understood. Additionally, pronounced changes in these rela- tionships might be anticipated where forest management acti- vities significantly alter sediment supplies in normally supply- limited stream systems. The objectives of this study were to investigate the rela- tionships between suspended sediment concentration, tur- bidity, and discharge, and to evaluate changes in these rela- tionships associated with logging and road construction in a basin underlain by Belt series metasediments. THE STUDY AREA Johnson Gulch is a third order basin on the southern edge of the Jocko Mountains, which joins the Blackfoot River 20 km northeast of Missoula, Montana. Johnson Gulch drains 23 km2 of mountainous, deeply dissected terrain and ranges in elevation from 1050 to 2291 meters. Instrumented first and second order subbasins are located at lower elevations between 1100 and 1800 meters. The region, in general, has a temperate continental climate that is moderated by the maritime influence of the Pacific air mass. The hydrologic cycle is snow dominated, but rain-on- 'Paper No. 85141 of the Water Resources Bulletin. Discussions are open until April 1, 1988 2Respectivcly Graduate Research Assistant and Associate Professor of Watershed Management, School of Forestry, University of Montana, Missoula, Montana 59812. 681 WATER RESOURCES BULLETIN
-
Upload
bruce-anderson -
Category
Documents
-
view
213 -
download
1
Transcript of SUSPENDED SEDIMENT AND TURBIDITY FOLLOWING ROAD CONSTRUCTION AND LOGGING IN WESTERN MONTANA

WATER RESOURCES BULLETINVOL. 23, NO. 4 AMERICAN WATER RESOURCES ASSOCIATION AUGUST 1987
SUSPENDED SEDIMENT AND TURBIDITY FOLLOWING ROADCONSTRUCTION AND LOGGING IN WESTERN MONTANA'
Bruce Anderson and Donald F. Potts2
ABSTRACT: Forest management activities in a second order drainagebasin increased suspended sediment yields 7.7 fold in the first yearfollowing road construction, and two-fold following logging in thesecond year. Sediment supply limitations resulted in poor correla-tions between sediment concentrations with discharge. Sedimenttransport was strongly hysteretic, with the highest sediment concen-trations occurring on the rising limbs of snowmelt hydrographs andindividual peaks. In addition to discharge, hydrograph characteristicssuch as limb, dQ/dt, and the product of dQ/dt and limb aided inexplaining variability of observed sediment concentrations. Sediment-turbidity relationships were strongly discharge dependent, reflectingthe changing composition of the suspended load with stream powerand sediment supplies.(KEY TERMS: suspended sediment; sediment transport; turbidity;water quality; sedimentation; watershed management; forest manage-ment.)
INTRODUCTION
Timber harvest and road construction in mountainousterrain are frequently cited as major contributors to increasedsuspended sediment concentrations and turbidity in streamsystems. Elevated suspended sediment concentrations andturbidity have potentially detrimental effects on fisheriesand aquatic invertebrates (Stowell, et aL, 1983), as well ascausing losses in downstream water quality, reservoir storage,and recreational values. Forest management planning requiresknowledge of natural and management-induced rates of sedi-ment production for the assurance of continued high qualitywater supplies. Additionally, most states have water qualitystandards addressing changes in stream turbidity, assumed tobe related to suspended load. Knowledge of the temporalvariability of turbidity-suspended sediment relationships isessential for compliance with these standards.
Suspended sediment production and turbidity followingforest management activities are well documented for smallwatersheds in coastal Oregon (Beschta, 1978, 1980, 1983;Paustian and Beschta, 1979; Milhous and Klingeman, 1978),and central Idaho (King, 1979; Megahan, 1975). Unfor-
tunately, few data exist assessing the impact of managementactivities in watersheds located on Precambrian metasediments
of the northern Rockies. Belt series metasediments areextensive, underlying 13.2 million acres (47 percent) of theU.S. Forest Service Northern Region forests (Snyder, 1976).Sediment studies have generally focused on either highlyerodible soils or unstable terrain where mass soil movementis the dominant mechanism of sediment delivery to streamchannels. On the hard metasediments of the NorthernRockies, mass failure is infrequent. Soils tend to be stable,which requires the least stringent road construction standardsto minimize erosion (Packer, 1967). Sediment yields arecharacteristically low in forested basins with soils formed onhard sediments.
Limited supplies of sediment, especially in undisturbeddrainages, may result in complex patterns of sediment trans-port. The relationships between suspended sediment, tur-bidity, and discharge under such conditions are not yet wellunderstood. Additionally, pronounced changes in these rela-tionships might be anticipated where forest management acti-vities significantly alter sediment supplies in normally supply-limited stream systems.
The objectives of this study were to investigate the rela-tionships between suspended sediment concentration, tur-bidity, and discharge, and to evaluate changes in these rela-tionships associated with logging and road construction in abasin underlain by Belt series metasediments.
THE STUDY AREA
Johnson Gulch is a third order basin on the southern edgeof the Jocko Mountains, which joins the Blackfoot River20 km northeast of Missoula, Montana. Johnson Gulch drains23 km2 of mountainous, deeply dissected terrain and rangesin elevation from 1050 to 2291 meters. Instrumented firstand second order subbasins are located at lower elevationsbetween 1100 and 1800 meters.
The region, in general, has a temperate continental climatethat is moderated by the maritime influence of the Pacific airmass. The hydrologic cycle is snow dominated, but rain-on-
'Paper No. 85141 of the Water Resources Bulletin. Discussions are open until April 1, 19882Respectivcly Graduate Research Assistant and Associate Professor of Watershed Management, School of Forestry, University of Montana, Missoula,
Montana 59812.
681 WATER RESOURCES BULLETIN

Anderson and Potts
snow events can play an important role in the magnitude andtiming of spring runoff. Peak flows may occur with springrains as early as April in smaller low elevation watersheds.The larger rivers such as the Blackfoot typically peak muchlater, either in June or early July. Annual precipitation atthe mouth of the Johnson Gulch averages 680 mm, 30 percentof which falls as snow. At higher elevations (2000 m) annualprecipitation is closer to 900 mm, 50 percent of which fallsas snow. Annual runoff is 450 mm at the mouth of JohnsonGulch, but only 130 mm at the instrumented mid-elevationsubbasins. First and second-order channel gradients average31 percent and 16 percent, respectively. Active channelwidths range from 1 to 1.8 meters. Organic debris accumu-lations acting as sediment storage sites are characteristic ofthese channels. In first- and second-order channels an aver-age of 15 in-channel obstructions are found in every 100 m.Debris accumulations within the active channel amount toabout 13 kg/rn2, and 10-20 percent of these in-channeldebris obstructions are active in storing from 16 to 38 kgof sediment per m2 of active channel.
The instrumented subbasins are underlain predominantlyby four Missoula group formations of the Precambrian Beltseries. Soils have developed from quartzite and argillitecolluvium and tend to be shallow with a high cobble fraction.On cooler aspects and higher elevations, soils are pre-dominately loamy skeletal, mixed, Andic and Lithic Ciyo-chrepts of the Holloway mapping unit. On warmer aspects,soils are loamy skeletal, mixed, frigid Udic, Typic, and LithicUstochrepts of the Winkler mapping unit. Slopes are steep,ranging from 15 to 60 percent, with an average of 40 per-cent. The basin is forested with mature Douglas-fir (Pseudot-suga menziesii), western larch (Larix occidentalis), and pon-derosa pine (Pinus ponderosa). Understory species includeNinebark (Physocarpus malvaceus), Pinegrass (Calamagrostisrubescens), Rough Fescue (Festuca Scabrella) Beargrass(Xerophyllum tenax), Huckleberry (Vaccinium sp.), and ElkSedge (Carex geyeri). Substantial areas of talus and opengrassy slopes are present on the drier southerly aspects, and35 percent of the basin is sparsely vegetated (< 25 percentcover).
METHODS
In 1982, prior to any disturbance, two H-flumes were in-stalled in a second-order subbasin within the watershed(Figure 1). The upper station is a 280 1/s capacity H-flumein a first-order channel draining 0.68 km2, and the lowerstation is a 560 1/s capacity H-flume in a second-order chan-nel draining 1.37 km2. Discharge was monitored continuouslywith Stevens recorders, and total suspended sediment wasdetermined from one liter depth integrated water samplestaken at each station. Sampling was roughly stratified accord-ing to discharge; daily samples were taken during snowmeltpeak flows, and sampling was reduced to three times weeklyduring low flows. Turbidity was measured immediately upon
return to the laboratory with a Hach Model 16800 turbidi-meter in nephelometric turbidity units (NTU's). Suspendedsediment was measured using standard filtration and gravi-metric procedures (APHA, 1975). Finely divided organicswere not separated. Consequently, sediment figures includeboth organic and inorganic components.
Figure 1. Johnson Gulch Research Watershed.
The lower and upper stations lie along the same channel,and form a "nested pair." All logging and road constructionoccurred downstream of the upper station. The upper stationacts as a control, monitoring undisturbed conditions, andthe lower station reflects the impacts of management activi-ties upstream. Baseline data were collected in 1982 priorto any disturbance. In the late summer of 1983, 2.5 kmof side cast road that cross the channel three times wereconstructed upstream of the lower station. In late 1984,20 percent of the subbasin was selectively harvested withfeller-bunchers, tractors, and rubber-tired skidders. Twenty-to 40-meter buffer strips were left adjacent to the stream.
Statistical comparison of suspended sediment concentra-tions, discharge, and turbidity during the pre- and post-treat-ment periods was accomplished using Model II, Bartlett's3-group linear regressions (Sokal and Rohlf, 1981) oflogarithmically transformed data. The logarithmic transform a-tion makes the power function relationships linear for pur-poses of statistical comparison and minimizes the effects ofheteroscedasticity by making the variance independent of themean.
Annual suspended sediment yield for the upper and lowerstations was calculated by applying measured sediment con-centrations to continuous discharge records. Annual yieldsare expressed in mass/unit channel length as well as in thetraditional mass/unit area. In the absence of overland flow
682 WATER RESOURCES BULLETIN

Suspended Sediment and Turbidity Following Road Construction and Logging in Western Montana
or extensive mass wasting, the majority of sediment in un-disturbed forested basins is derived from channel erosionand soil creep entering the stream network along the perim-eter of the channel. Sediment is not derived from widespreadareas of the basin, as might be anticipated where overlandflow processes are dominant. Consequently, sediment pro-duction in forested basins should be more closely relatedto channel length than basin area. Indeed, main channellength was an important predictor of sediment yield in 36basins in southern Alberta (McPherson, 1975), and Marston(1978) concluded that annual sediment yield was more closelyrelated to channel length than basin area for 15 Oregon wa-tersheds. Mass/unit channel length provides a better basisfor comparison of sediment yield between watersheds withdiffering drainage densities, and it acknowledges the functionalrelationship between sediment yield and channel length.
Suspended Sediment
RESULTS AND DISCUSSION
Suspended sediment concentrations at the upper stationranged from 0.01 mg/i to 5.6 mg/l, with an average of 0.9mg/l during the three year study (n = 133). Predisturbancesediment concentrations at the lower station ranged from 0.5mg/l to 3.4 mg/i, with an average of 1.5 mg/l in 1983 (n =50). Suspended sediment concentrations at the lower stationfollowing road construction in 1983-84 ranged from 0.46to 69 mg/l, with an average of 6.7 mg/i (n =63). The secondyear following road construction, and during logging opera-tions in 1985, suspended sediment concentrations ranged from1.6 to 43.4 mg/l, with an average of 6.4 mg/l (n = 36).
Comparison of annual yieids indicates a 7.7-fold increasein suspended sediment yield at the lower station in the firstyear following road construction, and a two-fold increase inthe second year (Table 1). Although the second year figuredoes reflect possible effects of timber harvest, it is highlyunlikely that cutting or skidding operations contributeddirectly to sediment production. Soil disturbance was ne-gligible, and no overland flow or sediment delivery was ob-served from the 10-20 percent slopes in the logged area.Channel disturbance and direct additions of soil during roadconstruction account for most of the increased sedimentyield, plus some surface erosion of fill slopes immediatelyadjacent to culverts.
Suspended sediment yield appeared to be decaying rapidlytowards pretreatment levels in the second year; however, thismay have been largely a consequence of low water yieldsduring 1985. Water yields during the pretreatment and first-year post-treatment periods were essentially equivalent; wateryield in the second year was 50 percent of the previous years.If scaled up to equivalent water yield, the increase in sus-pended sediment yield for 1985 would be four-fold. Implicitin this comparison is a linear relationship between sedimentyield and water yield; admittedly the true relationship islikely to be exponential.
TABLE 1. Pre- and Post-Disturbance Suspended SedimentYields at the Upper and Lower Stations.
Annual Suspended Sediment Yield
Year Kg/km2 Kg/km Channel
Top Pre19841985
5610283
325847
Lower Pre19841985
1771365356
93713186
Although the mean weekly, monthly, and annual sedimentconcentrations and sediment yields were all consistently higherfollowing logging and road construction, none of these dif-ferences were statistically significant (a = 0.05). Simple dif-ferences between means were not detectable because of highlyvariable sediment concentrations over the wide range of ob-served flows.
The equation commonly employed to model sedimentconcentration as a function of discharge, originally developedby Campbell and Bauder (1940), is of the form y =where Y is the concentration of suspended sediment, X isdischarge, and a and b are coefficients determined from theintercept and slope of the log-log plot.
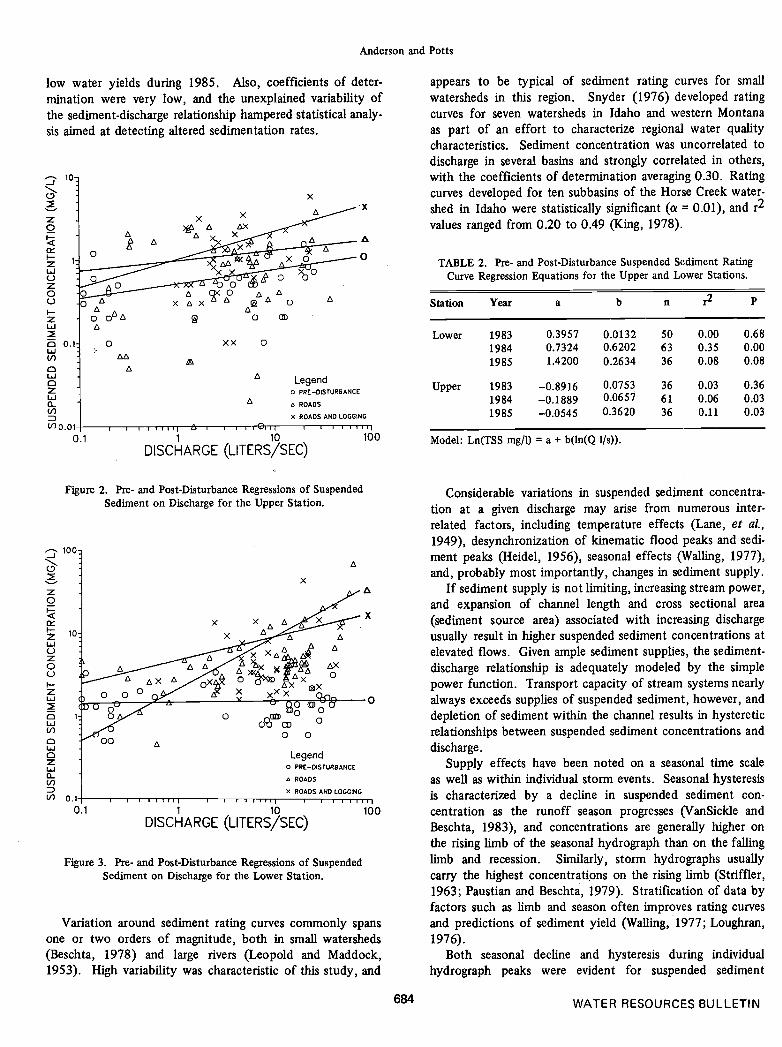
Figures 2 and 3, and Table 2 show the suspended sedimentrating curves developed for pre- and post-disturbance condi-tions. Although the upper station experienced no disturbance,the suspended sediment concentrations were weakly but sig-nificantly correlated to discharge during two of the threeyears (r2 = 0.03, 0.06, 0.11; P = 36 percent, 2.7 percent,2.6 percent, for pre- first, and second years, respectively).Individual regressions at the upper station were not signifi-candy different at the 95 percent confidence level. Thus,the sediment-discharge regime at the upper station was con-sistent throughout the study period.
Prior to disturbance, no correlation existed between sus-pended sediment concentration and discharge at the lowerstation (r2 = 0.00, P = 68 percent). Following road con-struction, higher suspended sediment concentrations were cor-related with higher discharges (r2 = 0.35, P <0.01 percent)in the first year, but were poorly correlated in the second(r2 = 0.08, P = 8.4 percent). The sediment rating curveshifted to a regime of higher sediment concentrations for agiven discharge in the first year following road construction,with the slopes and intercepts being significantly differentthan the predisturbance sediment rating curve at the 95 per-cent confidence level (P = 0.01 percent). The second yearpost-disturbance sediment rating curve was not statisticallydifferent from the predisturbance curve at the 95 percentconfidence level (P = 11 percent). Suspended sedimenttransport appeared to be returning to predisturbance condi-tions, although this may have been partially an artifact of
683 WATER RESOURCES BULLETIN
Anderson and Potts
low water yields during 1985. Also, coefficients of deter-mination were very low, and the unexplained variability ofthe sediment-discharge relationship hampered statistical analy-sis aimed at detecting altered sedimentation rates.
Figure 3. Pre- and Post-Disturbance Regressions of SuspendedSediment on Discharge for the Lower Station.
Variation around sediment rating curves commonly spansone or two orders of magnitude, both in small watersheds(Beschta, 1978) and large rivers (Leopold and Maddock,1953). High variability was characteristic of this study, and
appears to be typical of sediment rating curves for smallwatersheds in this region. Snyder (1976) developed ratingcurves for seven watersheds in Idaho and western Montanaas part of an effort to characterize regional water qualitycharacteristics. Sediment concentration was uncorrelated todischarge in several basins and strongly correlated in others,with the coefficients of determination averaging 0.30. Ratingcurves developed for ten subbasins of the Horse Creek water-shed in Idaho were statistically significant ( = 0.01), and r2values ranged from 0.20 to 0.49 (King, 1978).
Station Year a I, n r2 p
Lower 198319841985
0.39570.73241.4200
0.01320.62020.2634
506336
0.000.350.08
0.680.000.08
Upper 198319841985
—0.8916—0.1889—0.0545
0.07530.06570.3620
366136
0.030.060.11
0.360.030.03
Considerable variations in suspended sediment concentra-tion at a given discharge may arise from numerous inter-related factors, including temperature effects (Lane, et a!.,
1949), desynchronization of kinematic flood peaks and sedi-ment peaks (Heidel, 1956), seasonal effects (Walling, 1977),and, probably most importantly, changes in sediment supply.
If sediment supply is not limiting, increasing stream power,and expansion of channel length and cross sectional area(sediment source area) associated with increasing dischargeusually result in higher suspended sediment concentrations atelevated flows. Given ample sediment supplies, the sediment-discharge relationship is adequately modeled by the simplepower function. Transport capacity of stream systems nearlyalways exceeds supplies of suspended sediment, however, anddepletion of sediment within the channel results in hystereticrelationships between suspended sediment concentrations anddischarge.
Supply effects have been noted on a seasonal time scaleas well as within individual storm events. Seasonal hysteresisis characterized by a decline in suspended sediment con-centration as the runoff season progresses (VanSickle andBeschta, 1983), and concentrations are generally higher onthe rising limb of the seasonal hydrograph than on the fallinglimb and recession. Similarly, storm hydrographs usuallycarry the highest concentrations on the rising limb (Striffler,1963; Paustian and Beschta, 1979). Stratification of data byfactors such as limb and season often improves rating curvesand predictions of sediment yield (Walling, 1977; Loughran,1976).
Both seasonal decline and hysteresis during individualhydrograph peaks were evident for suspended sediment
684 WATER RESOURCES BULLETIN
x
0
x
A
0
A0A
A
0.i
A <0 A AXAX A nA 0o m
0 xx 0
TABLE 2. Pre- and Post-Disturbance Suspended Sediment RatingCurve Regression Equations for the Upper and Lower Stations.
A
0.1
A
Legend0 PRE—DIS1URBANCE
ROADS
X ROADS AND LOGGING
-J
z0
zU0z00I-zUcUU,)
LiazLi0(I)
U,)]
1 10
DISCHARGE (LITERS/SEC)
Figure 2. Pre- and Post-Disturbance Regressions of SuspendedSediment on Discharge for the Upper Station.
100
z0I—
Li0z00I—zLi
aLiU,)
aLiazLiU-)
U,
100 Model: Ln(TSS mg/i) a + b(in(Q its)).
10
x
x
A
xx
x
0
0 0Legend
0 PRE—DISruRBANcE
ROADS
X ROADS AND LOGGING
1 10DISCHARGE (LITERs/sEc)
100

Suspended Sediment and Turbidity Following Road Construction and Logging in Western Montana
concentrations during the snowmelt hydrographs in 1984 and1985. Hysteretic effects were especially pronounced in the1985 lower station record (Figure 4). Suspended sedimentconcentrations were five to ten times higher on the risinglimb than on the falling limb during individual peaks occur-ring on Julian days 77, 93, and 101. Peak sediment concen-trations precede discharge peaks by several days, and sedi-ment concentrations during discharge peaks may actuallyreturn to near prepeak levels. This desynchronization of dis-charge and sediment peaks weakens stratification of data byrising and falling limbs, unless observations at the crest arediscarded. This is unfortunate since sediment concentrationsduring peak discharges are often of the greatest interest.Nevertheless, multiple regression at the lower station during1985 showed the limb to be a significant predictor of sedi-ment concentration (P = 3.8 percent), explaining more of thevariance than discharge (21 versus 5 percent). Striffler (1963)reported similar results for 20 sampling stations in the Tobac-co River watershed in northern Michigan, were limb explained43 percent of the variance in sediment concentration versus1 percent for discharge.
The phenomenon of seasonal decline is also apparent inFigure 4; the sediment concentration on Julian day 101 washalf that on day 93, although discharge on day 101 was twice
45 -
40 -
that of day 93. The peak of 25 liters/second on day 93 wasapparently of sufficient magnitude and duration to flushmuch of the readily available sediment from the channel.Sediment is rapidly transported from the watershed duringspring snowmelt. For both stations, 65 to 75 percent ofthe suspended load was transported during April, and mostof this was actually transported within several days duringthe rising limb of the maximum flow.
The top station experienced a sequence of discharge peakssimilar to those at the lower station in 1985. Sediment trans-port was quite different (Figure 5). Hysteresis was presentduring the major peak of Julian day 103 but was less con-sistent otherwise. Seasonal decline appeared to be absent.In particular, sediment concentrations during days 115 to 125were anomalously high and probably represent new additionsof sediment to the channel from collapse of undercut banks.Presumably the undisturbed upper station has more severesupply limitations than the lower station, yet the anticipatedhysteretic effects were less pronounced. This may reflectthe overriding importance of stochastic processes such as bankcaving in determining sediment loads for extremely supply-limited systems.
Data for 1984 are probably more representative of com-plex conditions typically encountered during spring snowmelt
JULIAN DATE
Figure 4. Suspended Sediment, Turbidity, and Discharge at the LowerStation in 1985 After Road Construction and Logging.
685 WATER RESOURCES BULLETIN
60
50
403I—z
0
3I—
30
-J
0
F-z30
0I-u
25 -0Lu0Z 20 -LuciCE)15-Cl)
-J
0F-
5-
0-
20
10
0z00Lu(I)
CE)
i-uI—-J
Lu0I00
070 90 110 130

(Figures 6 and 7). The hydrographs were multi-peaked as aresult of numerous rain and rain-on-snow events; althoughhysteretic effects were evident for both stations, thesediment-discharge relationship is unclear. Multiple regres-siôn for data from the lower station during 1984 yieldedthe following equation:
TSS(mg/l) = 2.20 + 0.18(Q l/s) + 1.22(dQ/dt)
— 1 .60(dQJdt x Limb)
which improved the fit of the bivariate rating curve from0.35 to 0.61 by incorporating the variable dQ/dt, and aninteraction term, the product of dQ/dt and a dummy variablefor limb. The predictive value of such an equation developedfrom limited data is suspect, but it serves to ifiustrate thatsediment concentrations may be a intricate function of hy.drograph characteristics.
Sediment concentration is poorly modeled as a simplepower function of discharge, and models for supply limitedsystems need to incorporate a variable that accounts for thehistory of antecedent conditions. VanSickle and Beschta(1983) have included a supply function that simulates deple-tion and replenishment of discrete sediment compartments,and future refinement of this approach promises to improve
predictions of sediment concentration in supply limitedsituations -
TurbidityTurbidity has long been considered an index of suspended
solids (Bull and Darby, 1928; Grassy, 1943), and its expe-dient measurement has prompted state regulatory agenciesthroughout the Northwest to adopt standards that defineacceptable/unacceptable sediment loads in terms of turbidity
(1) units (NTU's). However, turbidity is not a measurement ofsuspended sediment concentration. Turbidity is due to com-plex interactions of solution color, particle size and shape,refractive index, solute concentration, and dissolved air, andany measurement of turbidity is an integration of the opti-cal properties of all these factors. Thus, turbidity may ormay not reflect actual sediment loads.
Where inorganic sediment is the dominant factor, turbiditymay be a useful predictor of sediment concentration. Cor-relations between suspended sediment and turbidity in naturalstream systems have ranged from excellent to poor (Kunideand Corner, 1971; Costa, 1977; Larson, et al., 1978; Setter-gren, et a!., 1980; Stednick, 1980; Beschta, 1980). Larson,et aL (1978), found differences in regressions from adjacentwatersheds, indicating the need for development of site-specific predictive equations. In addition, the ratio of
686 WATER RESOURCES BULLETIN
Anderson and Potts
-J
C-)
I—zuJ
CLiiC,)
CwCzLiJ0(Ti3(I)-j
3I—z
aa::3I—
6-
5-
4-
3.
2-
•1—
0-
12
11
10
9
8
7
6
5
4
3
2
1
az00w(I)
(I)
wI—-jLii0
0(TIa
70 90 110 130
JULIAN DATE
Figure 5. Suspended Sediment, Turbidity, and Discharge at the UpperStation in 1985 After Road Construction and Logging.

sediment concentration (mg/i) to turbidity (NTU), or coeffi-dent of fineness, has been shown to be a function of dis-charge (Grassy, 1943) and is subject to hysteretic effectsduring storms (Beschta, 1980). Nevertheless, turbidity recordsmay prove superior to sediment rating curves for calculatingsediment yield where sediment production may be wealdyrelated to discharge (Truhiar, 1976).
Turbidity records for 1984 and 1985 (Figures 4 to 7)show that turbidity, like suspended sediment, is subject tohysteresis and seasonal decline. Low discharges occurringbefore the peak flow are typically very turbid relative toequivalent discharges following the peak. Measurements ofturbidity before and after filtration showed colloidal particlesfmer than 0.45ji were responsible for 50-70 percent of thetotal turbidity during 1984.
Like the suspended sediment-discharge model, regressionanalysis of the suspended sediment-turbidity relationshipgenerally follows the form YaXb, where X is turbidity, Yis suspended sediment, and a and b are coefficients from theintercept and slope of the log-log plot. Individual regressionsof sediment on turbidity (Figures 8 and 9, Table 3) arestatistically significant at the 95 percent confidence level forboth stations, and none of these regressions are statisticallydifferent from one another (o = 0.05). Coefficients of deter-mination are low, especially for the undisturbed upper station,
which had characteristically low sediment concentrations andturbidities. Poor correlations probably reflect random mea-surement error, as well as the increasing impOrtalice of factorssuch as dissolved air in determining turbidity. The sediment-turbidity relationship at the lower station was discharge de-pendent, with the coefficient of fmeness being directly pro-portional to discharge. For 1984 data, multiple regressionyielded the following equation:
Cfine = 0.209 + 0.238(Peak) + 0.021(Q its) (2)
where discharge explained 41 percent of the variation in thecoefficient of fineness, and a dummy variable for pre-/post-peak explained an additional 7 percent. The dependence ofthe sediment-turbidity relationship on these factors is under-standable in terms of stream power and supply phenomena.Since turbidity caused by inorganic sediment is most sträñgiydependent on the fine fractions (Hoistrom and Hawkins,1980), it follows that turbidity will be correlated to sedimentconcentration to the degree that the fme fractions are relatedto the total sediment load. At low flows, fines predominate,and turbidity is high relative to the suspended load. As dis-charge (surrogate for stream power) increases, larger particlesless responsible for turbidity are recruited from the channel,and the suspended load becomes large relative to the turbidity.
687 WATER RESOURCES BULLETIN
Suspended Sediment and Turbidity Following Road Construction and Logging in Western Montana
Q
70 -
'II
-J
0
I—zuJ
aUJ(I)
aIdazId0(I)-J
70 -
60 -
50 -
40 -
30 -
20 -
10-
0—
363432302826
'24F-. 22
2016H 14
1210
8
642
IiIIIi
SUSPENDED SEDIMENT•0-
DISCHARGE
TURBIDITY 50-
40-
30 -
20-
az00Id(1W)
1-c)
IdH-J
UJ0I0(1)a
A\_4\ 10-
I I I I I I I I I I50 70 90 110 130 150 170 190 210 230 250
JULIAN DATE
Figure 6. Suspended Sediment, Turbidity, and Discharge at theLower Station in 1984 After Road Construction.

Figure 7. Suspended Sediment, Turbidity, and Discharge at theUpper Station in 1985 After Road Construction.
Figure 8. Regressions of Suspended Sediment on Turbidityat the Lower Station for 1984 gnd 1985.
Figure 9. Regressions of Suspended Sediment on Turbidityat the Upper Station for 1984 and 1985.
688 WATER RESOURCES BULLETIN
Anderson and Potts
9
B
7
6
DI—z
0
JF—
9-
8-
7-
6-
5-
4-
3-
2-
1—
0-
4
3
2
rs0z00tJ(I)
CI)
LUI—-J
LU0I0C/)
0
1
0
-J
0
F-zU0LUC/)
0U0zLU0Ci)
Ci)
-J
—' 10
I10.1
V)
wc JzU0(1)
j0.010.1
50 70 90. 110 130JULIAN DATE
150 170 190 210 230 250
x
AA
x
xx
xxA
AA
100
z0]x
x
A
LegendA ROADS
>( ROADS AND LOGGING
x
1bTURGIDITY (NTU),,
ido 1 doTURBIDITY (NTu)
LegendA ROADS
)C ROADS AND LOGGING

Suspended Sediment and Turbidity Following Road Construction and Logging in Western Montana
Exhaustion of fuse colloidal particles at elevated dischargesalso contributes to the increasing coefficient of fineness.Despite the discharge dependency of the sediment-turbidityrelationship, correlations were higher than those of the sedi-ment rating curves, and unlike the rating curves, all turbidityregressions were statistically significant. Turbidity is thusindicated as a better parameter than discharge for predictionof sediment concentration in this supply-limited system.
TABLE 3. Regression Equations of Suspended Sediment onTurbidity for the Upper and Lower Stations.
Station Year a b n r P
Lower 19841985
—0.08220.1080
0.74630.5476
6136
0.340.34
0.000.00
Upper 19841985
—1.1889—0.8471
0.67590.6302
5934
0.060.19
0.030.00
ACKNOWLEDGMENTS
This project was supported by Mclntire-Stennis Funds, with thecooperation and assistance of Champion International Corp.-Timber-lands.
LITERATURE CITED
A.PHA (American Public Health Association), 1975. Standard Methodsfor Examination of Water and Wastewater. American PublicHealth Association, Washington, D.C.
Beschta, R., 1978. Long-Term Patterns of Sediment ProductionFollowing Road Construction and Logging in the Oregon CoastRange. Water Resources Research 14(6) :1011-1016.
Beschta, R., 1980. Turbidity and Suspended Sediment Relationships.In: Proc. Symposium on Watershed Management, Vol. I, Irriga-tion and Drainage Div., ASCE, Boise, Idaho, pp. 271-282.
Beschta, R., 1983. Sediment and Organic Matter Transport in Moun-tain Streams of the Pacific Northwest. In: Proc. of the D. B.Simons Symposium on Erosion and Sedimentation, Simons, Li andAssociates, Ft. Collins, Colorado, pp. 1-69 to 1-89.
Bull, A. W. and G. M. Darby, 1928. Sedimentation Studies of TurbidAmerican River Water. Journal American Water Works Associa-tion 19:284.
Campbell, F. B. and H. A. Bauder, 1940. A Rating-Curve Method forDetermining Silt Discharge of Streams. EOS Trans. AGU 21 :603-607.
Cline, R., G. Cole, W. Megahan, R. Patten, and J. Potyondy, 1981.Guide for Predicting Sediment Yields from Forested Watersheds.USDA Forest Service, Northern Region, Missoula, Montana, 41 pp.
Costa, J. E., 1977. Sediment Concentration and Duration in StreamChannels. Journal Soil and Water Conservation 32:168-170.
Grassy, R. G., 1943. Use of Turbidity Determinations in Estimatingthe Suspended Load of Natural Streams. Journal American WaterWorks Association 35 :439.
Heidel, S. G., 1956. The Progressive Lag of Sediment Concentrationwith Flood Waves. Trans. American Geophys. Union 37:56-66.
Hoistrom, T. A. and R. H. Hawkins, 1980. Particle Size DistributionEffects on Turbidity. In: Proc. Symposium on Watershed Man-agement, Vol. I, Irrigation and Drainage Div., ASCE, Boise, Idaho,pp. 283-297.
King, J. G., 1979. Water Quality Characteristics of the Horse CreekWatersheds in North Central Idaho. Research Technical Comple-tion Report, Project A05 1-IDA, Idaho Water Resources Res. Inst.,University of Idaho, Moscow, Idaho.
Kunkie, 5. H. and G. H. Corner, 1971. Estimating Suspended Sedi-ment Concentrations in Streams by Turbidity Measurements.Journal Soil and Water Conservation 26:18-20.
Lane, E. W., E. J. Carlson, and 0. 5. Hanson, 1949. Low TemperatureIncreases Sediment Transportation in Colorado River. Civil En-gineering 19:619-620.
Larson, A. G., D. D. Wooldridge, and A. R. Wald, 1978. Turbidity-Suspended Sediment Relations in Forest Streams of the WesternOlympics. Final Report, Part II, College of Forest Resources,University of Washington, Seattle, Washington, 19 pp.
Leopold, L. B. and T. Maddock, 1953. The Hydraulic Geometry ofStream Channels and Some Physiographic Implications. USGSProfessional Paper 252, 59 pp.
Loughran, R. J., 1976. The Calculation of Suspended-Sediment Trans-port from Concentration v. Discharge Curves. Catena 3:45-61.
Marston, R. A., 1978. Morphometric Indices of Streamfiow andSediment Yield from Mountain Watersheds in Western Oregon.USDA Forest Service, Siuslaw National Forest, Report 00-04T0-9-226, 82 pp.
McPherson, H. J., 1975. Sediment Yields from Intermediate-SizedStream Basins in Southern Alberta. Journal Hydrology 25:243-257.
Megahan, W. F., 1975. Sedimentation in Relation to Logging Activi-ties in the Mountains of Central Idaho. In: Present and ProspectiveTechnology for Predicting Sediment Yields and Sources. USDAAgricultural Research Service ARS-S-40, pp. 74-82.
Milhous, R. T. and P. C. Klingeman, 1973. Sediment Transport Sys-tern in a Gravel-Bottomed Stream. In: Proceedings of a Con-ference on Hydraulic Engineering and the Environment. ASCE,Bozeman, Montana, August 15-17, 11 pp.
Packer, P., 1967. Criteria for Designing and Locating Logging Roadsto Control Sediment. Forest Sd. 13(1):2-17.
Paustian, S. and R. Beschta, 1979. The Suspended Sediment Regimeof an Oregon Coast Range Stream. Water Resources Bulletin 15(1):144-15 4.
Scott, D. F., 1983. Pre-Disturbance Characterization of a ForestedMountain Drainage Basin in the Belt Series of Western Montana.M.S. Thesis, University of Montana, Missoula, Montana, 78 pp.
Settergren, C. D., R. M. Nugent, and G. S. Henderson, 1980. TimberHarvest and Water Yields in the Ozarks. In: Proc. Symposium onWatershed Management, Vol. II, Irrigation and Drainage Div., ASCE,Boise, Idaho, pp. 661-668.
Snyder, G. T., 1976. The Northern Rocky Mountain Water QualityBenchmark System: A Procedure for Stratifying Natural Chemicaland Physical Quality of Streamwater. Ph.D. Dissertation, Univer-sity of Idaho, Moscow, Idaho.
Sokal, R. R. and F. J. Rohlf, 1981. Biometry. W. H. Freeman andCo., San Francisco, California, 859 pp.
Stednick, J. D., 1980. Alaska Water Quality Standards and BMPs.In: Proc. Symposium on Watershed Management, Vol. II, Irrigationand Drainage Div., ASCE, Boise, Idaho, pp. 72 1-730.
Stowell, R., A. Espinosa, T. C. Bjornn, W. S. Platts, D. C. Burns, andJ. S. Irving, 1983. Guide for Predicting Salrnonid Response toSediment Yields in Idaho Batholith Watersheds. USDA Forest Ser-vice Northern and Intermountain Regions, Missoula, Montana, andOgden, Utah, 95 pp.
Striffler, D. W., 1963. Suspended Sediment Concentrations in a Michi-gan Trout Stream as Related to Watershed Characteristics. In:Proc. Federal Inter-Agency Sedimentation Conference, Misc. Pub.970, USDA Agricultural Research Service, Washington, D.C., pp.144-150.
Truhiar, J. R., 1976. Determining Suspended Sediment Loads fromTurbidity Records. In: Proc. Third Interagency SedimentationConference, Water Resources Council, Denver, Colorado, pp. 65-74.
689 WATER RESOURCES BULLETIN

Anderson and Potts
VanSickle, J. and R. Beschta, 1983. Supply-Based Models of Sus-pended Sediment Transport in Streams. Water Resources Re-search 19(3):768-778.
Walling, D. E., 1977. Assessing the Accuracy of Suspended SedimentRating Curves for a Small Basin. Water Resources Research 13(3):53 1-53 8.
690 WATER RESOURCES BULLETIN