Surveillance for Waterborne Disease Outbreaks and … for Waterborne Disease Outbreaks and Other...
80
Surveillance Summaries / Vol. 60 / No. 12 September 23, 2011 Surveillance for Waterborne Disease Outbreaks and Other Health Events Associated with Recreational Water — United States, 2007–2008 and Surveillance for Waterborne Disease Outbreaks Associated with Drinking Water — United States, 2007–2008 Morbidity and Mortality Weekly Report U.S. Department of Health and Human Services Centers for Disease Control and Prevention
Transcript of Surveillance for Waterborne Disease Outbreaks and … for Waterborne Disease Outbreaks and Other...

Surveillance Summaries / Vol. 60 / No. 12 September 23, 2011
Surveillance for Waterborne Disease Outbreaks and Other Health Events Associated with Recreational Water —
United States, 2007–2008 and
Surveillance for Waterborne Disease Outbreaks Associated with Drinking Water — United States, 2007–2008
Morbidity and Mortality Weekly Report
U.S. Department of Health and Human ServicesCenters for Disease Control and Prevention
hxv5
Text Box
Please note: An erratum has been published for this issue. To view the erratum, please click here.

Surveillance Summaries
The MMWR series of publications is published by the Office of Surveillance, Epidemiology, and Laboratory Services, Centers for Disease Control and Prevention (CDC), U.S. Department of Health and Human Services, Atlanta, GA 30333.Suggested Citation: Centers for Disease Control and Prevention. [Title]. MMWR 2011;60(No. RR-#):[inclusive page numbers].
Centers for Disease Control and PreventionThomas R. Frieden, MD, MPH, Director
Harold W. Jaffe, MD, MA, Associate Director for ScienceJames W. Stephens, PhD, Director, Office of Science Quality
Stephen B. Thacker, MD, MSc, Deputy Director for Surveillance, Epidemiology, and Laboratory ServicesStephanie Zaza, MD, MPH, Director, Epidemiology and Analysis Program Office
MMWR Editorial and Production StaffRonald L. Moolenaar, MD, MPH, Editor, MMWR SeriesChristine G. Casey, MD, Deputy Editor, MMWR Series
Teresa F. Rutledge, Managing Editor, MMWR SeriesDavid C. Johnson, Lead Technical Writer-Editor
Jeffrey D. Sokolow, MA, Project Editor
Martha F. Boyd, Lead Visual Information SpecialistJulia C. Martinroe, Stephen R. Spriggs, Terraye M. Starr
Visual Information SpecialistsQuang M. Doan, MBA, Phyllis H. King
Information Technology Specialists
MMWR Editorial BoardWilliam L. Roper, MD, MPH, Chapel Hill, NC, Chairman
Virginia A. Caine, MD, Indianapolis, INJonathan E. Fielding, MD, MPH, MBA, Los Angeles, CA
David W. Fleming, MD, Seattle, WAWilliam E. Halperin, MD, DrPH, MPH, Newark, NJ
King K. Holmes, MD, PhD, Seattle, WADeborah Holtzman, PhD, Atlanta, GA
John K. Iglehart, Bethesda, MDDennis G. Maki, MD, Madison, WI
Patricia Quinlisk, MD, MPH, Des Moines, IAPatrick L. Remington, MD, MPH, Madison, WI
Barbara K. Rimer, DrPH, Chapel Hill, NCJohn V. Rullan, MD, MPH, San Juan, PR
William Schaffner, MD, Nashville, TNAnne Schuchat, MD, Atlanta, GA
Dixie E. Snider, MD, MPH, Atlanta, GAJohn W. Ward, MD, Atlanta, GA
CONTENTSSurveillance for Waterborne Disease Outbreaks and Other Health
Events Associated with Recreational Water — United States, 2007–2008
Introduction ............................................................................................................2
Background .............................................................................................................2
Methods ....................................................................................................................3
Results .......................................................................................................................5
Discussion ............................................................................................................. 16
Conclusion ............................................................................................................ 28
Acknowledgments ............................................................................................. 29
References ............................................................................................................. 30
Appendix A ........................................................................................................... 33
Appendix B ........................................................................................................... 36
Surveillance for Waterborne Disease Outbreaks Associated with Drinking Water — United States, 2007–2008
Introduction ......................................................................................................... 39
Methods ................................................................................................................. 41
Results .................................................................................................................... 44
Discussion ............................................................................................................. 54
Conclusion ............................................................................................................ 62
Acknowledgments ............................................................................................. 65
References ............................................................................................................. 65
Appendix A ........................................................................................................... 69
Appendix B ........................................................................................................... 73

Surveillance Summaries
MMWR / September 23, 2011 / Vol. 60 / No. 12 1
Surveillance for Waterborne Disease Outbreaks and Other Health Events Associated with Recreational Water —
United States, 2007–2008Michele C. Hlavsa, MPH1
Virginia A. Roberts, MSPH1
Ayana R. Anderson, MPH2
Vincent R. Hill, PhD1
Amy M. Kahler, MS1
Maureen Orr, MS2
Laurel E. Garrison, MPH3
Lauri A. Hicks, DO3
Anna Newton, MPH1,4
Elizabeth D. Hilborn, DVM5
Timothy J. Wade, PhD5
Michael J. Beach, PhD1
Jonathan S. Yoder, MSW, MPH11Division of Foodborne, Waterborne, and Environmental Diseases, National Center for Emerging and Zoonotic Infectious Diseases, CDC
2Division of Health Studies, Agency for Toxic Substances and Disease Registry3Division of Bacterial Diseases, National Center for Immunization and Respiratory Diseases, CDC
4Atlanta Research and Education Foundation, Decatur, Georgia5U.S. Environmental Protection Agency, Research Triangle Park, North Carolina
Abstract
Problem/Condition: Since 1978, CDC, the U.S. Environmental Protection Agency, and the Council of State and Territorial Epidemiologists have collaborated on the Waterborne Disease and Outbreak Surveillance System (WBDOSS) for collecting and reporting data on waterborne disease outbreaks associated with recreational water. This surveillance system is the primary source of data concerning the scope and health effects of waterborne disease outbreaks in the United States. In addition, data are collected on other select recreational water–associated health events, including pool chemical–associated health events and single cases of Vibrio wound infection and primary amebic meningoencephalitis (PAM).Reporting Period: Data presented summarize recreational water–associated outbreaks and other health events that occurred during January 2007–December 2008. Previously unreported data on outbreaks that have occurred since 1978 also are presented.Description of the System: The WBDOSS database includes data on outbreaks associated with recreational water, drinking water, water not intended for drinking (excluding recreational water), and water use of unknown intent. Public health agencies in the states, the District of Columbia, U.S. territories, and Freely Associated States are primarily responsible for detecting and investigating waterborne disease outbreaks and voluntarily reporting them to CDC using a standard form. Only data on outbreaks associated with recreational water are summarized in this report. Data on other recreational water–associated health events reported to CDC, the Agency for Toxic Substances and Disease Registry (ATSDR), and the U.S. Consumer Product Safety Commission (CPSC) also are summarized.Results: A total of 134 recreational water–associated outbreaks were reported by 38 states and Puerto Rico for 2007–2008. These outbreaks resulted in at least 13,966 cases. The median outbreak size was 11 cases (range: 2–5,697 cases). A total of 116 (86.6%) outbreaks were associated with treated recreational water (e.g., pools and interactive fountains) and resulted in 13,480 (96.5%) cases. Of the 134 outbreaks, 81 (60.4%) were outbreaks of acute gastrointestinal illness (AGI); 24 (17.9%) were outbreaks of dermatologic illnesses, conditions, or symptoms; and 17 (12.7%) were outbreaks of acute respiratory illness. Outbreaks of AGI resulted in 12,477 (89.3%) cases.
The etiology was laboratory-confirmed for 105 (78.4%) of the 134 outbreaks. Of the 105 outbreaks with a laboratory-confirmed etiology, 68 (64.8%) were caused by parasites, 22 (21.0%) by bacteria, five (4.8%) by viruses, nine (8.6%) by chemicals or toxins, and one (1.0%) by multiple etiology types. Cryptosporidium was confirmed as the etiologic agent
Corresponding author: Michele C. Hlavsa, MPH, Division of Foodborne, Waterborne, and Environmental Diseases, National Center for Emerging Zoonotic and Infectious Diseases, CDC, 1600 Clifton Road, N.E., MS C-9, Atlanta, GA 30333. Telephone: 404-639-1700; E-mail: [email protected].

Surveillance Summaries
2 MMWR / September 23, 2011 / Vol. 60 / No. 12
of 60 (44.8%) of 134 outbreaks, resulting in 12,154 (87.0%) cases; 58 (96.7%) of these outbreaks, resulting in a total of 12,137 (99.9%) cases, were associated with treated recreational water. A total of 32 pool chemical–associated health events that occurred in a public or residential setting were reported to WBDOSS by Maryland and Michigan. These events resulted in 48 cases of illness or injury; 26 (81.3%) events could be attributed at least partially to chemical handling errors (e.g., mixing incompatible chemicals). ATSDR’s Hazardous Substance Emergency Events Surveillance System received 92 reports of hazardous substance events that occurred at aquatic facilities. More than half of these events (55 [59.8%]) involved injured persons; the most frequently reported primary contributing factor was human error. Estimates based on CPSC’s National Electronic Injury Surveillance System (NEISS) data indicate that 4,574 (95% confidence interval [CI]: 2,703–6,446) emergency department (ED) visits attributable to pool chemical–associated injuries occurred in 2008; the most frequent diagnosis was poisoning (1,784 ED visits [95% CI: 585–2,984]). NEISS data indicate that pool chemical–associated health events occur frequently in residential settings. A total of 236 Vibrio wound infections were reported to be associated with recreational water exposure; 36 (48.6%) of the 74 hospitalized vibriosis patients and six (66.7%) of the nine vibriosis patients who died had V. vulnificus infections. Eight fatal cases of PAM occurred after exposure to warm untreated freshwater.Interpretations: The 134 recreational water–associated outbreaks reported for 2007–2008 represent a substantial increase over the 78 outbreaks reported for 2005–2006 and the largest number of outbreaks ever reported to WBDOSS for a 2-year period. Outbreaks, especially the largest ones, were most frequently associated with treated recreational water and characterized by AGI. Cryptosporidium remains the leading etiologic agent. Pool chemical–associated health events occur frequently but are preventable. Data on other select recreational water–associated health events further elucidate the epidemiology of U.S. waterborne disease by highlighting less frequently implicated types of recreational water (e.g., oceans) and detected types of recreational water–associated illness (i.e., not AGI).Public Health Actions: CDC uses waterborne disease outbreak surveillance data to 1) identify the types of etiologic agents, recreational water venues, and settings associated with waterborne disease outbreaks; 2) evaluate the adequacy of regulations and public awareness activities to promote healthy and safe swimming; and 3) establish public health priorities to improve prevention efforts, guidelines, and regulations at the local, state, and federal levels.
IntroductionDuring 1920–1970, data on waterborne disease outbreaks
in the United States were collected by multiple researchers and federal agencies (1). Since 1971, CDC, the U.S. Environmental Protection Agency (EPA), and the Council of State and Territorial Epidemiologists (CSTE) have collaborated on the Waterborne Disease and Outbreak Surveillance System (WBDOSS), which tracks outbreaks associated with drinking water and other water exposures (2–12). Data on outbreaks associated with recreational water have been collected by WBDOSS* since 1978 (13–15). Data on 2007–2008 outbreaks associated with drinking water are presented separately (16).
Since 1978, surveillance activities have expanded to include multiple types of outbreaks and other health events associated with recreational water. Recreational water–associated outbreaks of Pontiac fever (PF) were first included in the 1981 surveillance summary (17); recreational water–associated outbreaks of Legionnaires’ disease (LD) were added in the 2001–2002 surveillance summary; however, no LD outbreaks were reported for those years (15). Data on single cases of recreational water–associated vibriosis were first added to the 2003–2004 surveillance summary (14). Pool chemical–associated health
events reported to CDC were first included in the 2005–2006 surveillance summary (13). Agency for Toxic Substances and Disease Registry (ATSDR) and U.S. Consumer Product Safety Commission (CPSC) data on pool chemical–associated health events have been added to this 2007–2008 surveillance summary.
The data provided in this report represent only a portion of the burden of illness and injury associated with recreational water. They do not include endemic waterborne disease cases (i.e., sporadic cases not known to be associated with an out-break), all types of other recreational water–associated health events, nor estimates of the number of unrecognized and unre-ported waterborne disease outbreaks or other health events.
BackgroundRegulation of Recreational Water QualityIn the United States, state and local governments establish
and enforce regulations for protecting recreational water from naturally occurring and human-made contaminants. No federal regulatory agency has authority over treated recreational water (e.g., pools and interactive fountains), and no minimum federal design, construction, operation, disinfection, or filtration standards exist, except the Virginia Graeme Baker Pool and * Available at http://www.cdc.gov/healthywater/statistics/wbdoss/index.html.

Surveillance Summaries
MMWR / September 23, 2011 / Vol. 60 / No. 12 3
Spa Safety Act (15 U.S.C. §§ 8001 et seq.), which aims to prevent entrapment. Swimming pool codes are developed and enforced by individual state and local public health agencies, resulting in substantial variation across the country in terms of regulation, compliance, and enforcement.
EPA sets water quality guidelines for natural, untreated recreational water (e.g., lakes, rivers, and oceans). In 1986, EPA developed recommended bacterial water quality criteria for coastal recreational waters (18) and, in 2004, established federal standards for those states and territories that had not yet adopted water quality criteria that met or exceeded the 1986 criteria (19). For freshwater, full-body contact beaches (e.g., lakes and rivers), EPA recommends that the monthly geometric mean water quality indicator concentration be <33 CFU/100mL for enterococci or <126 CFU/100mL for Escherichia coli. For marine water, full-body contact beaches, EPA recommends that the monthly geometric mean water quality indicator concentration be <35 CFU/100mL for enterococci. However, state and local jurisdictions have discretionary authority to adopt specific criteria for a designated use, determine the extent and frequency of monitoring and testing, and choose which interventions should be implemented when state limits are exceeded (e.g., posting signs to alert visitors to water contamination or closing the beach to swimmers). EPA provides grants to eligible coastal and Great Lakes states to help them implement programs to monitor water quality at the beach and to notify the public when problems are detected. Beach Watch, EPA’s Action Plan for Beaches and Recreational Waters, was published in 1999 as part of the Clean Water Action Plan. The mission of Beach Watch is to assist state, tribal, and local authorities in strengthening and extending existing programs to protect users of fresh and marine recreational waters. Congress enacted the BEACH Act of 2000 (33 U.S.C. §§ 1346 and 1375a), which directed EPA to update its guidelines for recreational water use on the basis of improved water quality indicators and testing. To this end, since 2002, EPA has been collaborating with CDC on the National Epidemiologic and Environmental Assessment of Recreational (NEEAR) Water Study.
MethodsData Sources
Public health agencies in the states, the District of Columbia (DC), U.S. territories, and the Freely Associated States (FAS)†
have the primary responsibility for detecting and investigating waterborne disease outbreaks, which they report voluntarily to CDC using a standard form (CDC 52.12).§ The form solicits
data on characteristics of outbreaks (e.g., number of cases, time, and location), results from epidemiologic and environmental investigations, and results from clinical specimen and water sample testing. CDC annually requests reports of outbreaks from persons designated as waterborne disease coordinators and obtains additional information regarding epidemiologic investigations, water quality, and water treatment to supplement submitted outbreak reports as needed. Data on all of the outbreaks in this summary were collected through paper-based reporting. Numeric and text data are abstracted from outbreak report forms and supporting documents and analyzed by using SAS 9.2 (SAS Institute, Inc. Cary, North Carolina).
National reporting includes only data on waterborne disease outbreaks. Data on pool chemical–associated health events that occurred in a public or residential setting and on single cases of primary amebic meningoencephalitis (PAM) caused by Naegleria fowleri also are solicited from coordinators.
To ensure completeness of legionellosis outbreak data, CDC reviewed and compared data from WBDOSS with data from the Travel-Associated Legionellosis in the United States System. In addition, legionellosis outbreak data were abstracted from historic Epidemic Intelligence Service outbreak investigation reports and peer-reviewed publications and entered into the WBDOSS database.
Other data presented in this surveillance summary have been reported to ATSDR’s Hazardous Substance Emergency Events Surveillance (HSEES) System,¶ CPSC’s National Electronic Injury Surveillance System (NEISS), and CDC’s Cholera and Other Vibrio Illness Surveillance (COVIS) System. For this report, the HSEES database was searched for data on hazardous substance events that occurred at aquatic facilities during 2007–2008. To identify such events, comment and synopsis variables were queried for the terms “pool,” “Jacuzzi,” “spa,” “hot tub,” “whirlpool,” “chlorine,” “fountain,” and “water park” (20). Although “chlorine” was the only chemical term queried, other chemicals were not excluded from the analysis. Only events that occurred on-site at aquatic facilities, regardless of setting (e.g., hotel/motel or waterpark), were included in the analysis. Events that were caused by pool chemicals but did not occur on-site at aquatic facilities (e.g., at a warehouse) were excluded. NEISS captures data on emergency department (ED) visits for injuries associated with consumer products, specifically diagnosis and patient demographic data. The methodology for analysis of NEISS data on pool chemical–associated health events and the findings of a detailed analysis of 2007 NEISS data are presented elsewhere (21); this report includes a summary of 2008 NEISS data. Data on cases of
¶ Participating states: Colorado, Florida, Iowa, Louisiana, Michigan, Minnesota, North Carolina, New Jersey, New York, Oregon, Texas, Utah, Washington, and Wisconsin.
† Comprising the Republic of the Marshall Islands, the Federated States of Micronesia, and the Republic of Palau; formerly part of the U.S.-administered Trust Territory of the Pacific Islands.
§ Available at http://www.cdc.gov/healthywater/statistics/wbdoss/nors/forms_archive.html.

Surveillance Summaries
4 MMWR / September 23, 2011 / Vol. 60 / No. 12
vibriosis are reported to CDC by use of a COVIS report form.** Vibriosis was added to the list of nationally notifiable diseases in January 2007 and is reportable in 50 states. As described previously, this report summarizes COVIS System data on cases with a reported recreational water exposure but no reported seafood consumption (14). Cases reported to have occurred in another jurisdiction were reassigned to the jurisdiction of exposure for analysis.
DefinitionsWaterborne Disease Outbreak
Two criteria must be met for a health event to be defined as a waterborne disease outbreak associated with recreational water: 1) two or more persons must be linked epidemiologically by time, location of exposure to water, and illness characteristics, and 2) the epidemiologic evidence must implicate recreational water or volatilization of water-associated compounds into the air sur-rounding the water as the probable source of illness. Outbreak reports with limited or no environmental data might be included in WBDOSS, but outbreak reports that lack epidemiologic data linking the outbreak to water are excluded. Two outbreak reports that were received are not included in this summary. After swimming in April 2008, a total of 13 members of a swim team in Florida developed AGI caused by norovirus. However, the epidemiologic evidence implicated a restaurant in which they had shared a meal. An outbreak of cryptosporidiosis in Maine in July 2007 among four persons who swam in a residential pool was not included because other common exposures could not be ruled out.
Recreational water venues include but are not limited to pools, interactive fountains, spas (or hot tubs), waterslides, and fresh or marine bodies of water. For this report, outbreaks are categorized by association with treated or untreated recreational water and by location of the water exposure (i.e., not on state of residence of the ill persons). Waterborne disease outbreaks occurring on cruise ships are not reported to WBDOSS; CDC’s Vessel Sanitation Program tracks outbreaks of acute gastrointestinal illness (AGI) occurring on cruise ships (22).
Other Recreational Water–Associated Health Events
Other recreational water–associated health events that do not meet the definition of an outbreak associated with recreational water are included in this summary because of their implications to the health and safety of the swimming public and aquatics staff. Some pool chemical–associated health events reported
to WBDOSS do not meet the outbreak definition (i.e., one case identified or not associated with recreational water). The HSEES System and NEISS do not focus on water exposure, and whether pool chemical–associated health events reported to these systems involved recreational water exposure is not always clear. Consequently, some pool chemical–associated health events reported to WBDOSS, the HSEES System, and NEISS are analyzed and presented separately from outbreak data.
Additional terms used in this report are defined elsewhere (Appendix A).
Strength-of-Evidence Classification for Waterborne Disease Outbreaks
In this report, all outbreaks reported to WBDOSS for 2007–2008 have been classified according to the strength of 1) epidemiologic and clinical laboratory data and 2) environmental data implicating water as the vehicle of transmission (Table 1). The classification (i.e., Classes I–IV) of outbreak investigations in this report is based on the epidemiologic and environmental data reported to WBDOSS. These classes were first delineated in the 1989–1990 surveillance report (10) and have since been updated.
Outbreaks and subsequent investigations occur under different circumstances, and not all outbreaks can be investigated rigorously. Classifications of II, III, or IV do not necessarily imply that the investigation was inadequate or incomplete because multiple factors (e.g., timeliness of outbreak detection) contribute to the ability to collect optimal epidemiologic, clinical laboratory, and environmental data.
Changes in 2007–2008 Surveillance Summary
Strength-of-Evidence ClassificationMolecular epidemiology is being used increasingly to
understand pathogen transmission patterns, detect outbreaks, and identify important risk factors and outbreak sources. The criteria used to determine the strength-of-evidence classifications have been revised to reflect the increasing use of molecular characterization of pathogens identified in clinical specimens and environmental samples collected during outbreak investigations. Molecular data that link multiple persons who had an identical water exposure now are considered adequate epidemiologic data to support a Class I or Class II assignment; previously, epidemiologic study data were required to receive a strength-of-evidence classification of I or II. Molecular data that link at least one person to the implicated water exposure now are considered adequate water quality data to support a Class I or Class III assignment. In this ** Available at http://www.cdc.gov/nationalsurveillance/PDFs/CDC5279_
COVISvibriosis.pdf.

Surveillance Summaries
MMWR / September 23, 2011 / Vol. 60 / No. 12 5
report, the previously used categories “epidemiologic data” and “water quality data” have been renamed “epidemiologic and clinical laboratory data” and “environmental data,” respectively.
Number of CasesFor this surveillance summary, case counts were based on the
estimated number of total cases if sufficient supporting evidence was provided. For example, this might include applying the attack rate found during a cohort study to the entire population exposed to contaminated water to estimate the total number of ill persons associated with an outbreak. If no “estimated ill” number was provided, the actual number of reported cases (e.g., laboratory-confirmed and probable cases as reported by the coordinator) was used. CDC requests that coordinators report only cases with primary exposure to water, so secondary cases (e.g., those resulting from person-to-person transmission among household members) are not included in case counts of waterborne disease outbreaks in WBDOSS.
ResultsWaterborne Disease Outbreaks
A total of 134 outbreaks associated with recreational water (84 in 2007 and 50 in 2008) were reported to CDC by 38 states and Puerto Rico (Tables 2–5; Figure 1). These 134 outbreaks resulted in at least 13,966 cases of illness (Table 6); the median number of cases associated with an outbreak was
11 (range: 2–5,697 cases). Minnesota reported 12 outbreaks, Florida reported 11, and New York reported eight. Short narratives on select outbreaks are provided in Appendix B.
Treated recreational water venues were associated with 116 (86.6%) outbreaks (Figure 2), resulting in 13,480 (96.5%) cases; the median number of cases in these outbreaks was 10.5 (range: 2–5,697 persons) (Tables 2 and 3). Of the 116 outbreaks, 50 (43.1%) were associated with exposures in settings in which recreational water was not the focus of activities (i.e., apartment complex, assisted living facility, child care center, farm, hotel/motel, membership club, school, or zoo).
Untreated venues were associated with the remaining 18 (13.4%) outbreaks (Figure 2), resulting in 486 (3.5%) cases; the median number of cases in these outbreaks was 13 (range: 2–200) (Tables 4 and 5). Of these 18 outbreaks, 15 (83.3%) were associated with fresh water and three (16.7%) with marine water.
The 134 outbreaks occurred in every calendar month (Figure 3); 83 (61.9%) started during June, July, or August. The route of entry implicated for each outbreak was ingestion for 81 outbreaks (60.4%), contact for 25 (18.7%), inhalation for 18 (13.4%), combined routes for six (4.5%), and unknown for four (3.0%) (Figure 2).
Illness and EtiologiesOf the 134 outbreaks, 81 (60.4%) were of AGI; 24 (17.9%)
of dermatologic illnesses, conditions, or symptoms; 17 (12.7%) of acute respiratory illness (ARI); one (0.7%) of ear-related illnesses, conditions, or symptoms; and one (0.7%) of other
TABLE 1. CDC strength-of-evidence classification of investigations of waterborne disease outbreaks — United States
Class Epidemiologic and clinical laboratory data Environmental data
I Provided and adequate Provided and adequate
Epidemiologic data provided about exposed and unexposed persons, with relative risk or odds ratio ≥2 or p-value <0.05; or
Laboratory data or historic information (e.g., history of a chlorinator or acid feed pump malfunction, no detectable free-chlorine residual, or a breakdown in circulation system); or
Molecular characterization of pathogens linked multiple persons who had a single identical exposure
Molecular characteristics of pathogens isolated from water and at least one clinical specimen were identical
II Provided and adequate Not provided or inadequate
Epidemiologic data provided about exposed and unexposed persons, with relative risk or odds ratio ≥2 or p-value <0.05; or
E.g., laboratory testing of water not conducted and no historic information available
Molecular characterization of pathogens linked multiple persons who had a single identical exposure
III Provided but limited Provided and adequate
Epidemiologic data provided that did not meet the criteria for Class I or II or claim made that ill persons had no exposures in common, besides water, but no data provided
Laboratory data or historic information (e.g., history of a chlorinator or acid feed pump malfunction, no detectable free-chlorine residual, or a breakdown in circulation system); or
Molecular characteristics of pathogens isolated from water and at least one clinical specimen were identical
IV Provided but limited Not provided or inadequate
Epidemiologic data provided that did not meet the criteria for Class I or II or claim made that ill persons had no exposures in common, besides water, but no data provided
E.g., laboratory testing of water not conducted and no historic information available

Surveillance Summaries
6 MMWR / September 23, 2011 / Vol. 60 / No. 12
See table footnotes on page 7.
TABLE 2. Waterborne disease outbreaks associated with treated recreational water (n = 74), by state/jurisdiction — Waterborne Disease and Outbreak Surveillance System, United States, 2007
State/Jurisdiction Month Class* Etiology
Predominant illness†
No. of cases§
(n = 10,749) Venue Setting
Alabama Aug IV Cryptosporidium AGI 5 Fill-and-drain pool Child care centerCalifornia Apr IV Escherichia coli O157:H7 AGI 11 Temporary waterslide Private residenceCalifornia Jun IV Norovirus genogroup II AGI 6 Interactive fountain Community/MunicipalityCalifornia Sep III Cryptosporidium AGI 2 Pool Aquatic facilityFlorida Jun IV Cryptosporidium AGI 25 Interactive fountain Community/municipal parkFlorida Jul IV Unidentified¶ AGI 6 Interactive fountain ZooFlorida Aug IV Cryptosporidium AGI 8 Pool Neighborhood/SubdivisionFlorida Aug III Chlorine gas ARI 13 Pool Apartment complexFlorida Sep IV Cryptosporidium parvum AGI 8 Wading pool WaterparkGeorgia Apr IV Unidentified Skin 2 Spa UnknownGeorgia Aug IV Cryptosporidium AGI 6 Pool, temporary
waterslideNeighborhood/Subdivision,
private residenceIdaho May II Norovirus genogroup II AGI 50 Pool, wading pool Community/MunicipalityIdaho Jun III E. coli O157:H7 AGI 31 Interactive fountain Community/MunicipalityIdaho Jul I Cryptosporidium hominis AGI 2,000 Interactive fountain Community/MunicipalityIdaho Aug II C. hominis AGI 32 Interactive fountain Community/MunicipalityIllinois Aug IV Cryptosporidium AGI 6 Wading pool Membership clubIllinois Aug IV Cryptosporidium AGI 4 Pool Community/MunicipalityIndiana May IV Unidentified ARI, AGI 9 Pool, spa Private residenceIowa Jan IV Unidentified Skin 4 Spa Hotel/MotelIowa Jan I Unidentified** Skin 20 Pool, spa Hotel/MotelIowa Feb IV Unidentified** Skin 10 Spa Hotel/MotelIowa Jun I Cryptosporidium AGI 238 Pool, wading pool Community, membership clubIowa Aug IV Cryptosporidium AGI 34 Pool Community/MunicipalityKansas Mar IV Unidentified Skin 5 Pool Community/MunicipalityKansas Jun IV Cryptosporidium AGI 79 Pool, interactive
fountainsWaterpark, community, private
residence, hotel/motelKansas Jul IV Cryptosporidium AGI 43 Pools Community/MunicipalityKentucky May IV Cryptosporidium AGI 131 Pools Community/MunicipalityMaryland Aug III Chlorine gas ARI 2 Pool Membership clubMassachusetts Aug IV Giardia intestinalis AGI 10 Pool Membership clubMichigan Nov IV Unidentified Skin 2 Pool Hotel/MotelMichigan Dec III Unidentified Skin 2 Pool Hotel/MotelMinnesota May IV Unidentified†† Skin, ARI, Eye 4 Pool Hotel/MotelMinnesota Jun IV Unidentified†† Skin 7 Wading pool Community/MunicipalityMinnesota Jul II C. parvum AGI 20 Pool Membership clubMinnesota Sep I C. hominis AGI 58 Pools WaterparkMinnesota Nov III Pseudomonas aeruginosa Skin 5 Spa Hotel/MotelMinnesota Nov I P. aeruginosa Ear 6 Pool, spa Hotel/MotelMinnesota Nov II C. hominis AGI 31 Pool Membership clubMinnesota Dec III Unidentified†† Skin 3 Spa Hotel/MotelMississippi Aug III Cryptosporidium AGI 11 Pool Neighborhood/SubdivisionMissouri Jun IV Cryptosporidium AGI 15 Wading pool Community/MunicipalityNebraska Jul IV Cryptosporidium AGI 2 Pool Community/MunicipalityNebraska Jul IV Cryptosporidium AGI 3 Pool WaterparkNebraska Jul IV Cryptosporidium AGI 3 Pool Community/MunicipalityNebraska Aug IV Cryptosporidium AGI 6 Pool Hotel/MotelNebraska Sep IV Cryptosporidium AGI 2 Pool Private residenceNew Hampshire Feb IV Unidentified** Skin 4 Spa Hotel/MotelNew York Jan IV Unidentified Skin 25 Pool WaterparkNew York Jul IV Unidentified†† ARI 8 Spa Membership clubOhio Jan I Chloramines, endotoxins ARI, Eye 665 Pool, interactive
fountain, spaWaterpark
Ohio Mar IV Unidentified** Skin 2 Spa Membership clubOhio Mar II Unidentified Skin 31 Pool Hotel/MotelOhio Oct III Legionella pneumophila
serogroup 1ARI 2 Pool, spa Hotel/Motel
Oklahoma Jul I C. hominis AGI 93 Pool Community§§
Oklahoma Jul I C. parvum AGI 17 Pool State parkPennsylvania Apr III Cryptosporidium AGI 76 Pool Membership clubPennsylvania Jun IV C. parvum AGI 730 Pool Community/MunicipalityPennsylvania Jun IV G. intestinalis AGI 3 Fill-and-drain pool Private residence

Surveillance Summaries
MMWR / September 23, 2011 / Vol. 60 / No. 12 7
illness (Table 6; Figure 2). The remaining 10 (7.5%) outbreaks were of combined illness types, nine of which included ARI. Outbreaks of AGI accounted for 12,477 (89.3%) of the total outbreak-related cases; 64 (79.0%) of the 81 AGI outbreaks started during June, July, or August (Figures 3 and 4).
The etiologic agent was confirmed for 105 (78.4%) outbreaks (Table 7; Figure 2). Of the outbreaks with a confirmed etiology, 68 (64.8%) were caused by parasites; 22 (21.0%) by bacteria; five (4.8%) by viruses; nine (8.6%) by chemicals or toxins; and one (1.0%) by multiple etiology types. Outbreaks caused by parasites accounted for almost 50 times more cases than those caused by bacteria (12,492 and 254, respectively). Of the 90 outbreaks associated with treated recreational water and caused by an identified etiologic agent: 62 (68.4%) were caused by parasites, 18 (20.0%) by bacteria, eight (8.9%) by chemicals or toxins, and two (2.2%) by viruses (Table 7). Of the 15 outbreaks associated with untreated recreational water and caused by an identified etiologic agent, six (40.0%) were caused by parasites, four (26.7%) by bacteria, three (20.0%) by viruses, one (6.7%) by multiple pathogen types, and one (6.7%) by a toxin.
ParasitesAll 62 outbreaks associated with treated recreational water
and caused by parasites were outbreaks of AGI. A total of 58 (93.5%) outbreaks were caused by Cryptosporidium, resulting in 12,137 cases. Some of the cryptosporidiosis outbreaks were communitywide outbreaks. A communitywide cryptosporidiosis outbreak typically starts as a focal outbreak associated with one recreational water venue and evolves into an outbreak associated with multiple recreational water venues or other settings (e.g., child care centers). As the outbreak progresses, recreational water exposure might decrease in its importance as a risk factor while secondary transmission (i.e., contact with an infected person) might become increasingly important. The statewide cryptosporidiosis outbreak in Utah in 2007 is an example of a communitywide cryptosporidiosis outbreak. Of the remaining four outbreaks of parasitic disease associated with treated recreational water, three were caused by Giardia intestinalis, and one was caused by both Cryptosporidium and Giardia. A July 2007 outbreak associated with a Florida interactive fountain is suspected, on the basis of common exposures to the implicated interactive fountain of persons with primary cases and diagnostic laboratory
TABLE 2. (Continued) Waterborne disease outbreaks associated with treated recreational water (n = 74), by state/jurisdiction — Waterborne Disease and Outbreak Surveillance System, United States, 2007
State/Jurisdiction Month Class* Etiology
Predominant illness†
No. of cases§
(n = 10,749) Venue Setting
Pennsylvania Jul III Cryptosporidium AGI 51 Pool Camp/CabinPennsylvania Jul IV C. parvum AGI 39 Pool Membership clubPuerto Rico Aug II C. hominis AGI 107 Interactive fountain WaterparkTennessee May IV L. pneumophila serogroup 1 ARI 2 Spa Hotel/MotelTennessee Jul IV Shigella AGI 17 Pool, temporary
waterslideCamp/Cabin
Tennessee Jul IV Cryptosporidium AGI 18 Pool Community/MunicipalityTennessee Jul IV Cryptosporidium AGI 16 Splash pad WaterparkTennessee Aug IV C. hominis AGI 24 Pool Private residenceUtah May I Cryptosporidium AGI 5,697 Pools Community/MunicipalityVirginia Jul IV G. intestinalis AGI 6 Pool Community/MunicipalityWashington Aug IV Cryptosporidium AGI 14 Pool Membership clubWest Virginia Apr II Unidentified** Skin 15 Wading pool Community/MunicipalityWest Virginia Nov IV Unidentified Skin 7 Spa Camp/CabinWisconsin Aug IV Cryptosporidium AGI 35 Pool Community/MunicipalityWisconsin Aug IV Cryptosporidium AGI 38 Pool Aquatic facilityWyoming Jul IV Cryptosporidium AGI 27 Pool Community/Municipality
Abbreviations: AGI = acute gastrointestinal illness; ARI = acute respiratory illness; Ear = illnesses, conditions, or symptoms related to the ears; Eye = illnesses, condi-tions, or symptoms related to the eyes; Skin = illnesses, conditions, or symptoms related to the skin. * On the basis of epidemiologic and clinical laboratory data, and environmental data (see Table 1) provided to CDC. † The category of illness reported by ≥50% of ill respondents. § No deaths were reported in cases associated with outbreaks reported during 2007. ¶ Etiology unidentified: Cryptosporidium suspected on the basis of clinical diagnoses of secondary cases. ** Etiology unidentified: P. aeruginosa suspected on the basis of clinical syndrome and setting. †† Etiology unidentified: contamination from excess chlorine levels, pool disinfection by-products (e.g., chloramines), or altered pool chemistry suspected. §§ The implicated pool was located at a membership club but functioned as a community pool.

Surveillance Summaries
8 MMWR / September 23, 2011 / Vol. 60 / No. 12
TABLE 3. Waterborne disease outbreaks associated with treated recreational water (n = 42), by state — Waterborne Disease and Outbreak Surveillance System, United States, 2008
State Month Class* EtiologyPredominant
illness†No. of cases§
(n = 2,731) Venue Setting
Alabama May IV Legionella pneumophila serogroup 1
ARI 3 Spa Hotel/Motel
Arizona Jun I Cryptosporidium hominis AGI 57 Pool Community/MunicipalityArizona Jul III C. hominis AGI 9 Interactive fountain WaterparkArizona Jul I Cryptosporidium AGI 13 Pool Community/MunicipalityCalifornia Jun IV Cryptosporidium AGI 11 Pool Membership clubCalifornia Aug IV Cryptosporidium AGI 5 Pool, interactive fountain Community/municipal parkFlorida Mar I Legionella ARI 5 Spa Hotel/MotelFlorida Jun III L. pneumophila serogroup 1 ARI 3 Spa Membership clubFlorida Aug IV Cryptosporidium parvum AGI 13 Pool Membership clubIdaho Jul IV Cryptosporidium AGI 2 Pool Community/MunicipalityIllinois Jan III Chlorine ARI, Skin, Eye 20¶ Wading pool WaterparkIllinois May I L. pneumophila serogroup 1 ARI 3 Pool, spa Hotel/MotelIowa Aug IV Cryptosporidium AGI 24 Pool Community/MunicipalityIowa Nov III Unidentified AGI 10 Pool Hotel/MotelKansas Jun IV Cryptosporidium AGI 6 Pool Community/MunicipalityKansas Oct II C. hominis AGI 22 Pool Hotel/MotelKentucky Jul III Hydrochloric acid ARI, AGI 5 Pool WaterparkMaryland Jul IV Shigella sonnei AGI 12 Temporary waterslide,
dunk tankFarm
Massachusetts Mar IV Unidentified** Skin 50 Pool WaterparkMichigan Apr IV Unidentified** ARI, AGI 4 Pool Hotel/MotelMichigan May IV Unidentified** ARI, AGI 5 Pool Hotel/MotelMichigan Aug IV Cryptosporidium AGI 3 Pool Neighborhood/SubdivisionMichigan Aug IV Unidentified** ARI 2 Pool WaterparkMinnesota Apr II C. parvum AGI 12 Pool Membership clubMinnesota Aug II C. hominis AGI 12 Pools WaterparkMinnesota Sep II C. hominis, Giardia
intestinalisAGI 19 Pools Membership club
New Jersey Jan IV Legionella ARI 98 Spa CommunityNew Mexico Jul III C. hominis AGI 89 Pool Community/MunicipalityNew York Apr I Pseudomonas aeruginosa Skin 23 Spa Hotel/MotelNew York Jun III Chlorine gas ARI, Eye 6 Pool Membership clubNew York Jul IV Cryptosporidium AGI 3 Pool Community/MunicipalityNew York Aug III Pool chemical†† ARI 19 Wave pool WaterparkNew York Aug III Chlorine ARI 2 Pool SchoolNew York Aug III Unidentified ** ARI, Eye 29 Pool SchoolOhio Jul III L. pneumophila serogroup 1 ARI 2 Spa Hotel/MotelOhio Jul IV Cryptosporidium AGI 8 Pool Community/MunicipalityOklahoma Aug II Cryptosporidium AGI 44 Pool CampSouth Carolina Jan III L. pneumophila serogroup 1 ARI 2 Spa Hotel/MotelTexas Jun I C. hominis AGI 2,050 Lake, pool, interactive
fountainCommunity/Municipality
Virginia May IV Unidentified§§ Skin 6 Pool, spa Hotel/MotelVirginia Nov III L. pneumophila serogroup 1 ARI 2 Spa Assisted living facilityWisconsin Feb II P. aeruginosa Skin 18 Pool, spa Hotel/Motel
Abbreviations: AGI = acute gastrointestinal illness; ARI = acute respiratory illness; Eye = illnesses, conditions, or symptoms related to the eyes; Skin = illnesses, conditions, or symptoms related to the skin. * On the basis of epidemiologic and clinical laboratory data, and environmental data (see Table 1) provided to CDC. † The category of illness reported by ≥50% of ill respondents. § No deaths were reported in cases associated with outbreaks reported during 2008. ¶ The case count reflects the number of persons who were hospitalized; no data were available on the total number of persons who were ill. An unknown number
of persons experienced chemical burns, eye irritation, or gastrointestinal symptoms. ** Etiology unidentified: contamination from excess chlorine levels, pool disinfection by-products (e.g., chloramines), or altered pool chemistry suspected. †† One or more chemicals in the water caused illness; however, it was unclear which chemical(s) led to illness. §§ Etiology unidentified: P. aeruginosa suspected on the basis of clinical syndrome and setting.

Surveillance Summaries
MMWR / September 23, 2011 / Vol. 60 / No. 12 9
results of persons with secondary cases, to have been caused by Cryptosporidium.
Six outbreaks associated with untreated recreational water were caused by parasites including two by Cryptosporidium, resulting in 17 cases. Four additional outbreaks of cercarial dermatitis (sometimes called “swimmer’s itch”) were caused by avian schistosomes; three of these outbreaks were associated with fresh water and one with marine water.
BacteriaA total of 18 outbreaks were associated with treated
recreational water and caused by bacteria. Four were outbreaks of AGI. An April 2007 outbreak, caused by Escherichia coli O157:H7 and linked epidemiologically to a temporary inflatable waterslide at a California home, resulted in 11 persons becoming ill. The waterslide was not designed
for disinfection or filtration equipment. In June 2007, another outbreak caused by E. coli O157:H7 resulted in 31 cases and was linked epidemiologically to an interactive fountain at an Idaho waterpark. An environmental health investigation of the implicated, unregulated recreational water venue noted free chlorine levels <0.5 mg/L (or parts per million [ppm]). A shigellosis outbreak in July 2007 was associated with a pool or temporary inflatable waterslide at a Tennessee camp and resulted in 17 cases. An outbreak in Maryland in July 2008 caused by Shigella sonnei that resulted in illness in 12 persons was linked epidemiologically to a waterslide or dunk tank at a farm. Municipal water with no additional disinfection or filtration was used for the recreational water activities. Four outbreaks caused by Pseudomonas were each linked epidemiologically to hotel/motel pools or spas and resulted in 52 cases of skin- or ear-related illnesses, conditions, or symptoms. Ten outbreaks
TABLE 4. Waterborne disease outbreaks associated with untreated recreational water (n = 10), by state — Waterborne Disease and Outbreak Surveillance System, United States, 2007
State Month Class* EtiologyPredominant†
illnessNo. of cases§
(n = 321) Venue Setting
California May IV Plesiomonas shigelloides
AGI 2 River/Stream Public outdoor area
Colorado Jun IV Shigella flexneri type I
AGI 2 Lake/Reservoir Public outdoor area
Colorado Jun III Schistosomes Skin 57 Lake/Reservoir Community/municipal parkColorado Aug IV Schistosomes Skin 200 Lake/Reservoir Public outdoor areaFlorida Jul III Karenia brevis ARI 15 Ocean Public outdoor areaFlorida Aug IV Unidentified AGI, Skin 2 Ocean Community/municipal parkNew Mexico Jun III Schistosomes Skin 12 Lake/Reservoir Public outdoor areaNorth Dakota Jul IV Cryptosporidium AGI 10 Lake/Reservoir Camp/cabinTennessee Aug II Unidentified AGI 14 River/Stream Public outdoor areaWashington Sep IV Cryptosporidium AGI 7 Lake/Reservoir State park
Abbreviations: AGI = acute gastrointestinal illness; ARI = acute respiratory illness; Skin = illnesses, conditions, or symptoms related to the skin.* On the basis of epidemiologic and clinical laboratory data, and environmental data (see Table 1) provided to CDC.† The category of illness reported by ≥50% of ill respondents.§ No deaths were reported in cases associated with outbreaks reported during 2007.
TABLE 5. Waterborne disease outbreaks associated with untreated recreational water (n = eight), by state — Waterborne Disease and Outbreak Surveillance System, United States, 2008
State Month Class* EtiologyPredominant
illness†No. of cases§
(n = 165) Venue Setting
California Jun III Schistosomes Skin 31 Ocean State parkConnecticut Jul I Norovirus genogroup I AGI 16 Lake/Reservoir UnknownFlorida Mar IV Shigella AGI 2 Spring County parkIllinois Jul II Escherichia coli O157:H7 AGI 3 Lake/Reservoir Camp/CabinMinnesota Jul I Norovirus AGI 26 Lake/Reservoir Camp/CabinOhio Jul II S. sonnei, norovirus genogroup I,
Yersinia enterolyticaAGI 54 Lake/Reservoir¶ Waterpark
Vermont Jul IV Unidentified** Other 10 Lake/Reservoir Camp/CabinWisconsin Jul IV Norovirus genogroup I AGI 23 Lake/Reservoir Camp/Cabin
Abbreviations: AGI = acute gastrointestinal illness; Skin = illnesses, conditions, or symptoms related to skin; Other = undefined illnesses, conditions, or symptoms. * On the basis of epidemiologic and clinical laboratory data, and environmental data (see Table 1) provided to CDC. † The category of illness reported by ≥50% of ill respondents. § No deaths were reported in cases associated with outbreaks reported during 2008. ¶ A lake with a sand bottom in a freshwater waterpark setting. Some modifications had been made to the lake to support swimming by patrons of the waterpark. ** Etiology unidentified: reported symptoms were consistent with leptospirosis, but clinical specimens tested negative for Leptospira infection.

Surveillance Summaries
10 MMWR / September 23, 2011 / Vol. 60 / No. 12
caused by Legionella were linked epidemiologically to pools or spas and resulted in 122 persons developing legionellosis (i.e., LD or PF). The largest legionellosis outbreak resulted in 98 cases of PF and was linked epidemiologically to a New Jersey pay-on-entry spa. Exposures leading to seven of the outbreaks occurred in a hotel/motel setting.
Four outbreaks of AGI were caused by bacteria and associated with untreated water. These included two outbreaks caused by Shigella, an outbreak caused by Plesiomonas shigelloides, and an outbreak caused by E. coli O157:H7.
Six additional outbreaks, resulting in a total of 57 cases, had unidentified etiologies but were suspected, on the basis of the clinical symptoms and common exposures to implicated pools or spas, to have been caused by Pseudomonas; exposures leading to four of these outbreaks occurred in a hotel/motel setting. An additional outbreak of an unidentified etiology was suspected, on the basis of the clinical symptoms and common exposure to a pond, to have been caused by Leptospira.
VirusesFive outbreaks of AGI had a viral etiology and resulted in
121 cases. Norovirus was identified as the etiologic agent in each of the outbreaks; two were associated with treated water and three with lakes. The two treated venue–associated outbreaks were caused by norovirus genogroup II. One of them occurred in June 2007 and was linked epidemiologically to a California interactive fountain; an environmental health investigation noted inadequacies in facility design. Design plans were not submitted to public health officials for review before construction. Two of the three outbreaks associated with lakes were caused by norovirus genogroup I.
Chemicals/ToxinsNine outbreaks associated with chemicals or toxins resulted
in a total of 747 cases. The largest outbreak occurred during January–March 2007 and was associated with an indoor Ohio waterpark. Swimmers and employees at the waterpark experienced respiratory and eye irritation. An environmental health investigation revealed elevated trichloramine and endotoxin levels (23,24). Three outbreaks were caused by exposure to toxic chlorine gas at pools at one apartment complex and two membership clubs. Environmental health investigations of two of these outbreaks noted that the circulation pump shut down while the chlorine and muriatic (i.e.,
≥43 2 1 0
FIGURE 1. Number of waterborne disease outbreaks associated with recreational water (n = 134), by state/jurisdiction — Waterborne Disease and Outbreak Surveillance System, United States, 2007–2008*
* Note: These numbers are largely dependent on surveillance and reporting activities in individual states/jurisdictions and do not necessarily indicate the true incidence of waterborne disease outbreaks.
TABLE 6. Number of waterborne disease outbreaks associated with recreational water (n = 134), by predominant illness* and type of water exposure — Waterborne Disease and Outbreak Surveillance System, United States, 2007–2008
Type of exposure
Predominant illness
Treated Untreated Total†
Outbreaks Cases Outbreaks Cases Outbreaks (%) Cases (%)
AGI 70 12,318 11 159 81(60.4) 12,477 (89.3)ARI 16 168 1 15 17 (12.7) 183 (1.3)AGI and ARI 4 23 0 0 4 (3.0) 23 (0.2)Ear 1 6 0 0 1 (0.7) 6 (0.0)Eye and ARI 3 700 0 0 3 (2.2) 700 (5.0)Skin 20 241 4 300 24 (17.9) 541 (3.9)Skin and AGI 0 0 1 2 1 (0.7) 2 (0.0)Skin, ARI, and Eye 2 24 0 0 2 (1.5) 24 (0.2)Other 0 0 1 10 1 (0.7) 10 (0.0)Total (%) 116 (86.6) 13,480 (96.5) 18 (13.4) 486 (3.5) 134 (100.0) 13,966 (100.0)
Abbreviations: AGI = acute gastrointestinal illness; ARI = acute respiratory illness; Ear = illnesses, conditions, or symptoms related to the ears; Eye = illnesses, conditions, or symptoms related to the eyes; Skin = illnesses, conditions, or symptoms related to skin; Other = undefined illnesses, conditions, or symptoms.* The category of illness reported by ≥50% of ill respondents.† Percentages do not add up to 100.0% due to rounding.

Surveillance Summaries
MMWR / September 23, 2011 / Vol. 60 / No. 12 11
hydrochloric) acid feed pumps continued to run, allowing the chlorine and acid to mix within the circulation system plumbing without dilution, thus generating toxic chlorine gas. When the circulation pumps were restarted, the gas was released into the pools and caused respiratory distress in swimmers. Two outbreaks were attributed to release of excess chlorine caused by issues related to the automatic chemical controllers and poolside water testing. In addition, one outbreak was caused by the release of excess muriatic acid during filter backwash. Another outbreak was caused by one or more pool chemicals; however, which chemical(s) caused the outbreak was unclear. Both outbreaks occurred at outdoor waterparks. The remaining outbreak was linked epidemiologically to untreated water and was caused by exposure to brevetoxins released by algae, specifically Karenia brevis (25).
Nine additional outbreaks, resulting in 112 cases, of unidentified etiologies were suspected, on the basis of clinical symptoms and common exposures to implicated pools or spas, to have been caused by excessive levels of chlorine, pool disinfection by-products, or altered pool chemistry. Exposures leading to four of these outbreaks occurred in a hotel/motel setting. Two outbreaks, resulting in 79 cases, were suspected to have been caused by chloramines and were associated with an indoor Massachusetts waterpark and an indoor New York school pool.
Previously Unreported OutbreaksData on five previously unreported recreational water–
associated outbreaks were received (Table 8). Four children at a residential school became ill with AGI after using a
Skin 17.9%
Type of exposure (n = 134)
Treated water 86.6%
Untreated water 13.4%
ARI 12.7%
Ear 0.7%Other§ 0.7%Multiple 7.5%
AGI 60.4%
Predominant illness (n = 134)*†
Etiology (n = 134)† Route of entry (n = 134)
Parasitic 50.7%
Multiple 0.7%Viral 3.7%Chemical/toxin 6.7%
Unidenti�ed 21.6%
Bacterial: Legionella 7.5%
Bacterial: Non-Legionella 9.0%
Ingestion 60.4%
Contact 18.7%
Inhalation13.4%
Combined 4.5% Unknown§ 3.0%
FIGURE 2. Recreational water–associated outbreaks, by type of exposure, predominant illness,* etiology, and route of entry — Waterborne Disease and Outbreak Surveillance System, United States, 2007–2008
Abbreviations: AGI = acute gastrointestinal illness; ARI = acute respiratory illness; Ear = illnesses, conditions, or symptoms related to the ears; Skin = illnesses, condi-tions, or symptoms related to the skin; Multiple = a combination of predominant illnesses; Other = undefined illnesses, conditions, or symptoms.* The category of illness reported by ≥50% of ill respondents. † Percentages do not add up to 100.0% due to rounding. § Etiology was not identified for one outbreak. Reported symptoms were consistent with leptospirosis but clinical specimens tested negative for Leptospira infection.
Route of transmission was unclear.

Surveillance Summaries
12 MMWR / September 23, 2011 / Vol. 60 / No. 12
fill-and-drain pool. All four tested positive for Campylobacter. Published and unpublished data on four legionellosis outbreaks that were associated with recreational water and occurred during 1993–1999 were added to the WBDOSS database (26,27). Three of the legionellosis outbreaks resulted in four deaths; these deaths are included in the respective outbreak case counts. Data on these five outbreaks are summarized but not included in the analysis for this report.
Pool Chemical–Associated Health EventsMaryland and Michigan reported 32 pool chemical–
associated health events that did not meet the definition of an outbreak associated with recreational water and occurred during 2007–2008 (Table 9). These health events resulted in 48 cases of illness or injury; the median number of cases associated with an event was one (range: 1–15 cases). No deaths were reported. Nineteen (59.3%) of the events resulted in ARI, six (18.8%) in ocular symptoms, three (9.4%) in AGI, and four (12.5%) in ARI and other illness. Almost half (15 [46.9%]) of the events occurred at a private residence. Six (18.8%) occurred at a public setting and 11 (34.4%) at an unknown setting. All six events affecting a single child aged ≤13 years occurred at private residences. Of the 32 events, 26 (81.3%) were the result of pool chemical–exposures that occurred in June, July, or August. Twenty-six (81.3%) events could be attributed
at least in part to chemical handling errors, such as mixing incompatible chemicals (e.g., acid and chlorine or different chlorines) and not using personal protective equipment (PPE).
Hazardous Substances Emergency Events Surveillance Associated With Aquatic Facilities
For 2007–2008, a total of 12 state health departments†† reported 92 hazardous substance events involving aquatic facilities, 55 (59.8%) of which involved injured persons. The 92 events led to 663 persons being evacuated, 231 being injured (median number of persons injured in an event with injuries: one; range: 1–44), and 111 persons (84 [75.7%] of whom were injured) being decontaminated (Table 10). No deaths were reported.The majority of injured persons (132 [57.1%]) were members of the general public; 50 (21.6%) were students. Over half of the injured persons (140 [60.6%]) had injuries/symptoms requiring hospital treatment but not admission. Although injured persons primarily reported respiratory irritation or gastrointestinal injuries/symptoms, they also reported suffering from a wide range of injuries/symptoms (Table 11). A total of 33 (35.9%) of the overall events and 22 (40.0%) of the events with injured persons occurred in residential areas (Table 12).
FIGURE 3. Number of waterborne disease outbreaks associated with recreational water (n = 134), by predominant illness* and month — Waterborne Disease and Outbreak Surveillance System, United States, 2007–2008
Abbreviations: AGI = acute gastrointestinal illness; ARI = acute respiratory illness; Ear = illnesses, conditions, or symptoms related to the ears; Skin = illnesses, condi-tions, or symptoms related to the skin; Multiple = a combination of predominant illnesses; Other = undefined illnesses, conditions, or symptoms.* The category of illness reported by ≥50% of ill respondents.
OtherMultipleEarARISkinAGI
Month
No.
of o
utbr
eaks
35
30
25
20
15
10
5
0Jan Feb Mar Apr May Jun Jul Aug Sep Oct Nov Dec
†† Florida, Iowa, Louisiana, Michigan, Minnesota, North Carolina, New Jersey, New York, Oregon, Texas, Utah, and Wisconsin.

Surveillance Summaries
MMWR / September 23, 2011 / Vol. 60 / No. 12 13
A primary contributing factor was reported for 88 (95.7%) of events overall and 52 (94.5%) of events with injured persons (Figure 5). Among this subset of events, human error was the leading primary contributing factor for events overall and those with injured persons (51 [58.0%] and 36 [69.2%], respectively). Equipment failure was also frequently reported to be the primary contributing factor of events overall and those with injured persons (31 [35.2%] and 16 [30.8%], respectively).
National Electronic Injury Surveillance SystemDuring 1999–2008, the median estimated number of annual
ED visits for pool chemical–associated injuries was 4,120
(range: 3,315–5,216) (Figure 6). In 2008, an estimated 4,574 persons (1.5 per 100,000 population [95% confidence interval (CI): 0.9–2.1]) visited an ED for pool chemical–associated injuries (Table 13). The most common injury diagnoses were poisoning, which includes ingestion of pool chemicals as well as inhalation of their vapors, fumes, or gases (1,784 [95% CI: 585–2,984]) and dermatitis/conjunctivitis (1,452 [95% CI: 936–1,969]); more than half of the injuries occurred at a residence (2,870; [95% CI: 1,363–4,377]). Almost three quarters of the injuries occurred during June, July, or August. No deaths were documented.
FIGURE 4. Recreational water–associated outbreaks of acute gastrointestinal illness, by type of exposure and etiology — Waterborne Disease and Outbreak Surveillance System, United States, 2007–2008
* Percentages do not add up to 100.0% due to rounding.
Cryptosporidium spp. 74.1%
Type of exposure (n = 81)
Unidenti�ed 3.7%
Shigella sonnei, norovirus GI, Yersinia enterolytica 1.2%
Etiology (n = 81)*
Giardia intestinalis 3.7%
Untreated water 13.6%
Treated water 86.4%
S. sonnei, norovirus GI, Y. enterolytica 9.1%
P. shigelloides 9.1%
Norovirus 27.3%
Escherichia coli O157:H7 3.7%
Etiology: untreated water (n = 11)* Etiology: treated water (n = 70)*
Unidenti�ed 9.1%
Cryptosporidium spp. 18.2%
E. coli O157:H79.1%
Shigella spp. 18.2%
Shigella spp. 4.9%
Norovirus 6.2%
Plesiomonas shigelloides 1.2%Cryptosporidium spp., Giardia intestinalis 1.2%
Cryptosporidium spp. 82.9%
Cryptosporidium sp., G. intestinalis 1.4%
Norovirus 2.9%
G. intestinalis 4.3%
Shigella spp. 2.9%Unidenti�ed 2.9%E. coli O157:H7 2.9%

Surveillance Summaries
14 MMWR / September 23, 2011 / Vol. 60 / No. 12
TABLE 7. Number of waterborne disease outbreaks associated with recreational water (n = 134), by etiology and type of water exposure — Waterborne Disease and Outbreak Surveillance System, United States, 2007–2008
Etiology
Type of exposure
Treated Untreated Total
Outbreaks Cases Outbreaks Cases Outbreaks (%)* Cases (%)*
Bacterium 18 245 4 9 22 (16.4) 254 (1.8)Esherichia coli O157:H7 2 42 1 3 3 45Legionella spp. 10 122 0 0 10 122Plesiomonas shigelloides 0 0 1 2 1 2Pseudomonas aeruginosa 4 52 0 0 4 52Shigella spp. 2 29 2 4 4 33
Parasite 62 12,175 6 317 68 (50.7) 12,492 (89.4)Schistosomes 0 0 4 300 4 300Cryptosporidium spp. 58 12,137 2 17 60 12,154Cryptosporidium hominis, Giardia intestinalis 1 19 0 0 1 19G. intestinalis 3 19 0 0 3 19
Virus 2 56 3 65 5 (3.7) 121 (0.9)Norovirus 2 56 3 65 5 121
Chemical/Toxin 8 732 1 15 9 (6.7) 747 (5.3)Chloramines and endotoxins 1 665 0 0 1 665Chlorine 2 22 0 0 2 22Chlorine gas 3 21 0 0 3 21Hydrochloric acid 1 5 0 0 1 5Karenia brevis 0 0 1 15 1 15Pool chemical(s)† 1 19 0 0 1 19
Multiple§ 0 0 1 54 1 (0.7) 54 (0.4)S. sonnei, norovirus genogroup I, Yersinia enterolytica 0 0 1 54 1 54
Unidentified 26 272 3 26 29 (21.6) 298 (2.1)Suspected chemical exposure¶ 7 33 0 0 7 33Suspected chloramines 2 79 0 0 2 79Suspected Cryptosporidium 1 6 0 0 1 6Suspected P. aeruginosa 6 57 0 0 6 57Unidentified 10 97 3 26 13 123
Total (%) 116 (86.6) 13,480 (96.5) 18 (13.4) 486 (3.5) 134 (100.0) 13,966 (100.0)
* Percentages do not add up to 100.0% due to rounding.† One or more chemicals in the water caused illness; which chemical(s) caused the outbreak was unclear.§ Outbreaks with multiple etiologies are defined as outbreaks in which more than one type of etiologic agent is identified in clinical specimens from affected persons,
and each etiologic agent is found in ≥5% of positive clinical specimens (e.g., the outbreak caused by Shigella sonnei and Yersinia enterolytica [bacteria] and norovirus genogroup I [virus], in which each agent was identified in ≥5% of stool specimens).
¶ Etiology unidentified: for nine outbreaks, the etiologies were suspected on the basis of clinical symptoms to be excessive levels of chlorine, pool disinfection by-products, or altered pool chemistry.
TABLE 8. Previously unreported outbreaks associated with recreational water (n = five), by state — Waterborne Disease and Outbreak Surveillance System, United States, 1993–2005*
State Month Year Class† EtiologyPredominant
illness§No. of cases [deaths]
(n = 65 [4])¶ Venue Setting
Florida Apr 1993 IV Legionella pneumophila ARI 3 [1] Spa Hotel/MotelGeorgia Apr 1999 I L. pneumophila serogroup 6 ARI 24 —** Spa Hotel/MotelIowa Jan 1995 II L. pneumophila serogroup 1 ARI 11 [1] Spa Hotel/MotelMaryland Jun 2005 III Campylobacter AGI 4 — Fill-and-drain pool Residential schoolVirginia Sep 1996 I L. pneumophila serogroup 1 ARI 23 [2] Spa Store
Abbreviations: AGI = acute gastrointestinal illness; ARI = acute respiratory illness. * Previously unreported legionellosis outbreaks included in this table were identified through a review of the published literature on Legionella as well as reports
from past CDC-led investigations occurring during 1971–2000. Data presented are based on review and interpretation of available outbreak investigation reports and published articles.
† On the basis of epidemiologic and clinical laboratory data, and environmental data (see Table 1) provided to CDC. § The category of illness reported by ≥50% of ill respondents. ¶ Deaths are included in the overall case count. ** No deaths were reported.

Surveillance Summaries
MMWR / September 23, 2011 / Vol. 60 / No. 12 15
TABLE 9. Number of pool chemical–associated health events (n = 32), by state — Hazardous Substance Emergency Events Surveillance System, Maryland and Michigan, 2007–2008*
State Month Year Etiology Predominant illness† No. of cases (n = 48) Venue Setting
Maryland May 2008 Chlorine gas§ ARI 1 Pool Apartment/CondominiumMichigan May 2007 Chlorine¶ ARI 1 Pool WaterparkMichigan Jun 2007 Chlorine gas§ ARI 1 Pool Private residenceMichigan Jun 2007 Chlorine¶ ARI 1 Pool UnknownMichigan Jun 2007 Unidentified** ARI 1 Pool Private residenceMichigan Jun 2007 Unidentified** ARI 1 Pool Private residenceMichigan Jul 2007 Chlorine¶ ARI, AGI 1 Pool UnknownMichigan Jul 2007 Sodium hypochlorite Eye 1 Pool Neighborhood/SubdivisionMichigan Jul 2007 Chlorine gas§ ARI 1 Pool UnknownMichigan Aug 2007 Chlorine gas§ ARI, AGI 1 Pool UnknownMichigan Aug 2007 Chlorine¶ ARI 1 Pool WaterparkMichigan Nov 2007 Algaecide AGI 1 Pool Private residenceMichigan Mar 2008 Unidentified** ARI 15 Pool Hotel/MotelMichigan Jun 2008 Chlorine¶ ARI 1 Pool Private residenceMichigan Jun 2008 Unidentified†† ARI 1 Pool Private residenceMichigan Jun 2008 Chlorine powder ARI 1 Pool Private residenceMichigan Jun 2008 Unidentified†† Eye 1 Pool Private residenceMichigan Jun 2008 Chlorine gas AGI 1 Pool Private residenceMichigan Jun 2008 Chlorine powder ARI 1 Pool Private residenceMichigan Jun 2008 Chlorine¶ ARI 1 Pool Private residenceMichigan Jun 2008 Chlorine¶ Eye 1 Pool Community/MunicipilityMichigan Jun 2008 Chlorine¶ ARI 1 Pool Private residenceMichigan Jun 2008 Unidentified†† AGI 1 Pool UnknownMichigan Jun 2008 Unidentified†† ARI, Eye 2 Pool Private residenceMichigan Jul 2008 Chlorine liquid Eye 1 Pool UnknownMichigan Jul 2008 Chlorine powder ARI 2 Pool Private residenceMichigan Jul 2008 Chlorine liquid ARI 1 Pool UnknownMichigan Jul 2008 Chlorine¶ ARI, AGI 1 Pool UnknownMichigan Aug 2008 Chlorine¶ ARI 1 Pool UnknownMichigan Aug 2008 Chlorine gas§ ARI 1 Pool UnknownMichigan Sep 2008 Sodium hypochlorite Eye 1 Pool Private residenceMichigan Nov 2008 Unidentified†† Eye 1 Pool Unknown
Abbreviations: AGI = acute gastrointestinal illness; ARI = acute respiratory illness; Eye = illnesses, conditions, or symptoms related to the eyes; Skin = illnesses, condi-tions, or symptoms related to the skin. * Reports submitted by individual states were based on data from injury surveillance activities within those states. Events reported to the Hazardous Substances
Emergency Events Surveillance (HSEES) system were omitted from this list and are discussed in aggregate with HSEES data (see Table 10). † The category of illness reported by ≥50% of ill respondents. § Chlorine gas was generated after inappropriate chemical mixing (e.g., liquid chlorine bleach and acid). ¶ Unknown if chlorine was in a gaseous, liquid, or powder form when exposure occurred. ** Etiology unidentified: chlorine gas suspected on basis of event summary and symptoms. †† Etiology unidentified: one or more person(s) were handling pool chemical(s) used to “shock” swimming pools.
TABLE 10. Number of persons injured in pool chemical–associated health events (n = 55), by treatment category — Hazardous Substance Emergency Events Surveillance System, 12 states,* 2007–2008
Injured person type
No. of injured persons
No. of persons decontaminated
Predominant symptoms†
No. treated
On scene (first aid)
At hospital (not admitted)
At hospital (admitted)
At hospital (not treated)
By private physician within 24 hrs
Injury reported by an official§
General public¶ 132** 26 Respiratory irritation
20 63 28 1 4 15
Student†† 50 42 Respiratory irritation
1 48 1 0 0 0
Employee§§ 42 16 Respiratory irritation
2 22 3 0 14 1
Responder¶¶ 7 0 Gastrointestinal 0 7 0 0 0 0Total 231** 84 23 140 32 1 18 16
* Florida, Iowa, Louisiana, Michigan, Minnesota, North Carolina, New Jersey, New York, Oregon, Texas, Utah, and Wisconsin. † At least 50% of persons had the symptom. § Injuries reported within 24 hours of event by officials (e.g., fire department, emergency medical technician, police, or poison control center). ¶ Includes persons who were neither employees of a company when the event occurred nor either responders or students. ** Data on public health consequences were missing for one injured person. †† Includes a child or an adult who was a student when the event occurred at a school (includes elementary, middle, high, or vocational school or colleges). §§ Includes injured persons who worked at the company where the event occurred, including owners. ¶¶ A person whose job is to bring the chemical release under control, provide medical assistance to injured persons, or conduct crowd control.
hxv5
Text Box
Please note: An erratum has been published for this issue. To view the erratum, please click here.
hxv5
Highlight

Surveillance Summaries
16 MMWR / September 23, 2011 / Vol. 60 / No. 12
VibriosisDuring 2007–2008, a total of 236 individual vibriosis cases
associated with recreational water exposure were reported by 25 states, representing 20.6% (236/1,148) of the total number of vibriosis cases reported for these years (28,29). Of the 236 patients, 74 (31.4%) were hospitalized, and nine (3.8%) patients died (Table 14). The most frequently isolated Vibrio species was Vibrio alginolyticus, which was isolated from clinical specimens from 106 (44.9%) patients overall, 11 (14.9%) of those hospitalized, and two (22.2%) of those who died. V. vulnificus was isolated from clinical specimens from 48 (20.3%) patients overall, 36 (48.6%) of those hospitalized, and six (66.7%) of those who died. Recreational water–associated
Vibrio infections occurred most commonly during summer months (Figure 7).
Nearly all vibriosis patients reported that they were exposed to recreational water in coastal states (Figure 8). The most frequently reported exposure location was the Atlantic coastal states (86 [36.4%); followed by the Gulf Coast states, which include Florida (81 [34.3%]); Pacific coastal states (59 [25.0%]); and noncoastal states (10 [4.2%]) (Table 15). Florida, Hawaii, California, and Texas had the highest number of reported exposures in their jurisdictions (31, 29, 27, and 27, respectively).
Primary Amebic MeningoencephalitisEight individual fatal cases of PAM caused by Naegleria
fowleri were reported for 2007–2008 (Table 16). Illness occurred after exposure to warm untreated freshwater in Florida (three cases), Texas (two cases), Arizona (one case), California (one case), and Oklahoma (one case). The median age at death was 13 years (range: 9–22 years); seven (87.5%) patients were male.
DiscussionOverview of Outbreaks
A total of 134 recreational water–associated outbreaks were reported to CDC for 2007–2008. They occurred year-round, but almost two thirds of them started during the traditional summer swim season (Memorial Day through Labor Day). The 2007–2008 outbreak count represents a 71.8% increase over that for 2005–2006 (n = 78) and the largest number of outbreaks ever reported for a 2-year period (Figure 9). The number of drinking water–associated outbreaks reported to
TABLE 11. Number and percentage of injuries/symptoms attributed to pool chemical–associated health events, by injury/symptom type — Waterborne Disease Outbreak Surveillance System, 12 states,* 2007–2008
Type No.† (%)§
Respiratory irritation 187 (56.8)Gastrointestinal 59 (17.9)Eye irritation 32 (9.7)Shortness of breath 20 (6.1)Dizziness/central nervous system 12 (3.6)Headache 9 (2.7)Skin irritation 6 (1.8)Burn 2 (0.6)Heart problem 1 (0.3)Other 1 (0.3)Total 329 (100.0)
* Florida, Iowa, Louisiana, Michigan, Minnesota, North Carolina, New Jersey, New York, Oregon, Texas, Utah, and Wisconsin.
† The total number of injuries/symptoms is higher than the total number of victims because injured persons could report more than one injury/symptom.
§ Percentages do not add up to 100.0% due to rounding.
TABLE 12. Number of pool chemical–associated health events (n = 91), by substance category and setting — Hazardous Substance Emergency Events Surveillance System, 12 states,* 2007–2008†
Substance category
All events Events including injured persons
Residential§ Nonresidential¶ Both** Residential Nonresidential Both
Chlorine 19 15 22 12 11 10Acids 6 3 3 6 2 1Other inorganic substances†† 3 2 1 0 0 0Mixture across chemical category§§ 3 5 4 3 5 2Pesticides 1 1 0 0 0 0Oxy/Organics 0 0 1 0 0 1Volatile organic compounds 0 0 1 0 0 0Other¶¶ 1 0 0 1 0 0Total 33 26 32 22 18 14
* Florida, Iowa, Louisiana, Michigan, Minnesota, North Carolina, New Jersey, New York, Oregon, Texas, Utah, and Wisconsin. † Data on setting were missing for one event involving one injured person. § Includes land that predominantly consists of housing. ¶ Includes commercial, recreational, and industrial areas. ** Includes events that occurred in both residential and nonresidential areas. †† Includes all inorganics except for acids, bases, ammonia, and chlorine. §§ Includes substances from different categories that were mixed or formed from a reaction. ¶¶ Includes substances that do not belong to one of the existing categories.
hxv5
Text Box
Please note: An erratum has been published for this issue. To view the erratum, please click here.
hxv5
Highlight

Surveillance Summaries
MMWR / September 23, 2011 / Vol. 60 / No. 12 17
CDC concurrently increased 80%, from 20 for 2005–2006 to 36 for 2007–2008 (16). Overall, the number of recre-ational water–associated outbreaks reported annually has increased substantially since reporting to CDC began in 1978. Possible contributing factors to the increased recreational water–associated outbreak reporting include but are not limited to 1) changes in detection, investigation, and report-ing of waterborne disease outbreaks and 2) the emergence of Cryptosporidium.
Dedicating human resources to waterborne disease detection, investigation, and reporting could be contributing to the observed increase. In late 2006, CDC and its state, DC, territorial, and FAS partners began developing a waterborne disease network and identified points of contact for water-related issues in each reporting jurisdiction, and CDC hired a permanent full-time surveillance coordinator dedicated to running WBDOSS. Having staff dedicated to water-related complaints and inquiries has been reported to be key in optimizing waterborne disease surveillance (30). This network allows CDC and its partners to share outbreak investigation tools (e.g., water testing, Cryptosporidium subtyping, questionnaires, and press releases) and lessons learned (e.g., via webinars and newsletters). In addition, CDC, EPA, and state partners have been collaborating to strengthen waterborne disease outbreak detection, investigation, response, and reporting under the umbrella of the Environmental Health Specialists Network (EHS-Net) Water program, which provides funding for waterborne disease staff and projects in state public health agencies. One EHS-Net Water project that involved conducting a retrospective review of state-specific waterborne disease outbreak data at the states and at CDC identified outbreaks that had not been reported previously to CDC (13).
The increasing number of outbreaks of AGI is driving the overall increase in outbreak reporting (Figures 9 and 10). Since the first reported U.S. recreational water–associated cryptosporidiosis outbreak was identified in 1988 (31), Cryptosporidium has emerged as the single most important etiologic agent of recreational water–associated outbreaks (Figure 11). In 2007–2008, of 81 outbreaks of AGI, 60 (74.0%) were caused by Cryptosporidium; all but two were associated
FIGURE 5. Distribution of primary contributing factors reported for pool chemical–associated health events — Hazardous Substance Emergency Events Surveillance System, 12 states,* 2007–2008
* Florida, Iowa, Louisiana, Michigan, Minnesota, North Carolina, New Jersey, New York, Oregon, Texas, Utah, and Wisconsin.
Equipment failure 30.8%
Primary contributing factor for all events
(n = 88)
Primary contributing factor for events with injured persons
(n = 52)
Human error58.0%Equipment failure
35.2%Human error 69.2%
Intentional/illegal act 5.7%
Other 1.1%
FIGURE 6. Number of estimated emergency department (ED) visits for injuries attributed to pool chemicals (n = 40,803), by year — National Electronic Injury Surveillance System (NEISS), United States, 1999–2008
Source: NEISS. Estimates Query Builder. Bethesda, Maryland: U.S. Consumer Product Safety Commission. 1999–2008. Code 938, swimming pool chemicals. Available at http://cpsc.gov/cgibin/NEISSQuery/home.aspx.* 95% confidence interval.
7,500
1999 2000 2001 2002 2003 2004 2005 2006 2007 2008
Year
6,000
4,500
3,000
1,500
0
No.
of e
stim
ated
ED
vis
its
*

Surveillance Summaries
18 MMWR / September 23, 2011 / Vol. 60 / No. 12
TABLE 13. Estimated number, percentage, and rate of pool chemical–associated injuries treated in hospital emergency departments — National Electronic Injury Surveillance System (NEISS), United States, 2008*†
Characteristic No.Weighted
estimate§¶ 95% CI %** Annual rate†† 95% CI
Injury diagnosisPoisoning§§ 38 1,784 585–2,984 39.0 —¶¶ —Dermatitis/conjunctivitis 38 1,452 936–1,969 31.7 0.5 0.3–0.6Other (e.g., chemical burns) 35 1,338 725–1,951 29.3 0.4 0.2–0.6
Affected body partAll parts of the body (>50% of body) *** 48 2,181 862–3,500 47.7 — —Eyeball 39 1,452 838–2,066 31.7 0.5 0.3–0.7Other (e.g., hand) or not recorded (n = three) 24 942 447–1,436 20.6 — —
Patient dispositionTreated and released, or examined and released without treatment 101 4,214 2,903–5,526 92.1 1.4 1.0–1.8Other††† 10 360 0–731 7.9 — —
Incident locationResidence 60 2,870 1,363–4,377 62.7 — —Public location (e.g., school or place of recreation or sports) 16 352 71–632 7.7 — —Unknown 35 1,352 580–2,124 29.6 — —
Patient age (yrs)0–17 55 2,051 1,168–2,934 44.8 2.8 1.6–3.9
18–45 35 1,698 1,012–2,384 37.1 1.4 0.9–2.0≥46 21 825 90–1,561 18.0 — —
Patient sexMale 60 2,403 1,313–3,493 52.5 1.6 0.9–2.3Female 51 2,171 1,374–2,969 47.5 1.4 0.9–1.9
Patient race/ethnicityWhite 60 3,039 1,713–4,364 66.4 — —Other 14 365 76–655 8.0 — —Unknown 37 1,170 404–1,937 25.6 — —
Total 111 4,574 2,703–6,446 100.0 1.5 0.9–2.1
Abbreviation: CI = confidence interval. * Source: NEISS. Estimates Query Builder. Bethesda, Maryland: U.S. Consumer Product Safety Commission. 1999–2008. Code 938, swimming pool chemicals. Available
at http://www.cpsc.gov/cgibin/NEISSQuery/home.aspx. † For 2007 NEISS summary data, refer to CDC. Pool chemical–associated health events in public and residential settings—United States, 1983–2007. MMWR, 2009;
58:489–93. Available at http://www.cdc.gov/mmwr/preview/mmwrhtml/mm5818a1.htm. § Each injured person was weighted based on the inverse probability of the hospital being selected, and the weights were summed to produce national estimates. ¶ Categorical weighted counts might not add up to 4,574 due to rounding. ** Categorical percentages might not add up to 100.0% due to rounding. †† Rates per 100,000 population were calculated using U.S. Census Bureau population estimates accessed September 10, 2010; 95% confidence intervals were cal-
culated by using SAS survey procedures that accounted for the sample weights and complex sampling design. §§ Poisoning includes ingestion and inhalation of vapors, fumes, or gases. ¶¶ If the sample count was <20, weighted count was <1,200, or the coefficient of variation >30%, the estimate was considered unstable and rates were not reported.
Rates by location and race are not reported because of the high percentage of unreported location and race. *** For a poisoning injury diagnosis, NEISS requires that affected body part be coded as “all parts of the body (more than 50% of body).” ††† Treated and transferred to another hospital (n = three), treated and admitted for hospitalization (within same facility) (n = four), or left without being seen/left
against medical advice (n = three).
TABLE 14. Number of vibriosis cases associated with recreational water (n = 236), by species, hospitalization, death, and year — Cholera and Other Vibrio Illness Surveillance System, United States, 2007–2008
Species
Year
Total2007 2008
Cases Hospitalized Deaths Cases Hospitalized Deaths Cases Hospitalized Deaths
Vibrio alginolyticus 57 3 1 49 8 1 106 11 2V. cholerae non-O1, non-O139 5 1 0 6 1 1 11 2 1V. damsela 2 0 0 0 0 0 2 0 0V. fluvialis 1 0 0 2 0 0 3 0 0V. parahaemolyticus 29 11 0 22 9 0 51 20 0V. vulnificus 24 21 3 24 15 3 48 36 6Vibrio spp. 6 1 0 7 3 0 13 4 0Multiple 0 0 0 2 1 0 2 1 0Total (%) 124 37 (29.8%) 4 (3.2%) 112 37 (33.0%) 5 (4.5%) 236 74 (31.4%) 9 (3.8%)

Surveillance Summaries
MMWR / September 23, 2011 / Vol. 60 / No. 12 19
with treated recreational water venues. The percentage of outbreaks of AGI caused by Cryptosporidium and associated with treated recreational water was 82.9% (Figure 4) for both 2007–2008 (58/70) and 2005–2006 (29/35) (13). In contrast, it was 68.2% (15/22), 50.0% (9/18), and 55.6% (10/18) in 1999–2000, 2001–2002, and 2003–2004, respectively (5,14,15). Its predominance as an etiologic agent, particularly among outbreaks associated with treated recreational water venues, is related to its chlorine tolerance, which allows it to survive in properly chlorinated recreational water >10 days (32). Since 2004, the number of cases of cryptosporidiosis reported to CDC annually has more than tripled (33). Although the reasons for increased cryptosporidiosis case and outbreak reporting are not understood completely, treated recreational water venues continue to play a key role in Cryptosporidium transmission.
Treated Recreational Water Venues and Pathogens
In treated recreational water venues, chlorine and bromine are the primary barriers to pathogen transmission. Maximizing disinfectant effectiveness requires maintaining appropriate pH levels and circulating the water through a filter to remove particulates that deplete disinfectants. Chlorine- and bromine-susceptible pathogens (e.g., Shigella, norovirus, and Giardia) caused 23 (25.6%) of 90 treated recreational water–associated outbreaks of known etiology and indicate lapses in operation. Such lapses also are identified frequently on routine inspection. An analysis of data from >121,000 pool inspections conducted across the United States in 2008 indicated that 10.7% of
inspections identified disinfectant level violations, and 12.1% of inspections resulted in immediate closure because of violations that threatened public health or safety (34). Implementation of proper pool operation practices (e.g., adequate disinfection) has been demonstrated to stop transmission of chlorine-susceptible pathogens effectively and quickly (35), which underscores the need for improved operator training.
Molecular epidemiology data from investigations of the 2007–2008 outbreaks caused by norovirus suggested a possible association between recreational water type and genogroup. This led to a review of 19 reports of outbreaks (1990–2006) confirmed to be caused by norovirus, a chlorine-susceptible pathogen (36). The investigation of one (20.0%) of five treated recreational water–associated outbreaks included molecular typing of isolates, which belonged to genogroup II. Investigations of three (21.4%) of 14 untreated recreational water–associated outbreaks included molecular typing of isolates. Two of the outbreaks were caused by norovirus genogroup I and one by norovirus genogroup II. Data on further characterization by genotyping were not available. Only genogroup II was isolated from implicated treated recreational water venues; however, the limited number of outbreaks with genogroup data precludes further interpretation of these data and underscores the need for molecular typing to elucidate the epidemiology of waterborne disease outbreaks caused by norovirus (37).
In contrast to chlorine-susceptible pathogens, Cryptosporidium requires extended contact time for inactivation at typically required or recommended free chlorine levels (1–3 mg/L). Thus, Cryptosporidium transmission can occur even in well-maintained treated recreational water venues. During 1999–2008, the parasite caused 74.4% (122/164) of treated recreational water–associated outbreaks of AGI (Figure 10). During 2007–2008, treated recreational water–associated outbreaks of cryptosporidiosis accounted for 86.9% (12,137/13,966) of cases overall; the communitywide cryptosporidiosis outbreak in Utah in 2007 alone accounted for 40.8% (5,697/13,966). Such communitywide cryptosporidiosis outbreaks can occur for the following reasons: Cryptosporidium can survive in properly chlorinated recreational water >10 days (32); it has a protracted incubation period (approximately 7 days) (38), which prolongs the amount of time that elapses between infection and epidemiologic implication of the outbreak source; and swimmers who continue to swim while ill can introduce the parasite to multiple recreational water venues. By the time reported cryptosporidiosis cases are linked epidemiologically to a particular venue, transmission already might be occurring at another venue in the community despite public health efforts to control the outbreak. An investigation of a communitywide cryptosporidiosis outbreak in Utah indicated that 20% of case-patients swam while ill
FIGURE 7. Number of vibriosis cases associated with recreational water exposure (n = 236), by species and month — Cholera and Other Vibrio Illness Surveillance System, United States, 2007–2008
* Includes V. cholerae (non-O1, non-O139) (n = 11), V. damsela (n = two), V. fluvialis (n = three), unidentified Vibrio co-infection (n = two), and Vibrio species not identified (n = 13).
0
10
20
30
40
50
60
No.
of c
ases
Jan Feb Mar Apr May Jun Jul Aug Sep Oct Nov Dec
Month
Other species* Vibrio parahaemolyticusV. alginolyticus V. vulni�cus

Surveillance Summaries
20 MMWR / September 23, 2011 / Vol. 60 / No. 12
with diarrhea and identified approximately 450 potentially contaminated recreational water venues (39).
Modifying swimmer behavior is a critical component of reducing recreational water–associated outbreaks, particularly those caused by chlorine-tolerant Cryptosporidium. Fecal-oral transmission associated with recreational water can occur when swimmers ingest contaminated water. The water can be contaminated by pathogens that cause AGI when a person has a fecal incident in the water or fecal material washes off of a swimmer’s body. Diarrhea-exclusion policies for all patrons should be established, implemented, and enforced at all recreational water venues and particularly for young children and visitors from high-risk settings (e.g., child care centers), which have diarrhea-exclusion policies but might not always enforce them (40). In addition, policies for restricting staff who are ill with diarrhea from entering the water, similar to those restricting ill foodhandlers from food preparation, should be established, implemented, and enforced (41).
For water contamination to be minimized, good swimmer hygiene is imperative. Swimmers should wash with soap, especially the perianal area, before entering the water; washing young children thoroughly with soap and water before they enter the water is particularly important (42). An adequate number of clean, functioning, well-stocked (e.g., with soap) and easily accessible facilities with showers, toilets, and
handwashing sinks located near the water might promote good swimmer hygiene. Taking frequent bathroom breaks, particularly for young children, and checking swim diapers every 30–60 minutes also might help minimize water contami-nation. Diaper-changing facilities with handwashing stations should be located close to the water to encourage hygienic diaper-changing and handwashing. Increased awareness of the risk for recreational water–associated illness, its potential severity, and the efficacy and the simplicity of the prevention steps (e.g., not swimming while ill with diarrhea and not swal-lowing water) (43,44) might make the public more likely to adopt healthy swimming behaviors.
The increasing number of reports of treated recreational water–associated outbreaks of cryptosporidiosis and their potential to evolve into communitywide outbreaks also call for prevention measures beyond conventional chlorination and filtration (45). Ultraviolet (46–48) and ozone (49,50) disinfection systems can effectively inactivate Cryptosporidium and are available for use at treated recreational water venues. Remedial biocidal treatment (i.e., hyperchlorination: 20 mg/L free chlorine for 12.75 hours or the equivalent at water pH ≤7.5 and temperature at ≥77°F [25°C] in the absence of stabilized chlorine [32] or 40 mg/L free chlorine for approximately 30 hours at water pH 6.5 and temperature at ≥77°F [25°C] in the presence of stabilized chlorine [51]) is another potential risk-reduction option. Increased circulation flow rates and occupancy-dependent water replacement might also help reduce risk (45).
Finally, Cryptosporidium’s ability to cause communitywide outbreaks underscores the need for more rapid implementation of control measures once an increase in case reporting is noted rather than waiting for an outbreak investigation to implicate a specific source of transmission. A response plan should include 1) establishing a strong communication network with community partners likely to be affected by a cryptosporidiosis outbreak (e.g., operators of treated recreational water venues and child care centers), 2) setting a pre-outbreak disease action threshold (e.g., a two- to threefold increase in number of cases over baseline), and 3) rapid mobilization of community partners to implement intensified control measures (e.g., communitywide hyperchlorination of treated recreational water venues) once the threshold is exceeded (52). To address the concerns of communitywide cryptosporidiosis outbreaks, Salt Lake County, Utah, and Idaho each developed a cryptosporidiosis prevention campaign before the 2008 summer swim season. Both campaigns engaged community partners and educated the public about healthy swimming behaviors. For 2008, Utah reported no waterborne cryptosporidiosis outbreaks, and Idaho reported only one outbreak with two identified cases.
FIGURE 8. Number of vibriosis cases associated with recreational water exposure (n = 236) — Cholera and Other Vibrio Illness Surveillance System, United States, 2007–2008*
* These numbers are largely dependent on surveillance and reporting activities in individual states and do not necessarily indicate the true incidence of vib-riosis cases.
≥10 5–9 2–4 1 0

Surveillance Summaries
MMWR / September 23, 2011 / Vol. 60 / No. 12 21
TABLE 15. Number of vibriosis cases (n = 236) and deaths (n = nine) associated with recreational water, by region/state and species — Cholera and Other Vibrio Illness Surveillance System, United States, 2007–2008
Region/State
Species
TotalVibrio alginolyticus V. parahaemolyticus V. vulnificusOther/unknown
species*
Cases Deaths Cases Deaths Cases Deaths Cases Deaths Cases Deaths
Atlantic Coast 33 1 23 0 19 1 11 1 86 3Connecticut 1 0 7 0 0 0 0 0 8 0Delaware 4 0 0 0 0 0 1 0 5 0Georgia 2 0 0 0 1 0 2 0 5 0Maine 1 0 0 0 0 0 0 0 1 0Maryland 4 0 3 0 3 0 1 0 11 0Massachusetts 1 0 2 0 0 0 0 0 3 0North Carolina 6 0 2 0 5 0 3 0 16 0New Jersey 2 0 2 0 2 1 1 0 7 1New York 1 1 0 0 1 0 0 0 2 1South Carolina 3 0 3 0 2 0 1 1 9 1Virginia 8 0 4 0 5 0 2 0 19 0
Gulf Coast 22 0 22 0 27 5 10 0 81 5Alabama 1 0 3 0 3 0 1 0 8 0Florida 14 0 8 0 5 0 4 0 31 0Louisiana 1 0 2 0 8 1 0 0 11 1Mississippi 0 0 1 0 1 0 2 0 4 0Texas 6 0 8 0 10 4 3 0 27 4
Noncoastal 5 1 1 0 0 0 4 0 10 1Arizona 2 0 0 0 0 0 0 0 2 0Illinois 1 1 0 0 0 0 0 0 1 1Minnesota 0 0 1 0 0 0 3 0 4 0Ohio 1 0 0 0 0 0 0 0 1 0Vermont 1 0 0 0 0 0 0 0 1 0Wisconsin 0 0 0 0 0 0 1 0 1 0
Pacific Coast 46 0 5 0 2 0 6 0 59 0California 22 0 1 0 1 0 3 0 27 0Hawaii 23 0 3 0 1 0 2 0 29 0Washington 1 0 1 0 0 0 1 0 3 0
Total (%) 106 (44.9) 2 (22.2) 51 (21.6) 0 (0) 48 (20.3) 6 (66.7) 31 (13.1) 1 (11.1) 236 (100.0) 9 (3.8)
* Includes V. cholerae (non-O1, non-O139), V. damsela, V. fluvialis, unidentified Vibrio coinfection, and Vibrio unknown species.
TABLE 16. Single cases of primary amebic meningoencephalitis associated with untreated recreational water (n = eight), by state — Waterborne Disease and Outbreak Surveillance System, United States, 2007–2008
State Month Year EtiologyPredominant
illness*No. of cases [deaths]
(n = 8 [8])† Venue Setting
Arizona Sep 2007 Naegleria fowleri Neuro 1 [1] Lake State parkCalifornia Jul 2008 N. fowleri Neuro 1 [1] Lake CommunityFlorida Jun 2007 N. fowleri Neuro 1 [1] Unknown Neighborhood/SubdivisionFlorida Aug 2007 N. fowleri Neuro 1 [1] Lake Community/MunicipalityFlorida Aug 2007 N. fowleri Neuro 1 [1] Lake Community/Municipality§
Oklahoma Aug 2008 N. fowleri Neuro 1 [1] Lake Camp/Cabin Texas Aug 2007 N. fowleri Neuro 1 [1] Lake Public outdoor area¶
Texas Aug 2007 N. fowleri Neuro 1 [1] Lake Public outdoor area¶
Abbreviation: Neuro = neurologic illnesses, conditions, or symptoms (e.g., meningitis).* The category of illness reported by ≥50% of ill respondents.† Deaths are included in the overall case count.§ Epidemiologic and environmental health investigation identified county lakes and a lake at a water sports park as potential exposure sites for this case.¶ The same lake in Texas was implicated as the source of water exposure for both cases with exposure occurring at different parts of the lake weeks apart.

Surveillance Summaries
22 MMWR / September 23, 2011 / Vol. 60 / No. 12
Venue-Specific Challenges to Prevention of Pathogen Transmission in Treated Recreational Water Venues
Spas and interactive fountains present particular challenges to prevention of recreational water–associated illness. They typically hold smaller volumes of water than pools, resulting in a relatively high bather load to water volume ratio, and aeration of the water depletes disinfectants.
Spas (hot tubs). The higher water temperatures of spas make it difficult to maintain proper disinfectant levels. As a result, poorly maintained spas are ideal for amplification of naturally occurring thermophilic environmental contaminants (e.g., Pseudomonas aeruginosa and Legionella). Common recurring themes in outbreaks of P. aeruginosa and Legionella infection include 1) epidemiologically implicating both the pool and spa in a given setting; 2) exposure occurring in a hotel/motel setting, in which spa operation is not a full-time job; 3) exposure occurring in the context of a group event (e.g., a wedding or birthday party), which can lead to the rapid depletion of disinfectant levels; and 4) the group event taking place on a weekend, when trained staff might not be on duty.
Frequent co-location and use of both spas and pools can make it difficult epidemiologically to implicate one or the other. However, Pseudomonas and Legionella are most likely to multiply in the higher water temperatures in spas (53,54).
Group events might lead multiple participants to use a given spa simultaneously, possibly leading to a substantial number of bathers, which can rapidly overwhelm its disinfection capacity and spur bacterial amplification. Group events also might facilitate detection of an outbreak. Conversely, the repeated identification of these outbreaks in the hotel/motel setting highlights the role of travel in pathogen transmission and the potentially decreased likelihood of outbreak detection when travelers disperse to their resident states or countries.
To prevent spa-associated outbreaks, operators must understand the factors that contribute to bacterial amplification and take steps to limit contamination and prevent infection, particularly by thermophilic pathogens. Proper chlorination or bromination are effective in killing Pseudomonas and other skin-infecting bacteria. A review of 18 outbreaks caused by Pseudomonas demonstrated that the implicated spas with recorded chlorine levels all had levels ≤0.5 mg/L (55). Maintaining free chlorine or bromine levels at 2–6 mg/L and pH levels in a range of 7.2–7.8 can minimize bacterial amplification and biofilm build-up, although pathogens might not be eliminated completely from the water. Pseudomonas and Legionella can persist in spa biofilms, even in the presence of adequate disinfectant, and proliferate rapidly if the disinfectant level drops (54,56). A review of data from >5,200 spa inspections conducted across the United States in 2002 revealed that 17.1%
Abbreviations: AGI = acute gastrointestinal illness; ARI = acute respiratory illness; Skin = illnesses, conditions, or symptoms related to the skin; Other = includes bronchitis; illnesses, conditions, or symptoms related to the ears; illnesses, conditions, or symptoms related to the eyes; hepatitis; leptospirosis; meningitis; meningo-encephalitis; and multiple predominant illnesses.* Single cases of primary amebic meningoencephalitis are not included in this figure, which therefore is not comparable with figures included in summaries prior to
the 2005–2006 report.† The category of illness reported by ≥50% of ill respondents. § All outbreaks of legionellosis (i.e., Legionnaires’ disease and Pontiac fever) are classified as ARI.
FIGURE 9. Number of waterborne disease outbreaks associated with recreational water (n = 696),* by predominant illness† and year — Waterborne Disease and Outbreak Surveillance System, United States, 1978–2008
90
80
70
60
50
40
30
20
10
0
No.
of o
utbr
eaks
Year
1978 1980 1982 1984 1986 1990 1994 19981988 1992 1996 2000 2002 2004 2006 2008
OtherARI§
SkinAGI

Surveillance Summaries
MMWR / September 23, 2011 / Vol. 60 / No. 12 23
of inspections identified improper disinfectant levels, and 11.0% of inspections resulted in immediate closure because of violations that threatened public health or safety, again underscoring the need for improved operator training (57).
The greater frequency of outbreaks of Pseudomonas and Legionella infections associated with hotel/motel spas underscores the importance of proper operation in these settings. Hotels and motels should consider having only trained employees operate and maintain pools and spas, particularly on weekends, when usage might increase, and enhance water quality monitoring when large groups or events are scheduled.
Interactive fountains (splash pads or water play areas). Interactive fountains are particularly prone to contamination by fecal material, vomit, and particulates because of open access to young users, persons in street clothes and shoes, and animals. Contaminants can drain into the water reservoir and be recirculated (i.e., sprayed back on users), increasing the likelihood of ingestion of contaminated water. Because interactive fountains typically do not have standing water above ground, they might be inadvertently exempt from pool codes. The lack of public health oversight in some jurisdictions might increase the likelihood of improper design, maintenance, or operation of these venues. An investigation of a 2008 Texas cryptosporidiosis outbreak epidemiologically linked multiple laboratory-confirmed cases to interactive-fountain exposures. At the time, interactive fountains were not regulated under the Texas state pool code; consequently, emergency regulations for interactive fountains were enacted in 2009, and the 2010 pool code was amended to include interactive fountains (Tex. Health & S § 341.0645 and Tex. Health & S § 0695).
Fill-and-drain pools/temporary water slides. The use of tap water to fill temporary venues used by young children continues to be a public health challenge. Lack of additional disinfection and filtration has resulted in multiple outbreaks being associated with use in residential and public settings (58). The potential risk for infection associated with using temporary venues filled with tap water without additional disinfection and filtration should be considered before use in residential settings. To reduce the risk for pathogen transmission, in addition to exclusion of persons with AGI, these pools should be emptied and cleaned at least daily. CDC recommendations on cleaning fill-and-drain pools are available at http://www.cdc.gov/healthywater/swimming/pools/inflatable-plastic-pools.html. On the basis of documented outbreaks such as the previously unreported campylobacteriosis outbreak associated with a fill-and-drain pool at a Maryland residential school (Table 8), these temporary venues should be eliminated from public use (e.g., at child care centers).
Treated Recreational Water Venues and Chloramines
Three outbreaks of ARI or eye irritation, two of which occurred in January, were caused or suspected to be caused by an accumulation of chloramines in the water and air of two indoor waterparks and an indoor school pool. Chloramines are disinfection by-products that result from chlorine oxidation of nitrogenous compounds (e.g., perspiration, saliva, urine, and body oils) commonly shed into the water by swimmers. Chloramines are generated in the water and can volatilize into the surrounding air. Swimmers’ water activities and features
FIGURE 10. Number of outbreaks of acute gastrointestinal illness associated with recreational water (n = 341), by type of exposure and year — Waterborne Disease and Outbreak Surveillance System, United States, 1978–2008
No.
of o
utbr
eaks
60
50
40
30
20
10
0
Year
1978 1980 1982 1984 1986 1988 1990 1992 1994 1996 1998 2000 2002 2004 2006 2008
UntreatedTreated

Surveillance Summaries
24 MMWR / September 23, 2011 / Vol. 60 / No. 12
that splash, spray, and aerate water disturb the water surface and promote the dispersion of chloramines into the atmosphere surrounding indoor treated recreational water venues (59,60). Air in these enclosed settings might be recycled more often in the winter to minimize heating costs, limiting the amount of fresh, cold air that is introduced and the amount of warm chloramine-polluted air that is exhausted. The resulting high levels of chloramines can cause ocular, respiratory tract, and mucous membrane irritation and also might be linked to asthma (61). As swimming in the United States evolves from a summertime into a year-round activity, indoor air-quality issues are likely to increase, and chloramines could become an increasingly important etiologic agent of treated recre-ational water–associated outbreaks. Two of the three outbreaks occurred at indoor waterparks. Such waterparks might be more prone to accumulation of chloramines in the air than traditional indoor recreational water venues with one or two
pools because of larger bather loads (i.e., more nitrogenous compounds are introduced into the water); more features such as wave pools, fountains, and slides that splash, spray, and aerate the water; and increased cost of maintaining the air tempera-ture of an increased number of enclosed cubic square feet. An investigation of an outbreak associated with the indoor Ohio waterpark revealed that the high placement of air supply and return ducts caused chloramines to accumulate in the air at the pool surface and deck level (23). After the ventilation system was reconstructed considerably, no new cases of respiratory and ocular symptoms were detected.
The variability in indoor air quality and shortage of labora-tories that perform analyses for airborne chloramines impedes investigators’ ability to respond to reports of ocular and respi-ratory distress. The length of time required for testing makes it difficult to obtain rapid and quantitative measurements of contamination of the air surrounding implicated indoor
FIGURE 11. Recreational water–associated outbreaks of acute gastrointestinal illness, by type of exposure and etiology — Waterborne Disease and Outbreak Surveillance System, United States, 1999–2008
* These include outbreaks caused by Salmonella, Campylobacter, Plesiomonas and outbreaks caused by multiple etiologies. † Percentages do not add up to 100.0% due to rounding.
Cryptosporidium spp.57.0%
Type of exposure (n = 228)
Treated water 71.9%
Untreated water 28.1%Escherichia coli 6.6%
Norovirus 9.6%
Shigella spp. 7.9%
Other* 4.4%
Unidenti�ed 11.0%
Etiology (n = 228)
Etiology: untreated water (n = 64) Etiology: treated water (n = 164)†
E. coli 17.2%
Norovirus 20.3%Shigella spp. 15.6%
Cryptosporidium spp. 12.5%
G. intestinalis 4.7%
Unidenti�ed 21.9%
Other* 7.8%
Unidenti�ed 6.7%
Norovirus 5.5%
Shigella spp. 4.9%
E. coli 2.4%G. intestinalis 3.0%
Cryptosporidium spp. 74.4%
Other* 3.0%
Giardia intestinalis 3.5%

Surveillance Summaries
MMWR / September 23, 2011 / Vol. 60 / No. 12 25
treated recreational water venues. Using the water’s measured total chlorine (i.e., the sum of free and combined chlorine levels) and free chlorine levels to calculate the level of com-bined chlorine, of which chloramines are a subset, might be useful for evaluating indoor air quality. Levels that exceed test kit capacity should be remeasured by making dilutions using distilled water. These outbreaks underscore the need to train pool operators to routinely monitor combined chlorine levels to protect the health of patrons and staff and the need for pub-lic health authorities to include the calculation of the water’s combined chlorine level as a standard part of pool inspections.
Accumulation of chloramines in the air surrounding indoor treated recreational water can be prevented by improving water treatment, swimmer hygiene, and air ventilation. Studies suggest that installation of ultraviolet or ozone treatment devices in circulation systems can reduce chloramine levels in the water (62–64) and also can effectively inactivate pathogens, including chlorine-tolerant Cryptosporidium. Because the nitrogenous compounds introduced into the water by swimmers are precursors to chloramine formation, swimmers must be engaged in any chloramine-reduction plan. Such an effort should raise public awareness about the role of urine and sweat in creating the ocular and respiratory irritants at treated recreational water venues. Plans to improve air quality also can be aided by working with the public to improve swimmer hygiene. Aquatics staff should encourage swimmers to at least rinse before entering the water and facilitate frequent bathroom breaks, particularly for young children (e.g., instituting adult-only swim times or short closures for water quality testing). Showering for 17 seconds has been demonstrated to decrease by 35%–60% the load of sweat and other pollutants that wash off of swimmers’ bodies (65).
Pool Chemical–Associated Outbreaks and Health Events
Nine pool chemical–associated outbreaks and 32 additional pool chemical–associated health events were reported to WBDOSS by Florida, Illinois, Kentucky, Maryland, Michigan, and New York. Data on additional pool chemical–associated health events are captured by the HSEES System and NEISS. Pool chemical–associated health events not only have the potential to impact individual and public health adversely but also have a negative financial impact. Approximately 60% of the injured individuals in the HSEES cohort and 100% of those in the NEISS cohort sought treatment in hospital EDs. Pool chemical–associated health events also might require responses from multiple government agencies and officials (e.g., fire fighters, police officers, paramedics, and hazardous materials personnel).
Analysis of HSEES data examined factors contributing to hazardous substance releases of pool chemicals. The most frequently reported factors contributing to HSEES events were human error and equipment failure. A review of the reports of 2007–2008 pool chemical–associated outbreaks and other health events reported to WBDOSS revealed common themes, including mixing of incompatible chemicals, improper handling of chemicals, and overreliance on automatic controllers. These findings indicate that pool chemical–associated health events are preventable through engineering, education, and enforcement. Examples of engineering-based prevention measures include electric interlocks and flow switch sensors, which shut down the chemical feed pumps when the circulation pump shuts down or during filter backwash and thus prevent concentrated chlorine and acid from mixing and generating toxic chlorine gas. Previous studies underscore that requiring pool operator training can reduce the number of water quality violations (66,67). Thus, future prevention efforts should require training for all public pool operators on preventive maintenance and how to read pool chemical labels and material safety data sheets, which include information on which chemicals are incompatible and proper chemical handling. Education efforts need to include operators in settings in which recreational water is not the primary focus (e.g., schools or hotels/motels). Given that pool chemical–associated health events frequently occur in the residential setting, messages about safe chemical handling (e.g., not handling chemicals in the presence of children) should also target residential pool owners.
Untreated Recreational Water VenuesThe proportion of AGI outbreaks associated with untreated
venues relative to treated venues decreased over the previous decade. However, the number of outbreaks associated with untreated venues has remained relatively constant. During 2007–2008, a total of 11 outbreaks of AGI associated with untreated freshwater venues were reported; all of these were linked to a lake, river, stream, or spring. Untreated venues have a higher proportion of outbreaks caused by chlorine-susceptible pathogens compared with treated venues.
Studies have determined the utility of monitoring (18) and testing for fecal indicator bacteria to assess the risk for recreational water–associated gastrointestinal illness (68–70) in large bodies of water (e.g., the Great Lakes and oceans). The NEEAR study is being conducted to evaluate rapid water quality testing methods that can produce results in <2 hours and to correlate these indicators with health effects among beachgoers. Results from freshwater Great Lakes beaches have demonstrated an association between an increasing signal detected by a quantitative polymerase chain reaction–based test method for enterococci and human health effects (68,71). Children aged <10 years were at greater

Surveillance Summaries
26 MMWR / September 23, 2011 / Vol. 60 / No. 12
risk for AGI following exposure to water with elevated levels of enterococci. The small inland water bodies associated with the outbreaks described in this report do not have consistent or identified external sources of contamination (e.g., sewage releases or overflows), suggesting that swimmers might be an important source of water contamination and pathogen transmission.
As with treated recreational water, human behavior plays a key role in the transmission of pathogens in untreated recreational water. Modification of swimmer behavior is critical in untreated water given the lack of disinfection and filtration barriers to pathogen transmission. Recommendations for swimmer hygiene in untreated recreational waters are the same as those discussed previously for treated recreational water. In addition, beach managers and swimmers should be aware that shallow, poorly circulated swimming areas, which are particularly desirable for young children learning toileting skills or wearing diapers, might pose a higher risk for exposure to swimmer-introduced pathogens compared with deeper, well-circulated swimming areas. Potential methods to improve circulation of water through beach areas should be explored to reduce the longevity of focal, swimmer-derived contamination and thus risk for pathogen transmission. In addition to improved swimmer hygiene, exposure to high bacteria levels also can be reduced by avoiding swimming after heavy rainfall at sites affected by runoff to reduce exposure to any increase in contaminants and by not swimming near storm drains or pipes that might release contamination into water bodies (72).
Chlorine was added routinely to both an Ohio lake associated with an outbreak of multiple infectious etiologies and a man-made lake associated with a 2008 Texas cryptosporidiosis outbreak. The Ohio beach manager reported adding chlorine to the water to improve water clarity, not to disinfect. Public health and environmental concerns about the addition of chlorine to untreated recreational water include swimmers believing mistakenly that the water is microbiologically safe.
Four outbreaks of confirmed and suspected cercarial dermatitis caused by avian schistosomes were reported during 2007–2008. Three were associated with fresh water and one with marine water. This self-limited disease is known to occur among persons exposed to lakes in which infected birds contaminate water inhabited by the intermediate host snail (73). The risk for acquiring cercarial dermatitis might be reduced by avoiding potentially contaminated lakes, avoiding shallow swimming areas in which infected snails reside, instituting a snail control program, and not attracting birds that transmit the schistosomes into swimming areas (e.g., not feeding them).
Marine WaterThree outbreaks were associated with exposure to contaminated
marine recreational water. Since 1978, only six such outbreaks have
been reported to WBDOSS. Although outbreaks associated with marine waters are reported infrequently, evidence from multiple sources demonstrates that contamination of marine waters is common and that swimming in marine waters is associated with increased risk for AGI (69,70). States and territories report water quality testing results and notification data for their coastal and Great Lakes recreational water to EPA. In 2009, one or more advisories or closure notices were issued for 1,642 (43.0%) of the 3,819 monitored coastal beaches because monitoring results for bacteria exceeded state or EPA standards (74). This represents an increase over previous years that might be attributable to increased monitoring, increased precipitation during the summer swim season in some coastal states, or the inclusion of preemptive closings made because of rainfall. Multiple studies have linked these water quality indicators with increased risk for recreational water–associated illnesses (69,70,75) although such pathogen transmission also can occur when water quality indicators are within established limits (76). The reasons for the infrequency of reported marine-associated outbreaks might include the wide geographic dispersion of residences of beachgoers and the fact that illnesses might not be attributed to swimming in marine waters. Prospective epidemiologic studies indicate that these beaches can be associated with illness despite an absence of reported outbreaks (68,71,77).
Algae toxicity. Toxin- or chemical-associated outbreaks can occur naturally. One outbreak that was caused by exposure to brevetoxins released by Karenia brevis near the Florida coast in 2007 resulted in at least 15 cases of illness (25). The outbreak investigation focused on dredging company workers, who reported symptoms such as throat and ocular irritation and coughing. The effects of this red-tide event on other populations are unknown. A study of the economic impact of Karenia brevis in one Florida county during 2001–2006 estimated the marginal costs of illness to be between $500,000 and $4 million dollars (78). Closure or restricted recreational use of marine beaches and freshwater lakes and ponds because of algal blooms might also result in concerns about lost revenue at the local or regional level (79). No U.S. federal regulations or official EPA guidelines specify allowable concentrations of toxins related to harmful algal blooms in water.
Other Recreational Water–Associated Health Events
VibriosisThe number of Vibrio infections associated with water
exposures during 2007–2008 (n = 236) was higher than the number reported in 2005–2006 (n = 189) (28,29). The majority of deaths and hospitalizations were caused by V. vulnificus infection, which occurs predominantly in the Gulf Coast. V. vulnificus wound infection can cause severe illness and

Surveillance Summaries
MMWR / September 23, 2011 / Vol. 60 / No. 12 27
sequelae, including septicemia, and require amputation. Disease is more common and severe among persons with preexisting wounds and chronic medical conditions (e.g., diabetes, heart disease, or liver disease) (80,81). In general, swimmers with open wounds or sores should refrain from swimming.
Primary Amebic MeningoencephalitisEight fatal cases of PAM caused by Naegleria fowleri were
reported for 2007–2008 (Table 16). This rare disease is of public health importance because of the high (>99%) fatality rate associated with infection (82) and the public alarm it raises about the recreational use of freshwater. N. fowleri is a free-living ameba that proliferates in warm freshwater and hot springs. Disease occurs when the ameba coincidentally enters the nasal passages, travels to the olfactory lobe of the brain, and infects brain tissue. The eight cases all resulted from warm freshwater exposures in southern states during the summer.
The limited number of PAM cases makes it difficult to determine why certain persons become infected. As a result, the efficacy of existing risk-reduction strategies is uncertain. Lake water surveys conducted in southern states have frequently detected Naegleria (83–85), and PAM case reports demonstrate recent exposure to swimming in warm, freshwater lakes, rivers, or hot springs. Swimmers might reduce their risk for Naegleria infection by avoiding water-related activities in warm freshwater during periods of high water temperature and low water levels; holding the nose shut or using nose clips when taking part in water-related activities in bodies of warm freshwater; and refraining from digging in or stirring up sediment while swimming in shallow, warm, freshwater areas (86). CDC is collaborating with CSTE and individual states to improve case investigations by collecting exposure, symptom, treatment, and environmental data. Systematic collection of these data could help refine current risk-reduction measures and guidance.
PreventionRecreational water–associated illness can be prevented through
concerted efforts by public health professionals, recreational water venue operators, and the general public. Given the different stakeholders required to promote healthy and safe swimming, good communication among these groups is imperative.
Public health professionals regulate recreational water facilities and investigate outbreaks as a multidisciplinary team (e.g., including laboratorians, environmental health specialists, and epidemiologists within and among jurisdictions). They also function as an important source of information for operators and the swimming public. Public health professionals should
• haveopportunitiestomaintainandbuilduponcurrentknowledge about recreational water–associated illness and operation,
• updateandimprovecodestostaycurrentwithchangingdesigns and needs demonstrated by findings of outbreak investigations,
• leadandcollaboratewiththeaquaticsindustrytoeducatethe general public,
• useinspectionandbeachmonitoringdataassurveillancedatato inform public health decision-making and program plan-ning, and
• developexpertiseindetectingandinvestigatingrecreationalwater–associated outbreaks and other health events.
Various tools are available to operators of treated recreational water venues to protect the health and safety of swimmers and aquatics staff. The traditional paradigm of two barriers (disinfection and filtration) to pathogen transmission in treated recreational water needs to shift to include in-line (i.e., usually installed after filtration and before disinfection) secondary or supplemental treatment (e.g., ultraviolet treatment or ozonation). Ultraviolet and ozone treatment not only will increase the level of protection against chlorine-tolerant Cryptosporidium but also will break down chloramines. Because these systems depend on circulation, they alone will not eliminate outbreaks; a commitment to monitoring and maintaining water quality and educating the public (e.g., including healthy swimming messages in posters in bathrooms, on the back of ticket stubs, and in contracts for group events) also is critical. To maximize their ability to protect the health and safety of swimmers and aquatics staff, pool operators working in all public settings should complete training that includes such topics as disinfection, water chemistry, preventive maintenance, chemical safety, and illness and injury prevention. In response to the lack of protective barriers at untreated recreational water venues (e.g., lakes and oceans), beach managers and public health officials should implement water quality testing programs and educate swimmers about prevention measures specific to untreated recreational water venues (e.g., not swimming after heavy rainfall) and for illnesses unlikely to be prevented by current water quality guidelines (e.g., vibriosis, PAM, and otitis externa).
Swimmers are an important source of recreational water contamination (i.e., pathogens and nitrogenous compounds); thus, it is imperative to educate the public about healthy swimming behaviors. The general public also can participate in the healthy swimming effort by checking chlorine and pH levels before getting into treated recreational water, asking operators of treated recreational water venues about the latest inspection score, encouraging operators to take steps known to kill Cryptosporidium, educating other swimmers about healthy swimming, and reporting operational issues, if not corrected, to public health agencies.

Surveillance Summaries
28 MMWR / September 23, 2011 / Vol. 60 / No. 12
LimitationsThe findings in this report are subject to at least four main
limitations. First, differences in the numbers of outbreaks reported by different jurisdictions might be attributable to factors such as the variable requirements for notifiable diseases and variable public health capacity to detect, investigate, and report recreational water–associated outbreaks. Thus, the jurisdictions reporting outbreaks most frequently might not be the jurisdictions in which the outbreaks most frequently occur (87). Second, factors such as incubation period, size and location of the outbreak exposure, severity of illness, and geographic dispersion of ill swimmers also likely influence the detection, investigation, and reporting of recreational water–associated outbreaks. Larger outbreaks are more likely to be identified by public health authorities. In contrast, smaller outbreaks (e.g., those associated with residential pools and spas) might go undetected because fewer persons are ill, and they might attribute illness to other common exposures. In addition, outbreaks associated with venues that draw from a wide geographic range (e.g., large lakes and marine beaches or hotel/motel pools or spas) might be difficult to detect because potentially infected persons disperse widely from the site of exposure and, therefore, cases of illness might be less likely to be identified as part of an outbreak. Prospective epidemiology studies, such as EPA’s NEEAR Water Study (68), have revealed elevated rates of AGI in swimmers compared with nonswimmers at all beaches studied. Multiple other prospective studies of AGI associated with beach swimming have also indicated elevated rates of illness associated with swimming in lakes and oceans, though few outbreaks have been detected (69,76). Data on endemic recreational water–associated illnesses are not captured by WBDOSS, highlighting the need for more studies to estimate the magnitude of risk for illness for routine, nonoutbreak-associated exposures at recreational water venues. Third, the incidence of recreational water–associated outbreaks of cryptosporidiosis in 2007 might be overestimated in this report. The statewide outbreak in Utah and the individual outbreaks in neighboring Idaho and Wyoming might have been a single multistate outbreak. Of note, Colorado also detected a statewide increase in cryptosporidiosis cases in the summer of 2007 that was determined to be associated with multiple risk factors in multiple counties (88). In 2007, had Cryptosporidium isolates from each health event been available for subtyping, investigators might have been able to determine if they were linked to each other. Finally, few outbreak reports included findings from environmental health investigations of the implicated venue. It is unclear whether environmental health investigations were not conducted or the findings were not included in reports. Whereas epidemiologic investigations provide data that characterize outbreaks, data from environmental health investigations can be used to identify factors that contributed to the outbreak to help prevent future outbreaks.
This is the first surveillance summary to present pool chemical–associated health event data from multiple surveillance systems, and the data provided in this report regarding such events are subject to at least six additional limitations. First, injuries, illness, or pool chemical spills might not be serious enough to require outside assistance and thus are not detected. Second, because communication channels might not be established between public health agencies and emergency responders, certain pool chemical–associated health events might not be reported. Such communication is important because the outbreaks and other health events caused by pool chemicals might be more likely to involve first responders and hazardous materials personnel than waterborne disease coordinators, who voluntarily report outbreaks to WBDOSS. This in part might be the reason why pool chemical–associated outbreaks and other health events were reported to WBDOSS by only six states. Third, water chemistry can change quickly and contaminated air can be ventilated rapidly, making it difficult to determine the etiology of a pool chemical–associated health event. This might explain why the etiologies of nine outbreaks were not determined but are suspected to have been caused by excess chlorine, disinfection by-product levels, or altered pool chemistry. Fourth, the approximately 100 hospitals participating in NEISS and the 12 states participating in HSEES and reporting events might not be representative of the United States, and therefore the findings might not be generalizable. Fifth, the fact that “chlorine” was the only chemical term used to search the HSEES system database might have created a bias for not identifying events caused by other pool chemicals. Finally, no one surveillance system collects data on all events, but, rather, each collects data on a subset of the events. This leads to the possibility of not collecting data on events that do not meet the case definition of any of the systems but could also lead to duplicate reporting. For example, health event data reported to NEISS also might be reported to either WBDOSS or the HSEES System. NEISS location data are limited to type of setting (e.g., residence or school) and do not include information such as the state or county in which the event occurred; this precludes de-duplication of reports across all surveillance datasets.
ConclusionCDC and ATSDR can lead the effort to prevent recreational
water–associated outbreaks and other health events by 1) spearheading the efforts to set minimum national standards to protect the health and safety of swimmers and aquatics staff at treated recreational water venues; 2) providing data to advocate for waterborne disease prevention and control efforts; 3) continuing to provide web-based and other healthy swimming resources for public health partners, the public, and the aquatics industry; and

Surveillance Summaries
MMWR / September 23, 2011 / Vol. 60 / No. 12 29
4) coordinating efforts among agencies to prevent pool chemical–associated health events. Multiple federal organizations provide assistance with investigations of recreational water–associated outbreaks and other health events (Box).
In 2005, at the request of CSTE, experts from local, state, and federal public health agencies and representatives from the aquatics industry met in Atlanta at a CDC-sponsored workshop on preventing recreational water–associated illnesses at treated recreational water venues. Setting uniform national aquatic stan-dards was determined to be a key prevention and control measure.
Since 2007, the New York State Department of Health and CDC have spearheaded an all-stakeholder effort to develop a Model Aquatic Health Code (MAHC) (available at http://www.cdc.gov/healthywater/swimming/pools/mahc). MAHC has two primary objectives: 1) to be a free, science-based health code that reduces risk for illness and injury at treated recreational water venues, and 2) to serve as a model available for voluntary adoption by state and local public health agencies to facilitate an evolution from disparate pool regulations across the country into a set of national uniform standards. The 12 MAHC modules cover such topics as disinfection and water quality, operator training, hygiene facilities, and ventilation and air quality; it is anticipated that the modules will be made publicly available in 2012.
To help support waterborne disease detection, investigation, and reporting, CDC should collect and report on data through research initiatives that underscore the importance of waterborne disease in the United States. Estimates of the magnitude and cost of waterborne disease and magnitude of recreational water exposure can be used to advocate for prevention and control measures. In addition, bolstering waterborne disease surveillance can promote prevention and control. For example, given that Cryptosporidium is the predominant etiologic agent of recreational water–associated outbreaks and has the ability to cause communitywide outbreaks, CDC should systemically collect stool specimens and utilize molecular epidemiology tools to subtype isolates to help elucidate the epidemiology of cryptosporidiosis (89).
Since 2001, CDC has posted healthy swimming messages and resources on its Healthy Swimming website.§§ This communication tool allows CDC to share outbreak investigation resources and lessons learned with public health partners, educate the public about healthy swimming, and provide recommendations to the aquatics industry. The website highlights Recreational Water Illness and Injury Prevention Week, which is the week before Memorial Day and represents a health communications opportunity to educate the public about healthy swimming behaviors.
Finally, ATSDR and CDC collect data on pool chemical–associated health events. The data suggest that such events are both common and preventable. The data also indicate the need for a coordinated effort to establish the magnitude of these health events, more completely characterize their epidemiology, refine prevention and spill response recommendations, and develop prevention tools. To optimize health communication to operators, residential pool owners, and pool chemical manufacturers, ATSDR/CDC messages should balance the needs to chemically disinfect to prevent and control pathogen transmission and to reduce the incidence pool chemical–associated health events.
In 2009, CDC transitioned to electronic reporting through the National Outbreak Reporting System (NORS)¶¶ for water-borne disease outbreaks occurring on or after January 1, 2009. As waterborne disease outbreak reporting to CDC transitions from a paper-based to an electronic system, the number of reported recreational water–associated outbreaks might increase. Efforts to improve the quality and completeness of WBDOSS data include activities such as NORS webinars for and e-mail updates to epidemiology, environmental health, and laboratory partners at the local, state, and federal levels; web-accessible training materials for public health staff respon-sible for voluntary reporting; and collaboration across CDC programs to streamline reporting, provide technical support, and develop new NORS reporting tools. One of the key improvements in NORS reporting is the inclusion of more standardized fields to report environmental health investigation data. All of these efforts aim to generate surveillance data that better inform the development and implementation of more effective waterborne disease prevention and control guidelines and standards such as the MAHC and ultimately reduce the burden of recreational water–associated illness and injury.
Acknowledgments
This report is based in part on data provided by state, territorial, local, and FAS waterborne disease coordinators; state, territorial, local, and FAS epidemiologists and environmental health personnel and on contributions by Sarah A. Collier, MPH, Lina I. Brou, MPH, Alexandra L. Shevach, Kelly A. Jackson, MPH, Ezra J. Barzilay, MD, Division of Foodborne, Waterborne, and Environmental Diseases, National Center for Emerging and Zoonotic Infectious Diseases; Rose A. Rudd, MSPH, Division of Unintentional Injury Prevention, National Center for Injury Prevention and Control; Aron J. Hall, DVM, Veronica P. Costantini, PhD, Division of Viral Diseases, National Center for Immunization and Respiratory Diseases; Lorraine C. Backer, PhD, Division of Environmental Hazards and Health Effects, National Center for Environmental Health; Charles Otto, MPA, Division of Emergency and Environmental Health Services, National Center for Environmental Health, CDC.
§§ Available at http://www.cdc.gov/healthywater/swimming.
¶¶ Available at http://www.cdc.gov/healthywater/statistics/wbdoss/nors/index.html.

Surveillance Summaries
30 MMWR / September 23, 2011 / Vol. 60 / No. 12
References 1. Craun GF. Waterborne diseases in the United States. Boca Raton, FL:
CRC Press; 1986. 2. Yoder JS, Roberts V, Craun GF, et al. Surveillance for waterborne disease and
outbreaks associated with drinking water and water not intended for drinking—United States, 2005–2006. MMWR 2008;57(No. SS-9):39–62.
3. Liang JL, Dziuban EJ, Craun GF, et al. Surveillance for waterborne disease and outbreaks associated with drinking water and water not intended for drinking—United States, 2003–2004. MMWR 2006;55(No. SS-12):31–65.
4. Blackburn BG, Craun GF, Yoder JS, et al. Surveillance for waterborne-disease outbreaks associated with drinking water—United States, 2001–2002. MMWR 2004;53(No. SS-8):23–45.
5. Lee SH, Levy DA, Craun GF, et al. Surveillance for waterborne-disease outbreaks—United States, 1999–2000. MMWR 2002;51(No. SS-8):1–47.
6. Barwick RS, Levy DA, Craun GF, et al. Surveillance for waterborne-disease outbreaks—United States, 1997–1998. MMWR 2000;49(No. SS-4):1–21.
7. Levy DA, Bens MS, Craun GF, Calderon RL, Herwaldt BL. Surveillance for waterborne-disease outbreaks—United States, 1995–1996. MMWR 1998;47(No. SS-5):1–34.
8. Kramer MH, Herwaldt BL, Craun GF, Calderon RL, Juranek DD. Surveillance for waterborne-disease outbreaks—United States, 1993–1994. MMWR 1996;45(No. SS-1).
9. Moore AC, Herwaldt BL, Craun GF, Calderon RL, Highsmith AK, Juranek DD. Surveillance for waterborne disease outbreaks—United States, 1991–1992. MMWR 1993;42(No. SS-5):1–22.
10. Herwaldt BL, Craun GF, Stokes SL, Juranek DD. Waterborne-disease outbreaks, 1989–1990. MMWR 1991;40(No. SS-3):1–21.
11. Levine WC, Stephenson WT, Craun GF. Waterborne disease outbreaks, 1986–1988. MMWR 1990;39(No. SS-1):1–13.
12. St Louis ME. Water-related disease outbreaks, 1985. MMWR 1988;37(No. SS-2):15–24.
13. Yoder JS, Hlavsa MC, Craun GF, et al. Surveillance for waterborne disease and outbreaks associated with recreational water use and other aquatic facility-associated health events—United States, 2005–2006. MMWR 2008;57(No. SS-9):1–29.
BOX. Federal organizations that provide assistance with investigations of recreational water–associated outbreaks and other health events
State health departments and other reporting jurisdictions can request epidemiologic assistance and laboratory testing from CDC. CDC also can be consulted regarding engineer-ing and environmental health aspects of recreational water treatment and collection of proper water samples to identify pathogenic viruses, bacteria, and parasites. Requests for assistance with waterborne disease outbreak investigations (e.g., epidemiologic assistance, water test-ing, diagnosis of free-living ameba infection, or molecu-lar characterization of Cryptosporidium and Giardia)
Waterborne Disease Prevention BranchDivision of Foodborne, Waterborne, and
Environmental DiseasesNational Center for Emerging and Zoonotic Infectious
Diseases, CDCTelephone: 404-639-1700Email: [email protected]: http://www.cdc.gov/healthywater
Requests for diagnostic testing for viral pathogensDivision of Viral DiseasesNational Center for Immunization and Respiratory
Diseases, CDCTelephone: 800-232-4636
Requests for diagnostic testing for enteric bacterial pathogens
Enteric Diseases Laboratory BranchDivision of Foodborne, Waterborne, and
Environmental DiseasesNational Center for Emerging and Zoonotic Infectious
Diseases, CDCTelephone: 404-639-3334
Requests for information or diagnostic testing for para-sites (except for Cryptosporidium, Giardia, or free-living amebas)
Division of Parasitic Diseases and MalariaCenter for Global Health, CDCTelephone: 404-718-4745Internet: http://www.cdc.gov/parasites
Requests for information or testing for LegionellaDivision of Bacterial DiseasesNational Center for Immunization and Respiratory
Diseases, CDCTelephone: 404-639-2215Internet: http://www.cdc.gov/legionella
Resources for pool chemical–associated health eventsATSDR National Toxic Substances Incidents Program
(NTSIP)Internet: http://www.atsdr.cdc.gov/ntsip 24 hours/7 days chemical spill hotlines— To report chemical spills, telephone the National
Response Center (NRC) at 800-424-8802 or report via the Internet: www.nrc.uscg.mil
— For medical advice, telephone the National Poison Center at 800-222-1222
— For public health assistance during a chemical emer-gency, telephone the CDC Emergency Operations Center at 770-488-7100.
Resources for harmful algal bloomsHealth Studies BranchDivision of Environmental Hazards and Health EffectsNational Center for Environmental Health, CDCTelephone: 866-556-0544

Surveillance Summaries
MMWR / September 23, 2011 / Vol. 60 / No. 12 31
14. Dziuban EJ, Liang JL, Craun GF, et al. Surveillance for waterborne disease and outbreaks associated with recreational water—United States, 2003–2004. MMWR 2006;55(No. SS-12):1–30.
15. Yoder JS, Blackburn BG, Craun GF, et al. Surveillance for waterborne-disease outbreaks associated with recreational water—United States, 2001–2002. MMWR 2004;53(No. SS-8):1–22.
16. Brunkard JM, Ailes E, Roberts VA, et al. Surveillance for waterborne disease outbreaks associated with drinking water—United States, 2007–2008. MMWR 2011;60(No. SS-10):38–75.
17. CDC. Water-related disease outbreaks annual summary, 1981. Atlanta, GA: US Department of Health and Human Services, CDC; 1982.
18. Environmental Protection Agency. Bacterial ambient water quality criteria for marine and fresh recreational waters. Cincinnati, OH: National Service Center for Environmental Publications; 1986.
19. Environmental Protection Agency. Water quality standards for coastal and Great Lakes recreation waters. Federal Register 2004;69:67217-43.
20. Agency for Toxic Substances and Disease Registry. Hazardous Substance Emergency Events Surveillance System, biennial report 2007–2008. Available at http://www.atsdr.cdc.gov/hs/hsees. Accessed August 12, 2011.
21. CDC. Pool chemical–associated health events in public and residential settings—United States, 1983–2007. MMWR 2009;58:489–93.
22. CDC. Vessel Sanitation Program: outbreak updates for international cruise ships. Available at http://www.cdc.gov/nceh/vsp/surv/GIlist.htm#years. Accessed August 12, 2011.
23. CDC. Respiratory and ocular symptoms among employees of a hotel indoor waterpark resort—Ohio, 2007. MMWR 2009;58:81–5.
24. Dang B, Chen L, Mueller C, et al. Ocular and respiratory symptoms among lifeguards at a hotel indoor waterpark resort. J Occup Environ Med 2010;52:207–13.
25. CDC. Illness associated with red tide—Nassau County, Florida, 2007. MMWR 2008;57:717–20.
26. Benin AL, Benson RF, Arnold KE, et al. An outbreak of travel-associated Legionnaires disease and Pontiac fever: the need for enhanced surveillance of travel-associated legionellosis in the United States. J Infect Dis 2002;185:237–43.
27. Benkel DH, McClure EM, Woolared D, et al. Outbreak of Legionnaires’ disease associated with a display whirlpool spa. Int J Epidemiol 2000;29:1092–8.
28. CDC. Summary of human Vibrio cases reported to CDC, 2007. Available at http://www.cdc.gov/nationalsurveillance/PDFs/CSTEVibrio2007.pdf. Accessed August 12, 2011.
29. CDC. Summary of human Vibrio isolates reported to CDC, 2008. Available at http://www.cdc.gov/nationalsurveillance/PDFs/Jackson_Vibrio_CSTE2008_FINAL.pdf. Accessed August 12, 2011.
30. Hopkins RS, Shillam P, Gaspard B, Eisnach L, Karlin RJ. Waterborne disease in Colorado: three years’ surveillance and 18 outbreaks. Am J Public Health 1985;75:254–7.
31. CDC. Swimming-associated cryptosporidiosis—Los Angeles County. MMWR 1990;39:343–5.
32. Shields JM, Hill VR, Arrowood MJ, Beach MJ. Inactivation of Cryptosporidium parvum under chlorinated recreational water conditions. J Water Health 2008;6:513–20.
33. Yoder JS, Beach MJ. Cryptosporidium surveillance and risk factors in the United States. Exp Parasitol 2010;124:31–9.
34. CDC. Violations identified from routine swimming pool inspections—selected states and counties, United States, 2008. MMWR 2010;59:582–7.
35. Podewils LJ, Zanardi Blevins L, Hagenbuch M, et al. Outbreak of norovirus illness associated with a swimming pool. Epidemiol Infect 2007;135:827–33.
36. Shin GA, Sobsey MD. Inactivation of norovirus by chlorine disinfection of water. Water Res 2008;42:4562–8.
37. Zheng DP, Widdowson MA, Glass RI, Vinje J. Molecular epidemiology of genogroup II-genotype 4 noroviruses in the United States between 1994 and 2006. J Clin Microbiol 2010;48:168–77.
38. Jokipii L, Jokipii AM. Timing of symptoms and oocyst excretion in human cryptosporidiosis. N Engl J Med 1986;315:1643–7.
39. CDC. Communitywide cryptosporidiosis outbreak—Utah, 2007. MMWR 2008;57:989–93.
40. Turabelidze G, Lin M, Weisner T, Zhu BP. Communitywide outbreak of cryptosporidiosis in rural Missouri associated with attendance at child care centers. Arch Pediatr Adolesc Med 2007;161:878–83.
41. Wheeler C, Vugia DJ, Thomas G, et al. Outbreak of cryptosporidiosis at a California waterpark: employee and patron roles and the long road towards prevention. Epidemiol Infect 2007;135:302–10.
42. Gerba CP. Assessment of enteric pathogen shedding by bathers during rcreational activity and its impact on water quality. Quant Microbiol 2000;2:55–68.
43. Liguori G, Castaldi S, Signorelli C, et al. [Hygienic risks in swimming pool: knowledge and behaviours of consumers of three structures in Crema, Parma and Naples]. Ann Ig 2007;19:325–35.
44. McClain J, Bernhardt JM, Beach MJ. Assessing parents’ perception of children’s risk for recreational water illnesses. Emerg Infect Dis 2005;11:670–6.
45. CDC. Cryptosporidiosis outbreaks associated with recreational water use—five states, 2006. MMWR 2007;56:729–32.
46. Betancourt WQ, Rose JB. Drinking water treatment processes for removal of Cryptosporidium and Giardia. Vet Parasitol 2004;126:219–34.
47. Craik SA, Weldon D, Finch GR, Bolton, JR, Belosevic M. Inactivation of Cryptosporidium parvum oocysts using medium- and low-pressure ultraviolet radiation. Water Res 2001;35:1387–98.
48. Rochelle PA, Upton SJ, Montelone BA, Woods K. The response of Cryptosporidium parvum to UV light. Trends Parasitol 2005;21:81–7.
49. Corona-Vasquez B, Samuelson A, Rennecker JL, Marinas BJ. Inactivation of Cryptosporidium parvum oocysts with ozone and free chlorine. Water Res 2002;36:4053–63.
50. Korich DG, Mead JR, Madore MS, Sinclair NA, Sterling CR. Effects of ozone, chlorine dioxide, chlorine, and monochloramine on Cryptosporidium parvum oocyst viability. Appl Environ Microbiol 1990;56:1423–8.
51. Shields JM, Arrowwood MJ, Hill VR, Beach MJ. The effect of cyanuric acid on the disinfection rate of Cryptosporidium parvum in 20-ppm free chlorine. J Water Health 2009;7:109–14.
52. CDC. Cryptosporidiosis Outbreak Response & Evaluation (CORE) guidelines. Available at http://www.cdc.gov/parasites/crypto/resources/core_guidelines.pdf. Accessed August 12, 2011.
53. Fields BS, Benson RF, Besser RE. Legionella and Legionnaires’ disease: 25 years of investigation. Clin Microbiol Rev 2002;15:506–26.
54. Price D, Ahearn DG. Incidence and persistence of Pseudomonas aeruginosa in whirlpools. J Clin Microbiol 1988;26:1650–4.
55. Gustafson TL, Band JD, Hutcheson RH Jr, Schaffner W. Pseudomonas folliculitis: an outbreak and review. Rev Infect Dis 1983;5:1–8.
56. Storey MV, Winiecka-Krusnell J, Ashbolt NJ, Stenstrom TA. The efficacy of heat and chlorine treatment against thermotolerant Acanthamoebae and Legionellae. Scand J Infect Dis 2004;36:656–62.
57. CDC. Surveillance data from public spa inspections—United States, May–September 2002. MMWR 2004;53:553–5.
58. CDC. Shigellosis outbreak associated with an unchlorinated fill-and-drain wading pool—Iowa, 2001. MMWR 2001;50:797–800.
59. Emanuel BP. The relationship between pool water quality and ventilation. J Environ Health 1998;61:17.
60. Hery M, Hecht G, Gerber JM, Gendre JC, Hubert G, Rebuffaud J. Exposure to chloramines in the atmosphere of indoor swimming pools. Ann Occup Hyg 1995;39:427–39.
61. Weisel CP, Richardson SD, Nemery B, et al. Childhood asthma and environmental exposures at swimming pools: state of the science and research recommendations. Environ Health Perspect 2009;117:500–7.
62. Cassan D, Mercier B, Castex F, Rambaud A. Effects of medium-pressure UV lamps radiation on water quality in a chlorinated indoor swimming pool. Chemosphere 2006;62:1507–13.

Surveillance Summaries
32 MMWR / September 23, 2011 / Vol. 60 / No. 12
63. Li J, Blatchley ER 3rd. UV photodegradation of inorganic chloramines. Environ Sci Technol 2009;43:60–5.
64. Hagg WR, Hoigne J. Ozonation of water containing chlorine or chloramines. Water Res 1983;17:1397–402.
65. Keuten M, Verberk JQJC, Pleumeekers O, van Spengen J, van Dijk JC. Determination and reduction of bathing loads in public swimming pools [Presentation]. Swimming Pool & Spa International Conference, London, UK; March 17–20, 2009.
66. Johnston K, Kinziger M. Certified operators: does certification provide significant results in real-world pool and spa chemistry? Int J Aquatic Res Educ 2007;1:18–22.
67. Buss BF, Safranek TJ, Magri JM, Torok TJ, Beach MJ, Foley BP. Association between swimming pool operator certification and reduced pool chemistry violations—Nebraska, 2005–2006. J Environ Health 2009;71:36–40.
68. Wade TJ, Calderon RL, Sams E, et al. Rapidly measured indicators of recreational water quality are predictive of swimming-associated gastrointestinal illness. Environ Health Perspect 2006;114:24–8.
69. Pruss A. Review of epidemiological studies on health effects from exposure to recreational water. Int J Epidemiol 1998;27:1–9.
70. Wade TJ, Pai N, Eisenberg JN, Colford JM, Jr. Do U.S. Environmental Protection Agency water quality guidelines for recreational waters prevent gastrointestinal illness? A systematic review and meta-analysis. Environ Health Perspect 2003;111:1102–9.
71. Wade TJ, Calderon RL, Brenner KP, et al. High sensitivity of children to swimming-associated gastrointestinal illness: results using a rapid assay of recreational water quality. Epidemiology 2008;19:375–83.
72. Schiff KC, Morton J, Weisberg SB. Retrospective evaluation of shoreline water quality along Santa Monica Bay beaches. Marine Environmental Research;56:245–53.
73. Verbrugge LM, Rainey JJ, Reimink RL, Blankespoor HD. Swimmer’s itch: incidence and risk factors. Am J Public Health 2004;94:738–41.
74. Environmental Protection Agency. U.S. EPA’s beach report: 2009 swimming season. May 2010. EPA 820-F-10-003. Available at http://water.epa.gov/type/oceb/beaches/upload/report2009.pdf. Accessed August 12, 2011.
75. Nobles RE, Brown P, Rose J, Lipp E. The investigation and analysis of swimming-associated illness using the fecal indicator enterococcus in southern Florida’s marine water. J Environ Health 2000;169:13–9.
76. Colford JM Jr, Wade TJ, Schiff KC, et al. Water quality indicators and the risk of illness at beaches with nonpoint sources of fecal contamination. Epidemiology 2007;18:27–35.
77. Wade TJ, Sams E, Brenner KP, et al. Rapidly measured indicators of recreational water quality and swimming-associated illness at marine beaches: a prospective cohort study. Environ Health 2010;9:66.
78. Hoagland P, Anderson DM, Kaoru Y, White AW. The economic effects of harmful algal blooms in the United States: estimates, assessment issues, and information needs. Estuaries 2002;25:819–37.
79. Rabinovici SJ, Bernknopf RL, Wein AM, Coursey DL, Whitman RL. Economic and health risk trade-offs of swim closures at a Lake Michigan beach. Environ Sci Technol 2004;38:2737–45.
80. Dechet AM, Yu PA, Koram N, Painter J. Nonfoodborne Vibrio infections: an important cause of morbidity and mortality in the United States, 1997–2006. Clin Infect Dis 2008;46:970–6.
81. Oliver JD. Wound infections caused by Vibrio vulnificus and other marine bacteria. Epidemiol Infect 2005;133:383–91.
82. Yoder JS, Eddy BA, Visvesvara GS, Capewell L, Beach MJ. The epidemiology of primary amoebic meningoencephalitis in the USA, 1962–2008. Epidemiol Infect 2010;138:968–75.
83. Ettinger MR, Webb SR, Harris SA, McIninch SP, Garmon GC, Brown BL. Distribution of free-living amoebae in James River, Virginia, USA. Parasitol Res 2003;89:6–15.
84. John DT, Howard MJ. Seasonal distribution of pathogenic free-living amebae in Oklahoma waters. Parasitology Research 1995;81:193–201.
85. Wellings FM, Amuso PT, Chang SL, Lewis AL. Isolation and identification of pathogenic Naegleria from Florida lakes. Appl Environ Microbiol 1977;34:661–7.
86. CDC. Primary amebic meningoencephalitis—Arizona, Florida, and Texas, 2007. MMWR 2008;57:573–7.
87. Middaugh JP, Hammond RM, Eisenstein L, Lazensky R. Using the Electronic Foodborne Outbreak Reporting System (eFORS) to improve foodborne outbreak surveillance, investigations, and program evaluation. J Environ Health 2010;73:8–11.
88. Valderrama AL, Hlavsa MC, Cronquist A, et al. Multiple risk factors associated with a large statewide increase in cryptosporidiosis. Epidemiol Infect 2009;137:1781–8.
89. Chalmers RM, Elwin K, Thomas AL, Guy EC, Mason B. Long-term Cryptosporidium typing reveals the aetiology and species-specific epidemiology of human cryptosporidiosis in England and Wales, 2000 to 2003. Euro Surveill 2009;14:9–14.

Surveillance Summaries
MMWR / September 23, 2011 / Vol. 60 / No. 12 33
Appendix AGlossary of Definitions
backwash Flow of water through filter element(s) or media in a reverse direction to dislodge and remove accumulated dirt, debris, or filter aid from the filter tank.
bather load The number of bathers using a swimming pool or spa at any one time. The maximum bather load is usually determined by a state or local pool code and is based on surface area and depth of the pool or spa.
biofilm Microbial cells that adhere to a moist or water-covered surface through a matrix of primarily polysaccharide materials in which they are encapsulated. Biofilms can grow on piping and surfaces of aquatic venues and can be very difficult to remove. They protect microbes from disinfectants (e.g., chlorine) in the water.
cercarial dermatitis Dermatitis caused by contact with or direct invasion through the skin or a break in the skin by the cercariae (larval stage) of certain species of schistosomes. The normal hosts of these species are birds and non-human mammals. Dermatitis is an allergic response to contact with cercariae and does not lead to parasitic infestation in humans and produces no long-term disease.
class Waterborne disease outbreaks are classified according to the strength of the epidemiologic and clinical laboratory data, and environmental data implicating recreational water as the source of the outbreak (see Table 1).
chloramines A group of disinfection by-products or weak disinfectants formed when free chlorine combines with nitrogen-containing compounds (e.g., urine or perspiration) in the water. Tri- and di-chloramine can cause eye and respiratory (e.g., lung and throat) irritation and can accumulate in the water and air surrounding treated recreational water venues. In drinking water treatment, monochloramine is used for disinfection to reduce formation of disinfection by-products created when using chlorine as a disinfectant (see combined chlorine level).
combined chlorine Chlorine that has combined with organic or inorganic compounds in the water and is no longer an effective disinfectant for recreational water. The combined chlorine level is derived by subtracting the water’s free chlorine test level from its total chlorine test level. This level is likely to include combined compounds in addition to chloramines (see chloramines).
communitywide outbreak This outbreak typically starts as a focal outbreak associated with one recreational water venue and evolves into an outbreak associated with multiple recreational water venues or other settings, such as child care centers in a community.
contact time The length of time that recreational water and any pathogens in the water are exposed to a disinfectant, usually measured in minutes (e.g., chlorine contact time).
disinfection A treatment that kills microorganisms (e.g., bacteria, viruses, and parasites); in water treatment, a chemical (commonly chlorine, chloramine, or ozone) or physical process (e.g., ultraviolet radiation) can be used.
disinfection by-products Chemicals formed in water through reactions between organic or inorganic matter and disinfectants. Examples include chloramines, also known as combined chlorines. These chemicals might have acute or chronic health effects.
etiology The pathogen, chemical, or toxin causing a waterborne disease outbreak or other health event. Infectious etiologies include bacteria, parasites, and viruses.
fill-and-drain pools Small pools or slides that often are constructed of plastic and that might be inflatable. These pools and slides are filled with tap water without any ongoing chemical disinfection or filtration.
filtration In water treatment, the process of passing water through one or more permeable membranes or media of small diameter (e.g., sand, anthracite, or diatomaceous earth) to remove suspended particles from the water. Filters might be effective in removing pathogens, depending on the type and operation.

Surveillance Summaries
34 MMWR / September 23, 2011 / Vol. 60 / No. 12
free chlorine Chlorine in water (found as an aqueous mixture of hypochlorous acid and hypochlorite anion) that has not combined with other constituents; therefore, it is able to serve as an effective disinfectant (also referred to as free available chlorine or residual chlorine). Measuring the free chlorine level is a common water quality test.
freshwater Untreated, nonmarine surface water (e.g., water from lakes, rivers, or ponds). interactive fountain A fountain or water spray device that is either intended for or accessible for recreational use
and typically does not have standing water aboveground; recirculated water typically is stored in an underground holding tank. These fountains are sometimes called spray pads, splash pads, wet decks, or spray grounds. In contrast, a noninteractive (ornamental or decorative) fountain intended for public display rather than recreational use is often located in front of buildings and monuments, and the water is not easily accessible for public use.
jurisdiction An inclusive term for the U.S. states, District of Columbia, territories, and Freely Associated States (FAS) (e.g., the Republic of the Marshall Islands, the Federated States of Micronesia, and the Republic of Palau) that report waterborne disease outbreaks to the Waterborne Disease and Outbreak Surveillance System (WBDOSS). Waterborne disease outbreaks investigated by local public health agencies are reported to the state, territorial, or FAS public health agency. Jurisdictions can also report select recreational water–associated health events to WBDOSS.
marine water Untreated recreational water at an ocean or estuarine setting. pool chemical–associated health events
Injuries or illnesses resulting from exposure to pool chemicals (e.g., halogens or disinfection by-products) used to maintain quality of treated recreational water. These events might not meet the criteria for a waterborne disease outbreak depending on whether they involve exposure to recreational water or two or more persons. These events must be associated with treated recreational water venues.
recreational water venue A body of water used for recreation (e.g., swimming, soaking, or athletics), including any structure that encloses this water. It can include a lake, pond, river, spring, ocean, or a man-made venue (e.g., swimming pool and spa); some recreational water venues do not include standing water (e.g., interactive fountains).
reservoir, impoundment An artificially maintained lake or other body of water used for the collection and storage of water. It can be available as a source of raw water for drinking purposes or recreational use.
setting Location where exposure to contaminated water occurred. spa Any structure, basin, chamber, or tank (located either indoors or outdoors) containing a body
of water that is intended to be used for recreational or therapeutic purposes and that usually contains a waterjet or aeration system. It is operated at high temperatures and usually is not drained, cleaned, or refilled after each use. It also is referred to as a hot tub or whirlpool.
spray park A recreational water venue consisting of multiple interactive fountains. total chlorine A common water quality test that measures the chlorine in water that is free for disinfection (see
free chlorine) plus that combined with organic or inorganic materials (see combined chlorine level). The water’s combined chlorine level is derived by subtracting the free chlorine test level from the total chlorine test level.
treated water Water that has undergone a systematic disinfection process (e.g., chlorination and filtration) to maintain good microbiologic quality for recreation. Typically, this refers to any recreational water in an enclosed, manufactured structure. This includes water in swimming or wading pools, fountains, and spas but might also include water in fill-and-drain pools filled with treated tap water or untreated water (e.g., mineral spring water) that receives no further treatment.
untreated water Water that has not undergone a disinfection or treatment process to maintain good microbiological quality for recreation (e.g., lakes, rivers, oceans, and reservoirs).
user Any person or bather entering recreational water. Might also be referred to as a patron at some membership clubs or recreational water venues.

Surveillance Summaries
MMWR / September 23, 2011 / Vol. 60 / No. 12 35
water quality indicator A microbial, chemical, or physical parameter that indicates the potential risk for infectious diseases associated with using the water for drinking, bathing, or recreational purposes. Standards might vary based on type and degree of water exposure associated with different water uses. Ideally, density or concentration correlates with health effects. Examples include turbidity, coliform counts, fecal coliforms, Escherichia coli, enterococci, and free chlorine level.

Surveillance Summaries
36 MMWR / September 23, 2011 / Vol. 60 / No. 12
Appendix BDescriptions of Select Waterborne Disease Outbreaks
Associated with Recreational Water Use
Month Year State Etiology No. of cases Outbreak description
Bacteria
February 2008 Wisconsin Pseudomonas aeruginosa 18 After spending time in a hotel/motel pool and spa, 17 persons reported having a rash and one person reported an ear infection. A swab of one person’s skin lesion yielded P. aeruginosa. A case-control study found a statistically significant association between using the spa on a given Saturday and the development of symptoms. An environmental health investigation noted that no water quality readings were recorded on the Saturday that case-patients used the spa.
March 2008 Florida Legionella 5 The results of a matched case-control study epidemiologically linked five travel-associated cases of legionellosis to spa exposure at a hotel/motel. The spa had two cartridge filters and an automatic chlorine feeder. The environmental health investigation noted that the pool and spa had free chlorine levels of <0.5 mg/L (or parts per million [ppm]) and the cartridge filters were insufficient for the size of the spa. The maintenance logs for the spa were not available. Environmental water samples from the spa, hotel boilers, and a room air conditioner all tested negative for Legionella.
VirusesMay 2007 Idaho Norovirus genogroup II 50 After exposure to a community pool and wading pool, six persons submitted
stool specimens that tested positive for norovirus genogroup II. The pools had a combined filtration system. An investigation identified multiple contributing factors, including high bather load, inaccessible bathroom facilities, and lack of oversight by management to handle fecal incidents.
July 2008 Connecticut Norovirus genogroup I 16 After exposure to a lake that was used by diaper-aged children, six persons submitted stool specimens that tested positive for norovirus genogroup I. A fecal incident and stagnant water were suspected as contributing factors in the outbreak. A case-control study found that the odds of developing gastrointestinal symptoms were significantly higher for persons who swam in the lake on a particular day, swam in the water for more than an hour, or swallowed lake water compared with persons who did not report these exposures. Swimming >12 feet from shore also was associated with an increased odds of illness (p=0.0004).
ParasitesJune 2007 New Mexico Schistosomes 12 A medical provider’s office reported multiple individuals seen for rashes
diagnosed as cercarial dermatitis (“swimmer’s itch”) after spending time at a freshwater lake. The outbreak investigation included: case interviews, environmental assessment, and testing. Cases occurred among individuals who entered the water from the shoreline and did not occur in individuals who entered the water directly from a boat. Cercariae were isolated from snails collected along the shoreline. Low water levels 2 years earlier supported increased vegetation and large snail populations along the shoreline. Warning signs posted at the lake in English and Spanish listed allergic reaction symptoms and prevention measures.
July 2007 OklahomaOklahoma
C. hominis C. parvum
9317
Molecular subtyping of Cryptosporidium isolates led public health officials to determine that two distinct outbreaks of cryptosporidiosis had occured in neighboring counties during the same month. Persons affected by the first outbreak reported swimming in a pool that was the only publicly accessible swimming pool in the community, and none of the persons with laboratory-confirmed cases reported swimming in another pool. Cryptosporidium oocysts isolated from stool specimens of 11 patients and four liters of pool filter backwash were subtyped as C. hominis. Persons affected by the second outbreak stayed in state park cabins during a week-long period in mid-July. A retrospective cohort study implicated the park’s pool. Molecular typing of stool specimens and pool backwash identified C. parvum and provided strong supporting evidence that the cases were not part of the first outbreak.

Surveillance Summaries
MMWR / September 23, 2011 / Vol. 60 / No. 12 37
Month Year State Etiology No. of cases Outbreak description
August 2007 Iowa Cryptosporidium 34 County public health staff responded quickly to prevent a focal cryptosporidiosis outbreak from becoming communitywide following notification of two laboratory-confirmed cases in children with recent swimming pool exposures. Public health staff immediately initiated case investigations and active cryptosporidiosis surveillance. Local health-care providers were sent a health alert containing information about how to diagnose and report cryptosporidiosis cases. Child care providers were sent guidance about disease prevention and control measures. The environmental health staff worked closely with local pools, starting on the day that the first two cases were reported. Multiple pools were hyperchlorinated immediately. A fact sheet also was shared with several neighboring counties for distribution to pool operators.
July 2008 New Mexico C. hominis 89 Confirmed cases of cryptosporidiosis were identified among competitive swimmers who swam at a community aquatic facility. At least one patient swam while symptomatic and participated in competitions with hundreds of swimmers. Working closely with state and local partners, the New Mexico Department of Health coordinated the health communications, epidemiologic investigation, and environmental health response to the outbreak. This included hyperchlorination of all pools in the aquatic facility as well as any other pools that infectious swimmers had used. A total of 34% of ill persons (including competitive swimmers, lifeguards, or swim team coaches) reported recreational water activity while symptomatic or in the 2 weeks following symptom resolution. Stool specimens from multiple persons and recreational water tested positive for C. hominis. Clinical isolates were of the same subtype.
July 2008 Arizona C. hominis 9 Four laboratory-confirmed cases of C. hominis infection were linked to the same interactive fountain. The interactive fountain was not found to have any violations upon initial inspection. Staff complied with health department recommendations. Water from the interactive fountain tested positive for Cryptosporidium both before and after disinfection guidelines were applied; follow-up testing is not recommended by CDC because nonviable oocysts present in the treated water might lead to a positive test result via molecular testing. Molecular subtyping determined that this outbreak was unique from two concurrent recreational water–associated outbreaks in Arizona. An ultraviolet disinfection system was added to supplement the bromine disinfection system.
Chemicals/ToxinsJanuary 2008 Illinois Chlorine 20 At least 20 persons were hospitalized and an unknown number of people were
injured after exposure to chlorine at an indoor waterpark. Case counts and symptom data were based on fire department records. The automatic controller that managed pool disinfectant and pH levels failed. Pool staff did not recognize the problem during routine testing. The free chlorine and pH levels of the wading pool measured 18 mg/L and 8.3, respectively, on the day that the event occurred.

Surveillance Summaries
38 MMWR / September 23, 2011 / Vol. 60 / No. 12
Surveillance for Waterborne Disease Outbreaks Associated with Drinking Water—United States, 2007–2008
Joan M. Brunkard, PhD1
Elizabeth Ailes, PhD2
Virginia A. Roberts, MSPH1
Vincent Hill, PhD1
Elizabeth D. Hilborn, DVM3
Gunther F. Craun, MPH4
Anu Rajasingham, MPH1,5
Amy Kahler, MS1
Laurel Garrison, MPH6
Lauri Hicks, DO6
Joe Carpenter, MS7
Timothy J. Wade, PhD5
Michael J. Beach, PhD1
Jonathan S. Yoder MSW, MPH11Division of Foodborne, Waterborne, and Environmental Diseases, National Center for Emerging and Zoonotic Infectious Diseases, CDC
2International Health Resources Consulting (IHRC), Inc., Atlanta, Georgia3U.S. Environmental Protection Agency, Research Triangle Park, North Carolina
4Gunther F. Craun & Associates, Staunton, Virginia5Oak Ridge Institute for Science and Education, Oak Ridge, Tennessee
6Division of Bacterial Diseases, National Center for Immunization and Respiratory Diseases, CDC7Division of Healthcare Quality Promotion, National Center for Emerging and Zoonotic Infectious Diseases, CDC
Abstract
Problem/Condition: Since 1971, CDC, the Environmental Protection Agency (EPA), and the Council of State and Territorial Epidemiologists have collaborated on the Waterborne Disease and Outbreak Surveillance System (WBDOSS) for collecting and reporting data related to occurrences and causes of waterborne disease outbreaks associated with drinking water. This surveillance system is the primary source of data concerning the scope and health effects of waterborne disease outbreaks in the United States.Reporting Period: Data presented summarize 48 outbreaks that occurred during January 2007–December 2008 and 70 previ-ously unreported outbreaks.Description of System: WBDOSS includes data on outbreaks associated with drinking water, recreational water, water not intended for drinking (WNID) (excluding recreational water), and water use of unknown intent (WUI). Public health agencies in the states, U.S. territories, localities, and Freely Associated States are primarily responsible for detecting and investigating outbreaks and reporting them voluntarily to CDC by a standard form. Only data on outbreaks associated with drinking water, WNID (excluding recreational water), and WUI are summarized in this report. Outbreaks associated with recreational water are reported separately.Results: A total of 24 states and Puerto Rico reported 48 outbreaks that occurred during 2007–2008. Of these 48 outbreaks, 36 were associated with drinking water, eight with WNID, and four with WUI. The 36 drinking water–associated outbreaks caused illness among at least 4,128 persons and were linked to three deaths. Etiologic agents were identified in 32 (88.9%) of the 36 drink-ing water–associated outbreaks; 21 (58.3%) outbreaks were associated with bacteria, five (13.9%) with viruses, three (8.3%) with parasites, one (2.8%) with a chemical, one (2.8%) with both bacteria and viruses, and one (2.8%) with both bacteria and parasites. Four outbreaks (11.1%) had unidentified etiologies. Of the 36 drinking water–associated outbreaks, 22 (61.1%) were outbreaks of acute gastrointestinal illness (AGI), 12 (33.3%) were outbreaks of acute respiratory illness (ARI), one (2.8%) was an outbreak associated with skin irritation, and one (2.8%) was an outbreak of hepatitis. All outbreaks of ARI were caused by Legionella spp.A total of 37 deficiencies were identified in the 36 outbreaks associated with drinking water. Of the 37 deficiencies, 22 (59.5%)
involved contamination at or in the source water, treatment facility, or distribution system; 13 (35.1%) occurred at points not under the jurisdiction of a water utility; and two (5.4%) had unknown/insufficient deficiency information. Among the 21 outbreaks associated with source water, treatment, or distribution system deficiencies, 13 (61.9%) were associated
Corresponding author: Joan M. Brunkard, PhD, Division of Foodborne, Waterborne, and Environmental Diseases, National Center for Emerging and Zoonotic Infectious Diseases, CDC, 1600 Clifton Road, N.E., MS C-9, Atlanta, GA 30333. Telephone: 404-639-1700; E-mail: [email protected].

Surveillance Summaries
MMWR / September 23, 2011 / Vol. 60 / No. 12 39
IntroductionData on waterborne disease outbreaks in the United States
have been collected since 1920. Researchers reported these statistics during 1920–36 (1), 1938–1945 (2), 1946–1960 (3), and 1961–1970 (4). Since 1971, CDC, the U.S. Environmental Protection Agency (EPA), and the Council of State and Territorial Epidemiologists (CSTE) have collaborated on the Waterborne Disease and Outbreak Surveillance System (WBDOSS), which tracks the occurrences and causes of outbreaks associated with drinking water and other water exposures. The history of
surveillance for waterborne disease outbreaks in the United States has been summarized previously (5). Previously reported data from drinking water–associated outbreaks have been reclassified system-atically and analyzed for trends (6). This report presents data on 48 outbreaks that occurred during 2007–2008 and were reported to CDC by public health departments in U.S. states, territories, and localities as well as a previously unreported outbreak that occurred in 2002 and 69 legionellosis outbreaks associated with drinking water, water not intended for drinking (WNID), and water of unknown intent (WUI) that occurred before 2001. Since 2001,
with untreated ground water, six (28.6%) with treatment deficiencies, one (4.8%) with a distribution system deficiency, and one (4.8%) with both a treatment and a distribution system deficiency. No outbreaks were associated with untreated surface water. Of the 21 outbreaks, 16 (76.2%) occurred in public water systems (drinking water systems under the jurisdiction of EPA regulations and water utility management), and five (23.8%) outbreaks occurred in individual systems (all of which were associated with untreated ground water). Among the 13 outbreaks with deficiencies not under the jurisdiction of a water system, 12 (92.3%) were associated with the growth of Legionella spp. in the drinking water system, and one (7.7%) was associated with a plumbing deficiency. In the two outbreaks with unknown deficiencies, one was associated with a public water supply, and the other was associated with commercially bottled water. The 70 previously unreported outbreaks included 69 Legionella outbreaks during 1973–2000 that were not reportable previously to WBDOSS and one previously unreported outbreak from 2002.Interpretation: More than half of the drinking water–associated outbreaks reported during the 2007–2008 surveillance period were associated with untreated or inadequately treated ground water, indicating that contamination of ground water remains a public health problem. The majority of these outbreaks occurred in public water systems that are subject to EPA’s new Ground Water Rule (GWR), which requires the majority of community water systems to complete initial sanitary surveys by 2012. The GWR focuses on identification of deficiencies, protection of wells and springs from contamination, and providing disinfection when necessary to protect against bacterial and viral agents. In addition, several drinking water–associated outbreaks that were related to contaminated ground water appeared to occur in systems that were potentially under the influence of surface water. Future efforts to collect data systematically on contributing factors associated with drinking water outbreaks and deficiencies, including identification of ground water under the direct influence of surface water and the criteria used for their classification, would be useful to better assess risks associated with ground water.During 2007–2008, Legionella was the most frequently reported etiology among drinking water–associated outbreaks, following the pattern observed since it was first included in WBDOSS in 2001. However, six (50%) of the 12 drinking water–associated Legionella outbreaks were reported from one state, highlighting the substantial variance in outbreak detection and reporting across states and territories. The addition of published and CDC-investigated legionellosis outbreaks to the WBDOSS database clarifies that Legionella is not a new public health issue. During 2009, Legionella was added to EPA’s Contaminant Candidate List for the first time.Public Health Actions: CDC and EPA use WBDOSS surveillance data to identify the types of etiologic agents, deficiencies, water systems, and sources associated with waterborne disease outbreaks and to evaluate the adequacy of current technologies and practices for providing safe drinking water. Surveillance data also are used to establish research priorities, which can lead to improved water quality regulation development. Approximately two thirds of the outbreaks associated with untreated ground water reported during the 2007–2008 surveillance period occurred in public water systems. When fully implemented, the GWR that was promulgated in 2006 is expected to result in decreases in ground water outbreaks, similar to the decreases observed in surface water outbreaks after enactment of the Surface Water Treatment Rule in 1974 and its subsequent amendments. One third of drinking water–associated outbreaks occurred in building premise plumbing systems outside the jurisdiction of water utility management and EPA regulations; Legionella spp. accounted for >90% of these outbreaks, indicating that greater atten-tion is needed to reduce the risk for legionellosis in building plumbing systems. Finally, a large communitywide drinking water outbreak occurred in 2008 in a public water system associated with a distribution system deficiency, underscoring the importance of maintaining and upgrading drinking water distribution system infrastructure to provide safe water and protect public health.

Surveillance Summaries
40 MMWR / September 23, 2011 / Vol. 60 / No. 12
Drinking water systems
Privately owned home or farm wells, springs, or surface water
sources
Public water systemsPublic or private ownership(subject to EPA regulations)
Community Noncommunity
Individual water systems(if regulated, state or local
regulations)
Bottled water* (regulated by FDA)
Transient (e.g., gas stations, parks, resorts, campgrounds, restaurants, and motels with their own water systems)
Nontransient (e.g., schools, factories, o�ce buildings, and hospitals with their own water systems)
Abbreviations: EPA = Environmental Protection Agency; FDA = Food and Drug Administration. * In certain instances, bottled water is used in lieu of a community supply or by noncommunity systems.
FIGURE 1. Types of drinking water systems — United States
legionellosis outbreaks associated with drinking water have been reported to WBDOSS. Legionellosis outbreaks that occurred before 2001 have been added retrospectively to WBDOSS to provide a more complete representation of legionellosis outbreaks associated with drinking water, WNID, and WUI. The data provided in this report represent only a portion of the burden of illness associated with exposure to drinking water. They do not include either endemic waterborne disease cases (sporadic cases not known to be associated with an outbreak) or the estimated number of unrecognized and unreported outbreaks.
BackgroundEnvironmental Protection Agency Drinking Water Regulations
The majority of outbreaks described in this report occurred in public drinking water systems (Figure 1). The Safe Drinking Water Act (SDWA) of 1974 and its subsequent 1986 and 1996 amendments authorized EPA to set national standards to protect public drinking water and its sources against naturally occurring or man-made contaminants (7–9). These standards include health-based maximum levels for microbiologic, chemical, and other contaminants in drinking water and water treatment performance criteria for the removal or inactivation
of contaminants (Table 1). If needed, EPA can issue guidance or a health advisory instead of a regulation. EPA regulations do not apply to private, individual water supplies. However, certain states and localities might set standards for individual water supplies (e.g., driller licensing and registration, well permitting, and water testing processes). Standards and requirements for private wells vary among states and localities. Commercially bottled water is regulated by the Food and Drug Administration (FDA) (Figure 1).
Additional rules that protect against exposure to waterborne pathogens include the Surface Water Treatment Rule (SWTR) and its amendments (10–15), the Total Coliform Rule (TCR) (16,17), and the 2006 Ground Water Rule (GWR) (18,19). The SWTR and amendments specify water-treatment techniques (e.g., filtration and disinfection), monitoring, and performance criteria for systems that use surface water sources to protect against Giardia and Cryptosporidium contamination. EPA has established criteria to assess whether ground water sources are under the direct influence of surface water, and, if so, these sys-tems are required to meet provisions of the SWTR and amend-ments. The TCR requires public water systems to monitor for indicators of fecal contamination and take corrective action when they are found. In 2007, EPA established an advisory committee to provide recommendations on revisions to the TCR and on

Surveillance Summaries
MMWR / September 23, 2011 / Vol. 60 / No. 12 41
TABLE 1. Selected U.S. Environmental Protection Agency listings and regulations regarding drinking water, by year enacted — United States, 1974–2009
Regulation Year
Safe Drinking Water Act (SDWA) 1974Interim Primary Drinking Water Standards 1975National Primary Drinking Water Standards 1985SDWA Amendments 1986Surface Water Treatment Rule (SWTR) 1989Total Coliform Rule (TCR) 1989Chemical Contaminant Rules Phase I 1989Lead and Copper Regulations 1990Chemical Contaminant Rules Phase II 1992Chemical Contaminant Rules Phase IIB 1993Chemical Contaminant Rules Phase V 1994SDWA Amendments 1996Information Collection Rule 1996Interim Enhanced SWTR 1998Stage 1 - Disinfectants and Disinfection By-Products (D-DBP)
Regulation1998
Drinking Water Contaminant Candidate List 1998Unregulated Contaminant Monitoring Regulations 1999Radionuclides Rule 2000Lead and Copper Rule — action levels 2000Filter Backwash Recycling Rule 2001Long Term 1 Enhanced SWTR 2002Unregulated Contaminant Monitoring Regulations 2002Drinking Water Contaminant Candidate List 2 2005Long Term 2 Enhanced SWTR 2006Stage 2 D-DBP Rule 2006Ground Water Rule 2006Drinking Water Contaminant Candidate List 3 2009
information needed to understand better the public health risks associated with the degradation of water quality in pipes, stor-age tanks, and other appurtenances used to distribute drinking water to consumers (20). The GWR specifies when corrective action, including disinfection, is required for wells and springs to protect against bacteria and viruses (Table 1). In addition to the rules described above, a program established in the 1986 SDWA amendments, the Wellhead Protection Program, requires states to develop plans to delineate and manage wellhead protection areas and to actively reduce the potential for contamination of all public ground water systems (18).
The SDWA amendments of 1996 require EPA to publish periodically a list of contaminants that must be evaluated for potential regulatory action (21,22) and to establish criteria for a program to monitor unregulated contaminants (23–26). Contaminant Candidate Lists (CCL1, 2 and 3) were published in 1998, 2005, and 2009 (21,22,27). Microbial contaminants are selected for inclusion on the CCL on the basis of three criteria: 1) that the contaminant might have an adverse effect on human health, 2) that the contaminant is known to occur or there is a substantial likelihood that it will occur in public water systems with a frequency and at levels of public health concern, and 3) that regulation of the contaminant presents a meaningful opportunity to reduce health risk (28). In 2009, Legionella pneumophila was added to CCL3 for the first time (22).
MethodsData Sources
Public health agencies in the states, U.S. territories, localities, and Freely Associated States* (FAS) have primary responsibility for detecting and investigating outbreaks, which they report voluntarily to CDC using a standard form (CDC 52.12, avail-able at http://www.cdc.gov/healthywater/statistics/wbdoss/nors/forms_archive.html). The form solicits data on character-istics of outbreaks (e.g., number of cases, time, and location), results from epidemiologic and environmental investigations, and results from clinical-specimen and water-sample testing. CDC annually requests reports of outbreaks from persons designated as waterborne disease surveillance coordinators and obtains additional information regarding epidemiologic investigations, water quality, and water treatment to supple-ment submitted outbreak reports as needed. Numeric and text data are abstracted from outbreak report forms and supporting documents and entered into a database for analysis. All of the outbreaks that occurred during 2007–2008 were reported through the paper-based reporting system and analyzed by using SAS 9.2 (SAS Institute, Inc. Cary, North Carolina). To ensure completeness of legionellosis outbreak data for 2007–2008, CDC compared data from WBDOSS with data from the Travel-Associated Legionellosis in the United States System. In addition, data on outbreaks of legionellosis that occurred before 2001 were added to the WBDOSS database.
DefinitionsWaterborne Disease Outbreak
Two criteria must be met for an event to be defined as an outbreak associated with drinking water, WNID (excluding recreational water), or WUI: 1) two or more persons must be linked epidemiologically by time, location of exposure to water, and illness characteristics; and 2) the epidemiologic evidence must implicate water as the probable source of ill-ness. Outbreak reports with limited or no environmental data might be included in WBDOSS, but outbreak reports that lack epidemiologic data linking the outbreak to water are excluded.
Reported outbreaks associated with contaminated drinking water, commercially bottled water, ice, beverages made with contaminated water, and water contaminated by malfunctions in equipment or devices in which water is used or distributed (e.g., beverages contaminated by plumbing failures in drink mix/soda machines) are classified as drinking water–associated
* Includes the Republic of the Marshall Islands, the Federated States of Micronesia, and the Republic of Palau; formerly part of the U.S.-administered Trust Territory of the Pacific Islands.

Surveillance Summaries
42 MMWR / September 23, 2011 / Vol. 60 / No. 12
outbreaks. Outbreaks involving the consumption of beverages containing contaminated ingredients (i.e., other than water) or ice contaminated through human handling are reported to CDC as foodborne disease outbreaks, not waterborne disease outbreaks. WBDOSS report data are categorized on the basis of the location of the water exposure, not the ill person’s state of residence. Outbreaks occurring on cruise ships are not reported to WBDOSS; CDC’s Vessel Sanitation Program tracks outbreaks of acute gastrointestinal illness (AGI) related to cruise ships (29).
Single CasesSingle cases of illness or injury associated with water exposure
are not classified or analyzed as outbreaks but might be reported directly to WBDOSS or through other national surveillance systems. Cases that might be reported directly to WBDOSS include laboratory-confirmed primary amebic meningoen-cephalitis (PAM) as a result of Naegleria fowleri infection and single cases of chemical or toxin poisoning.
Water SystemsWBDOSS includes data on outbreaks occurring in public
and individual water systems. EPA defines a public water system as a system for the provision of water for human consumption through a distribution system that has at least 15 service connections or that regularly serves at least 25 persons (30). An individual system is one that does not meet EPA’s definition of a public water system. It typically serves a single family or farm; individual systems are not subject to EPA regulations but might be regulated at the state or local level. Public water systems include community water systems (serving the same persons year round) and noncommunity water systems (which serve the public but generally do not serve the same persons year round). Noncommunity water systems include transient noncommunity systems (serving different persons for >6 months of the year, such as those in parks and restaurants) and nontransient, noncommunity systems (serving the same persons for >6 months out of the year, such as those in schools and factories) (Figure 1). Of the approximately 153,530 public water systems in the United States, 51,651 (33.6%) are community systems, and 101,879 (66.4%) are noncommunity systems, including 83,484 (81.9%) transient systems and 18,395 (18.1%) nontransient systems (Figure 1) (31). Community systems serve 294.3 million persons; of the 51,651 community water systems, 4,156 (8%) are classified by EPA as “large” (serving 10,001–100,000 persons) or “very large” (serving >100,000 persons) and provide water to 77% of the U.S. population. Nontransient, noncommunity systems provide water to 6.2 million persons, and transient noncommunity systems provide
water to 13.3 million persons (by definition, these populations also use another type of water system at their residences, except for the limited number of permanent residents of nontransient systems) (31). Although 78% of community water systems are supplied by ground water, more persons (70%) are supplied year-round by community water systems that use surface water (31). Approximately 15% of the U.S. population (15.8 million households) relies on individual water systems that are owned privately (32,33). Private wells that serve <25 persons are not regulated by EPA under SDWA (34).
Water SourcesDrinking water–associated outbreaks are categorized in
WBDOSS as having ground water, surface water, or mixed water sources. Ground water sources include springs, aquifers, and wells. Surface water refers to all water found on the surface (e.g., river, lake, or pond) as distinguished from subsurface or ground water. A drinking water system that uses both a ground water and a surface water source is defined by WBDOSS as having a mixed source. Ground water sources that have the potential for surface water contamination and are used to sup-ply drinking water systems may be categorized as ground water under the direct influence of surface water (GWUDI). EPA has specified criteria to identify potential GWUDI, and state and local environmental health agencies conduct site-specific evaluations of water quality, construction characteristics, and geology to determine treatment requirements.
DeficienciesTo understand the circumstances and water system
breakdowns that lead to outbreaks, each outbreak is classified as having one or more deficiencies (e.g., in water treatment and operation, water storage and delivery, or premise plumbing) (Table 2). Analyses of outbreak deficiencies provide important information about how the water became contaminated, water system characteristics, and factors leading to waterborne disease outbreaks.
Strength-of-Evidence Classification for Waterborne Disease Outbreaks
All outbreaks reported to WBDOSS for 2007–2008 have been classified according to the strength of 1) epidemiologic and clinical laboratory evidence and 2) environmental evidence implicating water as the vehicle of transmission (Table 3). The classification (i.e., Classes I–IV), which was first used in the 1989–1990 surveillance report (35), is based on the epidemiologic and environmental data reported to WBDOSS.
Outbreaks and subsequent investigations occur under different circumstances, and not all outbreaks can be investigated

Surveillance Summaries
MMWR / September 23, 2011 / Vol. 60 / No. 12 43
TABLE 2. CDC deficiency classification for drinking water, water not intended for drinking (excluding recreational water), and water of unknown intent
Contamination of water at/in the water source, treatment facility, or distribution system* 1: Untreated surface water intended for drinking2: Untreated ground water intended for drinking3: Treatment deficiency (e.g., temporary interruption of disinfection, chronically inadequate disinfection, or inadequate or no filtration) 4: Distribution system deficiency, including storage (e.g., cross-connection, backflow, contamination of water mains during construction or repair)
13: Current treatment processes not expected to remove a chemical contaminant (e.g., pesticide contamination of ground water treated with disinfection only)A: Surface waterB: Ground water
Contamination of water at points not under the jurisdiction of a water utility or at the point of use†
5: Legionella spp. in water systemA: Water intended for drinkingB: Water not intended for drinking (excluding recreational water)C: Water of unknown intent
6: Plumbing system deficiency after the water meter or property line (e.g., cross-connection, backflow, or corrosion products)7: Deficiency in building/home-specific water treatment after the water meter or property line8: Deficiency or contamination of equipment using or distributing water (e.g., drink-mix machines)9: Contamination or treatment deficiency during commercial bottling
10: Contamination during shipping, hauling, or storageA: Water intended for drinking – tap waterB: Water intended for drinking – commercially bottled water
11: Contamination at point of useA: TapB: HoseC: Commercially bottled waterD: Container, bottle, or pitcherE: Unknown
12: Drinking or contact with water not intended for drinking (excluding recreational water) Unknown/Insufficient Information99: Unknown/Insufficient information
A: Water intended for drinking – tap waterB: Water intended for drinking – commercially bottled waterC: Water not intended for drinking (excluding recreational water)D: Water of unknown intent
* For a community water system, the distribution system refers to the pipes and storage infrastructure under the jurisdiction of the water utility prior to the water meter or property line (if the system is not metered). For noncommunity and nonpublic individual water systems, the distribution system refers to the pipes and storage infrastructure before entry into a building or house.
† Contamination of drinking water and deficiencies occurring in plumbing and pipes that are not part of the distribution system as defined previously. For community systems, this means occurring after the water meter or outside the jurisdiction of a water utility; for noncommunity and nonpublic systems, this means occurring within the building or house (e.g., in a service line leading to a house or building, in the plumbing inside a house or building, during shipping or hauling, during storage other than in the distribution system, or at point of use).
rigorously. Classifications that do not meet the highest level (I) do not necessarily imply that the investigation was inadequate or incomplete because multiple factors (e.g., timeliness of outbreak detection) contribute to the ability to collect optimal epidemiologic, clinical laboratory, and environmental data.
Additional terms used in this report have been defined elsewhere (Appendix A).
Changes in the 2007–2008 Surveillance Summary
Strength-of-Evidence ClassificationMolecular epidemiology is used increasingly to understand
pathogen transmission patterns, detect outbreaks, and identify important risk factors and outbreak sources. The criteria used to determine the strength-of-evidence classifications have been
revised to reflect the increasing use of molecular characterization of pathogens identified in clinical specimens and environmental samples collected during outbreak investigations. Molecular data that link multiple persons who had an identical water exposure now are considered adequate epidemiologic data to support a Class I or Class II assignment; molecular data that link at least one person to the implicated water exposure now are considered adequate water quality data to support a Class I or Class III assign-ment. Previously, epidemiologic study data were required to receive a strength-of-evidence classification of I or II. The “epidemiologic data” and “water quality data” categories have been renamed “epidemiologic and clinical laboratory data” and “environmental data,” respectively (Table 3).
Number of CasesCase counts provided in this report were based on the
estimated number of total cases if sufficient supporting evidence

Surveillance Summaries
44 MMWR / September 23, 2011 / Vol. 60 / No. 12
TABLE 3. CDC classification of investigations of waterborne disease outbreaks on the basis of strength of evidence implicating water as a vehicle of transmission — United States, 2007–2008
Class Epidemiologic and clinical laboratory data Environmental data
I Provided and adequate Provided and adequate
Epidemiologic data provided about exposed and unexposed persons, with relative risk or odds ratio ≥2 or p-value ≤0.05; or
Laboratory data or historic information (e.g., reports of chlorinator malfunction, a water main break, no detectable free-chlorine residual, or the presence of coliforms in the water); or
Molecular characterization of pathogens linked multiple persons who had a single identical exposure
Molecular characteristics of pathogens isolated from water and at least one clinical specimen were identical
II Provided and adequate Not provided or inadequate
Epidemiologic data provided about exposed and unexposed persons, with relative risk or odds ratio ≥2 or p-value <0.05; or
E.g., laboratory testing of water not conducted and no historic information available
Molecular characterization of pathogens linked multiple persons who had a single identical exposure
III Provided but limited Provided and adequate
Epidemiologic data provided that did not meet the criteria for Class I or II or claim made that ill persons had no exposures in common, besides water, but no data provided
Laboratory data or historic information (e.g., reports of chlorinator malfunction, a water main break, no detectable free-chlorine residual, or the presence of coliforms in the water); or
Molecular characteristics of pathogens isolated from water and at least one clinical specimen were identical
IV Provided but limited Not provided or inadequate
Epidemiologic data provided that did not meet the criteria for Class I or II or claim made that ill persons had no exposures in common, besides water, but no data provided
E.g., laboratory testing of water not conducted and no historic information available
was provided. For example, this might include applying the attack rate found during a cohort study to the entire population exposed to contaminated water to estimate the total number of ill persons associated with an outbreak. If no “estimated ill” number was provided, the actual number of reported cases (e.g., laboratory-confirmed and probable cases as reported by the state) was used. CDC requests that states report only cases in which primary exposure to water occurs, so secondary cases (e.g., person-to-person transmission among household members) are not included in case counts of waterborne disease in WBDOSS.
Analysis of DeficienciesPrevious WBDOSS surveillance reports limited the descriptive
analyses to focus on drinking water–associated outbreaks with source water, treatment, or distribution system deficiencies (i.e., deficiencies 1–4 and 13) (Table 2). However, tables and figures in this report present data for all of the drinking water–associ-ated outbreaks and deficiencies, including those associated with Legionella spp. and building premise plumbing deficiencies (i.e., deficiencies 1–13 and 99).
Legionnaires’ Disease Outbreaks Before 2001Data concerning previously unreported legionellosis outbreaks
that occurred before 2001 have been added to the WBDOSS database. These data were abstracted from Epidemic Intelligence Service outbreak investigation reports and peer-reviewed publications. Previously, only Legionnaires’ disease (LD) outbreaks that occurred after 2001 were included in WBDOSS.
ResultsDuring 2007–2008, a total of 24 states and Puerto Rico
reported 48 outbreaks, including 29 for 2007 and 19 for 2008. Of these, 36 outbreaks were associated with drinking water, eight with WNID, and four with WUI. Outbreaks are tabulated by year and state (Tables 4–6). One outbreak that occurred in 2002 and 69 Legionella outbreaks from 1973–2000 also were included as previously unreported outbreaks (Table 7).
Waterborne Disease Outbreaks Associated with Drinking Water
Since the surveillance system first started in 1971, drinking water–associated outbreaks have been reported every year (Figure 2). The 36 outbreaks described in this report (including 20 in 2007 and 16 in 2008) occurred in 23 states and Puerto Rico (Figure 3). Outbreaks occurred predominantly in the spring through fall, with only three outbreaks reported during November–February. Multiple etiologic agents were implicated in the 36 outbreaks (Table 8). Descriptions of selected outbreaks have been summarized (Appendix B).
The 36 outbreaks reported during 2007–2008 caused illness among at least 4,128 persons and resulted in three deaths. The median number of persons affected in an outbreak was 14 (range: 2–1,663). Four predominant illnesses were reported: 22 (61.1%) outbreak reports of AGI, 12 (33.3%) outbreak reports of acute respiratory illness (ARI), one (2.8%) outbreak report

Surveillance Summaries
MMWR / September 23, 2011 / Vol. 60 / No. 12 45
TABLE 4. Waterborne disease outbreaks associated with drinking water (n = 20) — Waterborne Disease and Outbreak Surveillance System, United States, 2007
State Month Class* EtiologyPredominant
illness†No. of cases§
(n = 2,456)Type of system¶ Deficiency**
Water source Setting
California Jul III Giardia intestinalis AGI 46 Ncom 3 Spring Camp/CabinColorado Jun III Norovirus genogroup II AGI 77 Ncom 3 Well Camp/CabinFlorida Sep I Unidentified AGI 1,663 Com 3 Reservoir CommunityIdaho Jun I Campylobacter AGI 15 Ncom 2 Spring†† Camp/CabinMassachusetts Apr III Sodium hydroxide§§ Skin 145 Com 3 Well CommunityMaryland Jun I Norovirus genogroup II AGI 94 Ncom 3 Well Membership clubMissouri May I Unidentified AGI 51 Com 3 Well CommunityNew Hampshire Aug I G. intestinalis AGI 35 Com 2 Well Neighborhood/SubdivisionNevada Oct I Legionella pneumophila serogroup 1 ARI 7 Com 5A Reservoir CondominiumNew York Oct III L. pneumophila serogroup 1 ARI 3 Com 5A Reservoir Nursing homeNew York Oct IV L. pneumophila serogroups 1, 5 ARI 3 Com 5A Reservoir Hospital/Health-care facilityNew York Jun III L. pneumophila serogroup 1 ARI 2 Com 5A Reservoir Nursing homeOhio Mar IV Unidentified AGI 3 Bottled 99B Reservoir¶¶ Private residenceOhio Nov III L. pneumophila serogroup 1 ARI 3 Com 5A Lake Hospital/Health-care facilityTennessee May I Salmonella Newport AGI 2 Ind 2 Well Private ResidenceVermont Oct III L. pneumophila serogroup 1 ARI 3 Ncom 5A Well Hotel/MotelWashington Jan I Norovirus AGI 32 Ncom 2 Well RestaurantWisconsin May I Norovirus genogroup I,
Campylobacter, SalmonellaAGI 229 Ncom 2 Well Restaurant
West Virginia Oct III Campylobacter AGI 4 Ind 2 Spring Private residenceWyoming Jan I Unidentified*** AGI 39 Ncom 2 Well Lodge
Abbreviations: AGI = acute gastrointestinal illness; ARI = acute respiratory illness; Skin = illnesses, conditions, or symptoms related to skin; Com = community; Ncom = noncommunity; Ind = individual; Bottled = commercially bottled water. * On the basis of epidemiologic, clinical laboratory, and environmental data (e.g., water quality data) provided to CDC. † The category of illness reported by ≥50% of ill respondents. § No deaths were reported in cases associated with outbreaks reported during 2007. ¶ Community and noncommunity water systems are public water systems that have >15 service connections or serve an average of ≥25 residents for ≥60 days/year. A community water
system serves year-round residents of a community, subdivision, or mobile home park. A noncommunity water system serves an institution, industry, camp, park, hotel, or business and can be nontransient or transient. Nontransient systems serve ≥25 of the same persons for >6 months of the year but not year-round (e.g., factories or schools) whereas transient systems provide water to places in which persons do not remain for long periods of time (e.g., restaurants, highway rest stations, and parks). Individual water systems are small systems not owned or operated by a water utility that have <15 connections or serve <25 persons.
** Deficiency classification for drinking water, water not intended for drinking (excluding recreational water), and water of unknown intent (see Table 2). †† The spring associated with this outbreak was vulnerable to surface water contamination and is regulated as a surface water source by the state. §§ A chemical overfeed of sodium hydroxide at the water-treatment facility raised the pH of the water in the distribution system. ¶¶ Water from a community water system that used surface water was distilled before distribution. *** Etiology unidentified; norovirus suspected based upon incubation period, symptoms, and duration of illness.
of hepatitis and one (2.8%) outbreak report of skin irritation associated with a chemical exposure. Although the 22 AGI outbreaks were caused by a variety of pathogens, all 12 ARI outbreaks were caused by Legionella (i.e., LD or Pontiac fever [PF]) (Figure 4).
Of the 36 drinking water–associated outbreaks, 17 (47.2%) were assigned a strength-of-evidence rank of Class I, two (5.6%) were ranked as Class II, 14 (38.9%) were ranked as Class III, and three (8.3%) were ranked as Class IV. Drinking water–associated outbreaks were tabulated by etiology, type of water system, and water source (Table 8); deficiency and type of water system (Table 9); and deficiency and water source (Table 10).
EtiologyOf the 36 drinking water–associated outbreaks, 21 (58.3%)
were caused by bacteria, five (13.9%) were caused by viruses, three (8.3%) were caused by parasites, and one (2.8%) was caused by a chemical. Two (5.6%) outbreaks had multiple etiologies: one (2.8%) was caused by bacteria and viruses, and one (2.8%) was caused by bacteria and parasites. Four (11.1%) had unidentified etiologies: one was suspected to be caused by norovirus (Table 8; Figure 5).
Bacteria. A total of 21 outbreaks were associated with bacterial agents and resulted in 1,520 cases of illness: 12 outbreaks, 75 cases of illness, and two deaths were caused by Legionella; four outbreaks and 77 cases of illness were caused by Campylobacter; three outbreaks, 1,307 cases of illness, and one death were caused by Salmonella; one outbreak and six cases of illness were caused by E. coli O157:H7; and one outbreak with 55 cases of illness was caused by Providencia spp. (Table 8). An estimated 1,300 cases of illness were related to Salmonella contamination during a single outbreak in Colorado (Table 5; Appendix B).
Viruses. Five outbreaks were associated with viral agents and resulted in 274 cases of illness: four outbreaks with 265 cases of illness were caused by norovirus, and one outbreak with nine cases of illness was caused by hepatitis A.
Parasites. Three outbreaks were associated with parasitic agents and resulted in 163 cases of illness and no reported deaths. Two of these outbreaks with 81 cases of illness were caused by Giardia intestinalis, and one outbreak with 82 cases of illness was caused by Cyclospora cayetanensis.
Chemicals. One outbreak involved a chemical exposure and resulted in an estimated 145 cases of illness following exposure

Surveillance Summaries
46 MMWR / September 23, 2011 / Vol. 60 / No. 12
TABLE 5. Waterborne disease outbreaks associated with drinking water (n = 16), by state/jurisdiction — Waterborne Disease and Outbreak Surveillance System, United States, 2008
State/ Jurisdiction Month Class* Etiology
Predominant illness†
No. of cases [deaths](n = 1,672 [3]§)
Type of system¶ Deficiency**
Water source Setting
Colorado Mar I Salmonella Typhimurium AGI 1,300 [1] Com 4 Well CommunityConnecticut Aug I Providencia†† AGI 55 —§§ Com 2 Well Apartment complexGeorgia Sep III Legionella pneumophila serogroup 1 ARI 6 — Com 5A Reservoir Hospital/Health-care facilityIllinois Jun III L. pneumophila serogroup 1 ARI 4 — Com 5A Well Hospital/Health-care facilityIllinois Oct II Escherichia coli O157:H7 AGI 6 — Ind 2 Well FarmIllinois Sep I Shigella sonnei, Cryptosporidium, Giardia AGI 41 — Com 6 Lake BoatNew Jersey Aug III L. pneumophila serogroup 1 ARI 9 — Com 5A Reservoir Hospital/Health-care facilityNew York Jul III L. pneumophila serogroup 1 ARI 13 [1] Com 5A Well, river Seniors housing complexNew York Aug IV L. pneumophila serogroup 1 ARI 19 — Com 5A Lake Assisted living facilityNew York Sep III L. pneumophila serogroup 1 ARI 3 [1] Com 5A Lake Nursing homeOklahoma Jun I Norovirus genogroup 1.4 AGI 62 — Com 3,4 Well Neighborhood/SubdivisionPuerto Rico Apr II Cyclospora cayetanensis AGI 82 — Com 99A River Community/MunicipalityTennessee Mar I Hepatitis A virus Hep 9 — Ind 2 Well Community/MunicipalityTennessee Aug I Salmonella serotype I 4,5,12:i:- AGI 5 — Ncom 2 Spring Private residenceUtah Jun III Campylobacter AGI 50 — Ncom 2 Spring Camp/CabinWest Virginia May I C. jejuni AGI 8 — Ind 2 Well Private residence
Abbreviations: AGI = acute gastrointestinal illness, ARI = acute respiratory illness; Hep = hepatitis; Com = community; Ncom = noncommunity; Ind = individual; Bottle = commercially bottled water. * On the basis of epidemiologic, clinical laboratory, and environmental data (e.g., water quality data) provided to CDC. † The category of illness reported by >50% of ill respondents. § Deaths are included in the overall case count. ¶ Community and noncommunity water systems are public water systems that have ≥15 service connections or serve an average of ≥25 residents for ≥60 days/year. A community water
system serves year-round residents of a community, subdivision, or mobile home park. A noncommunity water system serves an institution, industry, camp, park, hotel, or business and can be nontransient or transient. Nontransient systems serve ≥25 of the same persons for >6 months of the year but not year-round (e.g., factories or schools) whereas transient systems provide water to places in which persons do not remain for long periods of time (e.g., restaurants, highway rest stations, and parks). Individual water systems are small systems not owned or operated by a water utility that have <15 connections or serve <25 persons.
** Deficiency classification for drinking water, water not intended for drinking (excluding recreational water), and water of unknown intent (see Table 2). †† Six of nine stool specimens tested positive for Providencia. Extensive testing concluded that stool specimens were negative for Salmonella, Shigella, Campylobacter, Escherichia coli, ova and parasites,
and norovirus. §§ No deaths were reported.
TABLE 6. Waterborne disease outbreaks (n = 12) associated with water not intended for drinking (WNID) (excluding recreational water) and water of unknown intent (WUI) , by state — Waterborne Disease and Outbreak Surveillance System, United States, 2007–2008
StateWater type Month Year Class* Etiology
Predominant illness†
No. of cases [deaths]
(n = 79 [4]§) Deficiency¶ Water source Setting
Colorado WUI Aug 2007 III Giardia intestinalis AGI 13 —** 99D Unknown ParkFlorida WUI Mar 2007 IV Legionella pneumophila serogroup 1 ARI 2 — 5C Unknown Membership clubIowa WNID May 2007 IV Unidentified†† AGI 10 — 12 Stream State forestMaryland WNID Oct 2007 I L. pneumophila serogroup 1§§ ARI 2 — 5B Ornamental fountain Hospital/Health-care facilityMaryland WNID Jul 2008 IV L. pneumophila serogroup 1 ARI 18 — 5B Unknown¶¶ Community/MunicipalityNew Jersey WUI Jul 2008 IV L. pneumophila serogroup 1 ARI 2 — 5C Unknown Senior housing facilityNew York WNID Jun 2007 III L. pneumophila serogroup 1 ARI 2 — 5B Cooling tower Community/MunicipalityNew York WNID Jun 2007 III L. pneumophila serogroup 1 ARI 2 — 5B Recycled water Vehicle-washing station***New York WUI Aug 2007 IV L. pneumophila serogroup 1
L. pneumophila serogroup 7ARI 2 [2] 5C Unknown††† Nursing home
New York WNID Sep 2007 III L. pneumophila serogroup 1 ARI 4 [1] 5B Cooling tower Assisted living facilityNew York WNID Jun 2008 I L. pneumophila serogroup 1 ARI 12§§§ [1] 5B Cooling tower Community/MunicipalityWyoming WNID Apr 2007 IV Unidentified AGI 10 — 12 Hydrant, hose Youth facility
Abbreviations: AGI = acute gastrointestinal illness; ARI = acute respiratory illness. * On the basis of epidemiologic, clinical laboratory, and environmental data (e.g., water quality data) provided to CDC. † The category of illness reported by >50% of ill respondents. § Deaths are included in the overall case count. ¶ Deficiency classification for drinking water, water not intended for drinking (excluding recreational water), and water of unknown intent (see Table 2). ** No deaths were reported. †† Etiology unidentified; norovirus suspected based upon incubation period, symptoms, and duration of illness. §§ Outbreak occurred at a federal facility and was investigated independently by the facility. ¶¶ Environmental testing found positive results in samples collected at a cooling tower and a decorative fountain. *** The outbreak was associated with a mass-transit vehicle washing station. ††† The investigation identified the drinking water system and a cooling tower as possible water exposures in this outbreak. §§§ Eleven persons received a diagnosis of Legionnaires’ disease, and one person received a diagnosis of Pontiac fever.

Surveillance Summaries
MMWR / September 23, 2011 / Vol. 60 / No. 12 47
TABLE 7. Previously unreported outbreaks (n = 70) associated with drinking water, water not intended for drinking, and water of unknown intent, by state — Waterborne Disease and Outbreak Surveillance System, United States, 1973–2002*
State Month/Year Class† EtiologyPredominant
illness§
No. of cases [deaths]
(n = 1,522 [237¶]) Deficiency** Setting
Virginia Jun 1973 IV Legionella pneumophila ARI 12 —†† 5B Factory/Industrial facilityVirginia Jul 1973 IV L. pneumophila ARI 10 — 5B Factory/Industrial facilityPennsylvania Sep 1974 II L. pneumophila ARI 11 — 5C Hotel/MotelKansas Aug 1975 IV Legionella ARI 3 [3] 5C Hospital/Health-care facility Connecticut Nov 1976 I L. pneumophila serogroup 1 ARI 28 [12] 5B Community/MunicipalityPennsylvania Jul 1976 II Legionella ARI 182 [29] 5C Hotel/MotelCalifornia May 1977 II Legionella ARI 49 [15] 5C Hospital/Health-care facilityIndiana May 1977 IV Legionella ARI 39 [4] 5C Hotel/Motel/LodgeOhio Jul 1977 II Legionella ARI 14 [1] 5C Community/MunicipalityTennessee Aug 1977 IV Legionella ARI 33 [3] 5C Community/MunicipalityVermont May 1977 IV Legionella ARI 69 [17] 5C Community/MunicipalityVirginia Jun 1977 IV L. micdadei ARI 16 [2] 5A Hospital/Health-care facilityGeorgia Jul 1978 III L. pneumophila ARI 8 — 5B Membership clubNew York Aug 1978 IV L. pneumophila serogroup 1 ARI 57 [3] 5B Factory/Industrial facilityTennessee Aug 1978 I L. pneumophila serogroup 1 ARI 39 [7] 5B Hospital/Health-care facilityTexas Aug 1978 II L. pneumophila serogroup 1 ARI 18 [2] 5B Hotel/MotelIllinois Dec 1979 III L. pneumophila serogroup 6 ARI 3 — 5A Hospital/Health-care facility New York Jul 1979 III L. pneumophila ARI 6 [1] 5B Factory/Industrial facilityPennsylvania Feb 1979 IV L. pneumophila ARI 27 [12] 5C Hospital/Health-care facilityWisconsin Jun 1979 I L. pneumophila serogroup 1 ARI 13 [4] 5B Hotel/MotelCalifornia Mar 1980 III L. pneumophila serogroup 1 ARI 14 — 5B OfficeCalifornia Dec 1980 III L. pneumophila serogroup 1, L. dumoffi ARI 20 — 5C Hospital/Health-care facility Connecticut Dec 1980 IV L. pneumophila ARI 36 [5] 5C Hospital/Health-care facility Vermont May 1980 II L. pneumophila serogroup 1 ARI 85 [16] 5B Community/MunicipalityWashington Nov 1980 IV L. dumoffi ARI 9 [4] 5C Hospital/Health-care facility Iowa Oct 1981 IV L. pneumophila serogroup 1 ARI 12 [1] 5C Community/MunicipalityNew York Feb 1982 I L. pneumophila serogroup 1 ARI 11 — 5A Hospital/Health-care facility New York Jun 1982 IV L. pneumophila ARI 3 — 5A Hospital/Health-care facilityWashington Oct 1982 I L. pneumophila serogroup 3 ARI 15 [2] 5A Hospital/Health-care facilityRhode Island Jun 1983 I L. pneumophila serogroup 1 ARI 15 [10] 5B Hospital/Health-care facility California Jan 1984 IV L. pneumophila, L. dumoffi, L. micdadei ARI 14 [1] 5A Hospital/Health-care facility New York Apr 1984 III L. pneumophila serogroup 1 ARI 86 — 5B OfficeOhio Apr 1984 IV L. pneumophila serogroup 1 ARI 7 — 5C Hospital/Health-care facility Utah May 1984 I L. pneumophila serogroup 1 ARI 4 [1] 5B Hospital/Health-care facilityMichigan May 1985 IV L. pneumophila serogroup 1 ARI 14 [3] 5C Temporary eventSouth Dakota Apr 1985 I L. pneumophila serogroup 1 ARI 26 [10] 5A Hospital/Health-care facility Wisconsin Aug 1986 I L. pneumophila serogroup 1 ARI 32 [2] 5B Community/MunicipalityCalifornia Mar 1986 IV L. pneumophila serogroups 1, 4, 6 ARI 7 [5] 5A Hospital/Health-care facilityMaryland May 1986 IV L. pneumophila serogroup 1 ARI 27 [2] 5C StoreArizona Jan 1987 I L. pneumophila serogroups 1, 5, 6, 10 ARI 25 [12] 5A Hospital/Health-care facility Florida Jan 1987 III L. pneumophila serogroup 1 ARI 2 [1] 5A Hospital/Health-care facility Washington May 1987 II L. micdadei, L. feelei, L. pneumophila serogroup 3 ARI 7 [5] 5A Hospital/Health-care facilityMichigan Jul 1987 IV L. pneumophila serogroup 1 ARI 7 — 5B Prison/JailPennsylvania Jul 1987 III L. pneumophila serogroup 1 ARI 2 [1] 5B Factory/Industrial facilityVermont Oct 1987 IV L. pneumophila serogroup 1 ARI 27 [3] 5C Hotel/MotelCalifornia Apr 1988 III L. anisa ARI†† 34 — 5B Hotel/MotelCalifornia Jun 1988 IV L. pneumophila serogroup 1 ARI 3 — 5C Retirement home Ohio Jul 1989 III L. pneumophila serogroup 1 ARI 38 [11] 5A Hospital/Health-care facility Louisiana Oct 1989 I L. pneumophila serogroup 1 ARI 33 [2] 5A StoreNew York Jun 1989 II L. pneumophila serogroups 1, 6 ARI 7 — 5C Hospital/Health-care facilityTexas Apr 1989 II L. pneumophila serogroup 1 ARI 14 [6] 5A Hospital/Health-care facilityCalifornia Mar 1991 II L. pneumophila serogroups 4, 5, 6 ARI 5 — 5C Hospital/Health-care facility California Aug 1991 IV L. pneumophila serogroup 1 ARI 10 [1] 5C OfficeUtah Aug 1991 I L. pneumophila serogroup 1 ARI 11 — 5A Indoor place of workFlorida Jan 1992 I L. pneumophila serogroup 1 ARI 5 — 5B Hotel/MotelOhio Jun 1992 II L. pneumophila serogroups 1, 3, 7, L. longbeachae ARI 52 [2] 5C Community/MunicipalityPennsylvania Feb 1992 II L. pneumophila serogroup 1 ARI 2 — 5C Factory/Industrial FacilityMassachusetts Jul 1993 I L. pneumophila serogroup 1 ARI 11 [3] 5B Community/MunicipalityRhode Island Aug 1993 I L. pneumophila serogroup 1 ARI 17 [2] 5B Community/MunicipalityConnecticut Apr 1994 I L. pneumophila serogroup 1 ARI 20 — 5A Hospital/Health-care facility Delaware Jul 1994 I L. pneumophila serogroup 1 ARI 29 [2] 5B Hospital/Health-care facility New York Jan 1995 I L. micdadei ARI 19 [4] 5A Hospital/Health-care facility Pennsylvania Jul 1995 I L. pneumophila serogroup 1 ARI 22 [3] 5B Hospital/Health-care facility Missouri Sep 1996 III L. pneumophila serogroup 1 ARI 3 — 5C Restaurant/CafeteriaRhode Island Aug 1996 III L. pneumophila serogroup 1 ARI 18 [1] 5B Community/MunicipalityTexas Apr 1996 III L. pneumophila ARI 4 — 5C Hospital/Health-care facility
See table footnotes on page 48

Surveillance Summaries
48 MMWR / September 23, 2011 / Vol. 60 / No. 12
MultipleLegionella spp.†
Unidenti�edChemicalViralBacterial§
Parasitic
0
10
20
30
40
50
60
1971 1974 1977 1980 1983 1986 1989 1992 1995 1998 2001 2004 2007
Year
No.
of o
utbr
eaks
FIGURE 2. Number of waterborne disease outbreaks associated with drinking water (n = 818),* by year and etiology — Waterborne Disease and Outbreak Surveillance System, United States, 1971–2008
* Some outbreaks from prior reporting periods were added, reclassified, or excluded during an extensive review (Craun GF, Brunkard JM, Yoder JS, et al. Causes of outbreaks associated with drinking water in the United States from 1971 to 2006. Clin Microbiol Rev 2010;23:507–28); therefore, data are not comparable to figures in previous reports.
† Legionnaires’ disease (LD) was reported to the Waterborne Disease and Outbreak Surveillance System (WBDOSS) beginning in 2001. A review of publications and CDC-led investigations during 1971–2000 resulted in the addition of 17 historic LD drinking water outbreaks to WBDOSS.
§ Includes all bacteria except Legionella.
TABLE 7. (Continued) Previously unreported outbreaks (n = 70) associated with drinking water, water not intended for drinking, and water of unknown intent, by state — Waterborne Disease and Outbreak Surveillance System, United States, 1973–2002*
State Month Year Class† EtiologyPredominant
illness§
No. of cases[deaths]
(n = 1,522 [237¶]) Deficiency** Setting
California Nov 1997 II L. pneumophila serogroup 1 ARI 8 [1] 5C Community/MunicipalityMissouri Jul 1997 III L. pneumophila serogroup 1, L. bozemanii ARI 4 — 5B Hospital/Health-care facility Pennsylvania May 1998 IV L. pneumophila serogroup 1 ARI 7 — 5B Community/MunicipalityGeorgia Sep 2002 III Mycobacterium mageritense Skin 2 — 12 Nail salon
Abbreviations: ARI = acute respiratory illness; Skin = illnesses, conditions, or symptoms related to skin. * Previously unreported legionellosis outbreaks included in this table were identified through a review of the published literature on Legionella as well as reports from past CDC-led inves-
tigations occurring during 1971–2000. Data are presented on the basis of a review and interpretation of available outbreak investigation reports and published articles. † On the basis of epidemiologic, clinical laboratory, and environmental data (e.g., water quality data) provided to CDC. § The category of illness reported by ≥50% of ill respondents. ¶ Deaths are included in the overall case count. ** Deficiency classification for drinking water, water not intended for drinking (excluding recreational water), and water of unknown intent (see Table 2). †† No deaths were reported. §§ Some or all cases might have been Pontiac fever.
to water containing high levels of sodium hydroxide. No deaths were reported.
Multiple etiologies. Two outbreaks were associated with multiple etiologies and resulted in 270 cases of illness; one out-break with viral and bacterial agents caused by norovirus geno-group I, Campylobacter, and Salmonella resulted in 229 cases of
illness; one outbreak with parasitic and bacterial agents caused by Shigella sonnei, Giardia intestinalis, and Cryptosporidium resulted in 41 cases of illness. No deaths were reported.
Unidentified etiologies. In four outbreaks an etiologic agent was not identified; however, one outbreak had a suspected

Surveillance Summaries
MMWR / September 23, 2011 / Vol. 60 / No. 12 49
FIGURE 3. Number of waterborne disease outbreaks associated with drinking water (n = 36), by state/jurisdiction — Waterborne Disease and Outbreak Surveillance System, United States, 2007–2008*
* These numbers are largely dependent on reporting and surveillance activities in individual states/jurisdictions, and do not necessarily indicate the true in-cidence of waterborne disease outbreaks.
≥4 3 2 1 0
etiology of norovirus. These four outbreaks resulted in 1,756 cases of AGI; no deaths were reported (Table 8).
Deficiencies A total of 37 deficiencies were cited in 36 drinking water–
associated outbreaks. Of these, 22 (59.5%) involved the source water, treatment facility, or distribution system (eight in community, nine in noncommunity, and five in individual systems), including 13 associated with untreated ground water (deficiency 2), seven associated with treatment deficiencies (deficiency 3), and two associated with distribution system deficiencies (deficiency 4) (Table 9). No outbreaks associated with untreated surface water (deficiency 1) or current treatment processes that are not expected to remove a chemical contaminant (deficiency 13) were reported during this surveillance period (Table 11). Of the 37 deficiencies, 13 (35.1%) occurred in public water systems at points not under the jurisdiction of a water utility, including 12 deficiencies associated with Legionella (deficiency 5A) and one associated with a plumbing system deficiency (deficiency 6); two outbreaks had an unknown deficiency (deficiency 99A, B) (Table 9; Figure 6). No outbreaks reported during 2007–2008 were associated with deficiencies in treatment after the property line or meter; contamination of equipment using or distributing water; contamination during commercial bottling, shipping, hauling, or storage; or contamination at point of use (deficiencies 7–11) (Table 11).
Contamination of Water at/in the Water
Source, Treatment Facility, or Distribution System
A total of 21 outbreaks were assigned a deficiency classifica-tion of 2–4 (untreated ground water, treatment, and distribu-tion system deficiencies, respectively), including one outbreak that was assigned two deficiency classifications (treatment and distribution system deficiencies). No outbreaks with a deficiency classification of 1 (untreated surface water) or 13 (current treatment processes not expected to remove a chemical contaminant) were reported (Table 11).
EtiologyNine (42.9%) of these 21 outbreaks were associated with
bacteria, five (23.8%) with viruses, three (14.3%) with uniden-tified etiologies, two (9.5%) with parasites, one with a chemical (4.8%), and one (4.8%) with multiple etiologies (both bacterial and viral agents). Cases in one outbreak with an unidentified etiology had an incubation period, symptoms, and duration of illness that were consistent with norovirus infection.
Water Quality DataAll but one of the 21 outbreaks with a deficiency classification
of 2–4 (Tables 2–4) had current water quality data (e.g., laboratory data regarding the presence of coliform bacteria, pathogens, or chemical contaminants) or historic data (e.g., levels of disinfectants) available.
Water SystemsNine (42.9%) of the 21 outbreaks with deficiencies 2–4
involved noncommunity water systems, five (23.8%) involved individual water systems, and seven (33.3%) involved community water systems (Table 9). Among the nine outbreaks involving noncommunity water systems, six (66.7%) were associated with untreated ground water, and three (33.3%) were associated with a treatment deficiency. All five outbreaks involving individual water systems were associated with untreated ground water. Among the seven outbreaks involving a community water system, eight deficiencies were assigned. Two (28.6%) outbreaks were associated with untreated ground water, three (42.9%) were associated with a treatment deficiency, one (14.3%) was associated with a distribution system deficiency, and one (14.3%) was associated with both a treatment deficiency and a distribution system deficiency (Table 9).
Water SourcesA total of 20 (95.2%) of the 21 outbreaks with deficiencies 2–4
were associated with ground water sources (i.e., wells or springs); one (4.8%) outbreak was associated with surface water derived from a reservoir (Table 10). Among the 20 outbreaks and 21

Surveillance Summaries
50 MMWR / September 23, 2011 / Vol. 60 / No. 12
TABLE 8. Number of waterborne disease outbreaks associated with drinking water (n=36), by etiology, type of water system, and water source* — Waterborne Disease and Outbreak Surveillance System, United States, 2007–2008
Type of water system
Total
Etiology
Public water systems† Individual water
systemsCommercially bottled
water systems
Ground Surface Other§ Ground Surface
Outbreaks Cases Outbreaks Cases Outbreaks Cases Outbreaks Cases Outbreaks Cases Outbreaks Cases
Bacterium 7 1,432 9 55 1 13 4 20 0 0 21 1,520Campylobacter spp. 2 65 0 0 0 0 2 12 0 0 4 77Escherichia coli O157 0 0 0 0 0 0 1 6 0 0 1 6Legionella pneumophila 2 7 9 55 1 13 0 0 0 0 12 75Providencia 1 55 0 0 0 0 0 0 0 0 1 55Salmonella spp. 2 1,305 0 0 0 0 1 2 0 0 3 1,307
Virus 4 265 0 0 0 0 1 9 0 0 5 274Hepatitis A virus 0 0 0 0 0 0 1 9 0 0 1 9Norovirus 4 265 0 0 0 0 0 0 0 0 4 265
Parasite 2 81 1 82 0 0 0 0 0 0 3 163Cyclospora cayetanensis 0 0 1 82 0 0 0 0 0 0 1 82Giardia intestinalis 2 81 0 0 0 0 0 0 0 0 2 81
Chemical 1 145 0 0 0 0 0 0 0 0 1 145Sodium hydroxide 1 145 0 0 0 0 0 0 0 0 1 145
Multiple¶ 1 229 1 41 0 0 0 0 0 0 2 270Unidentified** 2 90 1 1,663 0 0 0 0 1 3 4 1,756
Total 17 2,242 12 1,841 1 13 5 29 1 3 36 4,128
* Only categories of water sources in which outbreaks occurred are presented in this table. † Includes community and noncommunity water systems that have ≥15 service connections or serve an average of ≥25 residents for ≥60 days/year. A community water system serves
year-round residents of a community, subdivision, or mobile home park. A noncommunity water system serves an institution, industry, camp, park, hotel, or business and can be non-transient or transient. Nontransient systems serve ≥25 of the same persons for >6 months of the year but not year-round (e.g., factories and schools), whereas transient systems provide water to places in which persons do not remain for long periods of time (e.g., restaurants, highway rest stations, and parks). Individual water systems are defined as small systems not owned or operated by a water utility that have <15 connections or serve <25 persons. Individual water systems are not under the jurisdiction of the EPA; however, there may be additional regulations or operational guidelines that fall under state jurisdiction, depending on the state and size of the water system.
§ Includes outbreaks with mixed or unknown water sources. One outbreak of legionellosis was associated with a mixed public water system. ¶ Defined as outbreaks in which more than one type of etiologic agent is identified in clinical specimens from affected persons, and each etiologic agent is found in ≥5% of positive clinical
specimens (e.g., an outbreak with Giardia intestinalis [parasites] and Salmonella spp. [bacteria] with each agent identified in ≥5% of stool specimens). Two outbreaks occurred: one with 229 cases was associated with Norovirus GI, Campylobacter spp., and Salmonella spp, and one with 41 cases was associated with Shigella sonnei, Giardia, and Cryptosporidium.
** For one outbreak with an unidentified etiology, norovirus was suspected on the basis of incubation period, symptoms, and duration of illness.
deficiencies related to ground water sources, 13 (65.0%) outbreaks were associated with consumption of untreated ground water. Well water sources were used by systems in nine of these outbreaks, and springs were water sources in four outbreaks. In one of the outbreaks associated with the use of untreated spring water, the spring was classified by the State as GWUDI and thus subject to EPA regulations for surface water (SWTR and amendments) (10–15). In several other outbreaks, evidence of contamination suggested that the well or spring was under the direct influence of surface water; however, information was not provided on the surveillance form about GWUDI testing and classification.
Six (30.0%) ground water outbreaks were associated with treatment deficiencies, including inadequate disinfection or filtration, interruption of disinfection, and deficiencies in other treatment processes. Two outbreaks in systems using well water were associated with distribution system deficiencies. One large communitywide outbreak was associated with contamination of a distribution system storage tank, and a second outbreak had both distribution system and treatment deficiencies, including cross-connections and inadequate disinfection (Table 10; Appendix B).
Contamination of Water at Points Not Under the Jurisdiction of a Water Utility or
at the Point of UseA total of 13 outbreaks were given a deficiency classification
of 5A (Legionella spp. in drinking water systems) or 6 (plumbing system deficiency). Of these 13 outbreaks, 12 (92.3%) were associated with Legionella spp., and one (7.7%) outbreak with multiple etiologies was associated with a plumbing system deficiency (Table 11). No outbreaks reported for 2007–2008 were associated with a deficiency classification of 7–11 (deficiencies in treatment after the property line or meter; contamination of equipment using or distributing water [e.g., drink-mix machines]; and contamination during commercial bottling; shipping, hauling, or storage; and at point of use) (Table 11).
Water Quality DataWater quality data were available for all 13 outbreaks with
a deficiency of 5A or 6. Legionella spp. were isolated from the implicated water source in all of the 12 legionellosis outbreaks.
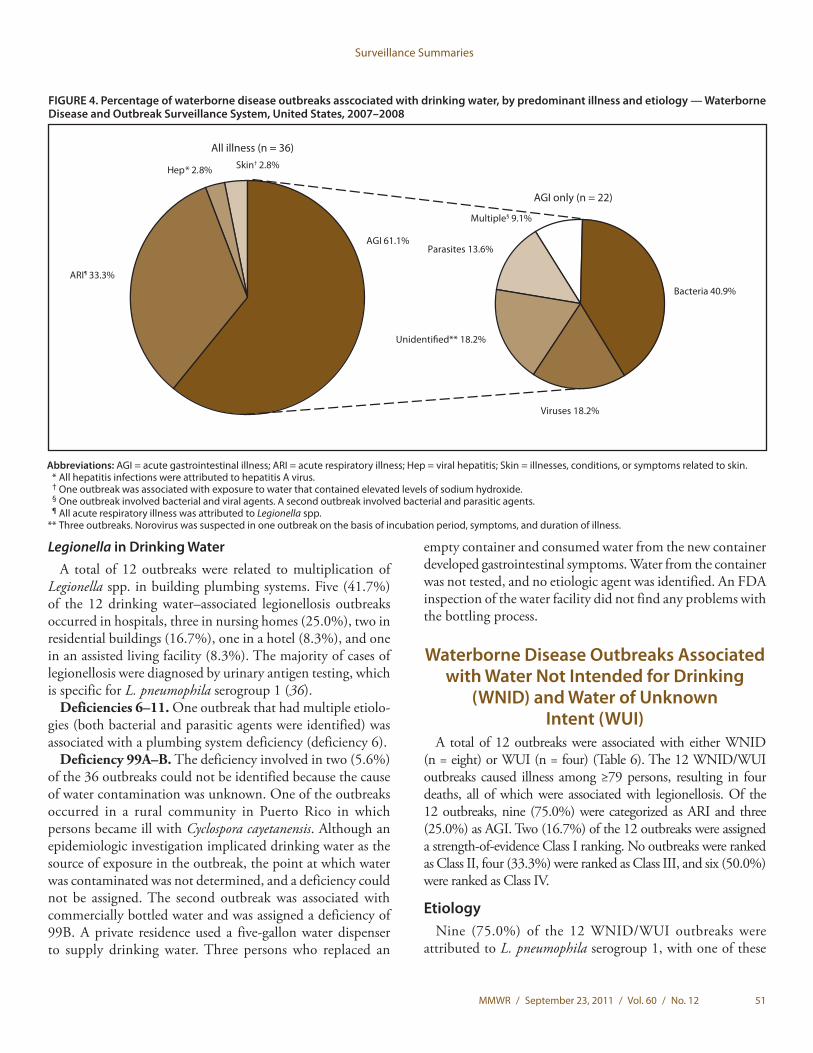
Surveillance Summaries
MMWR / September 23, 2011 / Vol. 60 / No. 12 51
FIGURE 4. Percentage of waterborne disease outbreaks asscociated with drinking water, by predominant illness and etiology — Waterborne Disease and Outbreak Surveillance System, United States, 2007–2008
ARI¶ 33.3%
Multiple§ 9.1%
All illness (n = 36)
AGI only (n = 22)
Bacteria 40.9%
Parasites 13.6%
Viruses 18.2%
Unidenti�ed** 18.2%
Skin† 2.8%Hep* 2.8%
AGI 61.1%
Abbreviations: AGI = acute gastrointestinal illness; ARI = acute respiratory illness; Hep = viral hepatitis; Skin = illnesses, conditions, or symptoms related to skin. * All hepatitis infections were attributed to hepatitis A virus. † One outbreak was associated with exposure to water that contained elevated levels of sodium hydroxide. § One outbreak involved bacterial and viral agents. A second outbreak involved bacterial and parasitic agents. ¶ All acute respiratory illness was attributed to Legionella spp. ** Three outbreaks. Norovirus was suspected in one outbreak on the basis of incubation period, symptoms, and duration of illness.
Legionella in Drinking WaterA total of 12 outbreaks were related to multiplication of
Legionella spp. in building plumbing systems. Five (41.7%) of the 12 drinking water–associated legionellosis outbreaks occurred in hospitals, three in nursing homes (25.0%), two in residential buildings (16.7%), one in a hotel (8.3%), and one in an assisted living facility (8.3%). The majority of cases of legionellosis were diagnosed by urinary antigen testing, which is specific for L. pneumophila serogroup 1 (36).
Deficiencies 6–11. One outbreak that had multiple etiolo-gies (both bacterial and parasitic agents were identified) was associated with a plumbing system deficiency (deficiency 6).
Deficiency 99A–B. The deficiency involved in two (5.6%) of the 36 outbreaks could not be identified because the cause of water contamination was unknown. One of the outbreaks occurred in a rural community in Puerto Rico in which persons became ill with Cyclospora cayetanensis. Although an epidemiologic investigation implicated drinking water as the source of exposure in the outbreak, the point at which water was contaminated was not determined, and a deficiency could not be assigned. The second outbreak was associated with commercially bottled water and was assigned a deficiency of 99B. A private residence used a five-gallon water dispenser to supply drinking water. Three persons who replaced an
empty container and consumed water from the new container developed gastrointestinal symptoms. Water from the container was not tested, and no etiologic agent was identified. An FDA inspection of the water facility did not find any problems with the bottling process.
Waterborne Disease Outbreaks Associated with Water Not Intended for Drinking
(WNID) and Water of Unknown Intent (WUI)
A total of 12 outbreaks were associated with either WNID (n = eight) or WUI (n = four) (Table 6). The 12 WNID/WUI outbreaks caused illness among ≥79 persons, resulting in four deaths, all of which were associated with legionellosis. Of the 12 outbreaks, nine (75.0%) were categorized as ARI and three (25.0%) as AGI. Two (16.7%) of the 12 outbreaks were assigned a strength-of-evidence Class I ranking. No outbreaks were ranked as Class II, four (33.3%) were ranked as Class III, and six (50.0%) were ranked as Class IV.
EtiologyNine (75.0%) of the 12 WNID/WUI outbreaks were
attributed to L. pneumophila serogroup 1, with one of these

Surveillance Summaries
52 MMWR / September 23, 2011 / Vol. 60 / No. 12
TABLE 10. Number and percentage of waterborne disease outbreaks associated with drinking water (n = 36), by type of deficiency (n = 37) and water source — Waterborne Disease and Outbreak Surveillance System, United States, 2007–2008*
Type of deficiency
Water source†
TotalGround water Surface water Mixed source
No. (%) No. (%) No. (%) No. (%)
2: Untreated ground water intended for drinking 13 (56.5) 0 (0) 0 (0) 13 (35.1)3: Treatment deficiency 6 (26.1) 1 (7.7) 0 (0) 7 (18.9)4: Distribution system deficiency, includes storage 2 (8.7) 0 (0) 0 (0) 2 (5.4)
5A: Legionella in drinking water system 2 (8.7) 9 (69.2) 1 (100.0) 12 (32.4)6: Plumbing system deficiency 0 (0) 1 (7.7) 0 (0) 1 (2.7)
99A: Unknown/insufficient information 0 (0) 1 (7.7) 0 (0) 1 (2.7)99B: Unknown/insufficient information (bottled water) 0 (0) 1 (7.7) 0 (0) 1 (2.7)Total (%) 23 (100.0) 13 (100.0) 1 (100.0) 37 (100.0)
* Includes all deficiencies for drinking water–associated outbreaks reported for 2007–2008. Some outbreaks have multiple deficiencies that are tabulated separately. This table reports 37 deficiencies from 36 outbreaks.
† No water outbreaks associated with unknown or unidentified drinking water sources were reported for 2007–2008.
TABLE 9. Number and percentage of waterborne disease outbreaks associated with drinking water (n = 36), by type of deficiency (n = 37)* and type of water system — Waterborne Disease and Outbreak Surveillance System, United States, 2007–2008
Type of deficiency
Type of water system†§
TotalCommunity Noncommunity Individual Bottled
No. (%) No. (%) No. (%) No. (%) No. (%)
2: Untreated ground water intended for drinking 2 (9.5) 6 (60) 5 (100.0) 0 (0) 13 (35.1)3: Treatment deficiency 4 (19.0) 3 (30) 0 (0) 0 (0) 7 (18.9)4: Distribution system deficiency, includes storage 2 (9.5) 0 (0) 0 (0) 0 (0) 2 (5.4)
5A: Legionella in drinking water system 11 (52.4) 1 (10) 0 (0) 0 (0) 12 (32.4)6: Plumbing system deficiency 1 (4.8) 0 (0) 0 (0) 0 (0) 1 (2.7)
99A: Unknown/insufficient information 1 (4.8) 0 (0) 0 (0) 0 (0) 1 (2.7)99B: Unknown/insufficient information (bottled water) 0 (0) 0 (0) 0 (0) 1 (100.0) 1 (2.7)Total (%) 21 (100.0) 10 (100.0) 5 (100.0) 1 (100.0) 37 (100.0)
* Includes all deficiencies for drinking water–associated outbreaks reported for 2007–2008. Some outbreaks have multiple deficiencies that are tabulated separately. This table reports 37 deficiencies from 36 outbreaks.
† Community and noncommunity water systems are public water systems that have ≥15 service connections or serve an average of ≥25 residents for ≥60 days/year. A community water system serves year-round residents of a community, subdivision, or mobile home park. A noncommunity water system serves an institution, industry, camp, park, hotel, or business and can be nontransient or transient. Nontransient systems serve ≥25 of the same persons for >6 months of the year but not year-round (e.g., factories and schools) whereas transient systems provide water to places in which persons do not remain for long periods of time (e.g., restaurants, highway rest stations, and parks). Individual water systems are small systems not owned or operated by a water utility that have <15 connections or serve <25 persons.
§ No outbreaks associated with mixed drinking water systems were reported for 2007–2008.
outbreaks also being attributed to L. pneumophila serogroup 7; the nine legionellosis outbreaks affected 46 persons and resulted in four deaths. One (8.3%) of the WNID/WUI outbreaks was attributed to G. intestinalis. Of the two outbreaks that did not have an identified etiology, one outbreak was suspected to be caused by norovirus (Table 6).
Deficiencies Each of the 12 WNID/WUI outbreaks was assigned one
deficiency: six (50.0%) WNID outbreaks involved Legionella spp. in the water system (deficiency 5B), three (25.0%) WUI outbreaks involved Legionella spp. (deficiency 5C), two (16.7%) WNID outbreaks of AGI involved unidentified etiologies (deficiency 12), and one (8.3%) WUI outbreak involved contamination of an unknown water source (deficiency 99D) (Tables 2 and 6).
Previously Unreported OutbreaksA total of 70 previously unreported outbreaks that occurred
from 1973–2002 were added to WBDOSS during 2010. One previously unreported WNID (deficiency 12) outbreak of Mycobacterium mageritense occurred in 2002 (Table 7). Two patients were diagnosed with M. mageritense infections on their feet following separate visits to a nail salon. Environmental samples from the nail salon isolated M. mageritense in foot bath, drain, and hand sink samples. M. goodii and M. smegma also were isolated in foot bath samples (37).
A total of 69 legionellosis outbreaks that occurred during 1973–2000 were added to the surveillance system in 2010 (Table 7). These data were abstracted from Epidemic Intelligence Service outbreak investigation reports and peer-reviewed publications (38–75). Seventeen outbreaks were associated with drinking water, 26 with WNID, and 26 with

Surveillance Summaries
MMWR / September 23, 2011 / Vol. 60 / No. 12 53
FIGURE 5. Percentage of waterborne disease outbreaks associated with drinking water, by etiology, water system, and water source — Waterborne Disease and Outbreak Surveillance System, United States, 2007–2008*
* Not limited to deficiencies 1–4, and therefore figure is not comparable to those in previous summaries. † Percentages do not add up to 100% due to rounding. § One outbreak involved bacterial and viral agents. A second involved bacterial and parasitic agents. ¶ Other than Legionella spp.
Community 55.6%
Etiology (n = 36)
Chemical 2.8% Bottled 2.8%
Individual† 13.9%
Water system (n = 36)†
Water source (n = 36)†
Parasites 8.3%
Multiple§ 5.6%
Viruses 13.9%
Unidenti�ed 11.1%
Bacteria¶25.0%
Legionella spp. 33.3%
Mixed water 2.8%
Ground water 61.1% Surface water 36.1%
Noncommunity 27.8%
WUI (Figure 7). Among these 69 outbreaks, 1,520 cases and 237 deaths were reported from 27 states.
Surveillance Reports Not Classified as Waterborne Disease Outbreaks
Two outbreak reports about occupational exposures did not meet the criteria for inclusion in the surveillance system because either water did not appear to be the source of exposure or evidence was insufficient. In one event, five persons were injured at a water treatment plant; chlorine gas was released following an accidental mixing of sodium hypochlorite and hydrofluorosilicic acid. The second event involved two housecleaners who poured ammonia into a toilet suspected to have contained water with high concen-trations of chlorine. One person later called a local poison control
center (PCC) to report eye pain and respiratory irritation; however, insufficient epidemiologic and water quality data were available to warrant inclusion of this report as a waterborne disease outbreak. Six additional single case reports that were associated with known or suspected chemical exposures occurring primarily at the point of water use also were excluded because single cases do not meet the case definition for an outbreak. These single cases were identified by one state that conducted an independent review of supplemental data sources for occupational diseases and chemical poisonings, including PCC inquiries and reports submitted to the Hazardous Substances Emergency Events Surveillance (HSEES) system. Although single cases are not classified as outbreaks, the case reports highlight the potential to detect waterborne illness and injury at a state level through collaboration with other existing surveillance systems.

Surveillance Summaries
54 MMWR / September 23, 2011 / Vol. 60 / No. 12
TABLE 11. Waterborne disease outbreaks associated with drinking water (n = 36), by type of deficiency (n = 37)* — Waterborne Disease and Outbreak Surveillance System, United States, 2007–2008
Contamination of water at/in the water source, treatment facility, or distribution system† 221: Untreated surface water intended for drinking 0
2: Untreated ground water intended for drinking 13
3: Treatment deficiency (e.g., temporary interruption of disinfection, chronically inadequate disinfection, or inadequate or no filtration) 7
4: Distribution system deficiency, including storage (e.g., cross-connection, backflow, contamination of water mains during construction or repair)
2
13: Current treatment processes not expected to remove a chemical contaminant (e.g., pesticide contamination of ground water treated with disinfection only)A: Surface water 0
B: Ground water 0
Contamination of water at points not under the jurisdiction of a water utility or at the point of use§ 135: Legionella spp. in water system
A: Water intended for drinking 12
6: Plumbing system deficiency after the water meter or property line (e.g., cross-connection, backflow, or corrosion products) 1
7: Deficiency in building/home-specific water treatment after the water meter or property line 0
8: Deficiency or contamination of equipment using or distributing water (e.g., drink-mix machines) 0
9: Contamination or treatment deficiency during commercial bottling 010: Contamination during shipping, hauling, or storage
A: Water intended for drinking – tap water 0
B: Water intended for drinking – commercially bottled water 011: Contamination at point of use
A: Tap 0
B: Hose 0
C: Commercially bottled water 0
D: Container, bottle, or pitcher 0
E: Unknown 0
Unknown/Insufficient Information 299: Unknown/Insufficient information
A: Water intended for drinking – tap water 1
B: Water intended for drinking – commercially bottled water 1
Total 37
* More than one deficiency might have been identified during the investigation of a single waterborne disease outbreak.† For a community water system, the distribution system refers to the pipes and storage infrastructure under the jurisdiction of the water utility prior to the water
meter or property line (if the system is not metered). For noncommunity and nonpublic water systems, the distribution system refers to the pipes and storage in-frastructure prior to entry into a building or house.
§ Contamination of drinking water and deficiencies occurring in plumbing and pipes that are not part of the distribution system as previously defined. For community systems, this means after the water meter or outside the jurisdiction of a water utility, and for noncommunity and nonpublic systems, this means within the building or house (e.g., in a service line leading to a house or building, in the plumbing inside a house or building, during shipping or hauling, during storage other than in the distribution system, or at point of use).
DiscussionThe outbreaks reported during this surveillance period
highlight several important public health challenges associated with drinking water in the United States. The large proportion of outbreaks associated with untreated or inadequately treated ground water in particular indicate that additional efforts are needed to monitor and protect ground water sources from contamination and to ensure that adequate, continuous treatment is provided when it is needed. Legionella continues to be the most frequently reported etiology among drinking water–associated outbreaks and was also the predominant etiology among WNID and WUI outbreaks. However, more than half of the legionellosis outbreaks reported during
2007–2008 were from one state, demonstrating the substantial variance in outbreak detection, investigation and reporting across states. All deaths except one reported during this surveillance period were associated with Legionella, underscoring the need for improved methods of elimination and control of Legionella, particularly in settings with vulnerable populations. In addition, a large communitywide outbreak associated with contamination of a storage tank underscores the importance of protecting and maintaining drinking water distribution system infrastructure. This report also includes the addition of data concerning 69 legionellosis outbreaks, providing a more complete representation of legionellosis outbreaks in the United States before 2001.

Surveillance Summaries
MMWR / September 23, 2011 / Vol. 60 / No. 12 55
FIGURE 6. Percentage of waterborne disease outbreaks associated with drinking water, by deficiency* and water system† — Waterborne Disease and Outbreak Surveillance System, United States, 2007–2008
* There were 36 waterborne disease outbreaks but 37 deficiencies. See Table 2 for a list of all deficiencies. † For deficiencies 2, 3, and 5A only. See Table 9 for a summary of all 37 outbreak deficiencies by water system. § Percentages do not add up to 100.0% due to rounding. ¶ Deficiencies 99A and 99B.
All de�ciencies (n = 37)§
Untreated ground water 35.1%
Plumbing system 2.7%
Treatment de�ciency 18.9%
Distribution system 5.4%
Unknown 5.4%¶
Noncommunity46.2%
Individual 38.5%
Community 15.4%
Untreatedground water
(n = 13)
Noncommunity 42.9%
Community 57.1%
Treatmentde�ciency
(n = 7)
Community 91.7%
Noncommunity 8.3%
Legionella spp. in water system 32.4%
Legionella spp.(n = 12)
Outbreaks Associated with Drinking WaterIllness and Etiology
During 2007–2008, AGI was the dominant illness type (associated with 61% of drinking water–associated outbreaks) in contrast with the prior surveillance period (2005–2006) in which half of drinking water–associated outbreaks were associated with ARI (78). Of the 36 outbreaks, 24 (67%)
were caused by bacteria, five (14%) by viruses, three (8%) by parasites, one (3%) by a chemical, and two (6%) by multiple etiologies. Four (11%) outbreaks had unidentified etiologies.
BacteriaSince its addition to WBDOSS in 2001, Legionella has
been the single most commonly reported pathogen identified in drinking water–associated outbreaks. During 2007–2008,

Surveillance Summaries
56 MMWR / September 23, 2011 / Vol. 60 / No. 12
FIGURE 7. Number of waterborne disease outbreaks associated with drinking water, water not intended for drinking (WNID) (excluding rec-reational water), and water use of unknown intent (WUI), by year and etiology — Waterborne Disease and Outbreak Surveillance System, United States, 1971–2008
* Since 2001, legionellosis outbreaks associated with drinking water, WNID, and WUI have been reported to WBDOSS by public health jurisdictions, and Legionella is presented as its own bacterial etiologic category. Outbreaks that occurred before 2001 were identified through a literature review of journal publications and CDC-led investigation reports.
† Includes all bacteria except Legionella.
No.
of o
utbr
eaks
60
50
40
30
20
10
0
60
50
40
30
20
10
0
No.
of o
utbr
eaks
1971 1974 1977 1980 1983 1986 1989 1992 1995 1998 2001 2004 2007
1971 1974 1977 1980 1983 1986 1989 1992 1995 1998 2001 2004 2007
MultipleLegionella spp.Unidenti�edChemicalViralBacterial†
Parasitic
MultipleLegionella spp.Unidenti�edChemicalViralBacterial†
Parasitic
Before the addition of pre-2001 legionellosis outbreaks (n = 867)*
After the addition of pre-2001 legionellosis outbreaks (n = 936)*
Year
Year
a total of 12 (33.3%) of the 36 reported drinking water–associated outbreaks involved Legionella spp.; half of these outbreaks were reported by one state (New York). Unlike other waterborne bacterial outbreaks that also might be foodborne, zoonotic, or spread person-to-person, legionellosis outbreaks are almost exclusively associated with exposure to colonized water; therefore, Legionella spp. might be more likely than other waterborne pathogens to be associated successfully with
a water source during outbreak investigations. All legionellosis outbreaks reported herein occurred as a result of colonization of premise plumbing and pipes (i.e., infrastructure that neither is under the jurisdiction of a water utility nor is regulated by EPA). EPA has no contaminant level specific to Legionella spp. but believes that if parasites and viruses are removed or inactivated according to the treatment techniques in the SWTR and amendments, Legionella will be controlled at

Surveillance Summaries
MMWR / September 23, 2011 / Vol. 60 / No. 12 57
the water source (10). However, this does not ensure control within the water distribution system. Because Legionella is the predominant drinking water–related pathogen in WBDOSS, increased attention is needed to understand its ecology, the characteristics contributing to its pathogenicity, the need for improved diagnostics (e.g., molecular tests) and national laboratory testing capacity, and the interventions that are most effective to prevent ongoing disease transmission (6,76–78). EPA’s recent inclusion of Legionella in CCL3 might lead to additional research that improves risk-reduction interventions.
During the 2007–2008 surveillance period, nine drinking water–associated outbreaks involved only bacteria (excluding Legionella spp.) compared with two during 2005–2006, five during 2003–2004, and three during 2001–2002. The nine bacterial outbreaks involved chlorine-sensitive pathogens (e.g., Campylobacter, Salmonella, Providencia, and E. coli), including five outbreaks associated with ground water sources in public water systems, highlighting the importance of protecting ground water sources and providing adequate treatment and filtration where needed. The ongoing occurrence of bacterial outbreaks, despite available and efficacious treatment practices, underscores the need for source water protection and adequate disinfection when needed for ground water systems (79) in community, noncommunity, and individual water systems. A large outbreak of Salmonella Typhimurium occurred in a community water system using untreated ground water. The outbreak was associated with contamination in a storage reservoir and emphasizes the importance of protecting water quality in the distribution system, particularly in systems that use untreated ground water sources or have other system vulnerabilities.
The outbreak of Providencia is the first documented drinking water outbreak of this bacterium known to be reported in the United States. An epidemiologic investigation indicated that 55 persons developed gastroenteritis associated with drinking water from a community water system served by a well. Six of nine stool samples from ill persons tested positive for Providencia and negative for other bacteria (Campylobacter, Shigella, and E. coli), norovirus, and parasites. Previously thought to be nonpathogenic (80), Providencia was identified as the cause of a large foodborne outbreak in Japan in 1996 (81) and is thought to be a potential source of travelers’ diarrhea (82). Whether Providencia is a true human pathogen or an indicator of exposure to fecally contaminated water or food remains unclear (83).
VirusesFive outbreaks involving only viruses were reported during
2007–2008, four involving norovirus and one involving hepatitis A virus. All five outbreaks involved contaminated ground water that was either untreated or treated improperly (inadequate or interrupted chlorination as the only treatment
provided). These types of events are anticipated to decrease as the GWR is fully implemented. However, one of these viral outbreaks occurred in an individual water system, and the GWR does not apply to private systems.
ParasitesParasites were identified in three outbreaks reported during
2007–2008. An outbreak linked epidemiologically to a drinking water system in Puerto Rico was caused by C. cayetanensis (84), a rarely reported source of drinking water outbreaks in developed countries. This is the first known reported outbreak of cyclosporiasis associated with drinking water in the United States or associated territories since 1990. A previous outbreak of cyclosporiasis that occurred in Chicago in 1990 was suspected to be associated with water exposure (85). In the 2008 outbreak, residents reported recent interruptions in the community water supply and changes in water quality. A pumping station was determined to be damaged, and a water tanker had been used to haul treated water from a neighboring system to fill a water tank during the same time period. In addition to the C. cayetanensis outbreak, two outbreaks of giardiasis occurred in public water systems using ground water; one outbreak was associated with the improper installation of a filter (86) and the other with a well that was possibly GWUDI (87).
ChemicalsOnly one outbreak during 2007–2008 involved a chemical
exposure. The outbreak occurred within a public water system after a sodium hydroxide overfeed occurred at the water-treatment facility, raising the pH level of the drinking water supply and injuring an estimated 145 persons. Although a mechanism was in place to monitor pH levels at the treatment plant, the system was not designed to provide automatic notification of offsite staff regarding the problem. The response effort required collaboration among local and state agencies to flush the contaminated water from the distribution system, provide guidance to the community, and make safe drinking water available to local residents. This event highlights the need for appropriate remote monitoring systems in water treatment facilities when staff members are not onsite and the value for public water systems of developing comprehensive incident response plans with involvement from state and local agencies.
Multiple Etiologies and Unidentified EtiologiesTwo outbreaks involving multiple etiologies occurred during
2007–2008; one outbreak was caused by norovirus genogroup I, Campylobacter spp. and Salmonella spp., and the other was caused by S. sonnei, G. intestinalis, and Cryptosporidium. The occurrence of multiple etiologic agent outbreaks emphasizes the importance of considering more than one etiology

Surveillance Summaries
58 MMWR / September 23, 2011 / Vol. 60 / No. 12
in outbreak investigations, collecting appropriate clinical and environmental specimens, and requesting appropriate diagnostic testing for each agent type. One outbreak was associated with sewage contamination of a well, underscoring the importance of proper waste management and water system protection, and the other outbreak was associated with a plumbing system and cross-connection deficiency. A dinner cruise boat connected to a municipal water supply from a dock had a cross-connection that might have allowed backsiphonage of lake water contaminated with sewage into the boat’s potable water supply (88). The outbreak occurred after a period of heavy rainfall and flooding that resulted in the release of a large volume of storm water containing highly diluted sewage into the lake in which the boats were located.
The etiologies of four outbreaks could not be identified, although norovirus was suspected in one outbreak on the basis of symptoms, incubation period, and duration of illness. These four outbreaks represent 11.1% of the 36 drinking water–associated outbreaks reported during 2007–2008, which is among the lowest proportion of outbreaks caused by an unidentified etiology since the beginning of the surveillance system in 1971. This continues a decreasing trend in the proportion of outbreaks caused by an unidentified etiology (6).
The identification of etiologic agents depends on the ability of investigators to recognize the outbreak in a timely manner and for appropriate clinical and environmental samples to be collected and analyzed for the organism, chemical, or toxin of interest. WBDOSS data suggest that these capabilities are improving. During 1971–1996, the etiologic agent was unidentified in 48% (312/645) of drinking water–associated outbreaks whereas during 1997–2008, the etiologic agent was unidentified in 23% (40/174) of outbreaks. This decrease likely reflects improved diagnostic capabilities of laboratories and improvements in outbreak investigations, resulting in more rapid and appropriate specimen collection. Reasons for improved etiologic attribution might also include increased testing and testing capabilities for viral agents in clinical specimens and water samples and improved water sampling and testing methods.
DeficienciesOutbreaks associated with untreated or inadequately treated
source water and distribution system contamination are assigned deficiencies 1–4 and 13. EPA regulations associated with the Safe Drinking Water Act are applicable to public water systems from the water source up to the water meter, the property line, or entry into the building or house, and these deficiencies are important in assessing regulatory strategies. Although individual water systems are not regulated by EPA, the same problems might affect these systems including contamination of pipes or storage infrastructure.
During 2007–2008, 58.3% of all drinking water–related outbreaks (n = 21) and 59.5% of deficiencies (n = 22) involved deficiencies 2–4. One outbreak was associated with more than one deficiency (deficiencies 3 and 4). Deficiencies 1 and 13 were not implicated in any outbreak during the 2007–2008 surveil-lance period. No outbreaks in public water systems have been associated with the use of untreated surface water since 1990.
Untreated Ground WaterOf the 36 drinking water–associated outbreaks reported
during 2007–2008, a total of 13 (36.1%) were associated with contaminated ground water, indicating that contamination of ground water remains a public health problem. Eight (61.5%) of these 13 outbreaks occurred in public water systems, including six in noncommunity water systems and two in community water systems. Factors potentially contributing to these outbreaks included improperly constructed or sited wells, improperly maintained or placed septic systems, contamination by wild or domestic animals, periods of heavy rainfall, and contamination of wells through limestone or fissured rock. Included in the outbreaks associated with improper well construction was a large outbreak of giardiasis in which 35 persons in New Hampshire reported becoming ill after their community drinking water system’s well became contaminated with G. intestinalis. The well was approximately 40 feet from a brook that had evidence of beaver habitation and was likely under the influence of surface water (87). New Hampshire Department of Environmental Services regulations require that wells be placed ≥50 feet from sources of surface water (89), but the well owner had not sought a permit before construction. Following an investigation, the well was disconnected from the water system.
In another outbreak, five persons who drank from a noncommunity water system using untreated, contaminated spring water became ill with salmonellosis (Salmonella serotype I 4,5,12:i:-) (90). Although this serotype has been identified in foodborne disease outbreaks reported to CDC, this is the first report to WBDOSS of an outbreak with this serotype. Several factors potentially contributed to the outbreak, including the poor protection of the spring from contamination (including by runoff and wildlife) and lack of disinfection. Pulsed-field gel electrophoresis patterns for a patient’s stool and tap water collected from the patient’s residence and another distribution system sample were identical. In addition, investigators noted that the geology of the area (porous limestone [karst]) might have increased the likelihood that the spring was under the influence of surface water (90). The spring water tested positive for E. coli (it was not tested for Salmonella), which suggested that the spring was the source of the contamination.
Outbreaks can occur even when wells and septic systems are built according to existing codes. An extensive investigation of a multiple pathogen (norovirus, Campylobacter, and

Surveillance Summaries
MMWR / September 23, 2011 / Vol. 60 / No. 12 59
Salmonella) outbreak that sickened 229 persons in Wisconsin revealed that these pathogens were likely introduced into a noncommunity water system through fissures in the underlying dolomite rock that made the system particularly vulnerable to interconnections between the septic system and the well. The investigators noted that the septic system and well were built in accordance with state codes, so it is unlikely that the source of the outbreak would have been identified had the investigators not conducted a rigorous multifaceted investigation (including epidemiologic, laboratory, and hydrologic examinations). As a result of the outbreak, the well water now is being treated with a combination of UV and chlorination (91).
Eight of thirteen outbreaks associated with contaminated ground water during 2007–2008 occurred in noncommunity or community water systems that are subject to EPA’s GWR. In 2006, the GWR was promulgated for all public systems that use ground water as a source of drinking water. The GWR establishes a risk-based approach to target ground water systems that are vulnerable to fecal contamination and comprises four major components: 1) sanitary surveys, 2) source water monitoring to test for the presence of indicators of fecal contamination in the ground water source, 3) corrective action, and 4) compliance monitoring to ensure that the treatment technology installed to treat drinking water reliably achieves ≥99.99% (4 log) inactivation and/or removal of viruses (92). States are required to perform initial sanitary surveys on the majority of community water systems by 2012; the remainder of the community water systems (the best performing systems) and all noncommunity drinking water systems must be surveyed by the end of 2014 (92). Operators of ground water systems that are identified as being at risk for fecal contamination must take corrective action to reduce the potential for illness from exposure to microbial pathogens.
The remaining five outbreaks associated with untreated ground water deficiencies occurred in individual water systems. Potential contributing factors in these outbreaks included septic system problems, contamination of wells by domestic or wild animals, flooding and heavy rain, and cracks in the well casing. These systems are not subject to the GWR. Approximately 15 million households in the United States have private wells (33). To safeguard the quality of well water, homeowners should seek information on protective measures and implement recommended operation and maintenance guidelines for private well usage. Recommendations for protecting private wells have been published previously (93–95).
Ground Water Under the Direct Influence of Surface Water
In several outbreaks associated with the use of untreated ground water or treatment deficiencies, the water source
appeared to be GWUDI (e.g., microscopic particulate analysis testing identified algae and diatoms, the well was located <50 feet from a surface water source, or the spring was not protected from surface runoff ). If a drinking water source is determined to be GWUDI, it is subject to SWTR requirements and amendments and may be classified as a surface water source by the state. Systems using GWUDI must disinfect their water and either provide filtration or meet criteria for avoiding filtration. EPA has developed a consensus method for assessing whether ground water is under the direct influence of surface water (98). However, WBDOSS currently does not collect information on whether ground water systems are under the influence of surface water, nor do states have standard case definitions and criteria for categorizing a system as GWUDI. Establishing a more standardized system for capturing data on GWUDI will be particularly important in better understanding the potential contributing factors and risks between ground water systems and those that have unique challenges associated with surface water influence.
Treatment DeficienciesSeven outbreaks (19.4%) were associated with treatment
deficiencies (deficiency 3) during 2007–2008. Six (85.7%) of these treatment deficiencies were associated with failures to treat contaminated ground water adequately. Multiple treatment-related factors potentially contributed to these outbreaks, including temporary interruption of disinfection, chronically inadequate disinfection, lack of disinfection, and inadequate filtration. When these deficiencies are considered with deficiency 2, contaminated ground water was determined to be the single largest contributing factor in outbreaks associated with drinking water in 2007–2008, underscoring the need for source water protection and adequate disinfection of ground water sources.
Two outbreaks were reported in public systems that pro-vided filtration and disinfection, but both systems experienced treatment failures preceding the outbreak. One outbreak was reported in a noncommunity system using contaminated spring water and was responsible for 46 cases of giardiasis (86). This spring was classified as GWUDI and therefore subject to EPA’s SWTR and amendments. Although the system had installed a slow sand filter and chlorinator, inadequate time was allowed for formation of a schmutzdecke† biologic layer on the surface of the filter, which is important for effective treatment performance of slow sand filters. When a slow sand filter is first constructed, the bed of clean sand cannot, strictly speaking, be called a filter because the vital living organisms on which
† Gelatinous biologic layer on the surface of a slow sand filter, consisting of a complex microbial community (including bacteria, fungi, protozoa, and rotifera and other aquatic organisms) and organic particulate matter.

Surveillance Summaries
60 MMWR / September 23, 2011 / Vol. 60 / No. 12
effective filtration depends are not yet present. Building up the biologic content of a new filter is a slow but necessary process. Until the filter is sufficiently “ripened,” the filter should not be put into service. Water samples collected 1 week after the filter was put into operation indicated considerably higher levels of total coliforms and turbidity in filtered water samples than in the spring water samples. On the basis of these samples, this system did not meet the treatment requirements of the TCR and SWTR and amendments (97). However, 6 weeks after operation of the filter, a schmutzdecke layer formed, and water samples met requirements.
The second outbreak was reported in a community water system that used surface water from a reservoir. The water was treated conventionally with coagulation, settling, filtration, and disinfection; however, operator error and the interruption of chlorination for 1–2 hours allowed partially disinfected water to enter the distribution system directly through a bypass pipe. During this time, the system did not meet the treatment requirements for disinfection as defined by the SWTR and amendments. The system was recycling filter backwash water as required by EPA (98); however, before the outbreak, the backwash water erroneously bypassed the recovery basin and ozonation before filtration, thereby adversely affecting filter performance. This investigation combined monitoring data with modeling of the distribution system to identify potential system vulnerabilities and sources of contamination. In con-junction with a boil water order notice, the health department asked that residents in the affected area report symptoms of gastrointestinal illness. A cross-sectional, randomly selected household survey was conducted in the affected area to assess potential associations between tap water consumption and gastrointestinal illness. The study identified increased risk for gastrointestinal illness among households that consumed tap water during the period before the boil water notice and also identified substantial dose-response effects and statistically significant trends, with higher rates of illness associated with increased tap water consumption. An extensive list of short- and long-term recommendations was provided through an independent investigation to address system deficiencies and operational issues at the treatment plant.
Distribution System DeficienciesDuring 2007–2008, two drinking water–related outbreaks
involving distribution system deficiencies occurred, includ-ing a large communitywide outbreak of salmonellosis that required local, regional, state, and federal emergency response. An estimated 1,300 persons became ill; 122 infections were laboratory-confirmed, and one person died. The likely source of the outbreak was animal contamination of a storage tank that had numerous cracks and entry points (99). The post outbreak
inspection of the water system also identified >100 possible cross-connections in the distribution system, although these were not thought to contribute directly to the outbreak (99). This was one of the largest outbreaks in a community water system in recent years and highlights the critical importance of robust inspection of storage facilities, identification of potential cross-connections during required sanitary surveys, and the staffing and resources for adequate follow-up to ensure that deficiencies have been addressed. The other outbreak associated with a distribution system deficiency was related to a cross-connection between a well serving a residential community and a noncommunity water system. Additional deficiencies and contributing factors included inadequate disinfection and filtration along with a sewage lift that was out of service; this was the only outbreak reported during this surveillance period with two deficiencies noted.
Cross-connections and backsiphonage represented the larg-est underlying contributing factors among distribution system deficiencies identified in drinking water outbreaks reported during 1971–2006 (6), indicating that greater attention should be focused on cross-connection and backflow prevention and on maintaining the integrity of the distribution system. Drinking water quality within the distribution systems of public water supplies is assessed by monitoring requirements under EPA’s Total Coliform Rule. The 2010 revisions to the TCR include a focus on research and information collection needs in the distribution system to protect public health (100). Seven high-priority areas needing additional focus (cross-connections, storage, water main breaks and pressure transients, intrusion, nitrification, contaminant accumula-tion, and biofilms) were identified by a steering committee selected by EPA and the Water Research Foundation as part of the Research and Information Collection Partnership (101).
LegionellaLegionellosis includes two clinically distinct syndromes:
LD, characterized by severe pneumonia, and PF, a febrile ill-ness that includes cough and does not progress to pneumonia. Legionellosis outbreaks accounted for 33.3% of all drinking water–associated outbreaks reported during 2007–2008 and 91.7% of all deficiencies occurring outside the jurisdiction of regulations or water utility management, indicating that legionellosis is a serious public health issue. Approximately 8,000–18,000 cases of LD occur each year in the United States (102), and incidence appears to be increasing (103). Cases typically manifest as LD rather than PF, but regardless of the syndrome, the source of legionellosis outbreaks typically share common features (e.g., warm stagnant water, inadequate biocide concentrations, and aerosolization, which provides the mechanism for inhalation).

Surveillance Summaries
MMWR / September 23, 2011 / Vol. 60 / No. 12 61
The outbreaks of legionellosis reported during this surveillance period highlight the challenges related to its detection and prevention. Surveillance for legionellosis is passive, and the approach to surveillance, outbreak response, and reporting varies substantively by state. For example, six of 12 LD outbreaks associated with drinking water during this surveillance period were reported from one state, emphasizing the variance in outbreak detection, investigation, and reporting across states. However, there appear to be true differences in disease incidence across the United States, with the highest rates of disease reported in the northeast (103). LD is underdiagnosed because the majority of patients with community-acquired pneumonia are treated empirically with broad-spectrum antibiotics (104). However, because Legionella spp. are not transmitted from person-to-person and are always acquired from an environmental source, even a single case of LD implies the presence of a contaminated water source to which others can be exposed. Certain host factors (e.g., underlying lung disease and immunodeficiencies) influence the development and severity of legionellosis. As a result of underdiagnosis and underreporting, identification of two or more cases of LD in association with a potential source is adequate justification for conducting an investigation.
During 2007–2008, nine (75.0%) of 12 legionellosis outbreaks associated with drinking water occurred in health-care or long-term–care settings, demonstrating the propensity for Legionella spp. to colonize potable water systems and underscoring the importance of maintaining a high index of suspicion for legionellosis in health-care settings and in other settings with vulnerable populations. Although Legionella spp. can live in a free state, they often colonize biofilms and free-living protozoa frequently found inside large, complex hospital plumbing systems (79,105). This protects Legionella from biocides and temperature extremes and allows the bacteria to amplify to levels sufficient to be transmitted and cause disease. Persons in hospitals or elderly living facilities are at increased risk as a result of advanced age and a high prevalence of underlying chronic medical conditions.
An outbreak of legionellosis in a health-care setting should prompt both epidemiologic and environmental investigations. Additional cases might point to water exposures that contributed to the outbreak. Environmental sampling of the potable water system and devices that aerosolize water (e.g., cooling towers) can confirm the source of the outbreak and lead to targeted interventions that prevent additional cases. Each health-care facility should develop a plan for legionellosis prevention to address conditions that support Legionella growth in the potable water supply. Guidelines for reducing the risk for legionellosis associated with building water systems are available (106).
Waterborne Disease Outbreaks Associated with Water Not Intended for Drinking and
Water of Unknown IntentDuring 2007–2008, a total of 12 outbreaks occurred that
were associated with WNID or WUI. Nine (75.0%) of these outbreaks were associated with Legionella spp., three (33.3%) with cooling towers, one (11.1%) with an ornamental fountain, and one (11.1%) with recycled water from a vehicle washing station. Four (44.4%) legionellosis outbreaks had an unidentified source of exposure. Of the nine legionellosis outbreaks associated with WNID/WUI, two occurred in long-term–care or assisted living facilities, two occurred at hospitals, and one occurred at an apartment complex for seniors. As noted previously, it is important to address Legionella colonization in and near buildings that house high-risk populations. Although potable water systems within buildings are implicated frequently in health-care–associated outbreaks, other sources of aerosolized water on site and in the surrounding community (e.g., cooling towers and decorative fountains) also should be considered. Aerosols containing Legionella can travel great distances; an investigation of an outbreak among residents of a long-term–care facility implicated a cooling tower that was 0.4 km from the facility (107).
Previously Unreported OutbreaksThis report incorporates 69 outbreaks of legionellosis from
27 states during 1973–2000 that were added to the surveillance system in 2010 and one previously unreported outbreak of M. mageritense from 2002. Legionellosis outbreaks associated with drinking water, WNID, and WUI were not included in WBDOSS before 2001. During 2009–2010, CDC conducted a comprehensive search of the peer-reviewed scientific literature and CDC outbreak investigation reports to capture the historic record of legionellosis outbreaks since the disease was first recognized in 1976; additional legionellosis outbreaks occurring before 1976 were identified later. Legionellosis outbreaks that occurred after 1971 were included in the analysis to correspond with the period when the surveillance system was started (Table 7). The legionellosis outbreaks identified (covering 1971–2000) are likely an underestimate of legionellosis outbreaks that occurred during this period, and caution should be used when interpreting the reported data (Figures 2 and 7). For example, because reporting mechanisms have changed over time (e.g., only published outbreaks and Epi-Aids are included before 2001, whereas all outbreaks reported by state health departments are included as of 2001), comparisons over time cannot be made, and these data might not be representative of the number of outbreaks over time. However, the addition of the pre-2001

Surveillance Summaries
62 MMWR / September 23, 2011 / Vol. 60 / No. 12
outbreaks to WBDOSS underscores the point that legionellosis outbreaks have occurred consistently over the past 3 decades.
LimitationsWBDOSS and waterborne disease outbreak reporting is subject
to at least four main limitations. First, the level of surveillance and reporting activity varies across states and localities. Therefore, determining whether an increase or decrease in reporting reflects an actual change in the incidence of outbreaks or reflects a change in the sensitivity of surveillance practices is unknown. Outbreak reporting might increase as waterborne disease becomes better recognized, water system deficiencies are identified, and state surveillance activities and laboratory capabilities increase (108–110). Environmental testing and laboratory capacity also vary substantially across states and localities.
Second, detection, investigation, and reporting of outbreaks are incomplete. Multiple factors contribute to the ability of state and local public health agencies to recognize, investigate, and report outbreaks. Public health agencies must have the financial and personnel resources to investigate outbreaks; they must recognize and link cases of illness to a common water source, which requires appropriate epidemiologic, environmental, and laboratory capacity to conduct investigations. For example, analyses for specific pathogens and indicators of water contamination depend upon the availability of certified or approved laboratories. Although many laboratories are certified to conduct standard analyses for fecal indicators and chemicals, few laboratories have capabilities for identifying waterborne pathogens, and these tests can be expensive. Collecting water samples for pathogen identification often requires sampling large quantities of water or filtering large volumes of water through special membranes. Methods for concentrating large volumes of water for testing are being developed and implemented for use in outbreak investigations (89,111–113).
Third, outbreaks associated with drinking water are inherently difficult to detect because most persons have daily exposure to tap water. For this reason, case-control and other epidemiologic studies are less likely to find statistically significant associations unless the outbreaks are communitywide or environmental investigations provide supporting data to identify deficiencies in water treatment or distribution systems that can help identify drinking water as the potential exposure.
Finally, gaps exist in the types of data that are systematically collected and reported during outbreak investigations. In particular, data from environmental investigations on contributing factors associated with outbreaks (e.g., distribution system vulnerabilities, classification of GWUDI systems including testing criteria, or details on septic system placement and maintenance) are often not collected or
reported to CDC. Water samples also often are not collected or are collected late in an investigation, limiting the ability to link clinical and environmental data to establish a water-related exposure through molecular epidemiologic or other laboratory testing. Success in the detection of a pathogen in water samples is highly dependent on a timely investigation and sample collection before contamination is flushed from the water system or inactivated by a disinfectant.
ConclusionData collected as part of the national WBDOSS are used to
describe the epidemiology of waterborne disease outbreaks in the United States. Trends regarding water systems and deficien-cies implicated in these outbreaks are used to assess whether regulations for water treatment and water quality monitoring are adequate to protect public health. Trends regarding the etiologic agents responsible for these outbreaks are used to assess the need for different interventions and changes in poli-cies and resource allocations.
The data provided in this report highlight two primary findings. The first is the high proportion of outbreaks associated with contaminated ground water, whether consumed untreated or with inadequate treatment. This is consistent with data from 1971–2006 indicating that ground water outbreaks comprised the majority of drinking water outbreaks and showed no decrease over time (6). The second finding is that Legionella was again the most frequently reported etiology among drinking water–associated outbreaks, following the pattern observed since it was first included in WBDOSS in 2001 (6). The addition of published and CDC-investigated legionellosis outbreaks to the database demonstrates that legionellosis is not a new public health issue.
Federal drinking water regulations have focused on protecting consumers from contaminated surface water, in part because of previous outbreaks and analyses that suggested needed improvements for surface water systems and the large percentage of the population served by surface water (70% of those using community water systems) (31). These regulations have likely contributed to the decrease in the number and proportion of reported outbreaks associated with contaminated surface water during the previous twenty years. Similar protections for ground water were absent until promulgation of the GWR in 2006. The GWR focuses on identification of deficiencies, protection of wells and springs from contamination, and providing disinfection where necessary to protect against bacterial and viral agents. Outbreaks in disinfected ground water systems emphasize the importance of maintaining adequate, continuous disinfection. Outbreaks

Surveillance Summaries
MMWR / September 23, 2011 / Vol. 60 / No. 12 63
in untreated ground water systems underscore the importance of assessing contamination sources to determine if the ground water source is at risk of contamination from fecal sources or is under the direct influence of surface water where additional treatment is needed to protect against parasites. When fully implemented, the GWR is expected to reduce ground water-associated outbreaks, as seen in surface water outbreaks after promulgation of the SWTR and its amendments.
Surveillance, prevention, and control activities for outbreaks occur primarily at the local and state levels (including territories and FAS). CDC and other federal agencies provide technical assistance with laboratory testing and epidemiologic and environmental investigations when requested by states and territories (Box 1). Efforts to improve the detection, investigation, and reporting of outbreaks at the local, state, and national levels include the 2006 CSTE position statement that made waterborne disease outbreaks, as a unit of reporting, nationally notifiable and reportable to CDC starting in 2007. To improve timeliness and completeness of outbreak reporting, in 2009, CDC transitioned to electronic outbreak reporting through the National Outbreak Reporting System (NORS) for outbreaks occurring on or after January 1, 2009 (114,115). NORS is a collaborative project that is currently used for national surveillance of waterborne disease outbreaks, foodborne disease outbreaks, and enteric disease outbreaks associated with zoonotic, person-to-person, environmental, and undetermined exposures. Efforts to develop and enhance NORS functionality focus on the need to support public health agencies and researchers working to identify the causes
of outbreaks and to understand the environmental factors contributing to these outbreaks.
Adequate programmatic funding and human resources to investigate outbreaks are essential for an effective surveillance system. Improved communication among local and state public health departments, regulatory agencies, and water utilities, along with routine reporting or sharing of water quality data within the health and environmental departments will aid in the detection and control of outbreaks. Additional data are needed to better understand some of the contributing factors associated with many drinking water outbreaks (e.g., a GWUDI classification with details on criteria used to determine the influence of surface water). Further research and exploration of other contributing factors and antecedent events associated with untreated ground water outbreaks are needed, including systematic documentation and reporting of the role of septic system contamination, extreme precipitation events, improper well construction, main breaks, cross-connections, and treatment failures.
Measures to reduce the occurence of drinking water outbreaks in the United States have been outlined (Box 2).
Additional efforts are needed to improve outbreak detection and investigations. Such efforts include enhancing surveillance activities, increasing laboratory support for clinical specimen and water sample testing, conducting environmental investigations to assess outbreak deficiencies and contributing factors, and providing adequate resources and staff to state and local health departments to monitor, detect, and prevent outbreaks.
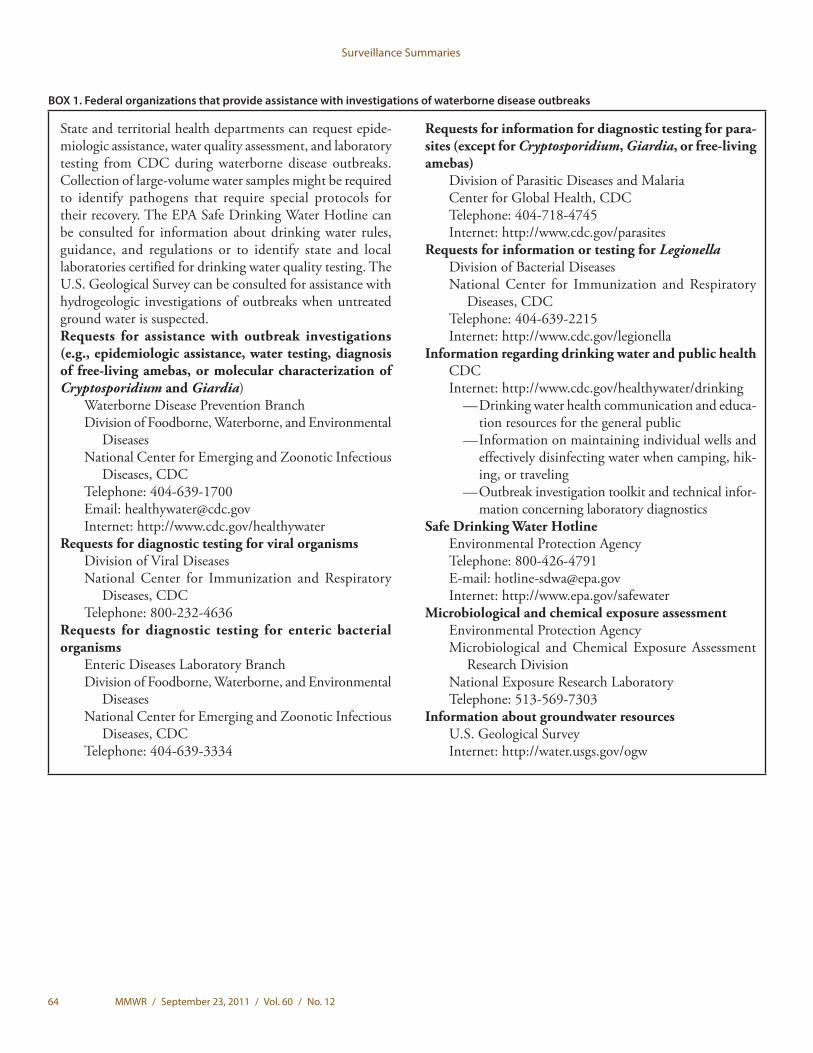
Surveillance Summaries
64 MMWR / September 23, 2011 / Vol. 60 / No. 12
BOX 1. Federal organizations that provide assistance with investigations of waterborne disease outbreaks
State and territorial health departments can request epide-miologic assistance, water quality assessment, and laboratory testing from CDC during waterborne disease outbreaks. Collection of large-volume water samples might be required to identify pathogens that require special protocols for their recovery. The EPA Safe Drinking Water Hotline can be consulted for information about drinking water rules, guidance, and regulations or to identify state and local laboratories certified for drinking water quality testing. The U.S. Geological Survey can be consulted for assistance with hydrogeologic investigations of outbreaks when untreated ground water is suspected.Requests for assistance with outbreak investigations (e.g., epidemiologic assistance, water testing, diagnosis of free-living amebas, or molecular characterization of Cryptosporidium and Giardia)
Waterborne Disease Prevention BranchDivision of Foodborne, Waterborne, and Environmental
DiseasesNational Center for Emerging and Zoonotic Infectious
Diseases, CDCTelephone: 404-639-1700Email: [email protected]: http://www.cdc.gov/healthywater
Requests for diagnostic testing for viral organismsDivision of Viral DiseasesNational Center for Immunization and Respiratory
Diseases, CDCTelephone: 800-232-4636
Requests for diagnostic testing for enteric bacterial organisms
Enteric Diseases Laboratory BranchDivision of Foodborne, Waterborne, and Environmental
DiseasesNational Center for Emerging and Zoonotic Infectious
Diseases, CDCTelephone: 404-639-3334
Requests for information for diagnostic testing for para-sites (except for Cryptosporidium, Giardia, or free-living amebas)
Division of Parasitic Diseases and MalariaCenter for Global Health, CDCTelephone: 404-718-4745Internet: http://www.cdc.gov/parasites
Requests for information or testing for LegionellaDivision of Bacterial DiseasesNational Center for Immunization and Respiratory
Diseases, CDCTelephone: 404-639-2215Internet: http://www.cdc.gov/legionella
Information regarding drinking water and public healthCDCInternet: http://www.cdc.gov/healthywater/drinking
— Drinking water health communication and educa-tion resources for the general public
— Information on maintaining individual wells and effectively disinfecting water when camping, hik-ing, or traveling
— Outbreak investigation toolkit and technical infor-mation concerning laboratory diagnostics
Safe Drinking Water HotlineEnvironmental Protection AgencyTelephone: 800-426-4791E-mail: [email protected]: http://www.epa.gov/safewater
Microbiological and chemical exposure assessmentEnvironmental Protection Agency Microbiological and Chemical Exposure Assessment
Research DivisionNational Exposure Research LaboratoryTelephone: 513-569-7303
Information about groundwater resourcesU.S. Geological SurveyInternet: http://water.usgs.gov/ogw

Surveillance Summaries
MMWR / September 23, 2011 / Vol. 60 / No. 12 65
Acknowledgments
This report is based in part by contributions from state, local, and territorial waterborne disease surveillance coordinators; state, local and territorial epidemiologists; and environmental health personnel.
References
1. Gorman A, Wolman A. Water-borne outbreaks in the United States and Canada and their significance. J Am Water Works Assoc 1939;31:225–75.
2. Eliassen R, Cummings RH. Analysis of waterborne outbreaks, 1938–45. J Am Water Works Assoc 1948;40:509–28.
3. Weibel S, Dixon FR, Weidner RB, McCabe LJ. Waterborne disease outbreaks 1946–60. J Am Water Works Assoc 1964;56:947–58.
4. Craun G, McCabe LJ. Review of the causes of waterborne-disease outbreaks. J Am Water Works Assoc 1973; 65:74–84.
5. Liang JL, Dziuban EJ, Craun GF, et al. Surveillance for waterborne disease and outbreaks associated with drinking water and water not intended for drinking—United States, 2003–2004. MMWR 2006; 55(No. SS-12): 31–65.
6. Craun GF, Brunkard JM, Yoder JS, et al. Causes of outbreaks associated with drinking water in the United States from 1971 to 2006. Clin Microbiol Rev 2010;23: 507–28.
7. Environmental Protection Agency. Water programs: national interim primary drinking water regulations, 1975. Federal Register. 59566–74.
8. Pontius F, Roberson JA. The current regulatory agenda: an update. Major changes to USEPA’s current regulatory agenda are anticipated when the SDWA is reauthorized. J Am Water Works Assoc 1994;86(54ve):54–63.
9. Pontius F. Implementing the 1996 SDWA amendments. J Am Water Works Assoc 1997;89:18–36.
10. Environmental Protection Agency. Drinking water, national primary drinking water regulations, filtration, disinfection, turbidity, Giardia lamblia, viruses, Legionella, and heterotrophic bacteria; final rule. 1989 Federal Register:27486–541.
11. Environmental Protection Agency. National primary drinking water regulations: interim enhanced surface water treatment; final rule. Federal Register 1998;63:69478–521.
12. Environmental Protection Agency. National primary drinking water regulations: long term 1 enhanced surface water treatment rule; final rule. Federal Register 2002;67:1812–44.
13. Environmental Protection Agency. National primary drinking water regulations: long term 2 enhanced surface water treatment rule. Federal Register 2006;71:653–702.
14. Environmental Protection Agency. National primary drinking water regulations: monitoring requirements for public drinking water supplies: Cryptosporidium, Giardia, viruses, disinfection byproducts, water treatment plant data and other information requirements; final rule. Federal Register 1996;61:24353–88.
15. Environmental Protection Agency. National primary drinking water regulations: stage 2 disinfectants and disinfection byproducts rule. Federal Register 2006;71:387–493.
16. Environmental Protection Agency. Drinking water; national primary drinking water regulations; total coliforms (including fecal coliforms and E. coli); final rule. Federal Register 1989;54:27544–68.
17. Environmental Protection Agency. Drinking water; national primary drinking water regulations; total coliforms; corrections and technical amendments; final rule. Federal Register 1990;55:25064–5.
18. Environmental Protection Agency. National primary drinking water regulations: ground water rule; proposed rule. Federal Register 2000;65:40 CFR Parts 141 and 142:30194–274.
19. Environmental Protection Agency. National primary drinking water regulations: ground water rule. Federal Register 2006;19:40 CFR Parts 9, 141, and 142:65573–660.
20. Environmental Protection Agency. Establishment of the total coliform rule distribution system advisory committee. Federal Register 2007;72:35869–70.
21. Environmental Protection Agency. Announcement of the drinking water contaminant candidate list; notice. Federal Register 1998;63:10274–87.
22. Environmental Protection Agency. Drinking water contaminant candidate list 3; final notice. Federal Register 2009;74:51850–62.
23. Environmental Protection Agency. Unregulated contaminant monitoring regulation for public water systems; amendment to the list 2 rule and partial delay of reporting of monitoring results. Federal Register 2001;66:46221–4.
Box 2. Measures to reduce the occurrence of drinking water out-breaks in the United States
• Increasemonitoringandpreventioneffortstoreducethe risk for outbreaks in public ground water systems, particularly unchlorinated ground water systems.
• Conductresearchtoimproveunderstandingoftheecology of Legionella, the characteristics contributing to its pathogenicity, and the interventions that are most effective for controlling growth of Legionella and reducing outbreaks of legionellosis.
• Systematicallycollectandanalyzedataoncontributingfactors associated with drinking water outbreaks and deficiencies, including identification of ground water under the direct influence of surface water (GWUDI) systems and the criteria (e.g., microscopic particulate analysis testing) used for their classification to better assess risks associated with ground water and GWUDI systems and to enable comparison across geographic regions.
• Increaseeffortstoreducetheriskforoutbreaksassociated with drinking water distribution system vulnerabilities (e.g., water main breaks, cross-connec-tions, storage issues, and biofilm proliferation).
• Provideguidanceandtechnicalassistancetohelpprevent outbreaks in unregulated drinking water systems (e.g., private wells and premise plumbing).
•Maintaineffortsfocusedonwatersystemsoperationsand management, water quality, and effective regula-tions to sustain gains made over the past four decades in safe drinking water provision.
• Provideadditionalresourcesandcapacitybuildingforoutbreak detection, investigation and reporting of waterborne disease (particularly environmental investigation, laboratory testing, and data management) at local, state, territorial, tribal, and national levels.

Surveillance Summaries
66 MMWR / September 23, 2011 / Vol. 60 / No. 12
24. Environmental Protection Agency. Unregulated contaminant monitoring regulation for public water systems; analytical method for list 2 contaminants; clarifications to the unregulated contami-nant monitoring regulation. Federal Register 2001;66:2273–308.
25. Environmental Protection Agency. Unregulated contaminant monitoring regulation for public water systems; establishment of reporting date. Federal Register 2002;67:11043–6.
26. Environmental Protection Agency. Unregulated contaminant monitoring regulation: approval of analytical method for Aeromonas; national primary and secondary drinking water regulations: approval of analytical methods for chemical and microbiological contaminants. Federal Register 2002;67:65888–902.
27. Environmental Protection Agency. Drinking water contaminant candidate list 2; final notice. Federal Register 2005;70:9071–7.
28. Environmental Protection Agency. Basic information on CCL and regulatory determinations. Available at http://water.epa.gov/scitech/drinkingwater/dws/ccl/basicinformation.cfm. Accessed August 12, 2011.
29. CDC. Vessel Sanitation Program: outbreak updates for international cruise ships. Available at http://www.cdc.gov/nceh/vsp/surv/GIlist.htm#years. Accessed August 12, 2011.
30. Environmental Protection Agency. Public drinking water systems programs. Available at http://water.epa.gov/infrastructure/drinking-water/pws/index.cfm. Accessed August 12, 2011.
31. Environmental Protection Agency. Factoids: drinking water and ground water statistics for 2009. Available at http://water.epa.gov/scitech/datait/databases/drink/sdwisfed/upload/data_factoids_2009.pdf. Accessed August 12, 2011.
32. Environmental Protection Agency. Private drinking water wells. Available at http://www.epa.gov/safewater/privatewells/index2.html. Accessed August 12, 2011.
33. U.S. Census Bureau Housing and Household Economic Statistics Division. American Housing Survey (AHS), 2009. Table 1–4: Selected equipment and plumbing—all housing units. Available at http://www.census.gov/hhes/www/housing/ahs/ahs09/ahs09.html. Accessed August 12, 2011.
34. Environmental Protection Agency. Safe Drinking Water Act (SDWA). Available at http://water.epa.gov/lawsregs/rulesregs/sdwa/index.cfm. Accessed August 12, 2011.
35. Herwaldt BL, Craun GF, Stokes SL, Juranek DD. Waterborne-disease outbreaks, 1989–1990. MMWR 1991;40(No. SS-3):1–21.
36. Benin AL, Benson RF, Besser RE. Trends in legionnaires disease, 1980–1998: declining mortality and new patterns of diagnosis. Clin Infect Dis 2002;35:1039–46.
37. Gira AK, Reisenauer AH, Hammock L, et al. Furunculosis due to Mycobacterium mageritense associated with footbaths at a nail salon. J Clin Microbiol 2004;42:1813–7.
38. Deubner DC, Gilliam DK. Fever of undetermined etiology after cleaning of steam turbine condensers. Arch Environ Health 1977;32:116–9.
39. Fraser DW, Tsai TR, Orenstein W, et al. Legionnaires’ disease: description of an epidemic of pneumonia. N Engl J Med 1977;297:1189–97.
40. Terranova W, Cohen ML, Fraser DW. 1974 outbreak of Legionnaires’ Disease diagnosed in 1977. Clinical and epidemiologi-cal features. Lancet 1978;2(8081):122–4.
41. Broome CV, Goings SA, Thacker SB, Vogt RL, Beaty HN, Fraser DW. The Vermont epidemic of Legionnaires’ disease. Ann Intern Med 1979;90:573–7.
42. Fraser DW, Deubner DC, Hill DL, Gilliam DK. Nonpneumonic, short-incubation-period Legionellosis (Pontiac fever) in men who cleaned a steam turbine condenser. Science 1979;205:690–1.
43. Frenkel JK, Baker LH, Chonko AM. Autopsy diagnosis of Legionnaires’ disease in immunosuppressed patients. A paleodiagno-sis using Giemsa stain (Wohlbach modification). Ann Intern Med 1979;90:559–62.
44. Haley CE, Cohen ML, Halter J, Meyer RD. Nosocomial Legionnaires’ disease: a continuing common-source epidemic at Wadsworth Medical Center. Ann Intern Med 1979;90:583–6.
45. Politi BD, Fraser DW, Mallison GF, et al. A major focus of Legionnaires’ disease in Bloomington, Indiana. Ann Intern Med 1979;90:587–91.
46. Brown A, Yu VL, Elder EM, Magnussen MH, Kroboth F. Nosocomial outbreak of Legionnaire’s disease at the Pittsburgh Veterans Administration Medical Center. Trans Assoc Am Physicians 1980;93:52–9.
47. Edelstein,PH, Meyer RD, Finegold SM. Laboratory diagnosis of Legionnaires’ disease. Am Rev Respir Dis 1980;121:317–27.
48. Cordes LG, Wiesenthal AM, Gorman GW, et al. Isolation of Legionella pneumophila from hospital shower heads. Ann Intern Med 1981;94:195–7.
49. Conwill DE, Werner SB, Dritz SK, et al. Legionellosis—the 1980 San Francisco outbreak. Am Rev Respir Dis 1982;126:666–9.
50. Helms CM, Wintermeyer LA, Zeitler RR, et al. An outbreak of community-acquired Legionnaires’ disease pneumonia. Am J Public Health 1984;74:835–6.
51. Klaucke DN, Vogt RL, LaRue D, et al. Legionnaires’ disease: the epidemiology of two outbreaks in Burlington, Vermont, 1980. Am J Epidemiol 1984;119:382–91.
52. Nolte FS, Conlin CA, Roisin AJ, Redmond SR. Plasmids as epidemiological markers in nosocomial Legionnaires’ disease. J Infect Dis 1984;149:251–6.
53. CDC. Legionellosis—Staffordshire, England, and Wayne County, Michigan. MMWR 1985;34:344, 349–50.
54. Garbe PL, Davis BJ, Weisfeld JS, et al. Nosocomial Legionnaires’ disease. Epidemiologic demonstration of cooling towers as a source. JAMA 1985;254:521–4.
55. Friedman S, Spitalny K, Barbaree J, Faur Y, McKinney R. Pontiac fever outbreak associated with a cooling tower. Am J Public Health 1987;77:568–72.
56. Hanrahan JP, Morse DL, Scharf VB, et al. A community hospital outbreak of legionellosis: transmission by potable hot water. Am J Epidemiol 1987;125:639–49.
57. Johnston JM, Latham RH, Meier FA, et al. Nosocomial outbreak of Legionnaires’ disease: molecular epidemiology and disease control measures. Infect Control 1987;8:53–8.
58. Muraca PW, Stout JE, Yu VL, Yee YC. Legionnaires’ disease in the work environment: implications for environmental health. Am Ind Hyg Assoc J 1988;49:584–90.
59. Addiss DG, Davis JP, LaVenture M, Wand PJ, Hutchinson MA, McKinney RM. Community-acquired Legionnaires’ disease associated with a cooling tower: evidence for longer-distance transport of Legionella pneumophila. Am J Epidemiol 1989;130:557–68.
60. Doebbeling BN, Ishak MA, Wade BH, et al Nosocomial Legionella micdadei pneumonia: 10 years experience and a case-control study. J Hosp Infect 1989;13:289–98.

Surveillance Summaries
MMWR / September 23, 2011 / Vol. 60 / No. 12 67
61. Breiman,RF, Fields BS, Sanden GN, Volmer L, Meier A, Spika JS. Association of shower use with Legionnaires’ disease. Possible role of amoebae. JAMA 1990;263:2924–6.
62. CDC. Legionnaires’ disease outbreak associated with a grocery store mist machine—Louisiana, 1989. MMWR 1990;39:108–10.
63. Fenstersheib MD, Miller M, Diggins C, et al. Outbreak of Pontiac fever due to Legionella anisa. Lancet 1990;336(8706):35–7.
64. Redd SC, Lin FY, Fields BS, et al. A rural outbreak of Legionnaires’ disease linked to visiting a retail store. Am J Public Health 1990;80:431–4.
65. Mahoney FJ, Hoge CW, Farley TA, et al. Communitywide outbreak of Legionnaires’ disease associated with a grocery store mist machine. J Infect Dis 1992;165:736–9.
66. Schoonmaker D, Heimberger T, Birkhead G. Comparison of ribotyping and restriction enzyme analysis using pulsed-field gel electrophoresis for distinguishing Legionella pneumophila isolates obtained during a nosocomial outbreak. J Clin Microbiol 1992;30:1491–8.
67. Blatt SP, Parkinson MD, Pace E, et al. Nosocomial Legionnaires’ disease: aspiration as a primary mode of disease acquisition. Am J Med 1993;95:16–22.
68. Hlady WG, Mullen RC, Mintz CS, Shelton BG, Hopkins RS, Daikos GL. Outbreak of Legionnaire’s disease linked to a decorative fountain by molecular epidemiology. Am J Epidemiol 1993;138:555–62.
69. Keller DW, Hajjeh R, DeMaria A, et al. Community outbreak of Legionnaires’ disease: an investigation confirming the potential for cooling towers to transmit Legionella species. Clin Infect Dis 1996;22:257–61.
70. Whitney CG, Hofmann J, Pruckler JM, et al. The role of arbitrarily primed PCR in identifying the source of an outbreak of Legionnaires’ disease. J Clin Microbiol 1997;35:1800–4.
71. Fiore AE, Nuorti JP, Levine OS, et al. Epidemic Legionnaires’ disease two decades later: old sources, new diagnostic methods. Clin Infect Dis 1998;26:426–33.
72. Lepine LA, Jernigan DB, Butler JC, et al. A recurrent outbreak of nosocomial legionnaires’ disease detected by urinary antigen testing: evidence for long-term colonization of a hospital plumbing system. Infect Control Hosp Epidemiol 1998;19:905–10.
73. Brown CM, Nuorti PJ, Breiman RF, et al. A community outbreak of Legionnaires’ disease linked to hospital cooling towers: an epidemiological method to calculate dose of exposure. Int J Epidemiol 1999;28:353–9.
74. Knirsch CA, Jakob K, Schoonmaker D, et al. An outbreak of Legionella micdadei pneumonia in transplant patients: evaluation, molecular epidemiology, and control. Am J Med 2000;108:290–5.
75. Kool,JL, Buchholz U, Peterson C, et al. Strengths and limitations of molecular subtyping in a community outbreak of Legionnaires’ disease. Epidemiol Infect 2000;125:599–608.
76. Yoder J, Roberts V, Craun GF, et al. Surveillance for waterborne disease and outbreaks associated with drinking water and water not intended for drinking—United States, 2005–2006. MMWR 2008;57(No. SS-9):39–62.
77. Fields BS, Benson RF, Besser RE. Legionella and Legionnaires’ disease: 25 years of investigation. Clin Microbiol Rev 2002;15:506–26.
78. Kozak NA, Benson RF, Brown E, et al. Distribution of lag-1 alleles and sequence-based types among Legionella pneumophila serogroup 1 clinical and environmental isolates in the United States. J Clin Microbiol 2009;47:2525–35.
79. Environmental Protection Agency. The history of drinking water treatment. Available at http://www.epa.gov/safewater/consumer/pdf/hist.pdf. Accessed August 12, 2011.
80. Fogarty J, Thornton L, Hayes C, et al. Illness in a community associated with an episode of water contamination with sewage. Epidemiol Infect 1995;114:289–95.
81. Murata T, Iida T, Shiomi Y, et al. A large outbreak of foodborne infection attributed to Providencia alcalifaciens. J Infect Dis 2001;184:1050–5.
82. Yoh M, Matsuyama J, Ohnishi M, et al. Importance of Providencia species as a major cause of travellers’ diarrhoea. J Med Microbiol 2005;54(Pt 11):1077–82.
83. Janda JM, Abbott SL, Woodward, D, Khashe S. Invasion of HEp-2 and other eukaryotic cell lines by Providenciae: further evidence supporting the role of Providencia alcalifaciens in bacterial gastroenteritis. Curr Microbiol 1998;37:159–65.
84. Hassan-Rios E, Ramos M, Cediz J, Garcia-Rivera E. Outbreak of cyclosporiasis in a rural community in Puerto Rico, 2008. [Presentation]. Annual Conference of the Council of State and Territorial Epidemiologists; Buffalo, New York; June 7–11, 2009.
85. Huang P, Weber JT, Sosin DM, et al. The first reported outbreak of diarrheal illness associated with Cyclospora in the United States. Ann Intern Med 1995;123:409–14.
86. Karon AE, Hanni KD, Mohle-Boetani JC, et al. Giardiasis outbreak at a camp after installation of a slow-sand filtration water-treatment system. Epidemiol Infect 2011;139:713-7
87. Daly ER, Roy SJ, Blaney DD, et al. Outbreak of Giardiasis associated with a community drinking-water source. Epidemiol Infect 2010;138:491–500.
88. Serdarevic F, Black S, Jones R, et al. Multipathogen waterborne disease outbreak onboard a boat—Chicago, 2008 [Presentation]. Epidemiol and Infect 2011;May 19:1–5 [epub ahead of print].
89. New Hampshire Department of Environmental Services. New Hampshire Code of Administrative Rules. Small production wells for small community water systems. PART Env-Dw 301. Env-Dw 301 #9007 effective 10-19-07. Available at http://des.nh.gov/organization/commissioner/legal/rules/documents/env-dw301.pdf. Accessed August 12, 2011.
90. Kozlica J, Claudet AL, Solomon D, Dunn JR, Carpenter LR. Waterborne outbreak of Salmonella I 4,[5],12:i. Foodborne Pathog Dis 2010;7:1431–3.
91. Borchardt MA, Bradbury KR, Alexander EC Jr., et al. Norovirus outbreak caused by a new septic system in a dolomite aquifer. Ground Water 2011;49:85-97.
92. Environmental Protection Agency. Final Ground Water Rule fact sheet. Available at http://water.epa.gov/lawsregs/rulesregs/sdwa/gwr/regulation_factsheet_final.cfm. Accessed August 12, 2011.
93. CDC. Private ground water wells. Available at http://www.cdc.gov/healthywater/drinking/private/wells/index.html. Accessed August 12, 2011.
94. Environmental Protection Agency. Private wells: what you can do. Available at http://water.epa.gov/drink/info/well/whatyoucando.cfm. Accessed August 12, 2011.
95. Environmental Protection Agency. Drinking water from household wells. Available at http://water.epa.gov/drink/info/well/upload/2003_06_03_privatewells_pdfs_household_wells.pdf. Accessed August 12, 2011.

Surveillance Summaries
68 MMWR / September 23, 2011 / Vol. 60 / No. 12
96. Environmental Protection Agency. Consensus method for determining groundwaters under the direct influence of surface water using microscopic particulate analysis (MPA). Available at http://yosemite.epa.gov/water/owrccatalog.nsf/7322259e90d060c885256f0a0055db68/55e72db4e0b0321c85256b06007232f6!OpenDocument. Accessed August 12, 2011.
97. Environmental Protection Agency. A small systems guide to the Total Coliform Rule: monitoring drinking water to protect public health. Available at http://www.epa.gov/ogwdw/disinfection/tcr/pdfs/guide_tcr_smallystemsguide.pdf. Accessed August 12, 2011.
98. Environmental Protection Agency. National primary drinking water regulations: filter backwash recycling rule; final rule. Federal Register 2001;66:31086–105.
99. Falco R, Williams SI, Waterborne Salmonella outbreak in Alamosa, Colorado March and April 2008: outbreak identification, response, and investigation. Available at http://www.cdphe.state.co.us/wq/drinkingwater/pdf/AlamosaInvestRpt.pdf. Accessed August 12, 2011.
100. Environmental Protection Agency. National Primary Drinking Water Regulations: revisions to the Total Coliform Rule; proposed rule. Federal Register 2010;75:40925–1016.
101. Environmental Protection Agency and Water Research Foundation. Final priorities of the Distribution System Research and Information Collection Partnership. Available at http://www.epa.gov/safewater/disinfection/tcr/pdfs/tcrdsac/finpridsricp051010.pdf. Accessed August 12, 2011.
102. Marston BJ, Plouffe JF, File TM Jr, et al. Incidence of community-acquired pneumonia requiring hospitalization: results of a popula-tion-based active surveillance study in Ohio. The Community-Based Pneumonia Incidence Study Group. Arch Intern Med 1997;157:1709–18.
103. Neil K, Berkelman R. Increasing incidence of legionellosis in the United States, 1990–2005: changing epidemiologic trends. Clin Infect Dis 2008;47:591–9.
104. Bartlett JG. Decline in microbial studies for patients with pulmo-nary infections. Clin Infect Dis 2004;39:170–2.
105. Storey MV, Winiecka-Krusnell J, Ashbolt NJ, Stenstrom TA. The efficacy of heat and chlorine treatment against thermotolerant Acanthamoebae and Legionellae. Scand J Infect Dis 2004;36:656–62.
106. American Society of Heating, Refrigerating and Air-Conditioning Engineers. ASHRAE Guideline 12-2000: Minimizing the risk of legionellosis associated with building water systems. Atlanta, GA: American Society of Heating, Refrigerating and Air-Conditioning Engineers, Inc.; 2000.
107. Phares CR, Russell E, Thigpen MC, et al. Legionnaires’ disease among residents of a long-term care facility: the sentinel event in a community outbreak. Am J Infect Control 2007;35:319–23.
108. Craun GF, Frost FJ, Calderon RL, et al. Improving waterborne disease outbreak investigations. Int J Environ Health Res 2001;11:229–43.
109. Frost FJ, Calderon RL, Craun GF. Improving waterborne disease surveillance. In: Pontius FW, ed. Drinking water regulation and health. New York, NY: John Wiley & Sons; 2003:25–44.
110. Hunter P, Waite M, Ronchi E, eds. Drinking water and infectious disease: establishing the links. Boca Raton, FL: CRC Press; 2003:221.
111. Hill VR, Kahler AM, Jothikumar N, Johnson TB, Hahn D, Cromeans TL. Multistate evaluation of an ultrafiltration-based procedure for simultaneous recovery of enteric microbes in 100-liter tap water samples. Appl Environ Microbiol 2007;73:4218–25.
112. O’Reilly CE, Bowen AB, Perez NE, et al A waterborne outbreak of gastroenteritis with multiple etiologies among resort island visitors and residents: Ohio, 2004. Clin Infect Dis 2007;44:506–12.
113. Smith CM, Hill VR. Dead-end hollow-fiber ultrafiltration for recovery of diverse microbes from water. Appl Environ Microbiol 2009;75:5284–9.
114. CDC. National Outbreak Reporting System (NORS). Available at http://www.cdc.gov/healthywater/statistics/wbdoss/nors/index.html. Accessed August 12, 2011.
115. CDC. Waterborne Disease and Outbreak Surveillance System (WBDOSS). Available at http://www.cdc.gov/healthywater/statistics/wbdoss/index.html. Accessed August 12, 2011.

Surveillance Summaries
MMWR / September 23, 2011 / Vol. 60 / No. 12 69
Appendix AGlossary of Definitions
action level A specified concentration of a contaminant in water. If this concentration is reached or exceeded, certain actions (e.g., further treatment and monitoring) must be taken to comply with a drinking water regulation.
aquifer A geologic formation or part of a formation (e.g., gravel, sand, or porous stone) that yields water to wells or springs.
backflow A hydraulic condition caused by a difference in water pressure that causes nonpotable water or other liquid to enter the potable water system by either backpressure or backsiphonage. See cross-connection.
backsiphonage A hydraulic condition caused by negative or subatmospheric pressure within a water system, resulting in backflow.
biofilm Microbial cells that adhere to a moist or water-covered surface through a matrix of primarily polysaccharide materials in which they are encapsulated. Biofilms can grow on piping and surfaces of water systems and can be very difficult to remove. They protect microbes from disinfectants (e.g., chlorine) in the water.
boil water advisory A statement to the public advising that tap water must be boiled before drinking.bottled water Commercially produced bottled water.class Waterborne disease outbreaks are classified according to the strength of the epidemiologic
and clinical laboratory data, and environmental data implicating water as the source of the outbreak (see Table 3).
coliforms All aerobic and facultative anaerobic, gram-negative, nonspore-forming, rod-shaped bacteria that ferment lactose with gas formation within 48 hours at 95°F (35°C). Coliforms are mostly harmless bacteria that live in soil and water as well as the gut of humans and animals.
community water system A public water system that has at least 15 service connections used by year-round residents or that regularly serves at least 25 year-round residents. The system might be owned by a private or public entity providing water to a community, subdivision, or mobile home park.
cross-connection Any actual or potential connection between a drinking water supply and a possible source of contamination or pollution (i.e., nonpotable water). Under this condition, contaminated water might flow back into the drinking water system. See backflow and backsiphonage.
deficiency An antecedent event or situation contributing to the occurrence of a waterborne disease or outbreak. Outbreaks associated with water intended for drinking, water not intended for drinking and water of unknown intent are assigned deficiency codes, as categorized in Table 2.
dermatitis Inflammation of the skin. In this report, dermatitis denotes a broad category of skin-related symptoms (e.g., folliculitis, cellulitis, chemical burns, or rash).
disinfection A treatment that kills microorganisms (e.g., bacteria, viruses, and protozoa); in water treatment, a chemical (commonly chlorine, chloramine, or ozone) or physical process (e.g., ultraviolet light) can be used.
disinfection by-products Chemicals formed in water through reactions between organic or inorganic matter and disinfectants. Examples include chloramines, also known as combined chlorines. These chemicals might have acute or chronic health effects.

Surveillance Summaries
70 MMWR / September 23, 2011 / Vol. 60 / No. 12
distribution system Water pipes, storage reservoirs, tanks, and other means used to deliver drinking water to consumers or to store finished water before delivery to a customer. In community water systems, the distribution system is under the jurisdiction of a water utility and ends at the water meter or at the customer’s property line (if the system is not metered). In noncommunity and nonpublic individual water systems, the distribution system ends at the point where water enters the building or house. See plumbing.
etiology The pathogen, chemical, or toxin causing a waterborne disease or outbreak or other health event. Infectious etiologic agents include bacteria, parasites, and viruses.
fecal coliforms Coliform bacteria that grow and ferment lactose to produce gas at 112.1°F (44.5°C) within 24 hours. These bacteria are associated with human and animal wastes, and their presence in water might be an indication of recent sewage or animal waste contamination.
filtration In water treatment, the process of passing water through one or more permeable membranes or media of small diameter (e.g., sand, anthracite, and diatomaceous earth) to remove suspended particles from the water. Filters might be effective in removing pathogens, depending on the type and operation.
finished water The water (e.g., drinking water) delivered to the distribution system after treatment (if any treatment occurred).
free chlorine Chlorine in water (found as an aqueous mixture of hypochlorous acid and hypochlorite anion) that has not combined with other constituents; therefore, it is able to serve as an effective disinfectant (also referred to as free available chlorine or residual chlorine). Measuring the free chlorine level is a common water quality test.
ground water Water that is contained in interconnected pores in an aquifer. ground water system A drinking water system that uses water extracted from an aquifer (i.e., a well or spring) as its
source.ground water under the direct influence of surface water (GWUDI)
As defined by the U.S. Environmental Protection Agency (EPA): Any water beneath the surface of the ground with: 1) significant occurrence of insects or other macroorganisms such as algae or large-diameter pathogens such as Giardia lamblia or, 2) significant and relatively rapid shifts in water characteristics such as turbidity, temperature, conductivity, or pH which closely correlate to climatologic or surface water conditions. Direct influence must be determined for individual sources in accordance with criteria established by the state. The state determination of direct influence may be based on site-specific measurements of water quality and/or documentation of well construction characteristics and geology with field evaluation. Source: http://water.epa.gov/aboutow/ogwdw/glossary_technical.cfm#G.
individual water system A water system that does not meet the EPA definition for a public water system. The system might regularly serve as many as 24 persons or 14 connections or as few as a single person or connection (e.g., a single family or farm not having access to a public water system). States are responsible for regulating these water systems.
karst aquifer An aquifer characterized by water-soluble limestone and similar rocks in which fractures or cracks have been widened by the dissolution of the carbonate rocks by ground water; the aquifer might contain sinkholes, tunnels, or even caves.
mixed water source outbreak More than one type of source water is implicated in the outbreak (e.g., a combination of ground water and surface water).
noncommunity water system A public water system that is not a community system; it does not serve year-round residents. There are two types: transient and nontransient noncommunity systems.

Surveillance Summaries
MMWR / September 23, 2011 / Vol. 60 / No. 12 71
nontransient noncommunity water system
A public water system that regularly supplies water to ≥25 of the same persons for ≥6 months per year but not year-round (e.g., schools, factories, office buildings, or hospitals with their own water systems).
plumbing Water pipes, storage reservoirs, tanks, and other means used to deliver drinking water to consumers inside buildings or houses or to store drinking water inside buildings or houses before consumption. In community water systems, the plumbing begins after the water utility’s water meter or at the property line (if the distribution system is not metered). In noncommunity and nonpublic (i.e., individual) water systems, the plumbing begins at the point where water enters the building or house. See distribution system.
predominant illness The category of illness reported by >50% of ill respondents (e.g., acute gastroenteritis, dermatitis, or acute respiratory illness). When more than one illness category is reported for a single outbreak, they are listed together as predominant illnesses. These mixed illness outbreaks are analyzed separately from outbreaks with single illnesses.
primary water exposure For use in this report, a classification used for the source of contaminated water in outbreaks involving water not intended for drinking or water of unknown intent.
public water system A system that provides piped water to the public for human consumption and is regulated under the Safe Drinking Water Act. Such a system must have at least 15 service connections or regularly serve at least 25 persons daily for at least 60 days per year. Each public water system is further classified as either a community water system or a noncommunity water system.
raw water Surface water or ground water that has not undergone a disinfection or treatment process for the purpose of making it safer for consumption in any way. See untreated water.
reservoir, impoundment An artificially maintained lake or other body of water used for the collection and storage of water. This body of water can be available as a source of raw water for drinking purposes or recreational use. In certain instances, a finished water storage facility in the distribution system might also be called a reservoir.
schmutzdecke Gelatinous biologic layer on the surface of a slow sand filter, consisting of a complex microbial community (including bacteria, fungi, protozoa, and rotifera and other aquatic organisms) and organic particulate matter.
setting Location in which exposure to contaminated water occurred (e.g., restaurant, hospital, or hotel).
source water Untreated ground or surface water (i.e., raw water) used to produce drinking water. Source water may or may not be treated prior to human consumption.
surface water All water on the surface of the earth (e.g., lakes, rivers, reservoirs, ponds, and oceans) as distinguished from subsurface or ground water.
total coliforms The combined count of fecal and nonfecal coliforms that are detected in water using a standard test. The extent to which total coliforms are present in water can indicate the general quality of that water and the likelihood that the water is contaminated fecally by animal and/or human sources.
transient noncommunity water system
A public water system that provides water in a place such as a gas station or campground where persons do not remain for long periods.
untreated water Water that has not undergone a disinfection or treatment process for the purpose of making it safer for consumption (i.e., raw water).

Surveillance Summaries
72 MMWR / September 23, 2011 / Vol. 60 / No. 12
water not intended for drinking (WNID)
Water that has not been treated for human consumption in conformance with EPA drinking water standards and that is provided for uses other than for drinking. This category includes water used in industrial settings; untreated water from lakes, springs, and creeks used as drinking water by campers and boaters; irrigation water; and other nonpotable water sources with or without taps. This category does not include exposure to recreational water or flood water.
water of unknown intent (WUI)
Water for which there is insufficient information to determine for what purpose it is being provided or used and whether it has been treated for human consumption in conformance with EPA drinking water standards.
water system A system for the provision of water for human consumption through pipes or other constructed conduits. This includes any collection, treatment, storage, and distribution facilities used primarily in connection with such a system.

Surveillance Summaries
MMWR / September 23, 2011 / Vol. 60 / No. 12 73
Appendix BDescriptions of Selected Waterborne Disease Outbreaks Associated with Drinking Water,
Water Not Intended for Drinking, and Water of Unknown Intent
Month Year
State/Jurisdiction in which outbreak
occurred EtiologyNo. of cases
(deaths) Description of outbreak
BacteriaOctober 2007 Nevada Legionella pneumophila
serogroup 17 During November and December of 2007, two cases of Legionnaire’s
disease (LD) occurring at the same timeshare condominium were identified through CDC’s surveillance system for travel-associated LD; two additional cases were identified in 2008. A subsequent review identified a single case in 2006, and a previous outbreak of legionellosis in 2001 at the same condominium. Seven laboratory-confirmed cases were reported during 2007–2008. The condominium has three towers with individual low- and high-rise potable water systems. Water samples were collected from guest rooms, water heaters, cooling towers, decorative features and recreational facilities, as well as the municipal water source at the water meter, prior to the implementation of extensive remediation efforts. Environmental samples from showerheads and sinks in one of the towers were found to have L. pneumophila that was an identical molecular match to the single clinical isolate available in 2001. Laboratory findings, combined with evidence of sporadic transmission between the first and second outbreak, indicated that long-term colonization of the drinking water system with L. pneumophila had likely occurred at the complex and highlights the importance of travel-associated surveillance systems in linking disease occurrence among geographically-dispersed travelers. No cases were reported at the time-share condominium in 2009 following completion of the second remediation attempt.
July 2008 New York L. pneumophila serogroup 1 13 (1) Thirteen residents of an apartment complex for seniors received a diagnosis of Legionnaires’ disease. Several water samples from apartment bathroom taps and a hot water cartridge were culture positive for L. pneumophila serogroup 1. The environmental isolates matched patient clinical isolates via pulse-field gel electrophoresis (PFGE). No single event was determined to have led to the outbreak. Potential contributing factors included a previous water main break and subsequent loss in water pressure, disruption and mobilization of an existing biofilm colonized with Legionella, and a hot water heater temperature setting that may have been supportive of Legionella growth.
August 2008 Connecticut Providencia 55 Fifty-five persons in an apartment complex supplied by water from a community water system became ill with gastrointestinal symptoms. Six of nine stool specimens tested positive for Providencia. None of the stool specimens tested positive for Salmonella, Shigella, Campylobacter, E. coli, parasites, or norovirus. The investigation found a statistically significant association between tap water consumption and illness. Seven well water samples tested negative for Providencia and six of the samples tested positive for E. coli. Raw sewage was visible on the ground after two septic pumps located uphill of the water system wells failed and the septic tank overflowed. Contributing factors in the outbreak included the downhill movement of sewage towards the wells by rainfall and a cracked well casing.
March 2008 Colorado Salmonella Typhimurium 1,300 (1) An estimated 1,300 persons became ill when a community drinking water system became contaminated with Salmonella Typhimurium. At the time of the outbreak, a state waiver allowed the distribution of untreated ground water. Twenty persons were hospitalized and one person died. Epidemiologic and environmental findings implicated the community water system. Clinical specimens and tap water tested positive for identical subtypes of S. Typhimurium using pulse-field gel electrophoresis. The likely source of the outbreak was animal contamination of a storage tank that had numerous cracks and entry points. The outbreak response required local, regional, state, and federal emergency assistance over a period of three weeks during which bulk water was distributed by the National Guard while the distribution system was hyperchlorinated. At the time of the outbreak, a new water-treatment plant was under construction, primarily for the purpose of abating naturally high levels of arsenic. Since the outbreak, water is now continuously disinfected at this new plant.

Surveillance Summaries
74 MMWR / September 23, 2011 / Vol. 60 / No. 12
Month Year
State/Jurisdiction in which outbreak
occurred EtiologyNo. of cases
(deaths) Description of outbreak
August 2008 Tennessee Salmonella serotype I 4,5,12:i:-
5 Five persons were infected with Salmonella serotype I 4,5,12:i:- following consumption of untreated water from a local spring that supplied five homes and a church. The initial case was an infant who was seen by a physician for bloody diarrhea. The regional health department investigated the illness and determined that tap water used to mix powdered formula was the primary risk factor. Tap water collected from the infant’s home tested positive for total coliforms and E. coli. The water also tested positive for Salmonella and was a pulse-field gel electrophoresis (PFGE) match to isolates from the infant’s stool. A subsequent water sample from the church matched the clinical and tap water samples by PFGE. As a result of the investigation, the Tennessee Department of Environment and Conservation (TDEC) and the regional health department then worked with the affected homes, church and spring owner to provide education and bring the drinking water system into compliance.
VirusesMarch 2008 Tennessee Hepatitis A virus 9 Nine persons tested positive and four persons were hospitalized for infection
with hepatitis A virus after spending time at a lakeside residential and vacation community without municipal water or sewer services. Cases were identified among relatives and friends of two resident families. The index case occurred in early March, and the cluster of secondary cases occurred >6 weeks later, in April. The epidemiologic study indicated that person-to-person transmission did not occur. Water samples collected in May from two wells, one supplying the residence of three persons with secondary cases, detected hepatitis A virus by PCR that was the same strain as that in the persons from whom virus specimens were collected. The untreated well water was likely contaminated by a faulty septic system used by the index case-patient, who lived in a mobile home nearby. The public health response included provision of vaccine at three vaccination clinics and provision of postexposure immunoglobulin to >1,500 residents and visitors. Education regarding karst geology and the risks of drinking water from shallow private wells without disinfection was provided to homeowners in the area, and local and state government offices were encouraged to consider extending water utility services to the affected area.
ParasitesApril 2008 Puerto Rico Cyclospora cayetanensis 82 The Puerto Rico Department of Health investigated an outbreak of recurrent
diarrhea in a rural community. Of 82 case-patients that were identified, seven were hospitalized. Clinical testing identified Cyclospora cayetanensis in 20 of 26 case-patient stool specimens. An epidemiologic study showed that interruptions in the water service during the past six months, changes in drinking water quality and appearance, and food purchases at a local supermarket were associated with illness; no increased risk was associated with consumption of fruits or vegetables. Interruptions in water service occurred prior to the outbreak, including one interruption during the estimated exposure period when a pumping station was found to be damaged and water was delivered in trucks from another water system and stored in a water tank. Breaks in water supply and changes in water quality were reported by the community during the same time period. Although the source of contamination was not identified, this is the first outbreak of C. cayetanensis in Puerto Rico in which water consumption is considered the probable source of transmission.
July 2007 California Giardia intestinalis 46 A giardiasis outbreak at a camp that used a spring as its water source resulted in 46 cases of illness. The spring was classified as ground water under the direct influence of surface water and therefore subject to the Environmental Protection Agency’s Surface Water Treatment Rule and amendments. An epidemiologic study conducted implicated eating a garden salad and showering as risk factors for illness. Although a slow sand filter and chlorinator had been installed, inadequate time was allowed for formation of a schmutzdecke biological layer on the surface of the filter, which is important for effective treatment performance of slow sand filters. Water samples collected one week after the filter was put into operation showed considerably higher levels of total coliforms and turbidity in filtered water samples than in the spring water samples. Six weeks after operation of the filter a schmutzdecke layer formed and water samples met requirements.

Surveillance Summaries
MMWR / September 23, 2011 / Vol. 60 / No. 12 75
Month Year
State/Jurisdiction in which outbreak
occurred EtiologyNo. of cases
(deaths) Description of outbreak
ChemicalsApril 2007 Massachusetts Sodium hydroxide 145 An estimated 145 persons experienced chemical burns after a sodium
hydroxide overfeed altered the pH balance of water passing through a water treatment facility. The pH imbalance occurred overnight when treatment lines were left on a manual setting after routine maintenance. The event activated an onsite alarm system but the facility did not have an automatic notification system for off-site staff. Detection and remediation of the problem at the water treatment facility occurred early the following morning. The emergency response was a coordinated effort that included the local health department and multiple emergency response agencies. Response measures included a Do Not Use order, community education and outreach, consultation with local healthcare facilities and inspection of food and retail establishments prior to re-opening.
Multiple etiologies
May 2007 Wisconsin Norovirus genogroup I, Campylobacter, Salmonella
229 Gastrointestinal illness in 229 persons was associated with drinking water exposure at a local restaurant; three stool specimens were positive for enteric pathogens: one for norovirus genogroup 1, one for Campylobacter, and one for Salmonella. Well water tested positive for E. coli and a boiled/bottled water advisory was issued. Subsequent tests found norovirus genogroup I in the water that was identical to the strain in clinical specimens. The restaurant and surrounding residences were located in an area with karst geological features. Tracer dye testing implicated a septic tank as a source of contamination. Underground seepage of sewage and contamination through limestone or fissured rock were thought to contribute to the outbreak.
September 2008 Illinois Shigella sonnei, Cryptosporidium, Giardia
41 Of 72 persons who gathered for weekend activities that included a dinner cruise on a lake, 41 developed illness attributed to infections with S. sonnei, Giardia, and Cryptosporidium beginning the following day. Environmental inspection revealed conditions and equipment that could have contributed to lake water contaminating the hose used to load potable water onto the boat. Heavy rainfall and flooding the same weekend resulted in the release of a large volume of storm water containing rainwater and highly diluted sewage into the lake. Ice consumption was epidemiologically linked with illness. S. sonnei was isolated from a surface swab of an ice container.
Unidentified etiology
September 2007 Florida Unidentified 1,663 An estimated 1,663 cases of gastrointestinal illness occurred in a community water system supplied by surface water and conventionally treated with coagulation, settling, filtration, and disinfection. A boil water advisory was issued two days after fecal coliforms and E. coli were initially found in the water during routine testing. A cross-sectional, random telephone survey of households affected by the boil water advisory found statistically significant associations between water consumption and illness. An independent assessment identified numerous operation and maintenance deficiencies in water disinfection and filtration processes, as well as a segment of outdated pipe that bypassed disinfection steps because it was not known to still be connected to the distribution system. The system was recycling filter backwash water as required by EPA; however, before the outbreak, the backwash water bypassed the recovery basin and ozonation before filtration, thereby adversely affecting filter performance.


U.S. Government Printing Office: 2011-723-011/XXXXX Region IV ISSN: 1546-0738
The Morbidity and Mortality Weekly Report (MMWR) Series is prepared by the Centers for Disease Control and Prevention (CDC) and is available free of charge in electronic format. To receive an electronic copy each week, visit MMWR’s free subscription page at http://www.cdc.gov/mmwr/mmwrsubscribe.html. Paper copy subscriptions are available through the Superintendent of Documents, U.S. Government Printing Office, Washington, DC 20402; telephone 202-512-1800.
Address all inquiries about the MMWR Series, including material to be considered for publication, to Editor, MMWR Series, Mailstop E-90, CDC, 1600 Clifton Rd., N.E., Atlanta, GA 30333 or to [email protected].
All material in the MMWR Series is in the public domain and may be used and reprinted without permission; citation as to source, however, is appreciated.
Use of trade names and commercial sources is for identification only and does not imply endorsement by the U.S. Department of Health and Human Services.
References to non-CDC sites on the Internet are provided as a service to MMWR readers and do not constitute or imply endorsement of these organiza-tions or their programs by CDC or the U.S. Department of Health and Human Services. CDC is not responsible for the content of these sites. URL addresses listed in MMWR were current as of the date of publication.
Surveillance Summaries


![Waterborne Disease [FINAL]](https://static.fdocuments.in/doc/165x107/55a6e1d11a28ab9a558b4647/waterborne-disease-final.jpg)