Surveillance for Waterborne-Disease Outbreaks — United States
80
CDC Surveillance Summaries December 11, 1998 / Vol. 47 / No. SS-5 U.S. DEPARTMENT OF HEALTH AND HUMAN SERVICES Centers for Disease Control and Prevention (CDC) Atlanta, Georgia 30333 Surveillance for Waterborne-Disease Outbreaks — United States, 1995–1996 Cardiovascular Disease Risk Factors and Preventive Practices Among Adults — United States, 1994: A Behavioral Risk Factor Atlas TM
Transcript of Surveillance for Waterborne-Disease Outbreaks — United States

CDCSurveillanceSummaries
December 11, 1998 / Vol. 47 / No. SS-5
U.S. DEPARTMENT OF HEALTH AND HUMAN SERVICESCenters for Disease Control and Prevention (CDC)
Atlanta, Georgia 30333
Surveillance for Waterborne-Disease
Outbreaks — United States, 1995–1996
Cardiovascular Disease Risk Factors and
Preventive Practices Among Adults —
United States, 1994:
A Behavioral Risk Factor Atlas
TM

Copies can be purchased from Superintendent of Documents, U.S. Government
Printing Office, Washington, DC 20402-9325. Telephone: (202) 512-1800.
The MMWR series of publications is published by the Epidemiology Program Office,
Centers for Disease Control and Prevention (CDC), U.S. Department of Health and Hu-
man Services, Atlanta, GA 30333.
Centers for Disease Control and Prevention....................Jeffrey P. Koplan, M.D., M.P.H.
Director
The production of this report as an MMWR serial publication was coordinated in
Epidemiology Program Office.................................... Stephen B. Thacker, M.D., M.Sc.
Director
Denise Koo, M.D., M.P.H.
Associate Editor, CDC Surveillance Summaries
Office of Scientific and Health Communications ......................John W. Ward, M.D.
Director
Editor, MMWR Series
CDC Surveillance Summaries ...................................... Suzanne M. Hewitt, M.P.A.
Managing Editor
Patricia A. McGee
Project Editor
Peter M. Jenkins
Visual Information Specialist
SUGGESTED CITATION
General: Centers for Disease Control and Prevention. CDC Surveillance Sum-
maries, December 11, 1998. MMWR 1998;47(No. SS-5).
Specific: [Author(s)]. [Title of particular article]. In CDC Surveillance Sum-
maries, December 11, 1998. MMWR 1998;47(No. SS-5):[inclusive
page numbers].
Use of trade names and commercial sources is for identification only and does not
imply endorsement by the U.S. Department of Health and Human Services.

Contents
Surveillance for Waterborne-Disease Outbreaks —
United States, 1995–1996................................................................................1
Introduction......................................................................................................3
EPA Regulations for Drinking Water .............................................................3
Methods............................................................................................................4
Results ..............................................................................................................6
Discussion ......................................................................................................12
Conclusions....................................................................................................18
References......................................................................................................19
Cardiovascular Disease Risk Factors and Preventive Practices
Among Adults — United States, 1994:
A Behavioral Risk Factor Atlas......................................................................35
Introduction....................................................................................................36
Methods..........................................................................................................38
Results ............................................................................................................41
Discussion ......................................................................................................44
References......................................................................................................46
Vol. 47 / No. SS-5 MMWR i
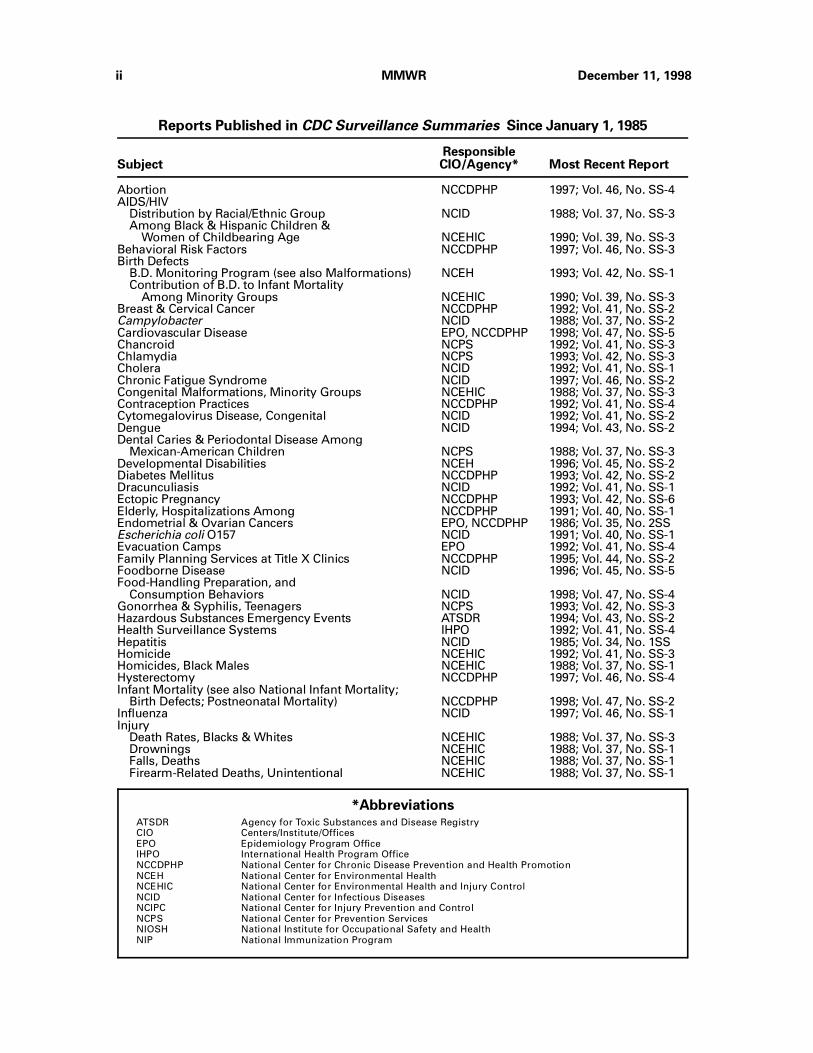
Abortion NCCDPHP 1997; Vol. 46, No. SS-4AIDS/HIV Distribution by Racial/Ethnic Group NCID 1988; Vol. 37, No. SS-3 Among Black & Hispanic Children & Women of Childbearing Age NCEHIC 1990; Vol. 39, No. SS-3Behavioral Risk Factors NCCDPHP 1997; Vol. 46, No. SS-3Birth Defects B.D. Monitoring Program (see also Malformations) NCEH 1993; Vol. 42, No. SS-1 Contribution of B.D. to Infant Mortality Among Minority Groups NCEHIC 1990; Vol. 39, No. SS-3Breast & Cervical Cancer NCCDPHP 1992; Vol. 41, No. SS-2Campylobacter NCID 1988; Vol. 37, No. SS-2Cardiovascular Disease EPO, NCCDPHP 1998; Vol. 47, No. SS-5Chancroid NCPS 1992; Vol. 41, No. SS-3Chlamydia NCPS 1993; Vol. 42, No. SS-3Cholera NCID 1992; Vol. 41, No. SS-1Chronic Fatigue Syndrome NCID 1997; Vol. 46, No. SS-2Congenital Malformations, Minority Groups NCEHIC 1988; Vol. 37, No. SS-3Contraception Practices NCCDPHP 1992; Vol. 41, No. SS-4Cytomegalovirus Disease, Congenital NCID 1992; Vol. 41, No. SS-2Dengue NCID 1994; Vol. 43, No. SS-2Dental Caries & Periodontal Disease Among Mexican-American Children NCPS 1988; Vol. 37, No. SS-3Developmental Disabilities NCEH 1996; Vol. 45, No. SS-2Diabetes Mellitus NCCDPHP 1993; Vol. 42, No. SS-2Dracunculiasis NCID 1992; Vol. 41, No. SS-1Ectopic Pregnancy NCCDPHP 1993; Vol. 42, No. SS-6Elderly, Hospitalizations Among NCCDPHP 1991; Vol. 40, No. SS-1Endometrial & Ovarian Cancers EPO, NCCDPHP 1986; Vol. 35, No. 2SSEscherichia coli O157 NCID 1991; Vol. 40, No. SS-1Evacuation Camps EPO 1992; Vol. 41, No. SS-4Family Planning Services at Title X Clinics NCCDPHP 1995; Vol. 44, No. SS-2Foodborne Disease NCID 1996; Vol. 45, No. SS-5Food-Handling Preparation, and Consumption Behaviors NCID 1998; Vol. 47, No. SS-4Gonorrhea & Syphilis, Teenagers NCPS 1993; Vol. 42, No. SS-3Hazardous Substances Emergency Events ATSDR 1994; Vol. 43, No. SS-2Health Surveillance Systems IHPO 1992; Vol. 41, No. SS-4Hepatitis NCID 1985; Vol. 34, No. 1SSHomicide NCEHIC 1992; Vol. 41, No. SS-3Homicides, Black Males NCEHIC 1988; Vol. 37, No. SS-1Hysterectomy NCCDPHP 1997; Vol. 46, No. SS-4Infant Mortality (see also National Infant Mortality; Birth Defects; Postneonatal Mortality) NCCDPHP 1998; Vol. 47, No. SS-2Influenza NCID 1997; Vol. 46, No. SS-1Injury Death Rates, Blacks & Whites NCEHIC 1988; Vol. 37, No. SS-3 Drownings NCEHIC 1988; Vol. 37, No. SS-1 Falls, Deaths NCEHIC 1988; Vol. 37, No. SS-1 Firearm-Related Deaths, Unintentional NCEHIC 1988; Vol. 37, No. SS-1
*AbbreviationsATSDR Agency for Toxic Substances and Disease RegistryCIO Centers/Institute/OfficesEPO Epidemiology Program OfficeIHPO International Health Program OfficeNCCDPHP National Center for Chronic Disease Prevention and Health PromotionNCEH National Center for Environmental HealthNCEHIC National Center for Environmental Health and Injury ControlNCID National Center for Infectious DiseasesNCIPC National Center for Injury Prevention and ControlNCPS National Center for Prevention ServicesNIOSH National Institute for Occupational Safety and HealthNIP National Immunization Program
Reports Published in CDC Surveillance Summaries Since January 1, 1985
ResponsibleSubject CIO/Agency* Most Recent Report
ii MMWR December 11, 1998
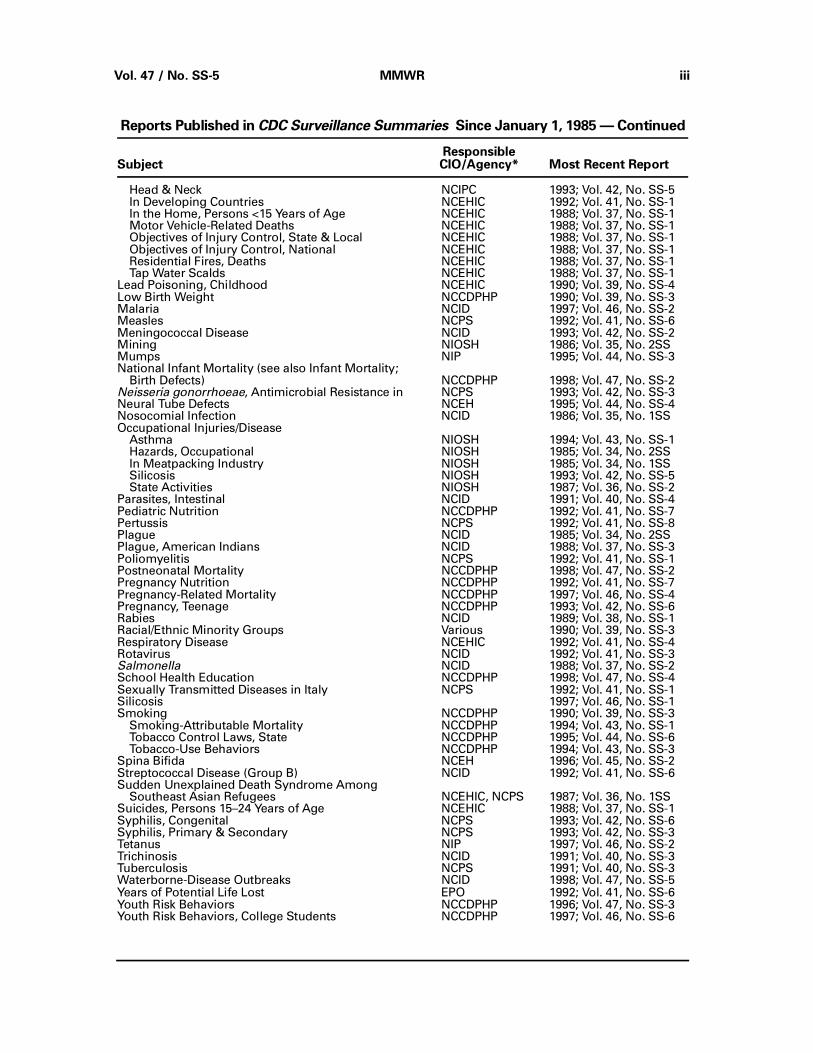
Head & Neck NCIPC 1993; Vol. 42, No. SS-5 In Developing Countries NCEHIC 1992; Vol. 41, No. SS-1 In the Home, Persons <15 Years of Age NCEHIC 1988; Vol. 37, No. SS-1 Motor Vehicle-Related Deaths NCEHIC 1988; Vol. 37, No. SS-1 Objectives of Injury Control, State & Local NCEHIC 1988; Vol. 37, No. SS-1 Objectives of Injury Control, National NCEHIC 1988; Vol. 37, No. SS-1 Residential Fires, Deaths NCEHIC 1988; Vol. 37, No. SS-1 Tap Water Scalds NCEHIC 1988; Vol. 37, No. SS-1Lead Poisoning, Childhood NCEHIC 1990; Vol. 39, No. SS-4Low Birth Weight NCCDPHP 1990; Vol. 39, No. SS-3Malaria NCID 1997; Vol. 46, No. SS-2Measles NCPS 1992; Vol. 41, No. SS-6Meningococcal Disease NCID 1993; Vol. 42, No. SS-2Mining NIOSH 1986; Vol. 35, No. 2SSMumps NIP 1995; Vol. 44, No. SS-3National Infant Mortality (see also Infant Mortality; Birth Defects) NCCDPHP 1998; Vol. 47, No. SS-2Neisseria gonorrhoeae, Antimicrobial Resistance in NCPS 1993; Vol. 42, No. SS-3Neural Tube Defects NCEH 1995; Vol. 44, No. SS-4Nosocomial Infection NCID 1986; Vol. 35, No. 1SSOccupational Injuries/Disease Asthma NIOSH 1994; Vol. 43, No. SS-1 Hazards, Occupational NIOSH 1985; Vol. 34, No. 2SS In Meatpacking Industry NIOSH 1985; Vol. 34, No. 1SS Silicosis NIOSH 1993; Vol. 42, No. SS-5 State Activities NIOSH 1987; Vol. 36, No. SS-2Parasites, Intestinal NCID 1991; Vol. 40, No. SS-4Pediatric Nutrition NCCDPHP 1992; Vol. 41, No. SS-7Pertussis NCPS 1992; Vol. 41, No. SS-8Plague NCID 1985; Vol. 34, No. 2SSPlague, American Indians NCID 1988; Vol. 37, No. SS-3Poliomyelitis NCPS 1992; Vol. 41, No. SS-1Postneonatal Mortality NCCDPHP 1998; Vol. 47, No. SS-2Pregnancy Nutrition NCCDPHP 1992; Vol. 41, No. SS-7Pregnancy-Related Mortality NCCDPHP 1997; Vol. 46, No. SS-4Pregnancy, Teenage NCCDPHP 1993; Vol. 42, No. SS-6Rabies NCID 1989; Vol. 38, No. SS-1Racial/Ethnic Minority Groups Various 1990; Vol. 39, No. SS-3Respiratory Disease NCEHIC 1992; Vol. 41, No. SS-4Rotavirus NCID 1992; Vol. 41, No. SS-3Salmonella NCID 1988; Vol. 37, No. SS-2School Health Education NCCDPHP 1998; Vol. 47, No. SS-4Sexually Transmitted Diseases in Italy NCPS 1992; Vol. 41, No. SS-1Silicosis 1997; Vol. 46, No. SS-1Smoking NCCDPHP 1990; Vol. 39, No. SS-3 Smoking-Attributable Mortality NCCDPHP 1994; Vol. 43, No. SS-1 Tobacco Control Laws, State NCCDPHP 1995; Vol. 44, No. SS-6 Tobacco-Use Behaviors NCCDPHP 1994; Vol. 43, No. SS-3Spina Bifida NCEH 1996; Vol. 45, No. SS-2Streptococcal Disease (Group B) NCID 1992; Vol. 41, No. SS-6Sudden Unexplained Death Syndrome Among Southeast Asian Refugees NCEHIC, NCPS 1987; Vol. 36, No. 1SSSuicides, Persons 15–24 Years of Age NCEHIC 1988; Vol. 37, No. SS-1Syphilis, Congenital NCPS 1993; Vol. 42, No. SS-6Syphilis, Primary & Secondary NCPS 1993; Vol. 42, No. SS-3Tetanus NIP 1997; Vol. 46, No. SS-2Trichinosis NCID 1991; Vol. 40, No. SS-3Tuberculosis NCPS 1991; Vol. 40, No. SS-3Waterborne-Disease Outbreaks NCID 1998; Vol. 47, No. SS-5Years of Potential Life Lost EPO 1992; Vol. 41, No. SS-6Youth Risk Behaviors NCCDPHP 1996; Vol. 47, No. SS-3Youth Risk Behaviors, College Students NCCDPHP 1997; Vol. 46, No. SS-6
Reports Published in CDC Surveillance Summaries Since January 1, 1985 — Continued
ResponsibleSubject CIO/Agency* Most Recent Report
Vol. 47 / No. SS-5 MMWR iii

iv MMWR December 11, 1998

Surveillance for Waterborne-Disease Outbreaks —United States, 1995–1996
Deborah A. Levy, Ph.D., M.P.H.1,2
Michelle S. Bens, M.P.H.2
Gunther F. Craun, M.P.H.3
Rebecca L. Calderon, Ph.D., M.P.H.4
Barbara L. Herwaldt, M.D., M.P.H.2
1Epidemic Intelligence Service, Epidemiology Program Office, CDC
2Division of Parasitic Diseases, National Center for Infectious Diseases, CDC
3Gunther F. Craun & Associates, Staunton, Virginia
4Human Studies Division, National Health and Environmental Effects
Laboratory, U.S. Environmental Protection Agency
Abstract
Problem/Condition: Since 1971, CDC and the U.S. Environmental Protection Agency
have maintained a collaborative surveillance system for collecting and periodically
reporting data that relate to occurrences and causes of waterborne-disease outbreaks
(WBDOs).
Reporting Period Covered: This summary includes data for January 1995 through De-
cember 1996 and previously unreported outbreaks in 1994.
Description of the System: The surveillance system includes data about outbreaks
associated with drinking water and recreational water. State, territorial, and local pub-
lic health departments are primarily responsible for detecting and investigating
WBDOs and for voluntarily reporting them to CDC on a standard form.
Results: For the period 1995–1996, 13 states reported a total of 22 outbreaks associ-
ated with drinking water. These outbreaks caused an estimated total of 2,567 persons
to become ill. No deaths were reported. The microbe or chemical that caused the out-
break was identified for 14 (63.6%) of the 22 outbreaks. Giardia lamblia and Shigella
sonnei each caused two (9.1%) of the 22 outbreaks; Escherichia coli O157:H7, Plesio-
monas shigelloides, and a small round structured virus were implicated for one
outbreak (4.5%) each. One of the two outbreaks of giardiasis involved the largest num-
ber of cases, with an estimated 1,449 ill persons. Seven outbreaks (31.8% of 22) of
chemical poisoning, which involved a total of 90 persons, were reported. Copper and
nitrite were associated with two outbreaks (9.1% of 22) each and sodium hydroxide,
chlorine, and concentrated liquid soap with one outbreak (4.5%) each. Eleven (50.0%)
of the 22 outbreaks were linked to well water, eight in noncommunity and three in
community systems.
Only three of the 10 outbreaks associated with community water systems were
caused by problems at water treatment plants; the other seven resulted from prob-
lems in the water distribution systems and plumbing of individual facilities (e.g., a
restaurant). Six of the seven outbreaks were associated with chemical contamination
of the drinking water; the seventh outbreak was attributed to a small round structured
virus. Four of the seven outbreaks occurred because of backflow or backsiphonage
Vol. 47 / No. SS-5 MMWR 1

through a cross-connection, and two occurred because of high levels of copper that
leached into water after the installation of new plumbing. For three of the four out-
breaks caused by contamination from a cross-connection, an improperly installed
vacuum breaker or a faulty backflow prevention device was identified; no protection
against backsiphonage was found for the fourth outbreak.
Thirty-seven outbreaks from 17 states were attributed to recreational water expo-
sure and affected an estimated 9,129 persons, including 8,449 persons in two large
outbreaks of cryptosporidiosis. Twenty-two (59.5%) of these 37 were outbreaks of gas-
troenteritis; nine (24.3%) were outbreaks of dermatitis; and six (16.2%) were single
cases of primary amebic meningoencephalitis caused by Naegleria fowleri, all of
which were fatal. The etiologic agent was identified for 33 (89.2%) of the 37 outbreaks.
Six (27.3%) of the 22 outbreaks of gastroenteritis were caused by Cryptosporidium
parvum and six (27.3%) by E. coli O157:H7. All of the latter were associated with
unchlorinated water (i.e., in lakes) or inadequately chlorinated water (i.e., in a pool).
Thirteen (59.1%) of these 22 outbreaks were associated with lake water, eight (36.4%)
with swimming or wading pools, and one(4.5%) with a hot spring. Of the nine out-
breaks of dermatitis, seven (77.8%) were outbreaks of Pseudomonas dermatitis
associated with hot tubs, and two (22.2%) were lake-associated outbreaks of swim-
mer’s itch caused by Schistosoma species.
Interpretation: WBDOs caused by E. coli O157:H7 were reported more frequently than
in previous years and were associated primarily with recreational lake water. This find-
ing suggests the need for better monitoring of water quality and identification of
sources of contamination. Although protozoan parasites, especially Cryptosporidium
and Giardia, were associated with fewer reported outbreaks than in previous years,
they caused large outbreaks that affected a total of approximately 10,000 persons; all
of the outbreaks of cryptosporidiosis were associated with recreational water, primar-
ily swimming pools. Prevention of pool-associated outbreaks caused by
chlorine-resistant parasites (e.g., Cryptosporidium and to a lesser extent Giardia) is
particularly difficult because it requires improved filtration methods as well as educa-
tion of patrons about hazards associated with fecal accidents, especially in pools
frequented by diaper-aged children. The proportion of reported drinking water out-
breaks associated with community water systems that were attributed to problems at
water treatment plants has steadily declined since 1989 (i.e., 72.7% for 1989–1990,
62.5% for 1991–1992, 57.1% for 1993–1994, and 30.0% for 1995–1996). This decrease
might reflect improvements in water treatment and in operation of plants. The out-
breaks attributed to contamination in the distribution system suggest that efforts
should be increased to prevent cross-connections, especially by installing and moni-
toring backflow prevention devices.
Actions Taken: Surveillance data that identify the types of water systems, their defi-
ciencies, and the etiologic agents associated with outbreaks are used to evaluate the
adequacy of current technologies for providing safe drinking and recreational water.
In addition, they are used to establish research priorities and can lead to improved
water-quality regulations.
2 MMWR December 11, 1998
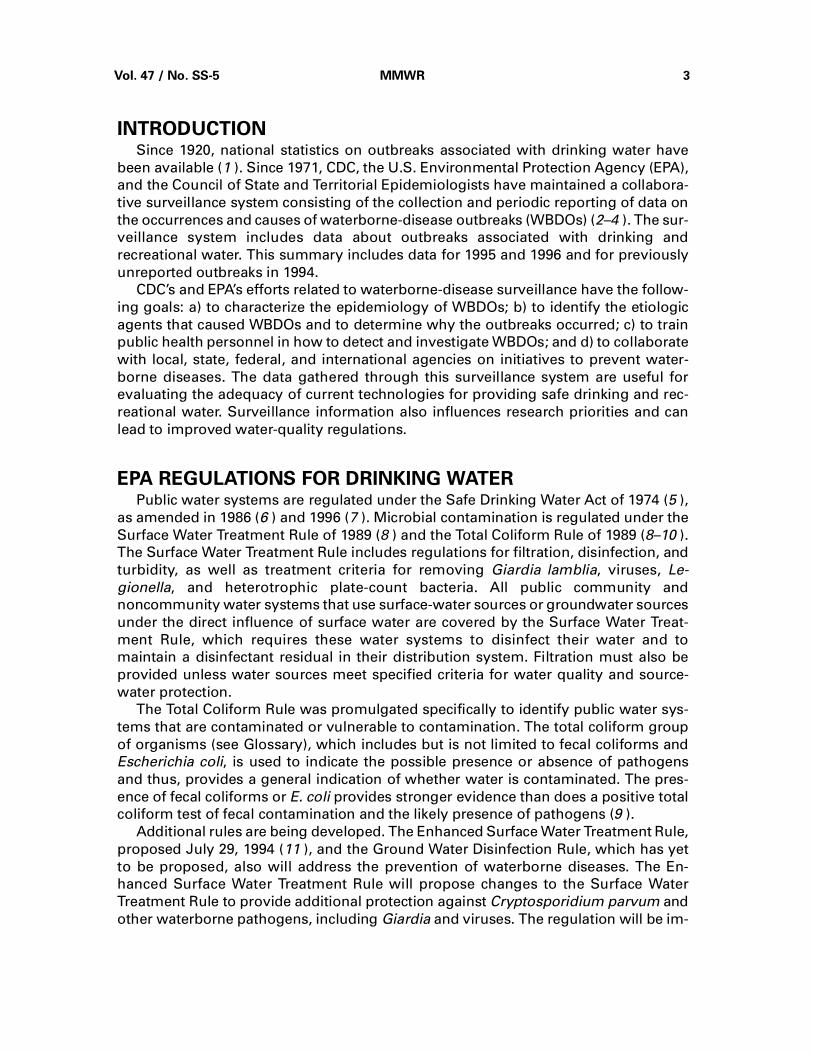
INTRODUCTIONSince 1920, national statistics on outbreaks associated with drinking water have
been available (1 ). Since 1971, CDC, the U.S. Environmental Protection Agency (EPA),
and the Council of State and Territorial Epidemiologists have maintained a collabora-
tive surveillance system consisting of the collection and periodic reporting of data on
the occurrences and causes of waterborne-disease outbreaks (WBDOs) (2–4 ). The sur-
veillance system includes data about outbreaks associated with drinking and
recreational water. This summary includes data for 1995 and 1996 and for previously
unreported outbreaks in 1994.
CDC’s and EPA’s efforts related to waterborne-disease surveillance have the follow-
ing goals: a) to characterize the epidemiology of WBDOs; b) to identify the etiologic
agents that caused WBDOs and to determine why the outbreaks occurred; c) to train
public health personnel in how to detect and investigate WBDOs; and d) to collaborate
with local, state, federal, and international agencies on initiatives to prevent water-
borne diseases. The data gathered through this surveillance system are useful for
evaluating the adequacy of current technologies for providing safe drinking and rec-
reational water. Surveillance information also influences research priorities and can
lead to improved water-quality regulations.
EPA REGULATIONS FOR DRINKING WATERPublic water systems are regulated under the Safe Drinking Water Act of 1974 (5 ),
as amended in 1986 (6 ) and 1996 (7 ). Microbial contamination is regulated under the
Surface Water Treatment Rule of 1989 (8 ) and the Total Coliform Rule of 1989 (8–10 ).
The Surface Water Treatment Rule includes regulations for filtration, disinfection, and
turbidity, as well as treatment criteria for removing Giardia lamblia, viruses, Le-
gionella, and heterotrophic plate-count bacteria. All public community and
noncommunity water systems that use surface-water sources or groundwater sources
under the direct influence of surface water are covered by the Surface Water Treat-
ment Rule, which requires these water systems to disinfect their water and to
maintain a disinfectant residual in their distribution system. Filtration must also be
provided unless water sources meet specified criteria for water quality and source-
water protection.
The Total Coliform Rule was promulgated specifically to identify public water sys-
tems that are contaminated or vulnerable to contamination. The total coliform group
of organisms (see Glossary), which includes but is not limited to fecal coliforms and
Escherichia coli, is used to indicate the possible presence or absence of pathogens
and thus, provides a general indication of whether water is contaminated. The pres-
ence of fecal coliforms or E. coli provides stronger evidence than does a positive total
coliform test of fecal contamination and the likely presence of pathogens (9 ).
Additional rules are being developed. The Enhanced Surface Water Treatment Rule,
proposed July 29, 1994 (11 ), and the Ground Water Disinfection Rule, which has yet
to be proposed, also will address the prevention of waterborne diseases. The En-
hanced Surface Water Treatment Rule will propose changes to the Surface Water
Treatment Rule to provide additional protection against Cryptosporidium parvum and
other waterborne pathogens, including Giardia and viruses. The regulation will be im-
Vol. 47 / No. SS-5 MMWR 3

plemented in two stages: an interim rule and a final rule. Treatment requirements un-
der the interim Enhanced Surface Water Treatment Rule are scheduled to be
announced in late 1998.
The Ground Water Disinfection Rule will apply to both community and noncommu-
nity water systems served by groundwater. Maximum contaminant level goals will be
set for pathogens. A maximum contaminant level goal of zero will be set for viruses
and possibly Legionella. No maximum contaminant level goal is expected for het-
erotrophic plate-count bacteria. In lieu of monitoring for pathogens, performance
criteria for water treatment will be established that are expected to produce the de-
sired reduction in levels of pathogens. Minimum levels of disinfection will be
proposed for viruses and Legionella, if included in the new rule.
To fill gaps in existing data on the occurrence of microbial pathogens and other
indicators of microbial contamination, the EPA promulgated the Information Collec-
tion Rule (12 ). This rule requires treatment plants that use surface water and supply
communities of ≥100,000 persons or that use groundwater systems and supply com-
munities of ≥50,000 persons to monitor their source water for specific microbes and
chemicals beginning in July 1997. If the concentration of microbes or chemicals ex-
ceeds a predetermined threshold, then the utility must also monitor its finished water.
Microbial monitoring is intended a) to provide data on the occurrence of pathogens
and the effectiveness of treatment for the removal of pathogens and b) to evaluate the
adequacy of the Surface Water Treatment Rule and the Total Coliform Rule. The Infor-
mation Collection Rule requires utilities to monitor for the presence of
Cryptosporidium and Giardia, total culturable viruses, and total and fecal coliforms or
E. coli at least once a month for 18 months.
METHODS
Sources of DataState, territorial, and local public health agencies have the primary responsibility
for detecting and investigating WBDOs and voluntarily reporting them to CDC on a
standard form (CDC form 52.12 [4 ]). CDC annually requests reports from state and
territorial epidemiologists or from persons designated as the WBDO surveillance co-
ordinators. When needed, additional information about water quality and treatment is
obtained from the state’s drinking water agency.
Definition of Terms*The unit of analysis for the WBDO surveillance system is an outbreak rather than an
individual case of a particular disease. Two criteria must be met for an event to be
defined as a WBDO. First, two or more persons must have experienced a similar ill-
ness after either ingestion of drinking water or exposure to water used for recreational
purposes. This stipulation that at least two persons be ill is waived for single cases of
laboratory-confirmed primary amebic meningoencephalitis and for single cases of
chemical poisoning if water-quality data indicate contamination by the chemical. Sec-
*Additional terms are defined in the glossary.
4 MMWR December 11, 1998
ond, epidemiologic evidence must implicate water as the probable source of the ill-
ness. Outbreaks caused by contamination of water or ice at the point of use (e.g., a
contaminated water faucet or serving container) are not classified as WBDOs.
If primary cases (among persons exposed to contaminated water) and secondary
cases (among persons who became ill after contact with primary case-patients) are
distinguished on the outbreak report form, only primary cases are included in the total
number of cases. If both actual and estimated case counts are included on the out-
break report form, the estimated case count is used if the study population was
sampled randomly or the estimated count was calculated by using the attack rate.
Public water systems — classified as either community or noncommunity water
systems — provide piped water to the public for general consumption and are regu-
lated under the Safe Drinking Water Act. A community water system serves
year-round residents of a community, subdivision, or mobile-home park that has ≥15
service connections or an average of ≥25 residents. A noncommunity water system is
defined as any public water system that is not a community water system and is used
by the general public for ≥60 days per year and has ≥15 service connections or serves
an average of ≥25 persons. Noncommunity water systems are divided into nontran-
sient and transient categories, with nontransient noncommunity water systems (e.g.,
in factories and schools) serving ≥25 persons ≥6 months of the year. Of the approxi-
mately 170,000 public water systems in the United States, 115,000 (68%) are
noncommunity systems, serving transients (95,000 systems) and nontransients
(20,000); 55,000 (32%) are community systems (EPA Safe Drinking Water Information
System data base, 1998). Community water systems serve approximately 243 million
persons in the United States (91% of the U.S. population); approximately 24 million
persons (9%) rely on private or individual water systems, which are small systems, not
owned or operated by a water utility, that serve <15 connections or <25 persons. In
addition, millions of persons use noncommunity systems while traveling or working.
Each drinking water system associated with a WBDO is classified as having one of
the following deficiencies:
1 = untreated surface water;
2 = untreated groundwater;
3 = treatment deficiency (e.g., temporary interruption of disinfection, chronically in-
adequate disinfection, and inadequate or no filtration);
4 = distribution system deficiency (e.g., cross-connection, contamination of water
mains during construction or repair, and contamination of a storage facility);
and
5 = unknown or miscellaneous deficiency (e.g., contaminated bottled water).
If more than one deficiency is noted on the report form for an outbreak, the deficiency
that most likely caused the outbreak is noted.
Recreational waters include swimming pools, whirlpools, hot tubs, spas, water
parks, and naturally occurring fresh and marine surface waters. Although the surveil-
lance system includes whirlpool- and hot tub-associated outbreaks of dermatitis
caused by Pseudomonas aeruginosa, it does not include wound infections resulting
from waterborne organisms (e.g., Aeromonas species).
Vol. 47 / No. SS-5 MMWR 5
Classification of OutbreaksThis surveillance system classifies WBDOs according to the strength of the evi-
dence implicating water (Table 1). The classification numbers (i.e., I–IV) are based on
the epidemiologic and water-quality data provided on the report form. Epidemiologic
data are weighted more heavily than water-quality data. Thus, although some out-
breaks without water-quality data were included in this summary, reports without
supporting epidemiologic data were excluded. Outbreaks of Pseudomonas dermatitis
and single cases of primary amebic meningoencephalitis or of illness resulting from
chemical poisoning are not classified according to this scheme.
A classification of I means that adequate epidemiologic and water-quality data
were reported but does not necessarily imply that the investigation was optimal. Clas-
sification numbers of II–IV do not necessarily imply that the investigations were
flawed; the circumstances of each outbreak differ, and not all outbreaks can or should
be rigorously investigated.
RESULTS
1995–1996 Outbreaks Associated with Drinking WaterFor the period 1995–1996, 13 states reported a total of 22 outbreaks associated with
drinking water. Sixteen outbreaks were reported for 1995 and six for 1996. Wisconsin
reported five outbreaks (22.7%), followed by Idaho, which reported three (13.6%). The
outbreaks caused an estimated total of 2,567 persons to become ill. The median out-
break size was 22 persons (range: 1–1,449). No deaths were attributed to these
outbreaks. Outbreaks were most common in the summer and fall months (Figure 1).
Seventeen (77.3%) of the 22 outbreaks occurred during June through October.
Twelve (54.5%) of the 22 outbreaks were assigned a classification of I based on
epidemiologic and water-quality data, three (13.6%) Class II, and six (27.3%) Class III;
an individual case of chlorine poisoning was not classified. Outbreaks are listed indi-
vidually by state (Tables 2 and 3) and are tabulated by the etiologic agent and type of
water system (Table 4) and by the type of deficiency and type of water system
(Table 5).
Etiologic Agents
Fifteen (68.2%) of the 22 outbreaks were of infectious or suspected infectious etiol-
ogy, and seven (31.8%) were attributed to chemical poisoning. Two (9.1%) of the
22 outbreaks were caused by the parasite Giardia, four (18.2%) by bacteria, one (4.5%)
by a small round structured virus, and eight (36.4%) were of unknown etiology
(Figure 2).
Parasites. Two outbreaks in 1995 were caused by Giardia, one in Alaska and the
other in New York. The outbreak of giardiasis in Alaska occurred in August, affected 10
persons, and was associated with untreated surface water. The outbreak in New York
occurred in December, affected an estimated 1,449 persons, and was associated with
surface water that was both chlorinated and filtered. A dose-response relation was
found between consumption of municipal water and illness. No interruptions in chlori-
6 MMWR December 11, 1998

nation were identified at the water plant. Postfilter water turbidity readings, which
serve as an index of the effectiveness of filtration, exceeded the regulated limit (i.e.,
95% of water samples must be <0.5 nephelometric turbidity units [NTUs] for conven-
tional and direct filtration) before and during the outbreak.
Bacteria. Four outbreaks were caused by bacteria: two were attributed to Shigella
sonnei, one to E. coli O157:H7, and one to Plesiomonas shigelloides. The outbreak of
shigellosis in Idaho, which affected 83 persons, occurred at a resort supplied by un-
treated well water, which became contaminated by sewage from a line that was
draining poorly (13 ). The outbreak of shigellosis in Oklahoma, which affected 10 per-
sons, was associated with tap water in a convenience store that was supplied by
chlorinated well water. Although the factors contributing to contamination of the
water were not determined, the water was thought to have been inadequately chlorin-
ated.
The outbreak of E. coli O157:H7 infection occurred at a summer camp in Minnesota
that was supplied by chlorinated spring water. Several of the 33 affected persons had
stool cultures that also were positive for Campylobacter jejuni and Salmonella sero-
type London. Water samples from the spring and distribution system were positive for
coliforms and E. coli. The contamination was attributed to flooding from heavy rains
and to an improperly constructed spring.
The outbreak of Plesiomonas shigelloides infection occurred in a restaurant in New
York that was supplied by a noncommunity water system. The outbreak affected
60 persons and is thought to be the largest outbreak of Plesiomonas infection re-
ported in the United States (14 ). Chlorinated spring water that supplied a kitchen tap
in the restaurant had a high coliform count, including E. coli, and the disinfectant re-
sidual was zero. The chlorinator was found to be depleted of disinfectant, and cultures
of water from the river adjacent to the uncovered reservoir where treated water was
stored grew Plesiomonas.
Viruses. One outbreak in 1995 was documented to have been caused by a virus,
specifically a small round structured virus. The outbreak occurred in September at a
high school in Wisconsin and affected 148 persons. The school received its drinking
water from a community water supply. Contamination of the potable water system
likely occurred from backsiphonage of water through hoses submerged in a flooded
football field. However, the source of the virus on the field was not determined.
Chemicals. Seven outbreaks of chemical poisoning were reported, one of which
was an individual case of chlorine poisoning. A person became ill immediately after
drinking water obtained from a Florida restaurant’s drive-through window; symptoms
included a burning sensation in the throat and vomiting. Water samples obtained on
the day of the incident had chlorine levels ranging from 1.2 mg/L to 4.7 mg/L (median:
4.5 mg/L). The source of the excessive levels of chlorine in the drinking water at the
restaurant remained unclear.
In the two outbreaks of nitrite poisoning (i.e., in California and New Jersey), defec-
tive check valves for prevention of backflow allowed chemicals to contaminate
drinking water. In California, three persons at a school became ill after consuming
water from a system that had a double-check backflow prevention valve that did not
Vol. 47 / No. SS-5 MMWR 7
meet the industry standard and that allowed chemicals used to treat a cooling tower
and chilling system for the school’s air conditioning unit to contaminate the drinking
water. Furthermore, the valve had rubber gaskets that were badly deteriorated. In New
Jersey, the drinking water was contaminated with boiler-conditioning fluids through a
faulty backflow check valve. Six persons developed acute onset of cyanosis and were
diagnosed with methemoglobinemia caused by nitrites, which are strong oxidizing
agents (15 ).
Elevated copper levels in tap water in Wisconsin were associated with gastrointes-
tinal illness in at least 37 persons in private homes. The homes in this community had
recently been built or remodeled, and new copper plumbing was thought to have con-
tributed to the contamination of the water.
Thirty persons in Florida developed chemical burns in their mouths after they drank
water contaminated with sodium hydroxide. The water became contaminated when
an operator at the treatment plant unintentionally released the chemical into the
water. The pH of the finished water was 11.8.
Thirteen persons at a health-care facility in Iowa developed burning in their mouths
and flu-like symptoms after drinking water contaminated with a concentrated liquid
soap. A valve on the water supply hose to the soap dispenser had been left open,
allowing the soap to enter the water system. Vacuum breakers to prevent backsiphon-
age were installed incorrectly at the soap dispensers.
Unidentified Etiologic Agent. The etiologic agent was not identified for eight
(36.4%) of the 22 WBDOs associated with drinking water. The illnesses associated with
at least four of these outbreaks had incubation periods, durations, and symptom com-
plexes that were consistent with viral syndromes. For five of the six outbreaks for
which testing was done, including three of the four outbreaks of suspected viral etiol-
ogy, stool specimens were negative for bacterial and parasitic pathogens. One of
these outbreaks (i.e., an outbreak in 1995 at the restaurant of a resort in Wisconsin)
might have been caused by a rotavirus. The state laboratory reported identifying rota-
virus in two of six stool specimens with an enzyme immunoassay. Eight stool
specimens were tested for enteric pathogens and three for enteroviruses. However, no
testing was done for Norwalk-like caliciviruses, which have been more commonly as-
sociated with WBDOs than the rotaviruses have been.
Of the eight outbreaks for which the etiologic agent was not identified, three out-
breaks were associated with untreated well water, three with inadequate chlorination
of unfiltered well water, and one with possible short-term cross-connection and back-
siphonage problems in the distribution system. The other outbreak was associated
with water from an outside tap at a waste-water treatment plant that was not marked
as nonpotable. Even though the water was not intended for drinking, this outbreak
was categorized as a drinking water outbreak for lack of a better category. Hikers ac-
cessed the tap by entering fenced property. The water from the tap was waste water
that had been through a sedimentation process twice but still required additional
treatment; the water had levels of fecal coliforms >23 most probable number/100 mL.
Water-Quality Data
Water-quality data (e.g., information about the presence of coliform bacteria,
pathogens, or chemical contaminants) were available for 20 (90.9%) of the 22 out-
8 MMWR December 11, 1998
breaks. The relevant chemical was found in water samples for all seven outbreaks of
chemical poisoning. Water samples were tested for coliform bacteria during the inves-
tigation of 13 (86.7%) of the 15 outbreaks that had a known or suspected infectious
etiology and were positive for total coliforms or fecal coliforms for 11 (84.6%) of the
13 outbreaks. No information about the presence of coliforms was available for an
outbreak of giardiasis and an outbreak of shigellosis. Coliforms were detected for
three (75.0%) of the four bacterial outbreaks, and all eight outbreaks of unknown etiol-
ogy, including one for which water samples collected 1 month after the outbreak (at a
campground using untreated well water) did not exceed prescribed limits. Coliforms
were not detected for two outbreaks. Giardia-like cysts and Cryptosporidium-like oo-
cysts were found in a filtered, chlorinated water system during the investigation of an
outbreak of giardiasis; but no coliforms were detected in water samples from the dis-
tribution system. During the investigation of an outbreak caused by a small round
structured virus at a school, no coliforms could be detected 4 days after the water,
which was chlorinated and filtered, had been contaminated by backsiphonage.
Water System and Water Source
Ten (45.5%) of the 22 WBDOs were associated with community systems, 10 (45.5%)
with noncommunity systems, and two (9.1%) with individual water systems (Tables
4 and 5; Figure 2). Only three of the 10 outbreaks associated with community water
systems were caused by problems at water treatment plants, and the other seven
were the result of problems in the water distribution systems and plumbing of individ-
ual facilities (e.g., offices, schools, and restaurants). Six of these seven outbreaks were
associated with chemical contamination of the drinking water. Two of the six out-
breaks were attributed to nitrites that contaminated the water when check valves for
prevention of backflow at the facilities malfunctioned; two resulted from copper leach-
ing into the water after plumbing was installed in new homes; one occurred when
concentrated liquid soap contaminated the water because of backsiphonage through
an improperly installed vacuum breaker; and in one outbreak, the source of the exces-
sive levels of chlorine in the drinking water at a restaurant remained unclear. The
seventh outbreak was attributed to a small round structured virus that likely contami-
nated the drinking water when backsiphonage of water through hoses submerged in
a flooded football field occurred. During 1995–1996, outbreaks in noncommunity sys-
tems were more likely than those in community systems to be associated with
untreated water (40.0% versus 0.0%). Eight (80.0%) of the 10 outbreaks in noncommu-
nity systems were associated with well-water sources, as were three (30.0%) of the
10 community outbreaks.
Of the 15 outbreaks with a known or suspected infectious etiology, nine (60.0%)
were associated with well-water sources, three (20.0%) with surface-water sources,
two (13.3%) with spring-water sources, and one (6.7%) with partially treated sewage.
For four (44.4%) of the nine well-water systems, the water was untreated. For another
four (44.4%), the identified deficiency was inadequate chlorination or interrupted dis-
infection (e.g., coliforms, which are chlorine sensitive, were present in tap water). For
one (11.1%), the deficiency occurred in the distribution system. The identified defi-
ciency for both outbreaks associated with spring-water systems was inadequate or
interrupted chlorination. For the outbreaks associated with surface-water systems, the
identified deficiencies were inadequate filtration, backsiphonage, and no treatment.
Vol. 47 / No. SS-5 MMWR 9
1995–1996 Outbreaks Associated with Recreational WaterFor the period 1995–1996, 17 states reported 37 outbreaks associated with recrea-
tional water (Tables 6–8). Twenty-three outbreaks were reported for 1995 and 14 for
1996. The states that reported the most outbreaks were Minnesota (six outbreaks) and
Texas (five outbreaks). The 37 outbreaks caused illness in an estimated 9,129 persons.
The median outbreak size was 10 persons (range: 1–5,449). All but one of the 22 out-
breaks of gastroenteritis occurred during the summer (Figure 1). The six cases of
primary amebic meningoencephalitis, all of which were fatal, occurred in summer and
early fall. Five (55.6%) of the nine outbreaks of dermatitis (i.e., rash or folliculitis),
which all were associated with hot tubs and lakes, occurred during the relatively
colder months of September through February.
Etiologic Agents
Thirty-three (89.2%) of the 37 recreational water outbreaks were of infectious etiol-
ogy (Tables 6–8; Figure 3). Seven (31.8%) of the 22 outbreaks of gastroenteritis were
caused by parasites, 10 (45.5%) by bacteria, one (4.5%) by a virus, and four (18.2%)
were of unknown etiology (Tables 6 and 7).
Parasites. Six (27.3%) of the 22 outbreaks of gastroenteritis were caused by Cryp-
tosporidium and one (4.5%) by Giardia. Six of these seven outbreaks were associated
with swimming pools and water parks. In 1995, a large outbreak of cryptosporidiosis
at a water park in Georgia caused an estimated 5,449 persons to become ill after a
probable fecal accident in the children’s pool. Some stools were positive for both
Cryptosporidium and Giardia. Similarly, in 1996, an estimated 3,000 persons acquired
cryptosporidiosis after visiting a water park in California. Again, a few of the stool
specimens were also positive for Giardia. Park patrons were exposed to untreated
water both at the swimming pool and when water from a jet-ski sprayed an audience
watching a show.
At a swimming pool in Kansas, 24 persons acquired cryptosporidiosis, one of
whom was hospitalized (16 ). Inadequate filtration and possible fecal accidents in the
pool led to an outbreak of cryptosporidiosis associated with a shallow wading pool in
Florida. Twenty-two persons became ill, six of whom were hospitalized. Other condi-
tions that might have contributed to the outbreak included overcrowding of the area
around the pool, an excessive number of swimmers, loss of water clarity, and an
ozonator that was not operational. After heavy rains, runoff that contained cattle feces
and that passed from a pasture into a lake led to an outbreak in Indiana in which three
persons became ill with cryptosporidiosis. One of the stool specimens was also posi-
tive for Giardia cysts. Run-off containing livestock feces might have been responsible
for an outbreak of cryptosporidiosis in Nebraska, which affected 14 persons.
Seventy-seven persons in Florida became ill after visiting a children’s wading pool.
Sixty persons had stool specimens that tested positive for Giardia, 17 had specimens
that tested positive for Cryptosporidium, and eight had specimens that were positive
for both organisms. The wading pool was supplied by municipal well water that was
coagulated, settled, filtered, and disinfected with chlorine.
In 1995, six cases of primary amebic meningoencephalitis were attributed to
Naegleria. All six of the infected children, who ranged in age from 4 to 11 years, died.
10 MMWR December 11, 1998
Infection was acquired when the children swam in a shallow lake, river, pond, or canal.
Five of the six cases were associated with exposure in Texas and one in Florida.
Bacteria. Ten (45.5%) of the 22 outbreaks of gastroenteritis were attributed to bac-
teria, and eight of these outbreaks were associated with lakes. Six outbreaks (27.3%)
were caused by E. coli O157:H7 (17 ), three (13.6%) by Shigella sonnei, and one (4.5%)
by Salmonella serotype Java. At a swimming pool in Georgia, 18 persons became ill
after ingesting water contaminated with E. coli O157:H7. Inadequate chlorination was
thought to have allowed the E. coli to multiply. Thirty-four persons became ill from
five outbreaks of E. coli O157:H7 infection associated with lakes.
All three outbreaks of shigellosis were associated with lakes. In Colorado, a lake
contaminated with human feces caused a total of 120 persons to become ill in two
outbreaks. In Pennsylvania, soiled diapers were found near the implicated lake, and
most of the laboratory-confirmed cases were in children aged <10 years who were
playing in the sand close to the water.
Other. In an outbreak in Idaho in 1996, 55 persons became ill from infection with
Norwalk virus. Lake water tested positive for coliforms, and the outbreak was pre-
sumptively attributed to fecal contamination by swimmers. No agent could be
identified for four (18.2%) of the 22 outbreaks of gastroenteritis; all four of these out-
breaks were associated with lakes.
An estimated 169 persons were affected in nine outbreaks of dermatitis that were
associated with hot tubs or lakes. All nine outbreaks had a known or suspected infec-
tious etiology (Table 8). Pseudomonas aeruginosa was confirmed as the etiologic
agent for four of the seven Pseudomonas outbreaks and was suspected (based on the
clinical syndrome) for the other three. Schistosoma sp. was the presumptive etiologic
agent of the two outbreaks of swimmer’s itch.
Previously Unreported OutbreaksReports of three previously unpublished WBDOs for 1994 also were received (Table
9). In the one outbreak associated with drinking water, well water at a small mobile-
home park in Florida was inadequately treated, and coliforms were detected in
samples of chlorinated water. Two persons were reported to have been ill, one of
whom was hospitalized. The other two outbreaks were associated with recreational
water and affected an estimated 312 persons. The etiologic agent was not identified
for one of these two outbreaks. In the outbreak in Florida, 12 persons had gastroenteri-
tis, two of whom were hospitalized. This outbreak occurred among children and adults
who attended a birthday party at a park and swam in a lake, which was fed by an
artesian well and had a history of high-quality water. During the investigation, sam-
ples of lake water had 80–230 total coliforms/mL and up to 40 fecal coliforms/mL. In a
New Jersey state park, at least 300 cases of shigellosis were reported among bathers
in the swimming area of a reservoir where numerous fecal accidents were reported
and persons were seen rinsing diapers in lake water.
Vol. 47 / No. SS-5 MMWR 11
Outbreaks Not Classified as Waterborne-Disease OutbreaksOutbreaks attributed to drinking water contaminated at its point of use, rather than
at the source or in the distribution system, traditionally are not classified as WBDOs.
Seven point-of-use outbreaks that affected a total of 200 persons were reported, one
from 1991 and six from the 1995–1996 reporting period. Twenty-one persons became
ill with symptoms suggestive of viral gastroenteritis after consuming ice at a picnic in
New York in 1991. In Florida, consumption of water from an outdoor faucet equipped
with a hose by attendees at a day camp resulted in 77 primary cases of crypto-
sporidiosis, as well as 24 probable secondary cases in household members (18 ).
Portable water coolers were filled with water from the hose, which was also used for
rinsing garbage cans. Water samples from the outdoor faucet were positive for total
coliforms and Cryptosporidium, whereas samples collected at other sites at the school
where the camp was held and at the municipal water plant were negative or below
detectable limits for total coliforms, E. coli, and parasites. Feces were observed on
several occasions near the faucet and attached hose; thus, the most likely source of
contamination of the water was the hose nozzle.
Three outbreaks in the 1995–1996 reporting period were thought to be associated
with consumption of contaminated ice. At a church festival in Wisconsin, 27 cases of
E. coli O157:H7-related gastroenteritis were associated with consumption of ice from
plastic water containers that had been filled with water and then frozen. The possible
sources of contamination of the ice included a water faucet, which might have been
contaminated while preparing ground beef, and the plastic water containers, which
might have been contaminated when they were previously used to store the ground
beef. Bagged ice was linked to infection with Campylobacter sp. in seven persons who
became ill at a private home in Ohio. The third ice-related outbreak occurred in New
Jersey and affected 39 persons who became ill with symptomatology suggestive of
viral gastroenteritis after consuming ice that might have been contaminated with hu-
man sewage. In Florida, two persons became ill after consuming iced tea that had
been left in a water cooler overnight. The acid in the tea caused the metal coils in the
water cooler to corrode and release metals into the tea. Seventeen possible WBDOs
that occurred during 1995–1996 were not included in this surveillance summary be-
cause of insufficient epidemiologic data (i.e., the outbreaks did not meet the criteria
for Classes I–IV).
DISCUSSION
General Considerations About Surveillance Data forWaterborne-Disease Outbreaks
The waterborne-disease surveillance data, which identify the types of water sys-
tems, their deficiencies, and the respective etiologic agents associated with the
outbreaks, are useful for evaluating the adequacy of current technologies for provid-
ing safe drinking and recreational water. However, the data in this surveillance
summary are subject to at least one important limitation: they probably do not reflect
the true incidence of WBDOs or the relative incidence of outbreaks caused by various
etiologic agents. Not all WBDOs are recognized, investigated, and reported to CDC or
12 MMWR December 11, 1998
EPA; and the extent to which WBDOs are unrecognized and underreported is un-
known.
The likelihood that individual cases of illness will be detected, epidemiologically
linked, and associated with water varies considerably among locales and is dependent
on factors such as public awareness, the likelihood that multiple ill persons consult the
same rather than different health-care providers, the interest of health-care providers,
availability of laboratory-testing facilities, local requirements for reporting cases of
particular diseases, and surveillance and investigative activities and capacities of state
and local health and environmental agencies. Therefore, the states that report the
most outbreaks might not be those in which the most outbreaks occur. Recognition of
WBDOs also is dependent on certain outbreak characteristics; outbreaks involving se-
rious illness are most likely to receive the attention of health authorities. Outbreaks of
acute diseases, particularly those characterized by a short incubation period, are more
readily identified than those associated with disease from chronic, low-level exposure
to an agent (e.g., a chemical). Outbreaks associated with community water systems
are more likely to be recognized than those associated with noncommunity systems
because the latter serve mostly nonresidential areas and transient populations. Out-
breaks associated with individual systems are the most likely to be underreported
because they generally involve relatively few persons.
The identification of the etiologic agent of a WBDO is dependent on the timely rec-
ognition of the outbreak so that appropriate clinical and environment samples can be
obtained. The interests and expertise of investigators and the routine practices of local
laboratories can also influence whether the etiologic agent is identified. For example,
diarrheal stool specimens generally are examined for bacterial pathogens, but not for
viruses. In most laboratories, testing for Cryptosporidium is done only if requested
and is not included in routine stool examinations for ova and parasites (19 ). The
water-quality data that are collected vary widely among outbreak investigations, de-
pending on such factors as available fiscal, investigative, and laboratory resources.
Furthermore, a few large outbreaks can substantially alter the relative proportion of
cases of waterborne disease attributed to a particular agent. Finally, the number of
reported cases is generally an approximate figure, and the method and accuracy of
the approximation vary among outbreaks.
1995–1996 Outbreaks Associated with Drinking WaterThe number of outbreaks reported for 1995 (i.e., 16) is comparable with those re-
ported for each year during 1987–1994, except for an increase in 1992 (2–4; Figures
4 and 5). However, the number of outbreaks reported for 1996 (i.e., six) is much lower
than for previous years. WBDO reports peaked during 1979–1983. The increase and
subsequent decrease in the number of reports might reflect, at least in part, changes
in surveillance activities (20 ). The decrease in the number of outbreaks reported for
1996 might indicate the beginning of a new trend or simply might reflect a reporting
artifact.
The number of outbreaks attributed to various etiologic agents changed for this
reporting period. The number caused by parasites decreased substantially from the
previous reporting period (i.e., 1993 and 1994), during which 10 reported outbreaks
were caused by parasites (i.e., five outbreaks each attributed to Cryptosporidium and
Vol. 47 / No. SS-5 MMWR 13

Giardia ). For the 1995–1996 reporting period, only two outbreaks were caused by
parasites. However, one of these two outbreaks (i.e., the outbreak of giardiasis in New
York) affected the largest number of persons of any outbreak for this reporting period.
The outbreak of giardiasis in New York was associated with surface water that was
filtered and disinfected with chlorine. Although no interruptions in chlorination at the
water plant were identified, postfilter water turbidity readings, which serve as an in-
dex of the effectiveness of filtration, exceeded the regulated limit before and during
the outbreak. The occurrence of the two outbreaks of giardiasis underscores the im-
portance of requiring water systems to monitor turbidity, to meet turbidity standards,
and to provide an adequate chlorine concentration and contact time (as specified by
the Surface Water Treatment Rule) to inactivate Giardia and other organisms that are
relatively chlorine-resistant, especially if the surface water is unfiltered (21 ). Giardia
can be inactivated by disinfection without filtration, but only if stringent conditions are
consistently maintained. Providing both filtration and chlorination is an example of
using multiple barriers to protect water supplies. The outbreak of giardiasis in New
York reportedly was the first attributed to a filtered municipal water system in that
state and demonstrates that this organism remains a public health risk even in chlori-
nated and filtered water systems if levels of water turbidity are not consistently
maintained (i.e., 95% of water samples must be <0.5 NTUs for conventional and direct
filtration). Optimal filtration requires frequent, if not continuous, monitoring of the tur-
bidity of the water both before filtration (i.e., after coagulation, flocculation, and/or
settling) and after filtration.
No outbreaks in 1995 or 1996 were attributed to Cryptosporidium, a protozoan
parasite that is >50-fold more chlorine-resistant than Giardia. More stringent EPA
standards for acceptable turbidity values have become effective in all states since the
outbreak of cryptosporidiosis in Milwaukee in 1993 (22 ). Many of the large water utili-
ties have joined the Partnership For Safe Water (23 ), which is an American Water
Works Association/EPA activity that helps treatment plants consistently achieve low
water turbidity values, reducing the risk for outbreaks of cryptosporidiosis and giardi-
asis. The number of small utilities that have joined the partnership is unknown.
During 1995–1996, all four outbreaks caused by bacteria were associated with non-
community systems that used either untreated well water or inadequately chlorinated
surface or groundwater. Adequate, continuous disinfection of surface water and
groundwater used for drinking water should reduce the occurrence of WBDOs, par-
ticularly for small systems in which intermittent contamination of wells and springs is
difficult to detect or prevent. In addition, wells and springs should be protected from
sources of contamination such as surface run-off, septic-tank drainage, and sewage
discharges.
Unlike in recent years (i.e., 1991–1994), for which no viral outbreaks were reported,
one reported outbreak in 1995 was documented to have been caused by a virus. Re-
searchers used electron microscopy to identify a small round structured virus in stool
specimens. Methods for detection of enteric viruses have improved greatly in recent
years (24 ). State health departments should be encouraged to submit clinical speci-
mens for viral testing, either at CDC or at state laboratories that have developed the
capability to conduct these tests.
Seven outbreaks of chemical poisoning were reported to CDC for 1995–1996, which
is similar to the number of outbreaks for the 1993–1994 reporting period (i.e., eight).
14 MMWR December 11, 1998
The two outbreaks associated with nitrite poisoning highlight the importance of pre-
venting backflow when potable water systems are connected to boilers and water
chillers; approved backflow prevention devices should be used and periodically moni-
tored for effectiveness. EPA has established a maximum contaminant level of 1.0 mg/L
for nitrites; this regulation applies to public water systems but not individual water
systems. The two outbreaks of copper poisoning underscore the fact that corrosive
water can cause leaching of metals from household plumbing and the water distribu-
tion system. EPA requires monitoring for copper (and lead) at the tap rather than at the
treatment plant, and EPA’s action level for copper is 1.3 mg/mL (25 ). The results of this
monitoring are used to determine whether treatment to control corrosion is needed or
is being applied properly. Occupants of new and older homes in communities that
could have corrosive water might be able to reduce their risk for chemical poisoning
by adequately flushing water through the household system before drinking the
water, especially if the water has stood overnight.
Several reasons could help explain why waterborne chemical poisonings are rarely
reported to CDC: a) most poisonings of this nature (e.g., those associated with the
leaching of copper from plumbing systems) probably occur in private residences, af-
fect relatively few persons and thus, might not come to the attention of public health
officials; b) exposure to chemicals via drinking water can cause illness that is difficult
to attribute to chemical intoxication, or it can cause nonspecific symptoms that are
difficult to link to a specific chemical; and c) the mechanisms for detecting waterborne
chemical poisonings and reporting them to the WBDO surveillance system are not as
well established as they are for WBDOs caused by infectious agents. Future efforts
should be tailored to improve the sensitivity of surveillance activities, the detection of
associations between environmental releases or exposure incidents and individual
health events, and the assessment of the public health burden associated with water-
related chemical exposures.
As in previous reporting periods, except for 1993–1994, a large proportion (8 or
36.4%) of the WBDOs were of unknown etiology (Figures 3 and 4). Seven (87.5%) of
these eight outbreaks were associated with groundwater sources, three (42.9%) of
which involved untreated water; three (42.9%) a treatment deficiency; and one (14.3%)
a deficiency in the distribution system. Of the eight outbreaks for which the etiologic
agent was not identified, most (i.e., seven) were associated with noncommunity or
individual systems; this finding reflects the difficulty of investigating outbreaks affect-
ing the transient populations that use water from these systems.
The relative proportion of outbreaks associated with various types of water sys-
tems has remained fairly constant; the proportions associated with community water
systems were 42.3% for 1989–1990, 23.5% for 1991–1992, 46.7% for 1993–1994, and
45.5% for 1995–1996. However, the proportion of reported outbreaks associated with
community water systems that were attributed to problems at water treatment plants,
and thus affected entire communities, has steadily declined since 1989 (i.e., 72.7% for
1989–1990, 62.5% for 1991–1992, 57.1% for 1993–1994, and 30.0% for 1995–1996). This
decrease might reflect improvements in water-treatment practices and in operation of
plants. For the 1995–1996 reporting period, most outbreaks (i.e., 7 of 10) associated
with community water systems were the result of problems in the distribution system
at individual facilities (e.g., a restaurant). Four of these seven outbreaks were associ-
ated with problems with backflow prevention devices (i.e., they had not been installed
Vol. 47 / No. SS-5 MMWR 15

or had been inappropriately installed or inadequately maintained). Unfortunately,
such problems at individual facilities are not amenable to actions taken by treatment
plants. However, they can be remedied by effective cross-connection control regula-
tions that require inspection and testing. Monitoring, regulating, and standardizing
the practices of the multitudinous individual facilities (e.g., offices, schools, and res-
taurants) in this country is a daunting task.
1995–1996 Outbreaks Associated with Recreational WaterThe most frequently reported WBDOs caused by exposure to recreational water
were outbreaks of gastroenteritis. Swimming and other recreational activities in
which the unintentional ingestion of water can occur are known to increase the risk for
gastrointestinal illness, even in nonoutbreak settings (26,27 ). The number of out-
breaks of gastroenteritis for 1995–1996 (i.e., 22) was greater than reported for previous
years (i.e, 14 each for 1993–1994 and 1991–1992, and 13 for 1989–1990).
Although the number of outbreaks caused by parasites decreased from 10 for the
previous reporting period to seven for this period, two of these seven, both attributed
to Cryptosporidium, accounted for a total of >8,000 ill persons. Each of these recrea-
tional water outbreaks affected more persons than the total number of persons
affected by all of the reported drinking water outbreaks. In both of these outbreaks,
which occurred at water parks, some stool specimens also tested positive for Giardia.
The setting for six of the seven outbreaks was a swimming pool or water park. Inves-
tigators for only one of the six outbreaks reported that the pool water was
inadequately chlorinated.
All six outbreaks of cryptosporidiosis reported for 1995–1996 were associated with
recreational water (i.e., none with drinking water), five of which were associated with
swimming pools. Cryptosporidium, and to a lesser extent Giardia, is resistant to disin-
fection by chlorine at levels generally used in swimming pools. Because
Cryptosporidium oocysts measure only 4–6 µm in diameter, pool filtration systems
that use sand or other granular materials (without the special chemical pretreatment
that is commonly used by the drinking water industry) might not be effective in re-
moving oocysts. Infection can occur after swallowing as few as 10–100 oocysts
(28,29). Therefore, presumably swallowing a single mouthful of contaminated water
could cause illness.
Prevention of recreational water-associated cryptosporidiosis is particularly diffi-
cult. Effective prevention measures require efforts to improve filtration methods and
the design of pools and to educate patrons. The prolonged time required to filter all
the water in a pool, problems in the design of pools that result in areas with poor
water circulation (i.e., “dead spots”), and mixing of water from different pools during
filtration increase the risk for cryptosporidiosis (30 ). Improving filtration systems,
having specific pools designated for children to reduce the risk of contaminating the
entire facility, and having separate filtration systems for the pools for children and
those for adults might reduce risk. However, such changes can be costly, and the de-
gree to which they reduce risk is unknown. Behavioral changes, such as showering
before entering the pool and restricting access of diaper-aged children to certain
pools, will require education of both patrons and facility management because few
facilities currently enforce such measures. Development and enforcement of clear and
16 MMWR December 11, 1998
effective policies regarding fecal accidents in recreational water facilities is needed,
but the effectiveness of various approaches in this regard is unclear and should be
tested. Questions that still need to be addressed include a) how long should a pool be
vacated after a fecal accident? b) is it beneficial to drain a pool after a fecal accident?
and c) what hyperchlorination strategy should be used, especially for Crypto-
sporidium?
The number of reported outbreaks caused by bacteria increased from four during
1993–1994 to 10 during this reporting period. The same number of outbreaks of swim-
ming-associated shigellosis (i.e., three) were reported during 1993–1994 and this
reporting period. The probable source of the pathogen for the three outbreaks during
1995–1996, as for previous outbreaks, was fecal contamination of lake water by swim-
mers. Five of the six outbreaks caused by E. coli O157:H7 also were associated with
lake water, which suggests the need for better monitoring of water quality and identi-
fication of sources of contamination; the sixth was associated with water from a
swimming pool that was inadequately chlorinated. E. coli O157:H7, like Shigella spp.,
apparently has a low infectious dose (31,32 ). Thus, infection can be acquired by swal-
lowing water with low concentrations of these bacteria. In contrast to the outbreaks
caused by parasites, most of which were associated with adequately chlorinated
water, all of the outbreaks attributed to bacteria were associated with unchlorinated
water (i.e., in lakes) or inadequately chlorinated water (i.e., in pools). The outbreaks
associated with swimming pools underline the critical need for maintaining adequate
chlorination (30 ).
EPA has published criteria for evaluating the quality of both marine and fresh water
used for recreation (33,34 ). Microbial monitoring has been recommended for recrea-
tional areas potentially contaminated by sewage. However, the health risk associated
with various levels of fecal coliforms has not been established. Prevention efforts
have focused on providing adequate bathroom facilities, including diaper-changing
areas, at recreational areas and on limiting the number of swimmers per unit area. An
additional important measure, although difficult to enforce, is to prevent persons (es-
pecially young, nontoilet-trained children) from entering recreational water if they are
either experiencing or convalescing from a diarrheal illness.
For the period 1995–1996, most of the reported outbreaks of dermatitis associated
with hot tubs were directly related to inadequate operation and maintenance proce-
dures. Outbreaks of Pseudomonas dermatitis associated with hot tubs are
preventable if water is maintained at a pH of 7.2–7.8 with free, residual chlorine levels
in the range of 2.0–5.0 mg/L (35 ). A person’s susceptibility and immersion time, along
with the number of bathers per unit area, also could influence the risk for infec-
tion (36).
For the period 1995–1996, all six deaths associated with recreational water were
caused by primary amebic meningoencephalitis, a rarely reported disease in the
United States. Naegleria infections are generally acquired during the summer months,
when the temperature of fresh water is favorable for multiplication of the organism
(37,38 ).
Vol. 47 / No. SS-5 MMWR 17

CONCLUSIONSInformation from the nationwide surveillance of WBDOs is used to characterize the
epidemiology of waterborne diseases in the United States. Data about the types of
water systems and deficiencies associated with outbreaks are needed to evaluate the
adequacy of current regulations for water treatment and monitoring of water quality.
The identification of the etiologic agents of outbreaks is particularly critical because
agents newly associated with WBDOs could require new methods of control. Trends
in the incidence of WBDOs caused by various etiologic agents can lead to changes in
policies or resource allotment.
For agents that are recognized as important waterborne pathogens, rapid recogni-
tion and control of WBDOs are facilitated by surveillance at the local and state levels.
Close communication between local health departments and water utilities is crucial.
For example, if epidemiologic evidence suggests the possibility of waterborne trans-
mission, water utilities should be contacted promptly and asked about such factors as
recent treatment deficiencies and changes in source-water quality. Similarly, local
policies should be developed that specify the thresholds for reporting various water-
quality data to health departments. Timely water testing and environmental
investigations can facilitate the identification of an outbreak’s etiologic agent and the
correctable source(s) of water contamination, as well as establish whether control
measures (e.g., boil-water advisories) are indicated.
Means of improving the surveillance system for WBDOs should be explored. The
review of information that has been gathered through other mechanisms (e.g., issu-
ances of boil-water advisories and computerized data on water quality) could facilitate
the detection of WBDOs. Special epidemiologic studies are needed that supplement
the findings of this surveillance system by addressing such issues as the public health
importance of newly identified agents of waterborne disease, the effectiveness of pre-
vention strategies in nonoutbreak settings, and the timeliness with which state and
local health departments act in response to these pathogens.
State health departments can request epidemiologic assistance and laboratory
testing from CDC for the investigation of WBDOs. CDC and EPA can be consulted
about the engineering and environmental aspects of water treatment and about col-
lecting large-volume water samples to identify pathogenic viruses and parasites,
which require special methods for recovery. Requests for testing for viruses should be
addressed to CDC’ s Viral Gastroenteritis Section, Respiratory and Enterovirus Branch,
Division of Viral and Rickettsial Diseases at (404) 639-3577. Requests for testing for
parasites should be addressed to CDC’s Division of Parasitic Diseases at (770) 488-
7760.
Additional information is available from EPA’s Safe Drinking Water Hotline (tele-
phone [800] 426-4791; e-mail [email protected]), CDC’s Cryptosporidiosis
Information Line of the Parasitic Diseases Information Line (voice telephone system
[888] 232-3228, fax [888] 232-3299), and the CDC/National Center for Infectious
Diseases’ home page on the Internet at <http://www.cdc.gov/ncidod/ncid.htm>. Infor-
mation about cryptosporidiosis is available at <http://www.cdc.gov/ncidod/dpd/
list_crp.htm>. WBDOs should be reported to CDC’s Division of Parasitic Diseases (tele-
phone [770] 488-7760), and reports may be faxed to (770) 488-7761.
18 MMWR December 11, 1998

Acknowledgments
The authors thank the state waterborne-disease surveillance coordinators; the state epidemi-ologists; the state drinking water administrators; the Office of Ground Water and Drinking Water,U.S. Environmental Protection Agency; the Division of Bacterial and Mycotic Diseases and theDivision of Viral and Rickettsial Diseases, NCID, CDC; the Division of Environmental Hazards andHealth Effects, NCEH, CDC; and Dennis Juranek, Division of Parasitic Diseases, NCID, CDC, forcontributing to the waterborne-disease surveillance summary.
References1. Craun GF, ed. Waterborne diseases in the United States. Boca Raton, FL: CRC Press, 1986.
2. Kramer MH, Herwaldt BL, Craun GF, Calderon RL, Juranek DD. Surveillance for waterborne-disease outbreaks—United States, 1993–1994. MMWR 1996;45(No. SS-1):1–33.
3. Moore AC, Herwaldt BL, Craun GF, Calderon RL, Highsmith AK, Juranek DD. Surveillance forwaterborne disease outbreaks—United States, 1991–1992. MMWR 1993;42(No. SS-5):1–22.
4. Herwaldt BL, Craun GF, Stokes SL, Juranek DD. Waterborne-disease outbreaks, 1989–1990.MMWR 1991;40(No. SS-3):1–21.
5. US Environmental Protection Agency. 40 CFR Part 141. Water programs: national interim pri-mary drinking water regulations. Federal Register 1975;40:59566–74.
6. Pontius FW, Roberson JA. The current regulatory agenda: an update. Journal of the AmericanWater Works Association 1994;86:54–63.
7. Pontius FW. Implementing the 1996 SDWA amendments. Journal of the American Water WorksAssociation 1997;89:18–36.
8. US Environmental Protection Agency. 40 CFR Parts 141 and 142. Drinking water: nationalprimary drinking water regulations; filtration, disinfection; turbidity, Giardia lamblia, viruses,Legionella, and heterotrophic bacteria; final rule. Federal Register 1989;54:27486–541.
9. US Environmental Protection Agency. 40 CFR Parts 141 and 142. Drinking water: nationalprimary drinking water regulations; total coliforms (including fecal coliforms and E. coli );final rule. Federal Register 1989;54:27544–68.
10. US Environmental Protection Agency. 40 CFR Parts 141 and 142. Drinking water; nationalprimary drinking water regulations: total coliforms; corrections and technical amendments;final rule. Federal Register 1990;55:25064–5.
11. US Environmental Protection Agency. 40 CFR Parts 141 and 142. National primary drinkingwater regulations: enhanced surface water treatment requirements; proposed rule. FederalRegister 1994;59:38832–58.
12. US Environmental Protection Agency. 40 CFR Part 141. National primary drinking water regu-lations: monitoring requirements for public drinking water supplies: Cryptosporidium, Giardia,viruses, disinfection byproducts, water treatment plant data and other information require-ments; proposed rule. Federal Register 1994;59:6332–444.
13. CDC. Shigella sonnei outbreak associated with contaminated drinking water—Island Park,Idaho, August 1995. MMWR 1996;45:229–31.
14. CDC. Plesiomonas shigelloides and Salmonella serotype Hartford infections associated witha contaminated water supply—Livingston County, New York, 1996. MMWR 1998;47:394–6.
15. CDC. Methemoglobinemia attributable to nitrite contamination of potable water through boilerfluid additives—New Jersey, 1992 and 1996. MMWR 1997;46:202–4.
16. Wilberschied L. A swimming-pool-associated outbreak of cryptosporidiosis. Kansas Medicine1995;96:67–8.
17. CDC. Lake-associated outbreak of Escherichia coli O157:H7—Illinois, 1995. MMWR1996;45:437–9.
18. CDC. Outbreak of cryptosporidiosis at a day camp—Florida, July–August 1995. MMWR1996;45:442–4.
19. Boyce TG, Pemberton AG, Addiss DG. Cryptosporidium testing practices among clinical labo-ratories in the United States. Pediatr Infect Dis J 1996;15:87–8.
20. Craun GF, ed. Methods for the investigation and prevention of waterborne disease outbreaks.Cincinnati, OH: US Environmental Protection Agency, Health Effects Research Laboratory,1990; EPA publication no. 600/1-90/005a.
Vol. 47 / No. SS-5 MMWR 19

21. Hoff JC. Inactivation of microbial agents by chemical disinfectants. Cincinnati, OH: US En-vironmental Protection Agency, Drinking Water Research Division, Water EngineeringResearch Laboratory, 1986; EPA publication no. 600/2-86/067.
22. Mac Kenzie WR, Hoxie NJ, Proctor ME, et al. A massive outbreak in Milwaukee of Crypto-sporidium infection transmitted through the public water supply. N Engl J Med 1994;331:161–7.
23. Renner RC, Hegg BA. Self-assessment guide for surface water treatment plant optimization.Denver: American Water Works Association Research Foundation and American Water WorksAssociation, 1997; catalog no. 90736.
24. Ando T, Monroe SS, Gentsch JR, Jin Q, Lewis DC, Glass RI. Detection and differentiation ofantigenically distinct small round-structured viruses (Norwalk-like viruses) by reverse tran-scription-PCR and southern hybridization. J Clin Microbiol 1995;33:64–71.
25. US Environmental Protection Agency. 40 CFR Parts 141 and 142. Drinking water regulations:maximum contaminant level goals and national primary drinking water regulations for leadand copper; final rule. Federal Register 1991;56:26460–4.
26. Calderon RL, Mood EW, Dufour AP. Health effects of swimmers and nonpoint sources of con-taminated water. International Journal of Environmental Health Research 1991;1:21–31.
27. Seyfried PL, Tobin RS, Brown NE, Ness PF. A prospective study of swimming-related illness:I. Swimming-associated health risk. Am J Public Health 1985;75:1068–70.
28. DuPont HL, Chappell CL, Sterling CR, Okhuysen PC, Rose JB, Jakubowski W. The infectivityof Cryptosporidium parvum in healthy volunteers. N Engl J Med 1995;332:855–9.
29. Haas CN, Rose JB. Reconciliation of microbial risk models and outbreak epidemiology: thecase of the Milwaukee outbreak. In Proceedings of the American Water Works Association1994 Annual Conference: Water Quality. Denver: American Water Works Association,1994:517–23.
30. CDC. Swimming pools: safety and disease control through proper design and operation. At-lanta: US Department of Health and Human Services, Public Health Service, CDC, Center forEnvironmental Health, 1976; DHHS publication no. (CDC)88-8319.
31. DuPont HL, Levine MM, Hornick RB, Formal SB. Inoculum size in shigellosis and implicationsfor expected mode of transmission. J Infect Dis 1989;159:1126–8.
32. Griffin PM, Tauxe RV. The epidemiology of infections caused by Escherichia coli O157:H7,other enterohemorrhagic E. coli, and the associated hemolytic uremic syndrome. EpidemiolRev 1991;13:60–98.
33. Dufour AP. Health effects criteria for fresh recreational waters. Research Triangle Park, NC:US Environmental Protection Agency, Office of Research and Development, Health EffectsResearch Laboratory, 1984; EPA publication no. 600/1-84-004.
34. Cabelli VJ. Health effects criteria for marine recreational waters. Research Triangle Park, NC:US Environmental Protection Agency, Office of Research and Development, Health EffectsResearch Laboratory, 1983; EPA publication no. 600/1-80-031.
35. CDC. Suggested health and safety guidelines for public spas and hot tubs. Atlanta: US De-partment of Health and Human Services, Public Health Service, CDC, 1981; DHHS publicationno. 99-960.
36. Highsmith AK, McNamara AM. Microbiology of recreational and therapeutic whirlpools. Tox-icity Assessment 1988;3:599–611.
37. Visvesvara GS, Stehr-Green JK. Epidemiology of free-living ameba infections. J Protozool1990;37(suppl):25S–33S.
38. John DT, Howard MJ. Seasonal distribution of pathogenic free-living amebae in Oklahomawaters. Parasitol Res 1995;81:193–201.
20 MMWR December 11, 1998

Glossary
In this glossary, italicized terms that are not names of microorganisms are defined
elsewhere in the glossary.
Action level: A specified concentration of a contaminant in water; if this concentration
is reached or exceeded, certain actions (e.g., further treatment and monitoring)
must be taken to comply with a drinking water regulation.
Boil-water advisory: A statement to the public advising persons to boil tap water be-
fore drinking it.
Class: Refer to the Classification of Outbreaks section in the text and to Table 1 for a
comprehensive definition.
Coagulation: The process of adding chemicals to water to destabilize charges on natu-
rally occurring particles to facilitate their subsequent aggregation and removal by
flocculation and/or filtration.
Coliforms: All facultative anaerobic, gram-negative, nonsporeforming, rod-shaped
bacteria that ferment lactose with gas and acid formation within 48 hours at 35 C.
Community water system: A public water system that serves year-round residents of
a community, subdivision, or mobile-home park that has ≥15 service connections
or an average of ≥25 residents.
Contact time: The length of time water is exposed to a disinfectant (e.g., chlorine con-
tact time).
Cross-connection: Any actual or potential connection between a drinking water sup-
ply and a possible source of contamination or pollution (e.g., a waste-water line).
Cyst: The infectious stage of Giardia lamblia and some other protozoan parasites that
has a protective wall, which facilitates survival in water and other environments.
Disinfection by-products: Chemicals formed in water through reactions between or-
ganic matter and disinfectants.
Distribution system: Water pipes, storage reservoirs, tanks, and other means used to
deliver drinking water to consumers or to store it before delivery.
Excystation: The release of the internal (i.e., encysted) contents (e.g., trophozoites or
sporozoites) from cysts or oocysts.
Fecal coliforms: Coliforms that grow and produce gas from lactose at 44.5 C in 24
hours.
Filter backwash: The water containing the material obtained by reversing the flow of
water through a filter to dislodge the particles that have been retained on it.
Vol. 47 / No. SS-5 MMWR 21

Filtration: The process of removing suspended particles from water by passing it
through one or more permeable membranes or media of small diameter (e.g.,
sand, anthracite, or diatomaceous earth).
Finished water: The water (i.e., drinking water) delivered to the distribution system
after treatment, if any.
Flocculation: The water treatment process after coagulation that uses gentle stirring
to cause suspended particles to form larger, aggregated masses (floc). The aggre-
gates are removed from the water by a separation process (e.g., sedimentation,
flotation, or filtration ).
Free, residual chlorine level: The concentration of chlorine in water that is not com-
bined with other constituents and thus serves as an effective disinfectant.
Groundwater system: A system that uses water extracted from the ground (i.e., a well
or spring).
Heterotrophic microflora: Microorganisms that use organic material for energy and
growth.
Individual water system: A small water system, not owned or operated by a water
utility, that serves <15 residences or farms that do not have access to a public water
system.
Maximum-contaminant level: The maximum permissible concentration (level) of a
contaminant in water supplied to any user of a public water system.
Nephelometric turbidity units: The units in which the turbidity of a sample of water is
measured when the degree to which light is scattered is assessed with a
nephelometric turbidimeter.
Noncommunity water system: A public water system that a) serves an institution,
industry, camp, park, hotel, or business that is used by the public for ≥60 days per
year; b) has ≥15 service connections or serves an average of ≥25 persons; and c) is
not a community water system.
Oocyst: The infectious stage of Cryptosporidium parvum and some other coccidian
parasites that has a protective wall, which facilitates survival in water and other
environments.
Public water system: A system, classified as either a community or a noncommunity
water system, that provides piped water to the public for human consumption and
is regulated under the Safe Drinking Water Act.
Raw water: Surface water or groundwater that has not been treated in any way.
Reverse osmosis: A filtration process that removes dissolved salts and metallic ions
from water by forcing it through a semipermeable membrane. This process is also
highly effective in removing microbes from water.
22 MMWR December 11, 1998
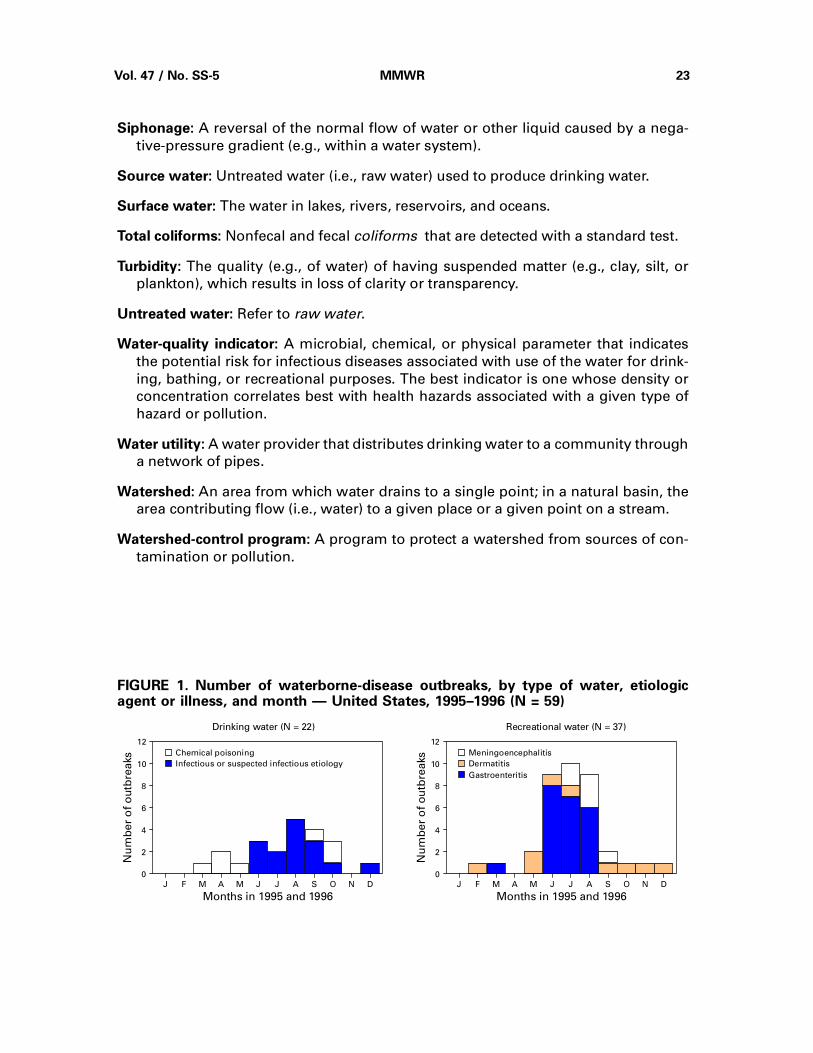
Siphonage: A reversal of the normal flow of water or other liquid caused by a nega-
tive-pressure gradient (e.g., within a water system).
Source water: Untreated water (i.e., raw water) used to produce drinking water.
Surface water: The water in lakes, rivers, reservoirs, and oceans.
Total coliforms: Nonfecal and fecal coliforms that are detected with a standard test.
Turbidity: The quality (e.g., of water) of having suspended matter (e.g., clay, silt, or
plankton), which results in loss of clarity or transparency.
Untreated water: Refer to raw water.
Water-quality indicator: A microbial, chemical, or physical parameter that indicates
the potential risk for infectious diseases associated with use of the water for drink-
ing, bathing, or recreational purposes. The best indicator is one whose density or
concentration correlates best with health hazards associated with a given type of
hazard or pollution.
Water utility: A water provider that distributes drinking water to a community through
a network of pipes.
Watershed: An area from which water drains to a single point; in a natural basin, the
area contributing flow (i.e., water) to a given place or a given point on a stream.
Watershed-control program: A program to protect a watershed from sources of con-
tamination or pollution.
Chemical poisoning
Infectious or suspected infectious etiology
Drinking water (N = 22) Recreational water (N = 37)
Gastroenteritis
Dermatitis
Meningoencephalitis
J F M A M J J A S O N D
0
2
4
6
8
10
12
Months in 1995 and 1996
Nu
mb
er
of
ou
tbre
aks
J F M A M J J A S O N D
0
2
4
6
8
10
12
Months in 1995 and 1996
Nu
mb
er
of
ou
tbre
aks
FIGURE 1. Number of waterborne-disease outbreaks, by type of water, etiologicagent or illness, and month — United States, 1995–1996 (N = 59)
Vol. 47 / No. SS-5 MMWR 23

AAAAAAAAAAAAAAAAAAAAAAAAAAAAAAAAAAAAAAAAAAAAAAAAAAAA
AAAAAAAAAAAAAAAAAAAAAAAAAAAAAAAAAAAAAAAAAAAAAAAAAAAA
AAAAAAAAAAAAAAAAAAAAAAAAAAAAAAAAAAAAAAAAAAAAAAAAAAAA
AAAAAAAAAAAAAAAAAAAAAAAAAAAAAAAAAAAAAAAAAAAAAAAAAAAAAAAA
AAAAAAAAAAAAAAAAAAAAAAAAAAAAAAAAAAAAAAAAAAAAAAAAAAAAAAAA
AAAAAAAAAAAAAAAAAAAAAAAAAAAAAAAAAAAAAAAAAAAAAAAAAAAAAAAA
AAAAAAAAAAAAAAAAAAAAAAAAAAAAAAAAAAAAAAAAAA
AAAAAAAAAAAAAAAAAAAAAAAAAAAAAAAA
AAAAAAAAAAAAAAAAAAAAAAAAAAAAAAAA
AAAAAAAAAAAAAAAAAAAAAAAAAAAAAAAA
AAAAAAAAAAAAAAAA
Unidentified36.4%
Chemical31.8%
Viral4.5%
Parasitic9.1%
Bacterial18.2%
Community45.5%
Individual9.1%
Noncommunity45.5%
AAAAAAAAAAAAAAAAAAAAAAAAAAAAAAAAAAAAAAAAAAAAAAAAAAAAAAAA
AAAAAAAAAAAAAAAAAAAAAAAAAAAAAAAAAAAAAAAAAAAAAAAAAAAAAAAA
AAAAAAAAAAAAAAAAAAAAAAAAAAAAAAAAAAAAAAAAAAAAAAAAAAAAAAAA
AAAAAAAAAAAAAAAAAAAAAAAAAAAAAAAAAAAAAAAAAA
Treatmentdeficiency
36.4%
Distributionsystem31.8%
Untreated groundwater18.2%
Unknown9.1%
Untreatedsurfacewater4.5%
Well50.0%
Other9.1%
Surface water31.8%
Etiologic Agent Water System
DeficiencyWater Source
Spring9.1%
FIGURE 2. Waterborne-disease outbreaks associated with drinking water, by etiologicagent, water system, water source, and deficiency — United States, 1995–1996 (N = 22)
AAAAAAAAAAAAAAAAAAAAAAAAAAAAAAAAAAAAAAAAAAAAAAAAAAAAAAAAAAAAAAAA
AAAAAAAAAAAAAAAAAAAAAAAAAAAAAAAAAAAAAAAAAAAAAAAAAAAAAAAAAAAAAAAA
AAAAAAAAAAAAAAAAAAAAAAAAAAAAAAAAAAAAAAAAAAAAAAAAAAAAAAAAAAAAAAAA
AAAAAAAAAAAAAAAAAAAAAAAAAAAAAAAAAAAAAAAAAAAAAAAA
AAAAAAAAAAAAAAAAAAAA
AAAAAAAAAAAAAAAAAAAA
AAAAAAAAAAAAAAAAAAAA
AAAAAAAAAAAAAAAAAAAA
Escherichiacoli O157:H7
27.3%
Cryptosporidiumparvum27.3%
Shigella sonnei13.6%
AGI*18.2%
Other13.6%
Lake59.1%
Hot spring4.5%
Pool36.4%
Etiologic Agent Type of Exposure
*Acute gastrointestinal illness of unknown etiology.
FIGURE 3. Waterborne-disease outbreaks of gastroenteritis associated withrecreational water, by etiologic agent and type of exposure — United States,1995–1996 (N = 22)
24 MMWR December 11, 1998
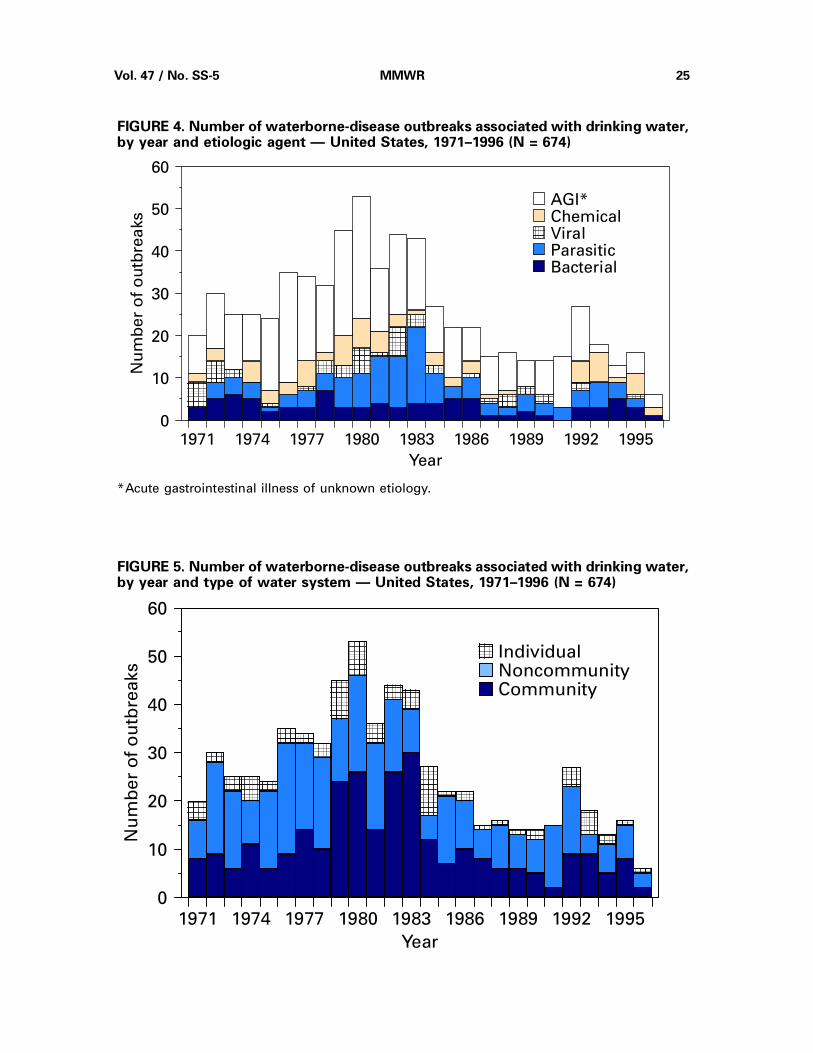
AAAAAAAAAAAA
AGI*ChemicalViralParasiticBacterial
1971 1974 1977 1980 1983 1986 1989 1992 19950
10
20
30
40
50
60
AAAAAAAAAAAAAAAAAAAAAAAAAAAA
AAAAAAAAAAAAAAAA
AAAAA
AAAAAAAAAAAA
AAAAAAAA
AA
AAAAAAAA
AA
AAAAAAAAAAAAAAAA
AAAAAAAAAAAAAAAA
AAAA
AAAAAAAAAAAAAAAAAAAAAAAA
AAAAAAAAAAAAAAAAAAAAAAAAAAAAA
AAAAAAAAAAAAAAAAAAAAAA
AAAAAAAAAAAA
AAA
AAAAAAAA
AA
AAAAAAAA
AAAAAAAAAAAA
AAAAAAAAAAAAAAA
AAA
AAAAAAAAAAAA
AAAAAAAAAAAA
AAAAAAAA
AA
Year
Nu
mb
er
of
ou
tbre
aks
*Acute gastrointestinal illness of unknown etiology.
FIGURE 4. Number of waterborne-disease outbreaks associated with drinking water,by year and etiologic agent — United States, 1971–1996 (N = 674)
1971 1974 1977 1980 1983 1986 1989 1992 1995
0
10
20
30
40
50
60
AAAAAAAAAAAAAAAAAAAA
AAAAAAAAAAAA
AAA
AAAAAAAAAAAA
AAAAAAAAAAAAAAAAAAAA
AAAAA
AAAAAAAA
AAAAAAAAAAAAAAAA
AAAA
AAAAAAAAAAAA
AAAAAAAAAAAAAAAA
AAAA
AAAAAAAAAAAAAAAAAAAAAAAAAAAAAAAA
AAAAAAAAAAAAAAAAAAAAAAAAAAAAAAAA
AAAAAAAA
AAAAAAAAAAAAAAAAAAAA
AAAAAAAAAAAAAAAA
AAAA
AAAAAAAAAAAAAAAA
AAAAAAAAAAAAAAAAAAAAAAAAAAAAAAAAAAAAAAAA
AAAAAAAAAA
AAAAAAAA
AAAAAAAAAAAA
AAA
AAAAAAAAAAAA
AAAAAA
AAAAAAAA
AAAAAAAAAAAA
AAA
AAAAAAAAAAAAAAAAAAAA
AAAAA
AAAAAAAAAAAAAAAAAAAAAAAA
AAAAAA
AAAAAAAAAAAA
AAAAAAAA
AA
AAAAAAAA
Year
Nu
mb
er
of
ou
tbre
aks
AAAAAAAAA
IndividualNoncommunityCommunity
FIGURE 5. Number of waterborne-disease outbreaks associated with drinking water,by year and type of water system — United States, 1971–1996 (N = 674)
Vol. 47 / No. SS-5 MMWR 25

26
MM
WR
Decem
ber 1
1, 1
99
8
TABLE 1. Classification of investigations of waterborne-disease outbreaks — United States*
Class† Epidemiologic data Water-quality data
I ADEQUATE§
a) Data were provided about exposed and unexposedpersons; andb) the relative risk or odds ratio was ≥2, or the p-value was<0.05
PROVIDED AND ADEQUATECould be historical information or laboratory data (e.g., thehistory that a chlorinator malfunctioned or a water mainbroke, no detectable free-chlorine residual, or the presenceof coliforms in the water)
II ADEQUATE NOT PROVIDED OR INADEQUATE(e.g., stating that a lake was crowded)
III PROVIDED, BUT LIMITEDa) Epidemiologic data were provided that did not meet thecriteria for Class I; or b) the claim was made that ill personshad no exposures in common besides water, but no datawere provided.
PROVIDED AND ADEQUATE
IV PROVIDED, BUT LIMITED NOT PROVIDED OR INADEQUATE
*Outbreaks of Pseudomonas dermatitis and single cases of primary amebic meningoencephalitis or of illness resulting from chemicalpoisoning are not classified according to this scheme.
†The classification is based on the epidemiologic and water-quality data that were provided on the form.§ Adequate data were provided to implicate water as the source of the outbreak.
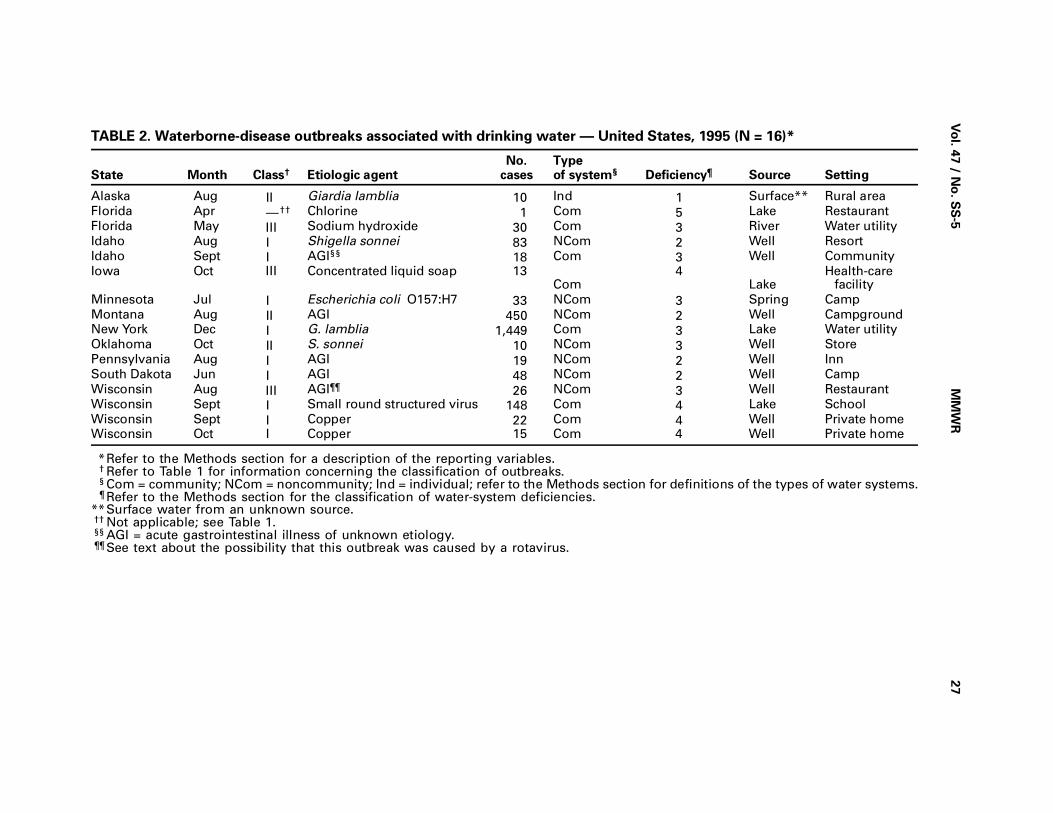
Vo
l. 47 / N
o. S
S-5
MM
WR
27
TABLE 2. Waterborne-disease outbreaks associated with drinking water — United States, 1995 (N = 16)*
State Month Class† Etiologic agentNo.
casesTypeof system§ Deficiency¶ Source Setting
Alaska Aug II Giardia lamblia 10 Ind 1 Surface** Rural area
Florida Apr —†† Chlorine 1 Com 5 Lake Restaurant
Florida May III Sodium hydroxide 30 Com 3 River Water utility
Idaho Aug I Shigella sonnei 83 NCom 2 Well Resort
Idaho Sept I AGI§§ 18 Com 3 Well Community
Iowa Oct III Concentrated liquid soap 13Com
4Lake
Health-carefacility
Minnesota Jul I Escherichia coli O157:H7 33 NCom 3 Spring Camp
Montana Aug II AGI 450 NCom 2 Well Campground
New York Dec I G. lamblia 1,449 Com 3 Lake Water utility
Oklahoma Oct II S. sonnei 10 NCom 3 Well Store
Pennsylvania Aug I AGI 19 NCom 2 Well Inn
South Dakota Jun I AGI 48 NCom 2 Well Camp
Wisconsin Aug III AGI¶¶ 26 NCom 3 Well Restaurant
Wisconsin Sept I Small round structured virus 148 Com 4 Lake School
Wisconsin Sept I Copper 22 Com 4 Well Private home
Wisconsin Oct I Copper 15 Com 4 Well Private home
*Refer to the Methods section for a description of the reporting variables.† Refer to Table 1 for information concerning the classification of outbreaks.§ Com = community; NCom = noncommunity; Ind = individual; refer to the Methods section for definitions of the types of water systems.¶ Refer to the Methods section for the classification of water-system deficiencies.
**Surface water from an unknown source.†† Not applicable; see Table 1.§§ AGI = acute gastrointestinal illness of unknown etiology.¶¶ See text about the possibility that this outbreak was caused by a rotavirus.
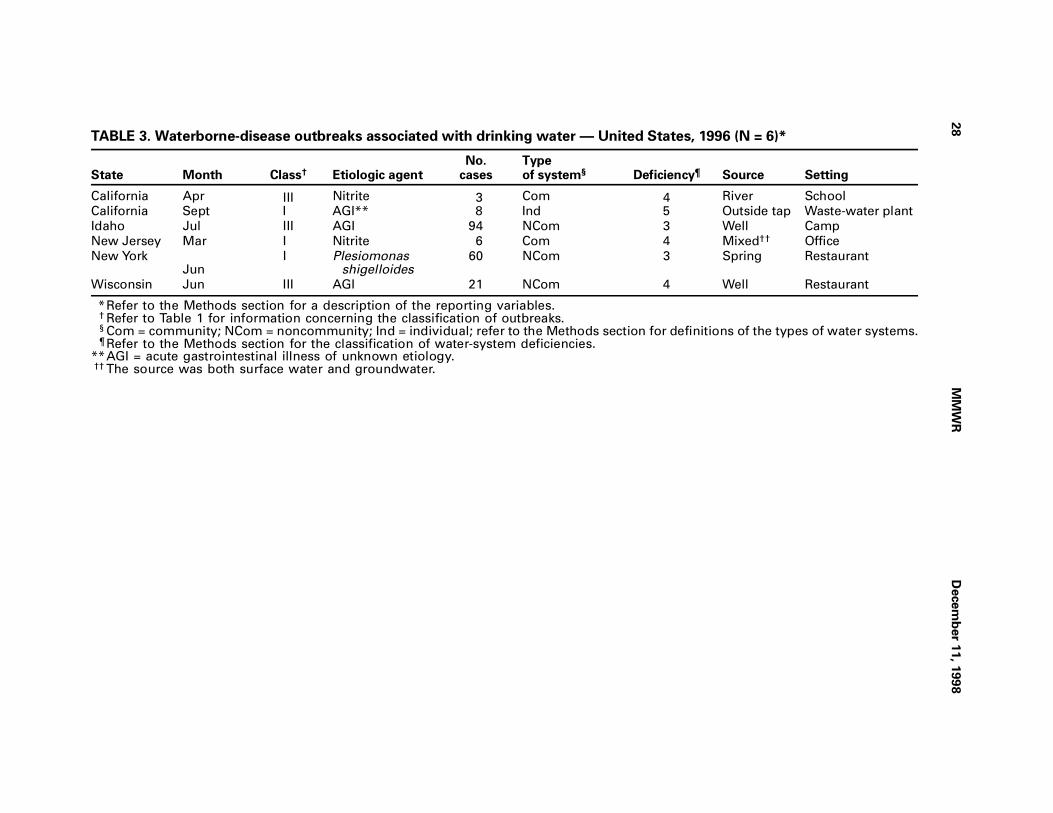
28
MM
WR
Decem
ber 1
1, 1
99
8
TABLE 3. Waterborne-disease outbreaks associated with drinking water — United States, 1996 (N = 6)*
State Month Class† Etiologic agentNo.
casesTypeof system§ Deficiency¶ Source Setting
California Apr III Nitrite 3 Com 4 River School
California Sept I AGI** 8 Ind 5 Outside tap Waste-water plant
Idaho Jul III AGI 94 NCom 3 Well Camp
New Jersey Mar I Nitrite 6 Com 4 Mixed†† Office
New YorkJun
I Plesiomonasshigelloides
60 NCom 3 Spring Restaurant
Wisconsin Jun III AGI 21 NCom 4 Well Restaurant
*Refer to the Methods section for a description of the reporting variables.† Refer to Table 1 for information concerning the classification of outbreaks.§ Com = community; NCom = noncommunity; Ind = individual; refer to the Methods section for definitions of the types of water systems.¶ Refer to the Methods section for the classification of water-system deficiencies.
**AGI = acute gastrointestinal illness of unknown etiology.†† The source was both surface water and groundwater.
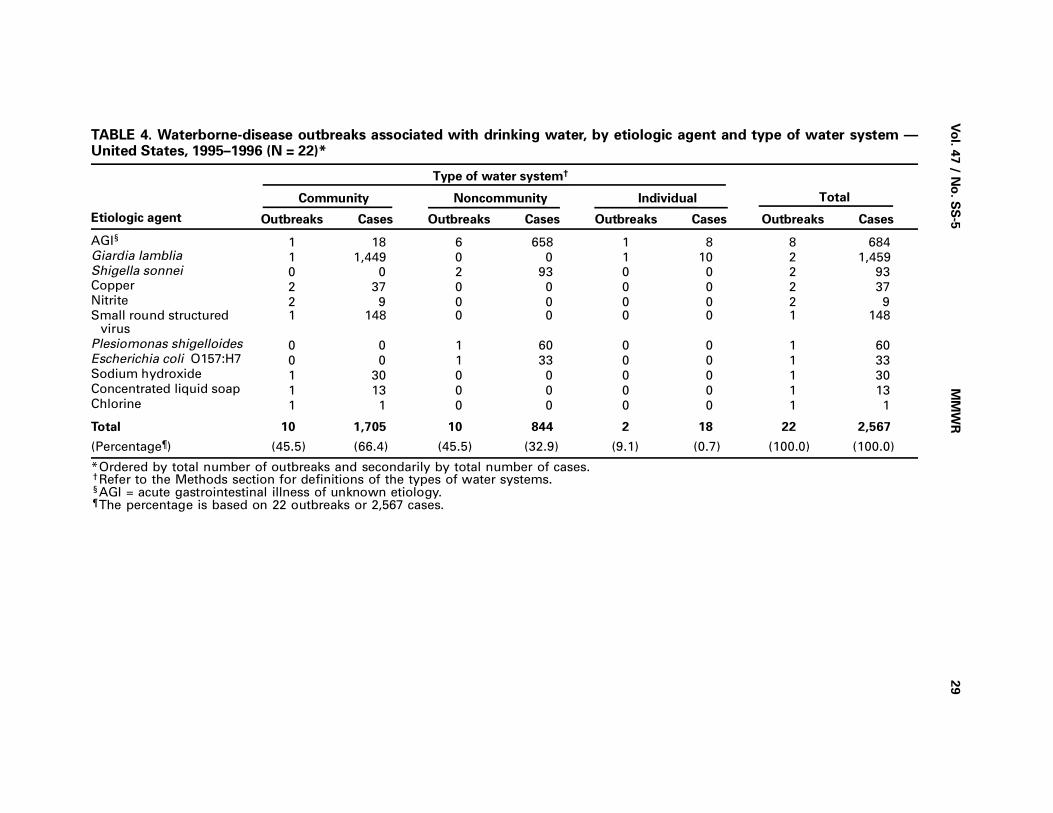
Vo
l. 47 / N
o. S
S-5
MM
WR
29
TABLE 4. Waterborne-disease outbreaks associated with drinking water, by etiologic agent and type of water system —United States, 1995–1996 (N = 22)*
Etiologic agent
Type of water system†
TotalCommunity Noncommunity Individual
Outbreaks Cases Outbreaks Cases Outbreaks Cases Outbreaks Cases
AGI§ 1 18 6 658 1 8 8 684Giardia lamblia 1 1,449 0 0 1 10 2 1,459 Shigella sonnei 0 0 2 93 0 0 2 93Copper 2 37 0 0 0 0 2 37Nitrite 2 9 0 0 0 0 2 9Small round structured
virus1 148 0 0 0 0 1 148
Plesiomonas shigelloides 0 0 1 60 0 0 1 60Escherichia coli O157:H7 0 0 1 33 0 0 1 33Sodium hydroxide 1 30 0 0 0 0 1 30Concentrated liquid soap 1 13 0 0 0 0 1 13Chlorine 1 1 0 0 0 0 1 1
Total 10 1,705 10 844 2 18 22 2,567
(Percentage¶) (45.5) (66.4) (45.5) (32.9) (9.1) (0.7) (100.0) (100.0)
*Ordered by total number of outbreaks and secondarily by total number of cases.†Refer to the Methods section for definitions of the types of water systems.§AGI = acute gastrointestinal illness of unknown etiology.¶The percentage is based on 22 outbreaks or 2,567 cases.

30
MM
WR
Decem
ber 1
1, 1
99
8
TABLE 5. Waterborne-disease outbreaks associated with drinking water, by type of deficiency and type of water system —United States, 1995–1996 (N = 22)
Type of deficiency†
Type of water system*
Total Community Noncommunity Individual
No. (%) No. (%) No. (%) No. (%)
Untreated surface water 0 ( 0) 0 ( 0) 1 ( 50.0) 1 ( 4.5)Untreated groundwater 0 ( 0) 4 ( 40.0) 0 ( 0) 4 ( 18.2)Inadequate treatment 3 ( 30.0) 5 ( 50.0) 0 ( 0) 8 ( 36.4)Distribution system 6 ( 60.0) 1 ( 10.0) 0 ( 0) 7 ( 31.8)Miscellaneous or unknown 1 ( 10.0) 0 ( 0) 1 ( 50.0) 2 ( 9.1)
Total 10 (100.0) 10 (100.0) 2 (100.0) 22 (100.0)
*Refer to the Methods section for definitions of the types of water systems.†Refer to the Methods section for the classification of water-system deficiencies.

Vo
l. 47 / N
o. S
S-5
MM
WR
31
TABLE 6. Waterborne-disease outbreaks of gastroenteritis and meningoencephalitis associated with recreational water —United States, 1995 (N = 17)
State Month Class* Etiologic agent Illness No. cases Source Setting
Florida Aug —† Naegleria fowleri Meningoencephalitis 1 Canal Canal
Georgia Jul I Cryptosporidium parvum Gastroenteritis 5,449 Pool Water park
Idaho Mar I Salmonella serotype Java Gastroenteritis 3 Pool Park
Illinois Jun I Escherichia coli O157:H7 Gastroenteritis 12 Lake Beach
Kansas Jun III C. parvum Gastroenteritis 24 Pool Park
Minnesota Jun II AGI§ Gastroenteritis 12 Lake Beach
Minnesota Jul IV E. coli O157:H7 Gastroenteritis 6 Lake Beach
Minnesota Jul IV E. coli O157:H7 Gastroenteritis 2 Lake Beach
Nebraska Jul IV C. parvum Gastroenteritis 14 Pool Water park
Pennsylvania Aug I AGI Gastroenteritis 17 Lake Park
Pennsylvania Aug III Shigella sonnei Gastroenteritis 70 Lake Beach
Texas Jul — N. fowleri Meningoencephalitis 1 River River
Texas Jul — N. fowleri Meningoencephalitis 1 Pond Pond
Texas Aug — N. fowleri Meningoencephalitis 1 Lake Lake
Texas Aug — N. fowleri Meningoencephalitis 1 Lake Lake
Texas Sept — N. fowleri Meningoencephalitis 1 Lake Lake
Wisconsin Jun III E. coli O157:H7 Gastroenteritis 8 Lake Beach
*Refer to Table 1 for information concerning the classification of outbreaks.†Not applicable; see Table 1.§AGI = acute gastrointestinal illness of unknown etiology.
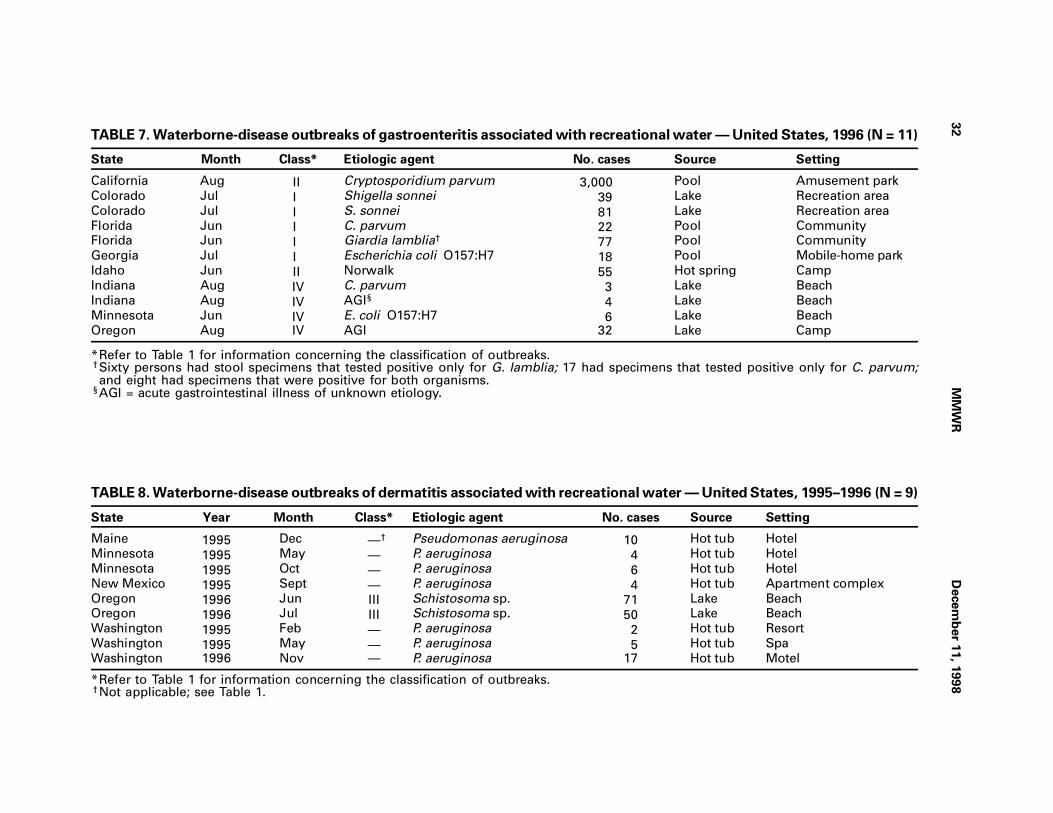
32
MM
WR
Decem
ber 1
1, 1
99
8
TABLE 7. Waterborne-disease outbreaks of gastroenteritis associated with recreational water — United States, 1996 (N = 11)
State Month Class* Etiologic agent No. cases Source Setting
California Aug II Cryptosporidium parvum 3,000 Pool Amusement park
Colorado Jul I Shigella sonnei 39 Lake Recreation area
Colorado Jul I S. sonnei 81 Lake Recreation area
Florida Jun I C. parvum 22 Pool Community
Florida Jun I Giardia lamblia† 77 Pool Community
Georgia Jul I Escherichia coli O157:H7 18 Pool Mobile-home park
Idaho Jun II Norwalk 55 Hot spring Camp
Indiana Aug IV C. parvum 3 Lake Beach
Indiana Aug IV AGI§ 4 Lake Beach
Minnesota Jun IV E. coli O157:H7 6 Lake Beach
Oregon Aug IV AGI 32 Lake Camp
*Refer to Table 1 for information concerning the classification of outbreaks.†Sixty persons had stool specimens that tested positive only for G. lamblia; 17 had specimens that tested positive only for C. parvum;and eight had specimens that were positive for both organisms.
§AGI = acute gastrointestinal illness of unknown etiology.
TABLE 8. Waterborne-disease outbreaks of dermatitis associated with recreational water — United States, 1995–1996 (N = 9)
State Year Month Class* Etiologic agent No. cases Source Setting
Maine 1995 Dec —† Pseudomonas aeruginosa 10 Hot tub Hotel
Minnesota 1995 May — P. aeruginosa 4 Hot tub Hotel
Minnesota 1995 Oct — P. aeruginosa 6 Hot tub Hotel
New Mexico 1995 Sept — P. aeruginosa 4 Hot tub Apartment complex
Oregon 1996 Jun III Schistosoma sp. 71 Lake Beach
Oregon 1996 Jul III Schistosoma sp. 50 Lake Beach
Washington 1995 Feb — P. aeruginosa 2 Hot tub Resort
Washington 1995 May — P. aeruginosa 5 Hot tub Spa
Washington 1996 Nov — P. aeruginosa 17 Hot tub Motel
*Refer to Table 1 for information concerning the classification of outbreaks.†Not applicable; see Table 1.
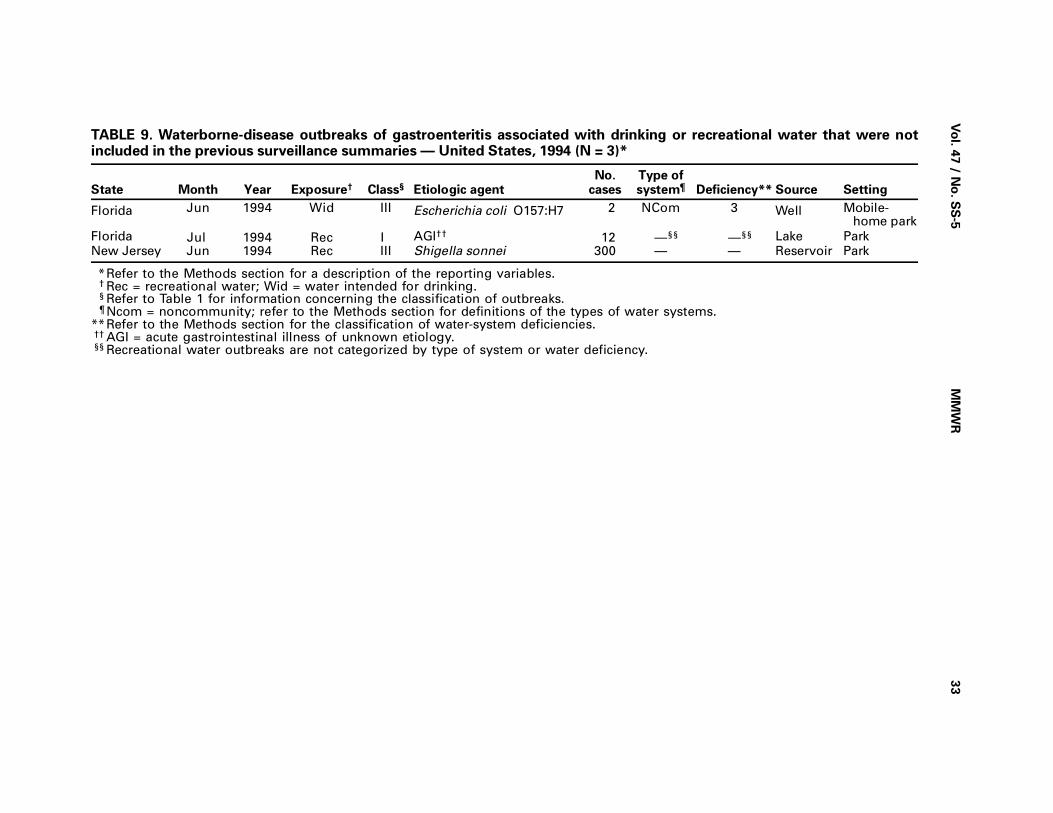
Vo
l. 47 / N
o. S
S-5
MM
WR
33
TABLE 9. Waterborne-disease outbreaks of gastroenteritis associated with drinking or recreational water that were notincluded in the previous surveillance summaries — United States, 1994 (N = 3)*
State Month Year Exposure† Class§ Etiologic agentNo.
casesType ofsystem¶ Deficiency** Source Setting
Florida Jun 1994 Wid III Escherichia coli O157:H7 2 NCom 3 Well Mobile-home park
Florida Jul 1994 Rec I AGI†† 12 —§§ —§§ Lake Park
New Jersey Jun 1994 Rec III Shigella sonnei 300 — — Reservoir Park
*Refer to the Methods section for a description of the reporting variables.† Rec = recreational water; Wid = water intended for drinking.§ Refer to Table 1 for information concerning the classification of outbreaks.¶ Ncom = noncommunity; refer to the Methods section for definitions of the types of water systems.
**Refer to the Methods section for the classification of water-system deficiencies.†† AGI = acute gastrointestinal illness of unknown etiology.§§ Recreational water outbreaks are not categorized by type of system or water deficiency.
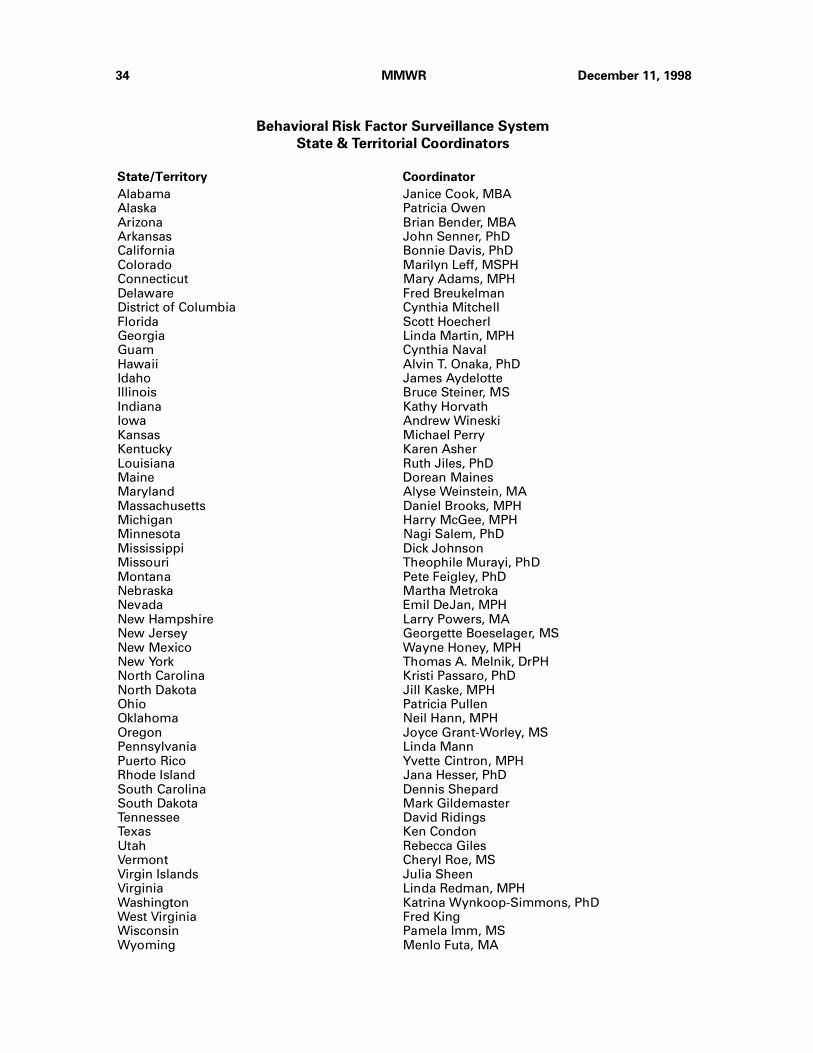
Behavioral Risk Factor Surveillance System
State & Territorial Coordinators
State/Territory Coordinator
Alabama Janice Cook, MBAAlaska Patricia OwenArizona Brian Bender, MBAArkansas John Senner, PhDCalifornia Bonnie Davis, PhDColorado Marilyn Leff, MSPHConnecticut Mary Adams, MPHDelaware Fred BreukelmanDistrict of Columbia Cynthia MitchellFlorida Scott HoecherlGeorgia Linda Martin, MPHGuam Cynthia NavalHawaii Alvin T. Onaka, PhDIdaho James AydelotteIllinois Bruce Steiner, MSIndiana Kathy HorvathIowa Andrew WineskiKansas Michael PerryKentucky Karen AsherLouisiana Ruth Jiles, PhDMaine Dorean MainesMaryland Alyse Weinstein, MAMassachusetts Daniel Brooks, MPHMichigan Harry McGee, MPHMinnesota Nagi Salem, PhDMississippi Dick JohnsonMissouri Theophile Murayi, PhDMontana Pete Feigley, PhDNebraska Martha MetrokaNevada Emil DeJan, MPHNew Hampshire Larry Powers, MANew Jersey Georgette Boeselager, MSNew Mexico Wayne Honey, MPHNew York Thomas A. Melnik, DrPHNorth Carolina Kristi Passaro, PhDNorth Dakota Jill Kaske, MPHOhio Patricia PullenOklahoma Neil Hann, MPHOregon Joyce Grant-Worley, MSPennsylvania Linda MannPuerto Rico Yvette Cintron, MPHRhode Island Jana Hesser, PhDSouth Carolina Dennis ShepardSouth Dakota Mark GildemasterTennessee David RidingsTexas Ken CondonUtah Rebecca GilesVermont Cheryl Roe, MSVirgin Islands Julia SheenVirginia Linda Redman, MPHWashington Katrina Wynkoop-Simmons, PhDWest Virginia Fred KingWisconsin Pamela Imm, MSWyoming Menlo Futa, MA
34 MMWR December 11, 1998
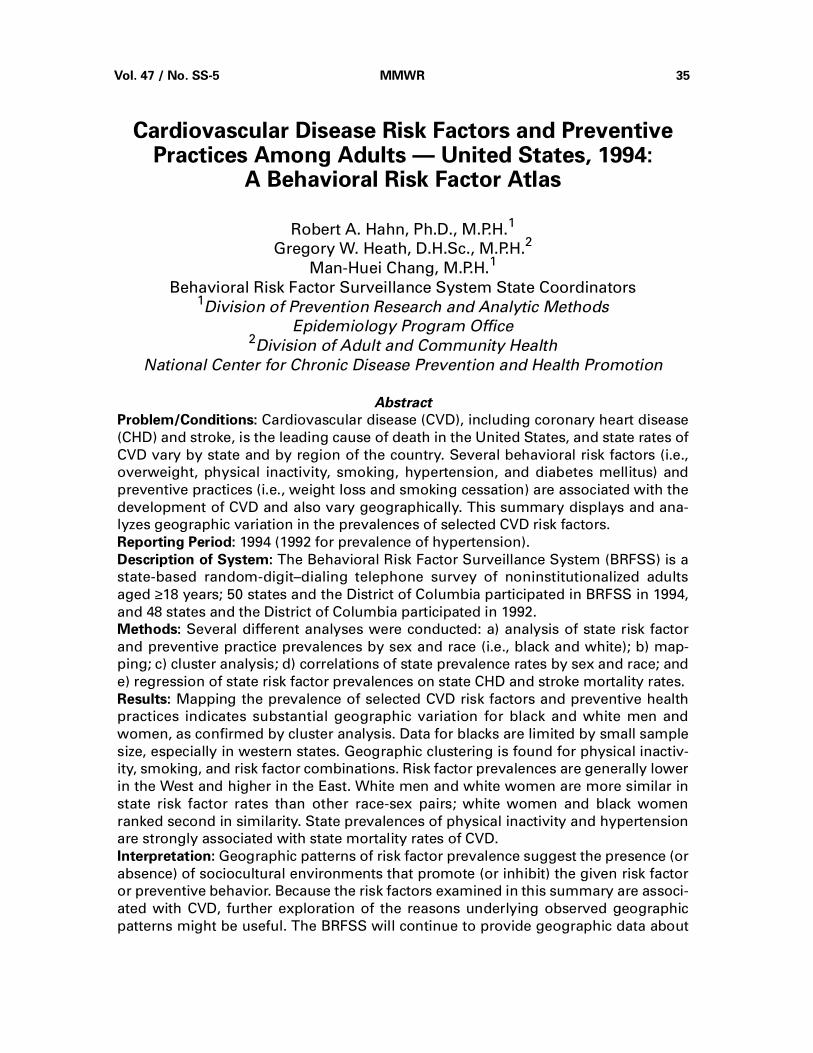
Cardiovascular Disease Risk Factors and PreventivePractices Among Adults — United States, 1994:
A Behavioral Risk Factor Atlas
Robert A. Hahn, Ph.D., M.P.H.1
Gregory W. Heath, D.H.Sc., M.P.H.2
Man-Huei Chang, M.P.H.1
Behavioral Risk Factor Surveillance System State Coordinators1Division of Prevention Research and Analytic Methods
Epidemiology Program Office2Division of Adult and Community Health
National Center for Chronic Disease Prevention and Health Promotion
Abstract
Problem/Conditions: Cardiovascular disease (CVD), including coronary heart disease
(CHD) and stroke, is the leading cause of death in the United States, and state rates of
CVD vary by state and by region of the country. Several behavioral risk factors (i.e.,
overweight, physical inactivity, smoking, hypertension, and diabetes mellitus) and
preventive practices (i.e., weight loss and smoking cessation) are associated with the
development of CVD and also vary geographically. This summary displays and ana-
lyzes geographic variation in the prevalences of selected CVD risk factors.
Reporting Period: 1994 (1992 for prevalence of hypertension).
Description of System: The Behavioral Risk Factor Surveillance System (BRFSS) is a
state-based random-digit–dialing telephone survey of noninstitutionalized adults
aged ≥18 years; 50 states and the District of Columbia participated in BRFSS in 1994,
and 48 states and the District of Columbia participated in 1992.
Methods: Several different analyses were conducted: a) analysis of state risk factor
and preventive practice prevalences by sex and race (i.e., black and white); b) map-
ping; c) cluster analysis; d) correlations of state prevalence rates by sex and race; and
e) regression of state risk factor prevalences on state CHD and stroke mortality rates.
Results: Mapping the prevalence of selected CVD risk factors and preventive health
practices indicates substantial geographic variation for black and white men and
women, as confirmed by cluster analysis. Data for blacks are limited by small sample
size, especially in western states. Geographic clustering is found for physical inactiv-
ity, smoking, and risk factor combinations. Risk factor prevalences are generally lower
in the West and higher in the East. White men and white women are more similar in
state risk factor rates than other race-sex pairs; white women and black women
ranked second in similarity. State prevalences of physical inactivity and hypertension
are strongly associated with state mortality rates of CVD.
Interpretation: Geographic patterns of risk factor prevalence suggest the presence (or
absence) of sociocultural environments that promote (or inhibit) the given risk factor
or preventive behavior. Because the risk factors examined in this summary are associ-
ated with CVD, further exploration of the reasons underlying observed geographic
patterns might be useful. The BRFSS will continue to provide geographic data about
Vol. 47 / No. SS-5 MMWR 35

cardiovascular health behaviors with a possible emphasis on more data-based small-
area analyses and mapping. This will permit states to more adequately monitor trends
that affect the burden of CVD in their regions and the United States. Mapping also
facilitates the exploration of patterns of morbidity, health-care use, and mortality, as
well as the epidemiology of risk factors. Finally, by identifying those segments of the
population with high levels of these risk factors and lower levels of the preventive
health practices, public health personnel can better allocate resources and target in-
tervention efforts for the prevention of CVD.
INTRODUCTIONAlthough age-adjusted cardiovascular mortality declined by 58% from 1950
through 1995 (1 ), cardiovascular disease (CVD), including stroke and coronary heart
disease (CHD), remains a major public health problem in the United States. In 1995,
CVD was the principal diagnosis in 5 million (16.2%) hospital patient discharge records
in the United States (2 ) and was the leading cause of death, accounting for 38.7% of
all deaths in the United States (1 ).
The prevalence, mortality, and health-care use associated with CVD in the United
States vary substantially by geographic region and state (2,3,4 ). In 1994, stroke was
51% more prevalent in the South than in the Northeast, and CHD was 29% more
prevalent in the South than in the West (4 ). In 1994, the ratios of the highest to the
lowest age-adjusted state mortality rates for CHD and stroke in the United States were
4.1 and 4.4, respectively (5 ). Health-care use also varies substantially by region. In
1995, rates of hospital discharge for CVD were between 40% and 69% times greater in
the Northeast, South, and Midwest than in the West (2 ). Geographic variations in CVD
prevalence, mortality, and health-care use might correspond to differences in a)
demographic or risk behavior profiles (e.g., smoking [6 ], physical inactivity [7 ], or risk
factor combinations [8 ] among state residents); b) physical environment (e.g., exces-
sive heat [9 ] and air pollution [10 ]); and c) social environment (e.g., laws taxing
cigarettes or restricting cigarette use) (11,12 ).
This atlas displays distribution of major behavioral risk factors and preventive prac-
tices for CVD among black and white men and women in the 50 states and the District
of Columbia. The atlas presents maps for five risk factors (i.e., overweight, physical
inactivity, smoking, hypertension, and diabetes mellitus), risk factor combinations,
and two preventive practices (i.e., weight loss and smoking cessation). Racial differ-
ences in risk factor prevalence are examined to facilitate exploration of
well-recognized racial differences in health status. Only blacks and whites are exam-
ined in this analysis because of inadequate sample sizes in the data source for other
populations. In this summary, we review the association of known behavioral risk fac-
tors and preventive practices with CVD and specify the criteria used to assess each risk
factor analyzed. We then analyze the geographic clustering of CVD risk factors among
states and examine the association of state risk factor prevalence rates with state rates
of stroke mortality and heart disease mortality. Use of this atlas might facilitate the
exploration of geographic patterns of CVD and of the risk factors as well. The atlas
might also indicate the need for interventions to reduce cardiovascular risk factors in
specific regions and enhance analysis of trends and evaluation of interventions.
36 MMWR December 11, 1998
Risk FactorsCHD risk factors analyzed in this report have been chosen for the reasons discussed
in the following sections.
Overweight
Overweight is associated with high rates of CVD deaths, especially sudden death
among men and congestive heart failure among women (13 ). The high death rate
might occur largely as a consequence of the influence of overweight on blood pres-
sure, blood lipid levels, and the onset of diabetes (13 ); however, a report from the
Framingham Study indicates that overweight is also an independent risk factor for
CVD (14 ). With rare exceptions, overweight develops from eating too much and exer-
cising too little. The prevalence of overweight has increased substantially in the U.S.
population during the last 10 years (15 ).
Physical Inactivity
A review of 43 epidemiologic studies in 1987 indicated that physical activity re-
duces the risk of CHD (16 ). The relative risk for CHD associated with physical inactivity
is approximately 1.9, slightly lower than the relative risks associated with increased
systolic blood pressure (2.1), cigarette smoking (2.5), and elevated serum cholesterol
levels (2.4) (17 ). Several studies indicate that endurance exercise training among pa-
tients with documented CHD is associated with reduced morbidity and mortality
(18,19 ) and that physical activity might improve the likelihood of survival from a myo-
cardial infarction (i.e., heart attack) (20 ). In addition, evidence documents an
association between regular, moderate-intensity physical activity and the lowering of
several other risk factors for CVD, including blood lipid levels, resting blood pressure
among persons with borderline hypertension, body composition and overweight, and
glucose tolerance and insulin sensitivity (21 ).
Smoking
Evidence indicating cigarette smoking as a risk factor for CVD is substantial (12 ).
Overall, smokers have a 70% greater level of CVD risk than nonsmokers; persons who
smoke ≥2 packs of cigarettes per day have a two- to threefold greater risk for CVD
(17 ) . The risk for CVD also increases with greater depth of inhalation and with increas-
ing years of smoking, although persons who stop smoking eventually reduce their risk
for CVD to a level approaching that of nonsmokers (22 ). Cigarette smoking has been
reported to act synergistically with other known risk factors for CVD (23 ).
Hypertension
High blood pressure is another major risk factor for CVD (24 ). Some evidence
documents that blood pressure-related risk for CVD increases continuously from low-
est to highest values for either systolic or diastolic blood pressure (25 ). Elevated
blood pressure is often associated with other well-known risk factors, including die-
tary intake, elevated blood lipid levels, obesity, smoking, diabetes mellitus, and
physical inactivity (24 ). The prevalence of hypertension has declined substantially in
the last 20 years (26 ).
Vol. 47 / No. SS-5 MMWR 37
Diabetes Mellitus
The glucose intolerance that accompanies diabetes mellitus is a direct effect of
overweight and is often associated with hypertriglyceridemia, hypertension, elevated
LDL cholesterol, and depressed HDL (27 ). Some evidence documents that diabetes
mellitus has a vasculotoxic effect, which is greatest for occlusive peripheral vascular
disease; however, CHD and stroke are its most common manifestations (27 ). The risk
for CVD is three times as high among diabetic women as it is among women without
diabetes mellitus. Similarly, the risk for CVD is twice as high among diabetic men as it
is among men without diabetes mellitus (27 ).
Risk Factor Combinations
Many CVD risk factors interact physiologically in the etiology of CVD (28,29 ). Per-
sons with risk factor combinations are at an increased risk for CVD. Obesity is an
example of a risk factor for CHD that influences other risk factors, including hyper-
lipidemia, hypertension, and diabetes mellitus. Physical inactivity has been related to
obesity, lipid abnormalities, hypertension, and diabetes mellitus (21,30 ).
Preventive PracticesSeveral preventices practices have been demonstrated to reduce the risk of CHD.
The preventive practices analyzed in this report have been chosen for the reasons
discussed in the following sections.
Weight Loss
Weight control is a first step in the control of mild hypertension, hyperlipidemia,
and impaired glucose tolerance and might eliminate the necessity of lifelong drug
therapy for these conditions (13 ). Efforts to control weight generally have not been
effective (31 ); however, researchers have demonstrated recently the effectiveness of
combined programs of behavior modification of diet and exercise (31,32 ). Therapeu-
tic approaches to weight control that emphasize increased physical activity have other
benefits in addition to increasing caloric expenditure (16 ).
Smoking Cessation
Persons who stop smoking, especially before age 50 years, live longer than those
who continue to smoke. After 15 years of abstinence from smoking, the risk for CVD
approaches that of persons who have never smoked. Among persons with previously
diagnosed myocardial infarction or stroke, smoking cessation reduces the risk for re-
current heart attack and death from stroke by 50% (22 ).
METHODS
SamplingWe used the Behavioral Risk Factor Surveillance System (BRFSS) data from 1992
and 1994. Data for 1992 were used to assess the prevalence of hypertension because
data on hypertension in many states were not available in 1994. BRFSS data for 1995
38 MMWR December 11, 1998

were not used because they did not include information on physical activity. Arkansas
and Wyoming did not participate in BRFSS in 1992; all 50 states and the District of
Columbia participated in 1994. Using random-digit–dialing telephone survey tech-
niques, participating states select a probability sample of their noninstitutionalized
adult population (aged ≥18 years) with telephones. The Waksberg method (34 ), a mul-
tistage cluster-sampling design, was used in most states (37 states in 1994), whereas
other states have chosen different sampling methods (e.g., simple-random or strati-
fied sample designs) to meet their special needs. The standard BRFSS questionnaire
includes questions from previously conducted national surveys (e.g., Health Promo-
tion Disease Prevention Supplement to the National Health Interview Survey [35 ]).
Modules of questions on additional topics are developed by CDC and added at the
discretion of each state (36 ). BRFSS also contains basic demographic and socioeco-
nomic information (e.g., age, race/ethnicity, family income, and educational
attainment).
Definitions of Risk Factors and Preventive Health Practices
• Overweight: Body mass index (BMI = weight [kg]/height [m2]) ≥27.8 for men
and ≥27.3 for women. These values approximate the sex specific 85th percentile
of BMI that was estimated from NHANES II (1 ) for persons aged 20–29 years in
the United States (Healthy People 2000, objective 2.3 [33 ]).
• Physical Inactivity: No reported exercise, recreation, or physical activities (other
than regular job duties) during the previous month (Healthy People 2000, objec-
tive 1.5).
• Smoking: Current regular use of cigarettes by persons who have ever smoked
at least 100 cigarettes (Healthy People 2000, objective 3.4).
• Hypertension: Survey participants having ever been told by a health profes-
sional that they have high blood pressure (Healthy People 2000, objective 15.5).
• Diabetes Mellitus: Survey participants having ever been told by a physician that
they have diabetes (Healthy People 2000, objective 17.11).
• Risk Factor Combinations: Survey participants having ≥2 of the following risk
factors: overweight, physical inactivity, smoking, and diabetes mellitus. Hyper-
tension is not included because information on this risk factor was not available
in 1994, the year for which risk factor combinations are examined.
• Weight Loss: Survey participants trying to lose or maintain or keep from gain-
ing weight and who are either eating fewer calories or eating less fat or using
physical activity or exercise to maintain, lose, or keep from gaining weight
(Healthy People 2000, objective 2.7).
• Smoking Cessation: Survey participants ever having smoked 100 cigarettes and
having quit smoking for ≥12 months (Healthy People 2000, objective 3.6).
Vol. 47 / No. SS-5 MMWR 39

AnalysisThis summary provides state risk factor prevalences estimated from the survey
participant’s probability of selection in each state, weighted by the distribution of the
state population by age, race, and sex. Prevalence estimates for each risk factor in-
clude only participants who gave specific responses for this risk factor. State risk
factor prevalence rates were not reported if the sample size for a given population
(e.g., black women) was <50. Data were drawn from the BRFSS electronic source by
using Statistical Analyses Software (SAS®) (37 ). Epi-Info (38 ) and Epi-Map (39 ) were
applied to produce maps of the prevalence of risk factors and preventive practices in
the 50 states and the District of Columbia. We do not present age-standardized state
prevalences because we were interested in the burden of risk behavior in states. State
prevalences were stratified into quartiles.
We examined three questions regarding the geographic distribution of risk factors.
First, does a geographic pattern of the distribution of risk factors exist (e.g., higher
rates in one region of the country than in another)? In addition to visual review, we
used the Ohno method (40 ) in CLUSTER Software (41 ) to detect the presence of clus-
tering of state prevalence rates of the risk factors and preventive practices for each
race and sex group. The Ohno method uses a Chi-square test to determine whether
the observed number of bordering states with similar rates is more than expected to
occur by chance under the null hypothesis of no geographic clustering. Similar rates
are defined as rates within the same quartile. We omitted from the cluster analysis
noncontiguous states (i.e., Alaska and Hawaii) and states with unreliable prevalence
rates (i.e., sample sizes <50).
Second, does race, sex, or some combination of these account for greater similarity
in the distribution of state prevalence rates (e.g., are state prevalence rates for black
women closer to those for white women or to those for black men)? For each risk
factor and preventive practice and for all risk factors combined, we correlated state
prevalence rates using Pearson correlation coefficients for each race-sex pair using
the SAS® software. The analysis excluded states without prevalence estimates. We
compared the magnitude of correlation for each race-sex pair among statistically sig-
nificant correlations.
Third, does the distribution of risk factor prevalences among states correspond to
state CVD mortality patterns? For each sex-race group, we conducted linear multiple
regression analyses in which 1994 state mortality rates for all ages were the depend-
ent variables and the independent variables were state behavioral risk factor
prevalences. For heart disease, the International Classification of Diseases, Ninth Re-
vision, Clinical Modification (ICD-9-CM) codes were 390–8, 402, 404–29; for stroke, the
ICD-9-CM codes were 430–8. We used mortality data from CDC’s WONDER data sys-
tem (42 ) and the Shapiro-Wilks statistic in SAS to assess the normality of mortality
rates for regression analyses. Because state risk factor prevalences were not age-ad-
justed, we did not age-adjust mortality rates. We began with a model that included all
of the risk factors and eliminated the risk factor with the highest p value in each suc-
ceeding model, until all p values were <0.05 in the final model. State risk factor
prevalence rates were excluded from this analysis if the sample size for a given popu-
lation was <50.
40 MMWR December 11, 1998
RESULTSBRFSS sample sizes used for state prevalence estimates varied by risk factor. Ex-
cluding states for which race-sex group sample sizes were <50, the study sample
included a maximum of 38,089 white men; 53,205 white women; 3,028 black men; and
5,989 black women.
Because of small sample sizes, 28–29 states among black men and 19–21 states
among black women were excluded from analysis for the five study risk factors. The
states with missing information among blacks varied by risk factor; in general, preva-
lence information was not available for many western and northeastern states. All
states had sufficient sample sizes to calculate reliable prevalence estimates among
whites for all risk factors, except as noted for hypertension, for which information was
not available for Wyoming and Arkansas.
Prevalence of Risk Factor and Preventive Measures
Overweight
Median state prevalences of overweight are higher for blacks than for whites,
higher for white men (28.5%) than for white women (24.9%), and higher for black
women (42.6%) than for black men (37.0%) (Table 1). No clear geographic pattern of
the prevalence of overweight among white men or black men exists (Figure 1a and c).
Among white and black women, the higher prevalence rates are found in the north-
eastern quadrant of the nation (Figure 1b and d). No statistically determined clusters
for this risk factor exist among whites, for whom clusters could be assessed.
Physical Inactivity
Median state prevalences of physical inactivity are higher for blacks than for whites
and higher for women than for men (Table 1). State prevalences of physical inactivity
among white men are generally higher in the East and lower in the West (Figure 2a).
A similar pattern among white women is evident (Figure 2b) and is confirmed by sig-
nificant clustering. Available data for blacks suggest that state prevalences of physical
inactivity are generally higher in the South and lower in the North (Figures 2c and d);
however, patterns are not clear because of insufficient data from several states.
Smoking
Median state prevalences of smoking are similar for blacks and whites but higher
for men than for women (Table 1). Among white men, state prevalences of smoking
are generally higher in the East and lower in the West, as confirmed by significant
clustering (Figure 3a). Among white women, the geographic pattern is similar, but not
as clearly defined as for white men (Figure 3b). Among black men, no clear geographic
pattern exists (Figure 3c). Among black women, prevalences are generally higher in
northern states and lower in southern states (Figure 3d).
Hypertension
Median state prevalences of hypertension are higher for blacks than for whites and
higher for women than for men (Table 1). State prevalences of hypertension among
white men are generally higher in the northeastern quadrant and lower in the West
Vol. 47 / No. SS-5 MMWR 41

(with the exceptions of Nevada and Arizona) (Figure 4a). No clear geographic patterns
exist among white women, black men, or black women (Figure 4b, 4c, and 4d). No
statistically determined clusters exist for this risk factor among whites, for whom clus-
ters could be assessed.
Diabetes Mellitus
Median state prevalences of diabetes mellitus are higher for blacks than for whites,
slightly higher for white men (4.0%) than for white women (3.7%), and slightly higher
for black women (6.8%) than for black men (6.1%) (Table 1). State prevalences of dia-
betes mellitus among white men are generally higher in southern states (Figure 5a).
State prevalences of diabetes mellitus among white women are generally higher in a
band of states from Connecticut, Rhode Island, and Michigan to Texas, and lower in
the West (Figure 5b). No apparent geographic pattern of state prevalences of diabetes
mellitus exists among black men or black women (Figure 5c and d). No statistically
determined clusters for this risk factor exist among whites, for whom clusters could be
assessed.
Risk Factor Combinations
Median state prevalences of risk factor combinations are higher for blacks than for
whites, higher for white men than for white women, and higher for black women than
for black men (Table 1). Among the study sample for 1994, 40.1% have no risk factors,
38.2% have just one, 18.0% have just two, 3.4% have just three, and 0.2% have four
risk factors. State prevalences of risk factor combinations among white men and white
women are generally higher in the East and lower in the West; geographic patterns for
both white men and white women are confirmed by significant clustering (Figure 6a
and b). No clear geographic pattern of the state prevalences of risk factor combina-
tions exists among black men and black women (Figure 6c and d).
Weight Loss
Median state prevalences of weight-loss practices are higher for whites than for
blacks and higher for women than for men (Table 1). Prevalence rates are generally
higher in the West for white men and white women (Figure 7a and b). No apparent
geographic pattern of state prevalences of weight-loss practices exists among black
men and women (Figure 7c and d). No statistically determined clusters for this risk
factor exist among whites, for whom clusters could be assessed.
Smoking Cessation
Median state prevalences of smoking cessation are higher for whites than for
blacks and higher for men than for women (Table 1). No apparent geographic pattern
of state prevalences of smoking cessation exists among white men (Figure 8a).
Among white women, state prevalences of smoking cessation are highest in coastal
and border states (Figure 8b). No apparent geographic pattern of state prevalences of
smoking cessation exists among black men and women (Figure 8c and d). No statisti-
cally determined clusters exist for this preventive practice among whites, for whom
clusters could be assessed.
42 MMWR December 11, 1998
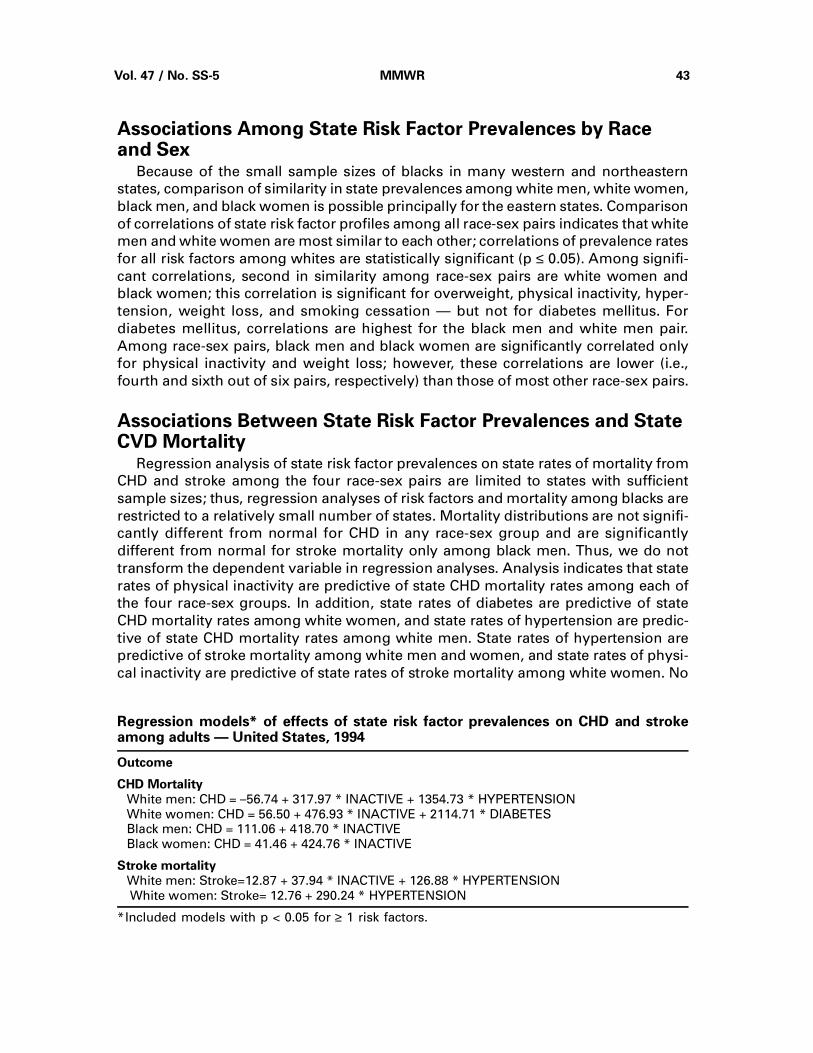
Associations Among State Risk Factor Prevalences by Raceand Sex
Because of the small sample sizes of blacks in many western and northeastern
states, comparison of similarity in state prevalences among white men, white women,
black men, and black women is possible principally for the eastern states. Comparison
of correlations of state risk factor profiles among all race-sex pairs indicates that white
men and white women are most similar to each other; correlations of prevalence rates
for all risk factors among whites are statistically significant (p ≤ 0.05). Among signifi-
cant correlations, second in similarity among race-sex pairs are white women and
black women; this correlation is significant for overweight, physical inactivity, hyper-
tension, weight loss, and smoking cessation — but not for diabetes mellitus. For
diabetes mellitus, correlations are highest for the black men and white men pair.
Among race-sex pairs, black men and black women are significantly correlated only
for physical inactivity and weight loss; however, these correlations are lower (i.e.,
fourth and sixth out of six pairs, respectively) than those of most other race-sex pairs.
Associations Between State Risk Factor Prevalences and StateCVD Mortality
Regression analysis of state risk factor prevalences on state rates of mortality from
CHD and stroke among the four race-sex pairs are limited to states with sufficient
sample sizes; thus, regression analyses of risk factors and mortality among blacks are
restricted to a relatively small number of states. Mortality distributions are not signifi-
cantly different from normal for CHD in any race-sex group and are significantly
different from normal for stroke mortality only among black men. Thus, we do not
transform the dependent variable in regression analyses. Analysis indicates that state
rates of physical inactivity are predictive of state CHD mortality rates among each of
the four race-sex groups. In addition, state rates of diabetes are predictive of state
CHD mortality rates among white women, and state rates of hypertension are predic-
tive of state CHD mortality rates among white men. State rates of hypertension are
predictive of stroke mortality among white men and women, and state rates of physi-
cal inactivity are predictive of state rates of stroke mortality among white women. No
Regression models* of effects of state risk factor prevalences on CHD and strokeamong adults — United States, 1994
Outcome
CHD Mortality
White men: CHD = –56.74 + 317.97 * INACTIVE + 1354.73 * HYPERTENSION
White women: CHD = 56.50 + 476.93 * INACTIVE + 2114.71 * DIABETES
Black men: CHD = 111.06 + 418.70 * INACTIVE
Black women: CHD = 41.46 + 424.76 * INACTIVE
Stroke mortality
White men: Stroke=12.87 + 37.94 * INACTIVE + 126.88 * HYPERTENSION
White women: Stroke= 12.76 + 290.24 * HYPERTENSION
*Included models with p < 0.05 for ≥ 1 risk factors.
Vol. 47 / No. SS-5 MMWR 43
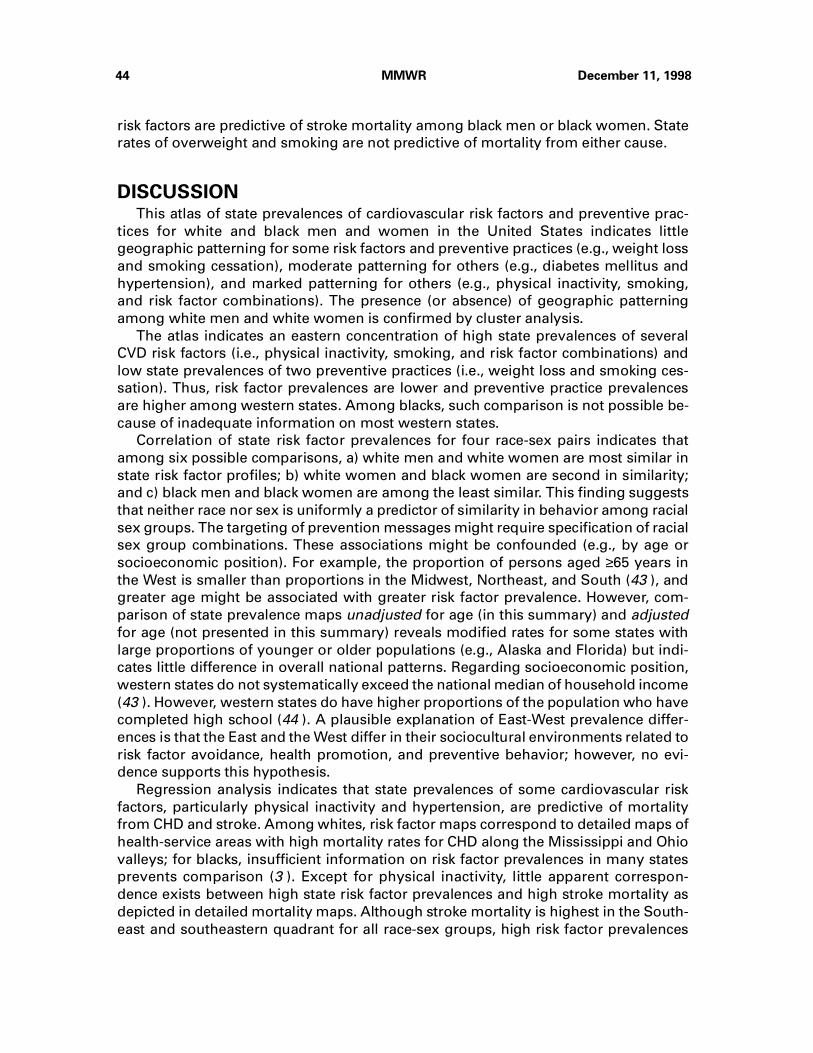
risk factors are predictive of stroke mortality among black men or black women. State
rates of overweight and smoking are not predictive of mortality from either cause.
DISCUSSIONThis atlas of state prevalences of cardiovascular risk factors and preventive prac-
tices for white and black men and women in the United States indicates little
geographic patterning for some risk factors and preventive practices (e.g., weight loss
and smoking cessation), moderate patterning for others (e.g., diabetes mellitus and
hypertension), and marked patterning for others (e.g., physical inactivity, smoking,
and risk factor combinations). The presence (or absence) of geographic patterning
among white men and white women is confirmed by cluster analysis.
The atlas indicates an eastern concentration of high state prevalences of several
CVD risk factors (i.e., physical inactivity, smoking, and risk factor combinations) and
low state prevalences of two preventive practices (i.e., weight loss and smoking ces-
sation). Thus, risk factor prevalences are lower and preventive practice prevalences
are higher among western states. Among blacks, such comparison is not possible be-
cause of inadequate information on most western states.
Correlation of state risk factor prevalences for four race-sex pairs indicates that
among six possible comparisons, a) white men and white women are most similar in
state risk factor profiles; b) white women and black women are second in similarity;
and c) black men and black women are among the least similar. This finding suggests
that neither race nor sex is uniformly a predictor of similarity in behavior among racial
sex groups. The targeting of prevention messages might require specification of racial
sex group combinations. These associations might be confounded (e.g., by age or
socioeconomic position). For example, the proportion of persons aged ≥65 years in
the West is smaller than proportions in the Midwest, Northeast, and South (43 ), and
greater age might be associated with greater risk factor prevalence. However, com-
parison of state prevalence maps unadjusted for age (in this summary) and adjusted
for age (not presented in this summary) reveals modified rates for some states with
large proportions of younger or older populations (e.g., Alaska and Florida) but indi-
cates little difference in overall national patterns. Regarding socioeconomic position,
western states do not systematically exceed the national median of household income
(43 ). However, western states do have higher proportions of the population who have
completed high school (44 ). A plausible explanation of East-West prevalence differ-
ences is that the East and the West differ in their sociocultural environments related to
risk factor avoidance, health promotion, and preventive behavior; however, no evi-
dence supports this hypothesis.
Regression analysis indicates that state prevalences of some cardiovascular risk
factors, particularly physical inactivity and hypertension, are predictive of mortality
from CHD and stroke. Among whites, risk factor maps correspond to detailed maps of
health-service areas with high mortality rates for CHD along the Mississippi and Ohio
valleys; for blacks, insufficient information on risk factor prevalences in many states
prevents comparison (3 ). Except for physical inactivity, little apparent correspon-
dence exists between high state risk factor prevalences and high stroke mortality as
depicted in detailed mortality maps. Although stroke mortality is highest in the South-
east and southeastern quadrant for all race-sex groups, high risk factor prevalences
44 MMWR December 11, 1998

other than physical inactivity are not predominantly concentrated in this region (3 ).
Findings here differ from conclusions of a recent analysis of BRFSS data for 1991–
1992 (8 ). However, our study included all persons aged ≥18 years (rather than only
those aged 45–74 years), and our analysis was stratified by race as well as sex.
The data in this report indicate that, among blacks, higher prevalences of CHD risk
factors (except for smoking) and lower prevalences of preventive practices exist. This
finding is consistent with higher national rates of CHD morbidity and mortality among
blacks. These risk factors can be changed or managed for healthier outcomes.
In addition to problems of misclassification associated with the ecological compari-
son of state prevalences and state mortality, between 1993 and 1994, approximately
2.7% of the U.S. population moved from one state to another, and national trends
existed in interregional migration as well (45 ). Because rates of interstate migration
have been similar or higher during the past 20 years, current state risk factor preva-
lence rates cannot be assumed to reflect the prevalences of risk factors among
long-term state residents.
Several studies indicate the reliability or validity of BRFSS data. One study com-
pared estimates from BRFSS telephone questions with measured physical
characteristics for several cardiovascular risk factors (46 ). The validity of self-reported
BMI was assessed using a cutoff value between the standards for men and women.
Using measured height and weight as standards, researchers reported a sensitivity of
77% and a specificity of 99% for self-report of BMI among men and a sensitivity of 72%
and a specificity of 99% for self-report of BMI among women. For cigarette smoking,
as validated by lung capacity, researchers reported a sensitivity of 78% and a specific-
ity of 97% among men and a sensitivity of 86% and a specificity of 96% among
women. For diabetes, as validated by fasting serum glucose, researchers reported a
sensitivity of 67% and a specificity of 98% among men and a sensitivity of 80% and a
specificity of 98% among women. For hypertension, as validated by measurement,
researchers reported a sensitivity of 40% and a specificity of 87% among men and a
sensitivity of 46% and a specificity of 87% among women. The study population (in
upper New York State) was 99% white and thus precluded racial comparisons of valid-
ity. Another study reported higher sensitivity and specificity for self-reported
hypertension among both blacks and whites (47 ). One study compared self-reported
cigarette consumption with estimates of cigarette sales from excise taxes and indi-
cated self-reported consumption to be approximately 72% of true consumption (48 ).
Another study indicated that BRFSS accurately reported smoking status, but substan-
tially underreported obesity (49 ).
The prevalence estimates of self-reported health-risk behaviors in this analysis
might be underestimated because data were collected through telephone interviews;
previous studies indicate substantial differences in the characteristics of persons who
reside in households without a telephone compared with those who reside in house-
holds with a telephone (50 ).
One problem with the local use of BRFSS, apparent in this summary, is the small
sample sizes for blacks in approximately half the states. Available information on
blacks in BRFSS does not correspond precisely with state populations of blacks. For
example, the 1994 black population of Hawaii was 29,000 (43 ), and BRFSS has preva-
lence data on overweight among black men in Hawaii; whereas in Ohio, which had a
black population of 1,235,000 (43 ), BRFSS sample size for black men was not large
Vol. 47 / No. SS-5 MMWR 45

enough to permit estimation of the prevalence of overweight. Achievement of reliable
annual state information on blacks will require oversampling in states with small black
populations. This additional information might facilitate understanding risk factors for
cardiovascular disease among blacks and the design of appropriate prevention pro-
grams.
The primary intended use of this risk factor atlas is as a reference. It might indicate
regions of the nation that are in particular need of risk factor reduction and health
promotion programs. The atlas might also serve as a baseline for the analysis of
trends and the assessment of intervention programs. It might serve to assist in plan-
ning for future data collection efforts (e.g., demonstrating where alternative methods
might be beneficial in collecting information previously unavailable or unanalyzable).
Finally, the atlas might serve to generate hypotheses and stimulate the development
of risk factor epidemiology, which explores the causes and consequences of risk factor
distributions in the population. Understanding the determinants for risk factors might
facilitate their control for public health.
References1. NCHS. Health United States, 1995. Hyattsville, MD: US Department of Health and Human Serv-
ices, Public Health Service, CDC, National Center for Health Statistics, May 1996; DHHSpublication no. (PHS) 96-1232.
2. Gillum BS, Graves EJ, Wood E. National Hospital Discharge Survey: Annual Summary, 1995.Hyattsville, MD: US Department of Health and Human Services, CDC, National Center forHealth Statistics, 1998; DHHS publication no. (PHS)98-1794. (Vital and health statistics; series13, no. 133).
3. Pickle LW, Mingiole M, Jones GK, White AA. Atlas of United States mortality. Hyattsville, MD:US Department of Health and Human Services, Public Health Service, CDC, National Centerfor Health Statistics, December 1996; DHHS publication no. (PHS)97-1015.
4. Adams PF, Marano MA. Current estimates from the National Health Interview Survey, 1994.Hyattsville, MD: US Department of Health and Human Services, Public Health Service, CDC,National Center for Health Statistics, December 1995; DHHS publication no. (PHS) 96-1521.(Vital and health statistics: data from the National Health Survey; series 10, no. 193).
5. National Center for Health Statistics. Advance report of final mortality statistics, 1994.Hyattsville, MD: US Department of Health and Human Services, Public Health Service, CDC,1996. (Monthly vital statistics report; vol 45, no. 3, suppl).
6. Nelson DE, Kirkendall RS, Lawton RL, et al. Surveillance for smoking-attributable mortalityand years of potential life lost, by state—United States, 1990. In CDC surveillance summaries(June 10). MMWR 1994;43(No. SS-1):1–8.
7. Yeager KK, Anda RF, Macera CA, Donehoo RS, Eaker ED. Sedentary life style and state variationin coronary heart disease mortality. Public Health Rep 1995;110:100–2.
8. Byers T, Anda R, McQueen D, et al. The correspondence between coronary heart disease mor-tality and risk factor prevalence among states in the United States, 1991–1992. Prev Med1998;27:311–6.
9. CDC. Heat-related illnesses and deaths—United States, 1994–1995. MMWR 1995;44:465–8.
10. Dockery DW, Pope CA III, Xu X, et al. An association between air pollution and mortality insix U.S. cities. New Engl J Med 1993;329:1753–9.
11. CDC. State tobacco control highlights—1996. Atlanta: CDC, National Center for Chronic DiseasePrevention and Health Promotion, Office on Smoking and Health, 1996; publication no. 099-4895.
12. CDC. Reducing the health consequences of smoking: 25 years of progress—a report of theSurgeon General. Rockville, MD: US Department of Health and Human Services, Public HealthService, CDC, Center for Chronic Disease Prevention and Health Promotion, 1989; DHHS pub-lication no. (CDC)89-8411.
13. Foster WR, Burton BT, eds. National Institutes of Health Consensus Development Panel onthe health implications of obesity. Ann Intern Med 1985;103(suppl 6):1073–7.
46 MMWR December 11, 1998
14. Hubert HB. The importance of obesity in the development of coronary risk factors and disease:the epidemiological evidence. Annu Rev Public Health 1986;7:493–502.
15. Kuczmarski RJ, Flegal KM, Campbell SM, Johnson CL. Increasing prevalence of overweightamong US adults: the National Health and Nutrition Examination Surveys, 1960 to 1991. JAMA1994;272:205–11.
16. Powell KE, Thompson PD, Caspersen CJ, et al. Physical activity and the incidence of coronaryheart disease. Annu Rev Public Health 1987;8:253.
17. Pooling Project Research Group. Relationship of blood pressure, serum cholesterol, smokinghabit, relative weight and ECG abnormalities to incidence of major coronary events: finalreport of the Pooling Project. J Chronic Dis 1978;31:202–306.
18. May GS, Eberlein KA, Furberg CD, Passamani ER, DeMets DL. Secondary prevention aftermyocardial infarction: a review of long term trials. Prog Cardiovasc Dis 1982;24:331.
19. O’Connor GT, Buring JE, Yusaf S, et al. An overview of randomized trials of rehabilitationwith exercise after myocardial infarction. Circulation 1989;80:234–44.
20. Paffenbarger RS Jr, Wing AL, Hyde RT. Physical activity as an index of heart attack risk incollege alumni. Am J Epidemiol 1978;108:161.
21. CDC. Physical activity and health: a report of the Surgeon General. Atlanta: US Departmentof Health and Human Services, CDC, National Center for Chronic Disease Prevention andHealth Promotion, President’s Council on Physical Fitness and Sports, 1996.
22. Mulcahy, R. Influence of cigarette smoking on morbidity and mortality after myocardial in-farction. Br Heart J 1983;49:410–5.
23. Pathobiological Determinants of Atherosclerosis in Youth (PDAY) Research Group. Relation-ship of atherosclerosis in young men to serum lipoprotein cholesterol concentrations andsmoking. JAMA 1990;264:3018–24.
24. The sixth report of the Joint National Committee on Prevention, Detection, Evaluation, andTreatment of High Blood Pressure. Arch Intern Med 1997;157:2413–46.
25. Grundy SM, Balady GJ, Criqui MH, et al. Guide to primary prevention of cardiovascular dis-eases. Circulation 1997;95:2329–31.
26. Burt VL, Culter JA, Higgins M, et al. Trends in the prevalence, awareness, treatment, andcontrol of hypertension in the adult US population: data from the Health Examination Surveys,1960 to 1991. Hypertension 1995;26:60–9.
27. Barrett-Connor E, Orghard T. Diabetes and heart disease. In Diabetes in America. MI Harris,RF Hamman, eds. Washington, DC: US Department of Health and Human Services, PublicHealth Service, National Institutes of Health, National Institute of Arthritis, Diabetes, and Di-gestive and Kidney Diseases, August 1985; NIH publication no. 85-1468.
28. Criqui MH, Barrett-Connor E, Holdbrook MJ, Austin M, Turner JD. Clustering of cardiovasculardisease risk factors. Prev Med 1980;9:525–33.
29. Gotto AM, Jr. Interactions of the major risk factors for coronary heart disease. Am J Med1986;80(suppl 2A):48–55.
30. Friedewald WT. Physical activity research and coronary heart disease. Public Health Rep1985;100:115–7.
31. Jeffery RW. Community programs for obesity prevention: The Minnesota Heart Health Pro-gram. Obesity Research 1995;3(suppl;Sept 2):283s–88s.
32. Brownell KD. Public Health approaches to obesity and its management. Annu Rev Public Health1986;7:521.
33. Public Health Service. Healthy people 2000: national health promotion and disease preventionobjectives—full report, with commentary. Washington, DC: US Department of Health and Hu-man Services, Public Health Service, 1991; DHHS publication no. (PHS) 91-50212.
34. Waksberg JS. Sampling methods for random digit dialing. J Am Stat Assoc 1978;73:40–6.
35. NCHS. Health Promotion and Disease Prevention—United States, 1990. Hyattsville, MD: USDepartment of Health and Human Services, Public Health Service, CDC, National Center forHealth Statistics, April 1993; DHHS publication no. (PHS) 93-1513. (Vital and health statistics:data from the National Health Survey; series 10, no. 185).
36. Marks, JS, Hogelin GC, Gentry EM, et al. The Behavioral Risk Factor Surveys: state-specificprevalence estimates of behavioral risk factors. Am J Med 1995;1:1–8.
37. SAS Institute Inc. SAS®
Companion for the MVS environment. Version 6, First edition, Cary,NC: SAS Institute Inc, 1990.
Vol. 47 / No. SS-5 MMWR 47

38. CDC. Epi Info, version 6: a word processing, database, and statistics system for epidemiologyon microcomputers. Atlanta: Public Health Service, CDC, Epidemiology Program Office, July1995.
39. CDC. Epi Map, version 2: an Epi Info- and dBASE-Compatible mapping program. Atlanta: PublicHealth Service, CDC, Epidemiology Program Office, September 1995.
40. Ohno Y, Aoki K, Aoki N. A test of significance for geographic clusters of disease. Int J Epidemiol1979;8:273–81.
41. ATSDR. CLUSTER 3.1 Software system for epidemiologic analysis: instruction manual. Atlanta:Public Health Service, Agency for Toxic Substances and Disease Registry, February 1993.
42. Friede A, Rosen DH, Reid JA. CDC WONDER: a cooperative processing architecture for publichealth. J Am Med Inform Assoc 1994;1:303–12.
43. US Bureau of the Census. Statistical abstract of the United States: 1997 (117th
edition). Wash-ington, DC, 1997.
44. Day JC, Curry AE. Educational attainment in the United States: March 1996 (Update). Wash-ington, DC: US Department of Commerce, Economics and Statistics Administration, Bureauof the Census, July 1997. (Current population reports no. P20-493).
45. Hansen KA. Geographical mobility: March 1993 to March 1994. Washington, DC: US Depart-ment of Commerce, Economics and Statistics Administration, Bureau of the Census, August1995. (Current population reports no. P20-485).
46. Bowlin SJ, Morrill BD, Nafziger AN, Jenkins PL, Lewis C, Pearson TA. Validity of cardiovasculardisease risk factors assessed by telephone survey: the Behavior Risk Factor Survey. J ClinEpidemiol 1993;46:561–71.
47. Giles WH, Croft JB, Keenan NL, Lane MJ, Wheeler FC. The validity of self-reported hypertensionand correlates of hypertension awareness among blacks and whites within the stroke belt.Am J Prev Med 1995;11:163–9.
48. Hatziandreu EJ, Pierce JP, Fiore MC, Grise V, Novotny TE, Davis RM. The reliability of self-reported cigarette consumption in the United States. Am J Public Health 1989;79:1020–3.
49. Jackson C, Jatulis DE, Fortmann SP. The Behavioral Risk Factor Survey and the Stanford Five-City Project Survey: a comparison of cardiovascular risk behavior estimates. Am J Public Health1992;82:412–6.
50. Thornberry OT, Massey JT. Trends in United States telephone coverage across time and sub-groups. In Groves RM, Biemer PP, Lyberg LE, Massey JT, Nicholls WL, Waksberg J, eds.Telephone survey methodology. New York: John Wiley & Sons, 1989.
48 MMWR December 11, 1998
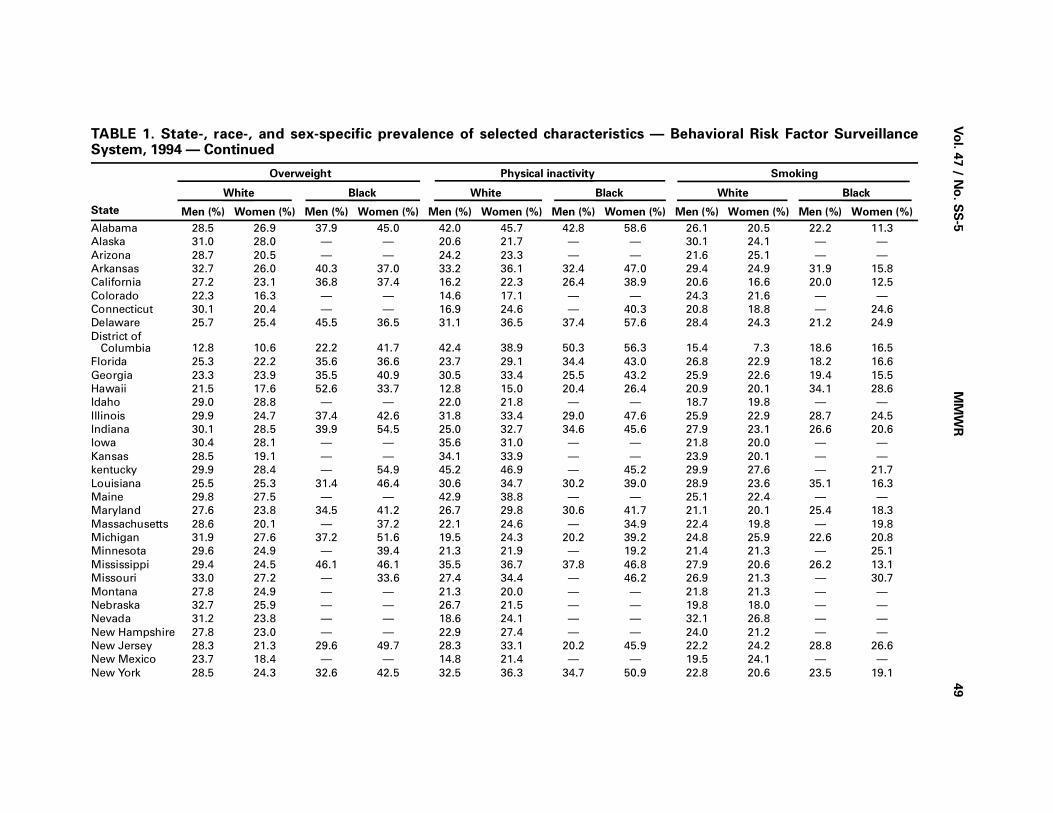
Vo
l. 47 / N
o. S
S-5
MM
WR
49
TABLE 1. State-, race-, and sex-specific prevalence of selected characteristics — Behavioral Risk Factor SurveillanceSystem, 1994 — Continued
State
Overweight Physical inactivity Smoking
White Black White Black White Black
Men (%) Women (%) Men (%) Women (%) Men (%) Women (%) Men (%) Women (%) Men (%) Women (%) Men (%) Women (%)
Alabama 28.5 26.9 37.9 45.0 42.0 45.7 42.8 58.6 26.1 20.5 22.2 11.3
Alaska 31.0 28.0 — — 20.6 21.7 — — 30.1 24.1 — —
Arizona 28.7 20.5 — — 24.2 23.3 — — 21.6 25.1 — —
Arkansas 32.7 26.0 40.3 37.0 33.2 36.1 32.4 47.0 29.4 24.9 31.9 15.8
California 27.2 23.1 36.8 37.4 16.2 22.3 26.4 38.9 20.6 16.6 20.0 12.5
Colorado 22.3 16.3 — — 14.6 17.1 — — 24.3 21.6 — —
Connecticut 30.1 20.4 — — 16.9 24.6 — 40.3 20.8 18.8 — 24.6
Delaware 25.7 25.4 45.5 36.5 31.1 36.5 37.4 57.6 28.4 24.3 21.2 24.9
District ofColumbia 12.8 10.6 22.2 41.7 42.4 38.9 50.3 56.3 15.4 7.3 18.6 16.5
Florida 25.3 22.2 35.6 36.6 23.7 29.1 34.4 43.0 26.8 22.9 18.2 16.6
Georgia 23.3 23.9 35.5 40.9 30.5 33.4 25.5 43.2 25.9 22.6 19.4 15.5
Hawaii 21.5 17.6 52.6 33.7 12.8 15.0 20.4 26.4 20.9 20.1 34.1 28.6
Idaho 29.0 28.8 — — 22.0 21.8 — — 18.7 19.8 — —
Illinois 29.9 24.7 37.4 42.6 31.8 33.4 29.0 47.6 25.9 22.9 28.7 24.5
Indiana 30.1 28.5 39.9 54.5 25.0 32.7 34.6 45.6 27.9 23.1 26.6 20.6
Iowa 30.4 28.1 — — 35.6 31.0 — — 21.8 20.0 — —
Kansas 28.5 19.1 — — 34.1 33.9 — — 23.9 20.1 — —
kentucky 29.9 28.4 — 54.9 45.2 46.9 — 45.2 29.9 27.6 — 21.7
Louisiana 25.5 25.3 31.4 46.4 30.6 34.7 30.2 39.0 28.9 23.6 35.1 16.3
Maine 29.8 27.5 — — 42.9 38.8 — — 25.1 22.4 — —
Maryland 27.6 23.8 34.5 41.2 26.7 29.8 30.6 41.7 21.1 20.1 25.4 18.3
Massachusetts 28.6 20.1 — 37.2 22.1 24.6 — 34.9 22.4 19.8 — 19.8
Michigan 31.9 27.6 37.2 51.6 19.5 24.3 20.2 39.2 24.8 25.9 22.6 20.8
Minnesota 29.6 24.9 — 39.4 21.3 21.9 — 19.2 21.4 21.3 — 25.1
Mississippi 29.4 24.5 46.1 46.1 35.5 36.7 37.8 46.8 27.9 20.6 26.2 13.1
Missouri 33.0 27.2 — 33.6 27.4 34.4 — 46.2 26.9 21.3 — 30.7
Montana 27.8 24.9 — — 21.3 20.0 — — 21.8 21.3 — —
Nebraska 32.7 25.9 — — 26.7 21.5 — — 19.8 18.0 — —
Nevada 31.2 23.8 — — 18.6 24.1 — — 32.1 26.8 — —
New Hampshire 27.8 23.0 — — 22.9 27.4 — — 24.0 21.2 — —
New Jersey 28.3 21.3 29.6 49.7 28.3 33.1 20.2 45.9 22.2 24.2 28.8 26.6
New Mexico 23.7 18.4 — — 14.8 21.4 — — 19.5 24.1 — —
New York 28.5 24.3 32.6 42.5 32.5 36.3 34.7 50.9 22.8 20.6 23.5 19.1
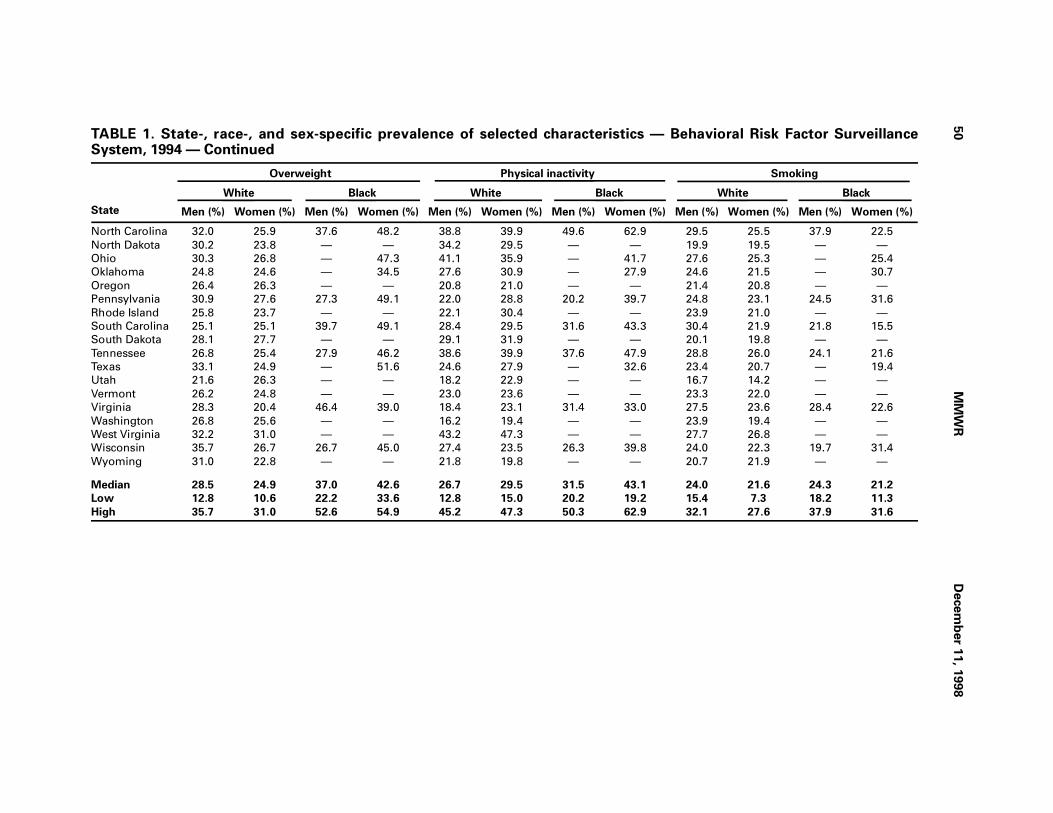
50
MM
WR
Decem
ber 1
1, 1
998
TABLE 1. State-, race-, and sex-specific prevalence of selected characteristics — Behavioral Risk Factor SurveillanceSystem, 1994 — Continued
State
Overweight Physical inactivity Smoking
White Black White Black White Black
Men (%) Women (%) Men (%) Women (%) Men (%) Women (%) Men (%) Women (%) Men (%) Women (%) Men (%) Women (%)
North Carolina 32.0 25.9 37.6 48.2 38.8 39.9 49.6 62.9 29.5 25.5 37.9 22.5
North Dakota 30.2 23.8 — — 34.2 29.5 — — 19.9 19.5 — —
Ohio 30.3 26.8 — 47.3 41.1 35.9 — 41.7 27.6 25.3 — 25.4
Oklahoma 24.8 24.6 — 34.5 27.6 30.9 — 27.9 24.6 21.5 — 30.7
Oregon 26.4 26.3 — — 20.8 21.0 — — 21.4 20.8 — —
Pennsylvania 30.9 27.6 27.3 49.1 22.0 28.8 20.2 39.7 24.8 23.1 24.5 31.6
Rhode Island 25.8 23.7 — — 22.1 30.4 — — 23.9 21.0 — —
South Carolina 25.1 25.1 39.7 49.1 28.4 29.5 31.6 43.3 30.4 21.9 21.8 15.5
South Dakota 28.1 27.7 — — 29.1 31.9 — — 20.1 19.8 — —
Tennessee 26.8 25.4 27.9 46.2 38.6 39.9 37.6 47.9 28.8 26.0 24.1 21.6
Texas 33.1 24.9 — 51.6 24.6 27.9 — 32.6 23.4 20.7 — 19.4
Utah 21.6 26.3 — — 18.2 22.9 — — 16.7 14.2 — —
Vermont 26.2 24.8 — — 23.0 23.6 — — 23.3 22.0 — —
Virginia 28.3 20.4 46.4 39.0 18.4 23.1 31.4 33.0 27.5 23.6 28.4 22.6
Washington 26.8 25.6 — — 16.2 19.4 — — 23.9 19.4 — —
West Virginia 32.2 31.0 — — 43.2 47.3 — — 27.7 26.8 — —
Wisconsin 35.7 26.7 26.7 45.0 27.4 23.5 26.3 39.8 24.0 22.3 19.7 31.4
Wyoming 31.0 22.8 — — 21.8 19.8 — — 20.7 21.9 — —
Median 28.5 24.9 37.0 42.6 26.7 29.5 31.5 43.1 24.0 21.6 24.3 21.2
Low 12.8 10.6 22.2 33.6 12.8 15.0 20.2 19.2 15.4 7.3 18.2 11.3
High 35.7 31.0 52.6 54.9 45.2 47.3 50.3 62.9 32.1 27.6 37.9 31.6
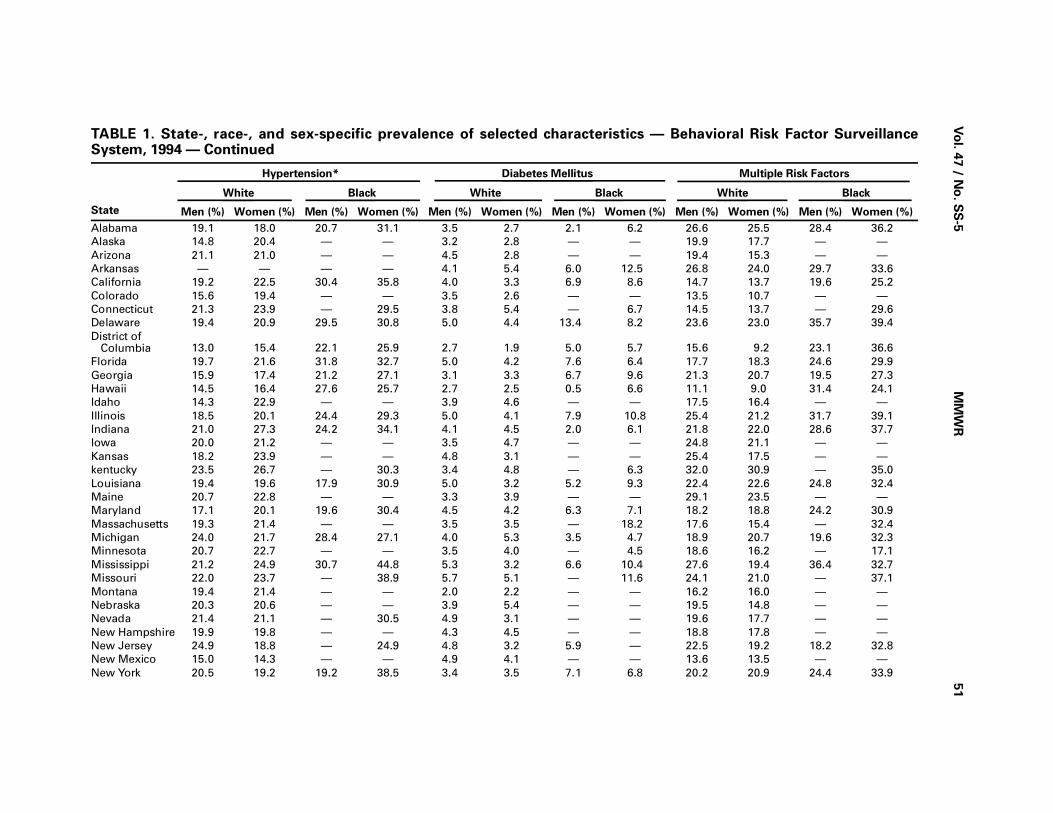
Vo
l. 47 / N
o. S
S-5
MM
WR
51
TABLE 1. State-, race-, and sex-specific prevalence of selected characteristics — Behavioral Risk Factor SurveillanceSystem, 1994 — Continued
State
Hypertension* Diabetes Mellitus Multiple Risk Factors
White Black White Black White Black
Men (%) Women (%) Men (%) Women (%) Men (%) Women (%) Men (%) Women (%) Men (%) Women (%) Men (%) Women (%)
Alabama 19.1 18.0 20.7 31.1 3.5 2.7 2.1 6.2 26.6 25.5 28.4 36.2
Alaska 14.8 20.4 — — 3.2 2.8 — — 19.9 17.7 — —
Arizona 21.1 21.0 — — 4.5 2.8 — — 19.4 15.3 — —
Arkansas — — — — 4.1 5.4 6.0 12.5 26.8 24.0 29.7 33.6
California 19.2 22.5 30.4 35.8 4.0 3.3 6.9 8.6 14.7 13.7 19.6 25.2
Colorado 15.6 19.4 — — 3.5 2.6 — — 13.5 10.7 — —
Connecticut 21.3 23.9 — 29.5 3.8 5.4 — 6.7 14.5 13.7 — 29.6
Delaware 19.4 20.9 29.5 30.8 5.0 4.4 13.4 8.2 23.6 23.0 35.7 39.4
District ofColumbia 13.0 15.4 22.1 25.9 2.7 1.9 5.0 5.7 15.6 9.2 23.1 36.6
Florida 19.7 21.6 31.8 32.7 5.0 4.2 7.6 6.4 17.7 18.3 24.6 29.9
Georgia 15.9 17.4 21.2 27.1 3.1 3.3 6.7 9.6 21.3 20.7 19.5 27.3
Hawaii 14.5 16.4 27.6 25.7 2.7 2.5 0.5 6.6 11.1 9.0 31.4 24.1
Idaho 14.3 22.9 — — 3.9 4.6 — — 17.5 16.4 — —
Illinois 18.5 20.1 24.4 29.3 5.0 4.1 7.9 10.8 25.4 21.2 31.7 39.1
Indiana 21.0 27.3 24.2 34.1 4.1 4.5 2.0 6.1 21.8 22.0 28.6 37.7
Iowa 20.0 21.2 — — 3.5 4.7 — — 24.8 21.1 — —
Kansas 18.2 23.9 — — 4.8 3.1 — — 25.4 17.5 — —
kentucky 23.5 26.7 — 30.3 3.4 4.8 — 6.3 32.0 30.9 — 35.0
Louisiana 19.4 19.6 17.9 30.9 5.0 3.2 5.2 9.3 22.4 22.6 24.8 32.4
Maine 20.7 22.8 — — 3.3 3.9 — — 29.1 23.5 — —
Maryland 17.1 20.1 19.6 30.4 4.5 4.2 6.3 7.1 18.2 18.8 24.2 30.9
Massachusetts 19.3 21.4 — — 3.5 3.5 — 18.2 17.6 15.4 — 32.4
Michigan 24.0 21.7 28.4 27.1 4.0 5.3 3.5 4.7 18.9 20.7 19.6 32.3
Minnesota 20.7 22.7 — — 3.5 4.0 — 4.5 18.6 16.2 — 17.1
Mississippi 21.2 24.9 30.7 44.8 5.3 3.2 6.6 10.4 27.6 19.4 36.4 32.7
Missouri 22.0 23.7 — 38.9 5.7 5.1 — 11.6 24.1 21.0 — 37.1
Montana 19.4 21.4 — — 2.0 2.2 — — 16.2 16.0 — —
Nebraska 20.3 20.6 — — 3.9 5.4 — — 19.5 14.8 — —
Nevada 21.4 21.1 — 30.5 4.9 3.1 — — 19.6 17.7 — —
New Hampshire 19.9 19.8 — — 4.3 4.5 — — 18.8 17.8 — —
New Jersey 24.9 18.8 — 24.9 4.8 3.2 5.9 — 22.5 19.2 18.2 32.8
New Mexico 15.0 14.3 — — 4.9 4.1 — — 13.6 13.5 — —
New York 20.5 19.2 19.2 38.5 3.4 3.5 7.1 6.8 20.2 20.9 24.4 33.9
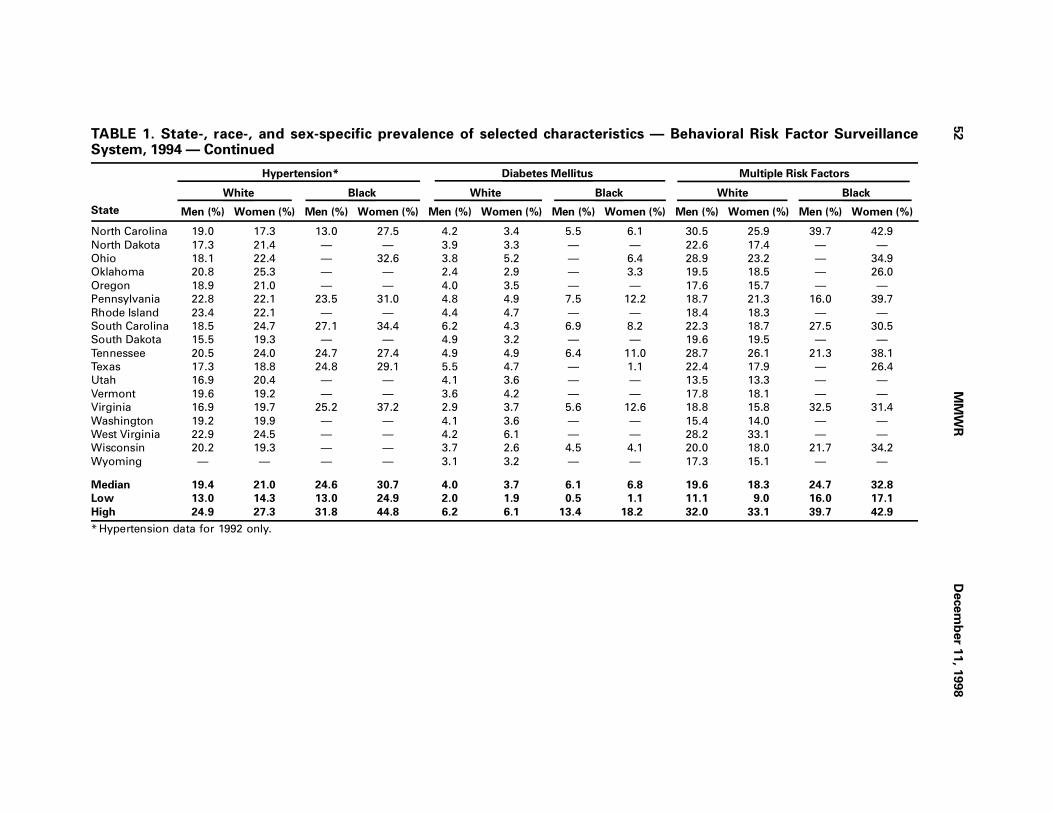
52
MM
WR
Decem
ber 1
1, 1
998
TABLE 1. State-, race-, and sex-specific prevalence of selected characteristics — Behavioral Risk Factor SurveillanceSystem, 1994 — Continued
State
Hypertension* Diabetes Mellitus Multiple Risk Factors
White Black White Black White Black
Men (%) Women (%) Men (%) Women (%) Men (%) Women (%) Men (%) Women (%) Men (%) Women (%) Men (%) Women (%)
North Carolina 19.0 17.3 13.0 27.5 4.2 3.4 5.5 6.1 30.5 25.9 39.7 42.9
North Dakota 17.3 21.4 — — 3.9 3.3 — — 22.6 17.4 — —
Ohio 18.1 22.4 — 32.6 3.8 5.2 — 6.4 28.9 23.2 — 34.9
Oklahoma 20.8 25.3 — — 2.4 2.9 — 3.3 19.5 18.5 — 26.0
Oregon 18.9 21.0 — — 4.0 3.5 — — 17.6 15.7 — —
Pennsylvania 22.8 22.1 23.5 31.0 4.8 4.9 7.5 12.2 18.7 21.3 16.0 39.7
Rhode Island 23.4 22.1 — — 4.4 4.7 — — 18.4 18.3 — —
South Carolina 18.5 24.7 27.1 34.4 6.2 4.3 6.9 8.2 22.3 18.7 27.5 30.5
South Dakota 15.5 19.3 — — 4.9 3.2 — — 19.6 19.5 — —
Tennessee 20.5 24.0 24.7 27.4 4.9 4.9 6.4 11.0 28.7 26.1 21.3 38.1
Texas 17.3 18.8 24.8 29.1 5.5 4.7 — 1.1 22.4 17.9 — 26.4
Utah 16.9 20.4 — — 4.1 3.6 — — 13.5 13.3 — —
Vermont 19.6 19.2 — — 3.6 4.2 — — 17.8 18.1 — —
Virginia 16.9 19.7 25.2 37.2 2.9 3.7 5.6 12.6 18.8 15.8 32.5 31.4
Washington 19.2 19.9 — — 4.1 3.6 — — 15.4 14.0 — —
West Virginia 22.9 24.5 — — 4.2 6.1 — — 28.2 33.1 — —
Wisconsin 20.2 19.3 — — 3.7 2.6 4.5 4.1 20.0 18.0 21.7 34.2
Wyoming — — — — 3.1 3.2 — — 17.3 15.1 — —
Median 19.4 21.0 24.6 30.7 4.0 3.7 6.1 6.8 19.6 18.3 24.7 32.8
Low 13.0 14.3 13.0 24.9 2.0 1.9 0.5 1.1 11.1 9.0 16.0 17.1
High 24.9 27.3 31.8 44.8 6.2 6.1 13.4 18.2 32.0 33.1 39.7 42.9
* Hypertension data for 1992 only.

TABLE 1. State-, race-, and sex-specific prevalence of selected characteristics —Behavioral Risk Factor Surveillance System, 1994 — Continued
State
Weight Loss Smoking Cessation
White Black White Black
Men(%)
Women(%)
Men(%)
Women(%)
Men(%)
Women(%)
Men(%)
Women(%)
Alabama 84.4 92.3 81.7 90.0 45.1 38.8 35.5 36.5Alaska 90.5 94.1 — — 29.6 36.3 — —Arizona 83.8 89.2 — — 44.3 27.6 — —Arkansas 80.8 88.2 83.7 82.0 45.9 37.2 — —California 90.9 93.4 88.5 94.7 49.3 51.9 — —Colorado 89.4 92.7 — — 49.1 41.6 — —Connecticut 80.6 89.3 — — 53.4 53.3 — —Delaware 76.9 84.3 77.5 78.5 45.6 46.4 39.7 34.7District of Columbia 82.0 82.5 67.3 81.2 40.7 58.3 30.6 32.7Florida 84.5 88.7 83.5 89.1 48.7 47.1 38.5 29.9Georgia 81.7 87.4 85.8 88.2 31.7 28.7 31.6 26.1Hawaii 87.4 94.0 90.5 89.9 54.2 45.7 16.4 28.0Idaho 81.5 91.5 — — 31.8 23.1 — —Illinois 81.4 88.9 83.3 82.1 31.4 23.5 22.1 17.9Indiana 87.0 91.5 — 93.4 45.7 38.4 — —Iowa 80.6 90.2 — — 36.3 29.1 — —Kansas 87.0 91.3 — — 46.5 37.9 — —kentucky 80.3 90.0 — 88.4 39.7 31.7 — —Louisiana 76.7 88.1 81.1 83.5 48.1 38.4 27.7 36.2Maine 84.4 91.3 — — 37.8 34.7 — —Maryland 85.2 92.4 85.3 90.2 48.9 45.1 32.2 37.8Massachusetts 91.1 92.7 — — 47.9 48.0 — —Michigan 87.5 91.6 88.5 89.8 48.2 39.4 — 33.4Minnesota 85.0 89.2 — — 51.6 44.5 — —Mississippi 71.2 85.2 68.6 86.7 48.2 39.2 33.2 22.0Missouri 85.3 87.9 — 82.3 47.7 42.4 — —Montana 85.7 88.9 — — 44.5 35.5 — —Nebraska 83.6 90.2 — — 53.1 41.0 — —Nevada 79.5 90.2 — — 41.9 38.2 — —New Hampshire 87.6 92.6 — — 47.8 44.4 — —New Jersey 83.1 88.0 — 83.6 49.1 41.6 — —New Mexico 82.7 88.2 — — 54.9 40.3 — —New York 81.5 87.0 77.0 84.2 47.6 43.4 — 28.0North Carolina 77.2 86.5 68.6 82.0 43.4 37.6 25.2 21.9North Dakota 80.9 89.4 — — 54.4 41.1 — —Ohio 70.8 88.7 — 86.7 33.2 22.9 — —Oklahoma 75.7 82.6 — 80.1 36.4 38.6 — —Oregon 86.0 92.0 — — 56.0 46.7 — —Pennsylvania 87.6 92.9 91.1 90.1 50.2 42.2 41.1 26.2Rhode Island 88.4 90.3 — — 50.4 49.2 — —South Carolina 74.2 81.6 76.5 79.0 13.4 21.2 23.9 14.8South Dakota 83.8 89.9 — — 52.8 37.1 — —Tennessee 82.2 87.6 84.1 83.9 35.5 30.1 26.2 31.1Texas 85.6 90.4 — 75.2 49.4 38.8 — —Utah 88.6 93.0 — — 42.8 32.3 — —Vermont 82.5 89.2 — — 51.6 45.7 — —Virginia 85.1 90.0 87.2 95.3 44.2 38.9 35.8 23.2Washington 87.5 90.9 — — 51.4 50.7 — —West Virginia 79.3 87.9 — — 35.1 23.8 — —Wisconsin 88.7 92.0 — 85.8 50.1 44.5 — 22.6Wyoming 87.3 93.7 — — 33.5 27.2 — —
Median 83.8 90.0 83.5 85.8 47.6 38.9 31.6 28.0Low 70.8 81.6 67.3 75.2 13.4 21.2 16.4 14.8High 91.1 94.1 91.1 95.3 56.0 58.3 41.1 37.8
Vol. 47 / No. SS-5 MMWR 53
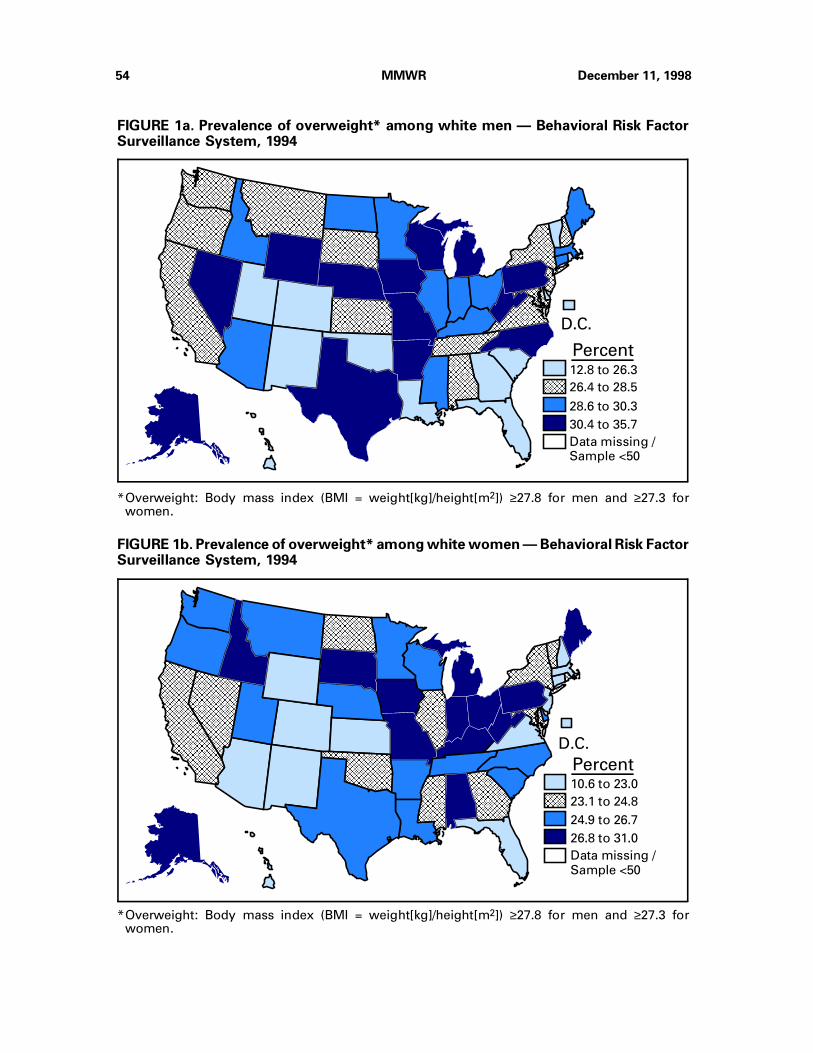
AAAAAAAAAAAAAAAAAAAAAAAAAAAAAAAAAAAAAAAAAAAAAAAA
AAAAAAAAAAAAAAAAAAAAAAAAAAAAAAAAAAAAAAAAAAAAAAAA
AAAA
AA
A
AA
AA
AA
AAAAAAAAAAAAAAAAAAAAAAAAAAAAAAAAAAAAAAAAAAAAAAAAAAAAAAAAAAAAAAAAAAAAAAAAAAAAAAAAAAAAAAAAAAAAAAAAAAAAAAAA
AAAAAAAAAAAAAAAAAAAAAAAAAAAAAAAAAAAAAAAAAAAAAAAAAAAAAAAAAAAAAAAAAAAAAAAAAAAAAAAAAAAAAAAAAAAAAAAAAAAAAAAA
AAAAAAAAAAAAAAAAAAAAAAAAAAAAAAAAAAAAAAAAAAAAAAAAAAAAAAAAAAAAAAAAAAAAAAAAAAAAAAAAAAAAAAAAAAAAAAAAAAAAAAAA
AAAAAAAAAAAAAAAAAAAAAAAAAAAAAAAAAAAAAAAAAAAAAAAAAAAA
AAAAAAAAAAAAAAAAAAAAAAAAAAAAAAAA
AAAAAAAAAAAAAAAAAAAAAAAAAAAAAAAA
AAAAAAAAAAAAAAAAAAAAAAAAAAAAAAAA
AAAAAAAA
AAAAAA
AAAAAAAAAAAAAAAAAAAA
AAAAAAAAAAAAAAAAAAAA
AAAAA
AAAAAAAAAAAAAAAAAAAAAAAAAAAAAAAAAAAAAAAAAAAAAAAA
AAAAAAAAAAAAAAAAAAAAAAAAAAAAAAAAAAAAAAAAAAAAAAAA
AAAAAAAAAAAAAAAAAAAAAAAAAAAAAAAAAAAAAAAAAAAAAAAA
AAAAAAAAAAAAAAAAAAAAAAAAAAAAAAAAAAAAAAAAAAAAAAAA
AAAAAAAAAAAAAAAAAAAAAAAA
AAAAAAAAAAAAAAAAAAAAAAAAAAAA
AAAAAAAAAAAAAAAAAAAAAAAA
AA
AAAAAAAAAAAAAAAAAAAAAAAAAAAAAAAAAAAAAAAAAAAA
AAAAAAAAAAAAAAAAAAAAAAAAAAAAAAAAAAAAAAAAAAAA
AAAAAAAAAAAAAAAAAAAAAAAAAAAAAAAAAAAAAAAAAAAA
AAAAAAAAAAA
AAAAAAAAAAAAAAAAAAAAAAAAAAAAAAAAAAAAAAAAAAAAAAAAAAAAAAAA
AAAAAAAAAAAAAAAAAAAAAAAAAAAAAAAAAAAAAAAAAAAAAAAAAAAAAAAA
AAAAAAAAAAAAAAAAAAAAAAAAAAAAAAAAAAAAAAAAAAAAAAAAAAAAAAAA
AAAAAAAAAAAAAAAAAAAAAAAAAAAAAAAAAAAAAAAAAA
AAAAAAAAAAAAAAAAAAAAAAAAAAAAAAAAAAAAAAAA
AAAAAAAAAAAAAAAAAAAAAAAAAAAAAAAAAAAAAAAA
AAAAAAAAAAAAAAAAAAAAAAAAAAAAAAAAAAAAAAAA
AAAAAAAAAA
AAAAAAAAAAAAAAAAAAAAAAAA
AAAAAAAAAAAAAAAAAAAAAAAA
AAAAAAAAAAAAAAAAAAAAAAAA
AAAAAAAAAAAAAAAAAA
AA
AAAAAAAA
AAAAAAAAAAAAAAAAAAAAAAAAAAAAAAAAAAAA
AAAAAAAAAAAAAAAAAAAAAAAAAAAAAAAAAAAA
AAAAAAAAAAAAAAAAAAAAAAAAAAAAAAAAAAAA
AAAAAAAAAAAAAAAAAA
AA
AAAAAAAAAAAAAAAAAAAAAAAAAAAAAAAAAAAAAAAA
AAAAAAAAAAAAAAAAAAAAAAAAAAAAAAAAAAAAAAAA
AAAAAAAAAAAAAAAAAAAAAAAAAAAAAAAAAAAAAAAA
D.C.
12.8 to 26.3
26.4 to 28.5
28.6 to 30.3
30.4 to 35.7
Data missing /Sample <50
AAAAAAAAAAAAAAAA
AAAAAAAA
*Overweight: Body mass index (BMI = weight[kg]/height[m2]) ≥27.8 for men and ≥27.3 forwomen.
Percent
FIGURE 1a. Prevalence of overweight* among white men — Behavioral Risk FactorSurveillance System, 1994
AA
AA
A
AA
AA
A
AAAAAAAAAAAAAAAAAAAAAAAAAAAAAAAAAAAAAAAAAAAAAAAAAAAAAAAAAAAAAAAAAAAAAAAAAAAAAAAAAAAAAAAAAAAAAAAAAAAA
AAAAAAAAAAAAAAAAAAAAAAAAAAAAAAAAAAAAAAAAAAAAAAAAAAAAAAAAAAAAAAAAAAAAAAAAAAAAAAAAAAAAAAAAAAAAAAAAAAAA
AAAAAAAAAAAAAAAAAAAAAAAAAAAAAAAAAAAAAAAAAAAAAAAAAAAAAAAAAAAAAAAAAAAAAAAAAAAAAAAAAAAAAAAAAAAAAAAAAAAA
AAAAAAAAAAAAAAAAAAAAAAAAAAAAAAAAAAAAAAAAAAAAAAAAAA
AAAAAAAAAAAAAAAAAAAAAAAAAAAAAAAAAAAAAAAAAAAA
AAAAAAAAAAAAAAAAAAAAAAAAAAAAAAAAAAAAAAAAAAAA
AAAAAAAAAAAAAAAAAAAAAA
AAAAAAAAAAAAAAAAAAAAAAAAAAAAAAAAAAAAAAAAAAAAAAAAAAAAAAAA
AAAAAAAAAAAAAAAAAAAAAAAAAAAAAAAAAAAAAAAAAAAAAAAAAAAAAAAA
AAA
AAAAAAAAAAAAAAAAAAAA
AAAAAAAAAAAAAAAAAAAA
AAAAAAAAAAAAAAAAAAAAAAAAAAAAAAAAAAAAAAAAAAAAAAAAAA
AAAAAAAAAAAAAAAAAAAAAAAAAAAAAAAAAAAA
AAAAAAAAAAAAAAAAAAAAAAAAAAAAAAAA
AAAAAAAAAAAAAAAAAAAAAAAAAAAAAAAA
AAAAAAAAAAAAAAAAAAAAAAAAAAAAAAAA
AAAAAAAAAAAAAAAAAAAAAAAAAAAAAAAAAAAAAAAAAAAAAAAAAAAAAAAAAAAAAAAAAAAAAAAA
AAAAAAAAAAAAAAAAAAAAAAAAAAAAAAAAAAAAAAAAAAAAAAAAAAAAAAAAAAAAAAAAAAAAAAAA
AAAAAAAAAAAAAAAAAAAAAAAAAAAAAAAAAAAAAAAAAAAAAAAAAAAAAA
AAAAAA
AAAAAAAAAAAAAAAAAAAAAAAAAAAAAAAAAAAAAAAAAAAAAAAA
AAAAAAAAAAAAAAAAAAAAAAAAAAAAAAAAAAAAAAAAAAAAAAAA
AAAAAAAAAAAAAAAAAAAAAAAAAAAAAAAAAAAAAAAAAAAAAAAA
AAAAAAAAAAAAAAAAAAAAAAAA
AAAAAAAAAAAAAAAAAAAAAAAAAAAAAAAAAAAA
AAAAAAAAAAAAAAAAAAAAAAAAAAAAAAAAAAAA
AAAAAAAAAAAAAAAAAAAAAAAAAAAAAAAAAAAA
AAAAAAAAAAAAAAAAAAAAAAAAAAA
AAAAAAAAA
AAAAAAAAAAAAAAAAAAAAAAAA
10.6 to 23.0
23.1 to 24.8
24.9 to 26.7
26.8 to 31.0
Data missing /
Sample <50
AAAAAAAAAAAAAAAA
AAAAAAAA
D.C.
*Overweight: Body mass index (BMI = weight[kg]/height[m2]) ≥27.8 for men and ≥27.3 forwomen.
Percent
FIGURE 1b. Prevalence of overweight* among white women — Behavioral Risk FactorSurveillance System, 1994
54 MMWR December 11, 1998
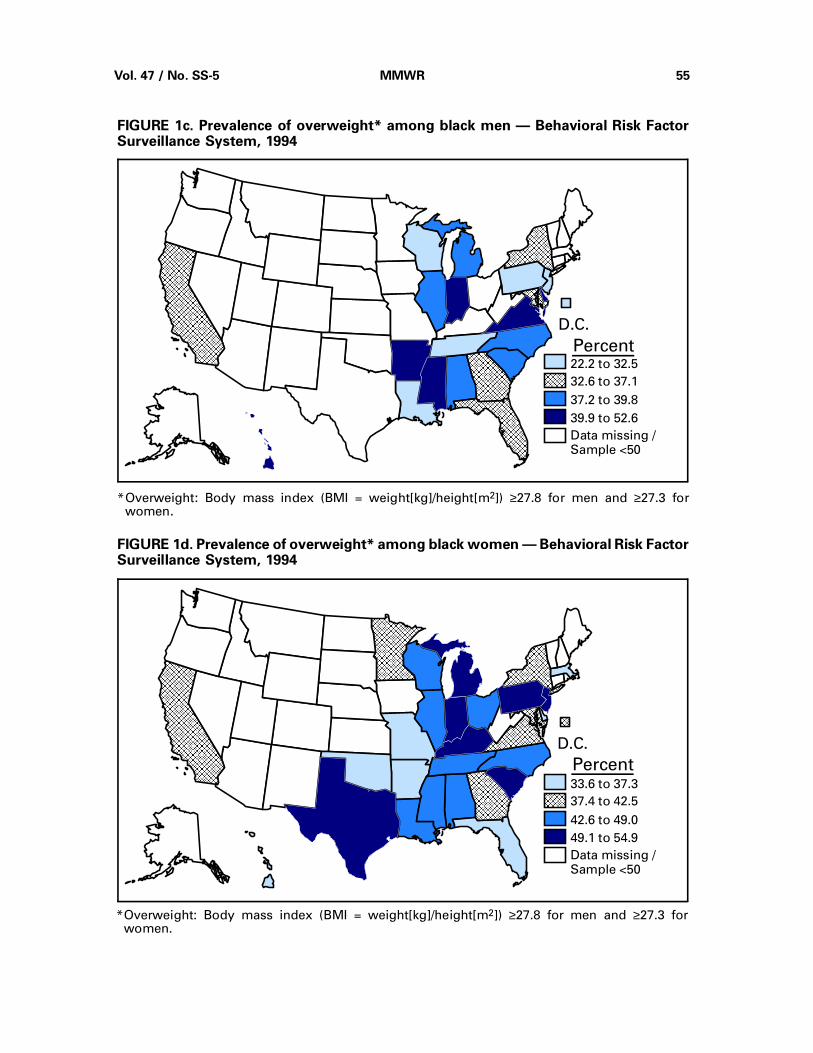
22.2 to 32.5
32.6 to 37.1
37.2 to 39.8
39.9 to 52.6
Data missing /Sample <50
AAAAAAAAAAAA
AAAAAA
D.C.AA
AA
A
AA
AA
A
AAAAAAAAAAAAAAAAAAAAAAAAAAAAAAAAAAAAAAAAAAAAAAAAAAAAAAAAAAAAAAAAAAAAAAAAAAAAAAAAAAAAAAAAAAAAAAAAAAAA
AAAAAAAAAAAAAAAAAAAAAAAAAAAAAAAAAAAAAAAAAAAAAAAAAAAAAAAAAAAAAAAAAAAAAAAAAAAAAAAAAAAAAAAAAAAAAAAAAAAA
AAAAAAAAAAAAAAAAAAAAAAAAAAAAAAAAAAAAAAAAAAAAAAAAAAAAAAAAAAAAAAAAAAAAAAAAAAAAAAAAAAAAAAAAAAAAAAAAAAAA
AAAAAAAAAAAAAAAAAAAAAAAAAAAAAAAAAAAAAAAAAAAAAAAAAA
AAAAA
AAAA
AAAAAAAAAA
AAAAAAAAAAAAAAAAAAAAAAAAAAAAAAAAAAAAAAAAAAAAAAAAAAAA
AAAAAAAAAAAAAAAAAAAAAAAAAAAAAAAAAAAAAAAAAAAAAAAAAAAAAAAA
AAAAAAAAAAAAAAAAAAAAAAAAAAAAAAAAAAAAAAAAAAAAAAAAAAAAAAAA
AAAAAAAAAAAAAAAAAAAAAAAAAAAAAAAAAAAAAAAAAAAAAAAAAAAAAAAA
AAAAAAAAAAAAAAAAAAAAAAAAAAAAAAAAAAAAAAAAAAAA
AAAAAAAAAAAAAAAAAAAAAAAAAAAAAAAAAAAAAAAAAAAA
AAAAAAAAAAAAAAAAAAAAAA
AAA
AAAAAAAAAAAAAAAAAAAA
AAAAAAAAAAAAAAAAAAAA
AAAAAA
AAAAAAAAAAAAAAAAAAAAAAAAAAAAAAAAAAAAAAAAAAAAAAAA
AAAAAAAAAAAAAAAAAAAAAAAAAAAAAAAAAAAAAAAAAAAAAAAA
AAAAAAAAAAAAAAAAAAAAAAAAAAAAAAAAAAAAAAAAAAAAAAAA
AAAAAAAAAAAAAAAAAAAAAAAA
*Overweight: Body mass index (BMI = weight[kg]/height[m2]) ≥27.8 for men and ≥27.3 forwomen.
Percent
FIGURE 1c. Prevalence of overweight* among black men — Behavioral Risk FactorSurveillance System, 1994
33.6 to 37.3
37.4 to 42.5
42.6 to 49.0
49.1 to 54.9
Data missing /Sample <50
AAAAAAAAAAAAAAAA
AAAAAAAA
D.C.AA
AA
A
AA
AA
A
AAAAAAAAAAAAAAAAAAAAAAAAAAAAAAAAAAAAAAAAAAAAAAAAAAAAAAAAAAAAAAAAAAAAAAAAAAAAAAAAAAAAAAAAAAAAAAAAAAAA
AAAAAAAAAAAAAAAAAAAAAAAAAAAAAAAAAAAAAAAAAAAAAAAAAAAAAAAAAAAAAAAAAAAAAAAAAAAAAAAAAAAAAAAAAAAAAAAAAAAA
AAAAAAAAAAAAAAAAAAAAAAAAAAAAAAAAAAAAAAAAAAAAAAAAAAAAAAAAAAAAAAAAAAAAAAAAAAAAAAAAAAAAAAAAAAAAAAAAAAAA
AAAAAAAAAAAAAAAAAAAAAAAAAAAAAAAAAAAAAAAAAAAAAAAAAA
AAAAAAAAAAAAAAAAAAAAAAAAAAAAAAAAAAAAAAAAAAAA
AAAAAAAAAAAAAAAAAAAAAAAAAAAAAAAAAAAAAAAAAAAA
AAAAAAAAAAAAAAAAAAAAAA
AAAAA
AAAAAAAAAAAAAAAAAAAA
AAAAAAAAAAAAAAAAAAAA
AAAAAAAAAAAAAAAAAAAAAAAAAAAAAAAAAAAAAAAAAAAAAAAAAAAAAAAA
AAAAAAAAAAAAAAAAAAAAAAAAAAAAAAAAAAAAAAAAAAAAAAAAAAAAAAAA
AAAAAAAAAAAAAAAAAAAAAAAAAAAAAAAAAAAAAAAAAA
AAAAAA
AAAAAAAAAAAAAAAAAAAAAAAAAAAAAAAAAAAAAAAAAAAA
AAAAAAAAAAAAAAAAAAAAAAAAAAAAAAAAAAAAAAAAAAAA
AAAAAAAAAAAAAAAAAAAAAAAAAAAAAAAAAAAAAAAAAAAA
AAAAAAAAAAAAAAAAAAAAAA
A
AAAAAAAA
AAAAAAAAAAAAAAAAAAAAAAAAAAAAAAAAAAAA
AAAAAAAAAAAAAAAAAAAAAAAAAAAAAAAAAAAA
AAAAAAAAAAAAAAAAAAAAAAAAAAAAAAAAAAAA
AAAAAAAAAAAAAAAAAA
AAAAAAAAA
*Overweight: Body mass index (BMI = weight[kg]/height[m2]) ≥27.8 for men and ≥27.3 forwomen.
Percent
FIGURE 1d. Prevalence of overweight* among black women — Behavioral Risk FactorSurveillance System, 1994
Vol. 47 / No. SS-5 MMWR 55
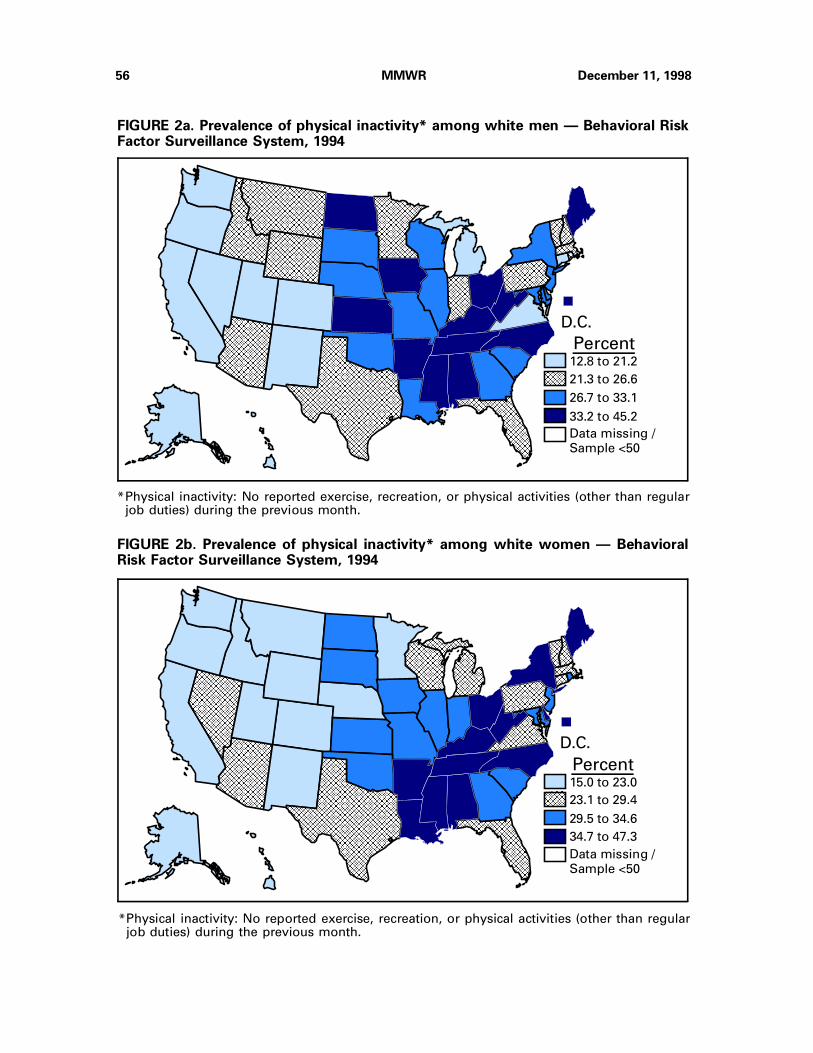
12.8 to 21.2
21.3 to 26.6
26.7 to 33.1
33.2 to 45.2
Data missing /
Sample <50
AAAAAAAAAAAAAAAA
AAAAAAAA
D.C.
AAAAAAAAAAAAAAAAAAAAAAAAAAAAAAAAAAAAAAAAAAAAAAAAAAAAAAAAAAAAAAAA
AAAAAAAAAAAAAAAAAAAAAAAAAAAAAAAAAAAAAAAAAAAAAAAAAAAAAAAAAAAAAAAA
AAAAAAAAAAAAAAAAAAAAAAAAAAAAAAAAAAAAAAAAAAAAAAAAAAAAAAAAAAAAAAAA
AAAA
AAAA
AAAAAAAA
AAAAAAAAAAAAAAAAAAAAAAAAAAAAAAAAAAAAAAAAAAAAAAAAAAAA
AAAAAAAAAAAAAAAAAAAAAAAAAAAAAAAAAAAAAAAAAAAAAAAAAAAAAAAA
AAAAAAAAAAAAAAAAAAAAAAAAAAAAAAAAAAAAAAAAAAAAAAAAAAAAAAAA
AAAAAAAAAAAAAAAAAAAAAAAAAAAAAAAAAAAAAAAAAAAAAAAAAAAAAAAA
AAAAAAAAAAAAAAAAAAAAAAAAAAAAAAAAAAAAAAAAAAAAAAAAAAAAAAAAAAAAAAAAAAAAAAAA
AAAAAAAAAAAAAAAAAAAAAAAAAAAAAAAAAAAAAAAAAAAAAAAAAAAAAAAAAAAAAAAAAAAAAAAA
AAAAAAAAAAAAAAAAAAAAAAAAAAAAAAAAAAAAAAAAAAAAAAAAAAAAAA
AAAAAAAAAAAAAAAAAAAAAAAAAAAAAAAAAAAAAAAAAAAA
AAAAAAAAAAAAAAAAAAAAAA
AAAAAAAAAAAAAAAAAAA
AAAAAAAAAAAA
AAAAAAAAAAAAAAAAAAAAAAAAAAAAAAAAAAAAAAAAAAAAAAAAAAAAAAAA
AAAAAAAAAAAAAAAAAAAAAAAAAAAAAAAAAAAAAAAAAAAAAAAAAAAAAAAA
AAAAAAAAAAAAAAAAAAAAAAAAAAAAAAAAAAAAAAAAAAAAAAAAAAAAAAAA
AAAAAAAAAAAAAAAAAAAAAAAAAAAAAAAAAAAAAAAAAAAAAAAAAAAA
AAAAAAAAAAAAAAAAAAAAAAAAAAAAAAAAAAAAAAAAAAAAAAAAAAAA
AAAAAAAAAAAAAAAAAAAAAAAAAAAAAAAAAAAAAAAAAAAAAAAAAAAA
AAAAAAAAAAAAAAAAAAAAAAAAAAAAAAAAAAAAAAAAAAAAAAAAAAAA
AAAAAAAAAAAAAAAAAAAAAAAAAA
AAAAAAAAAAAAAAAAAAAAAAAAAAAA
AAAAAAAAAAAAAAAAAAAAAAAAAAAAAAAA
AAAAAAAAAAAAAAAAAAAAAAAAAAAAAAAA
AAAAAAAAAAAAAAAAAAAAAAAA
AAAAAAAAA
AAAAAAAAAAAAAAAAAAAAAAAAAAAAAAAAAAAAAAAAAAAAAAAAAAAAAAAAAAAAAAAAAAAAAAAAAAAAAAAAAAAAAAAAAAAAAAAAAAAAAAAA
AAAAAAAAAAAAAAAAAAAAAAAAAAAAAAAAAAAAAAAAAAAAAAAAAAAAAAAAAAAAAAAAAAAAAAAAAAAAAAAAAAAAAAAAAAAAAAAAAAAAAAAA
AAAAAAAAAAAAAAAAAAAAAAAAAAAAAAAAAAAAAAAAAAAAAAAAAAAAAAAAAAAAAAAAAAAAAAAAAAAAAAAAAAAAAAAAAAAAAAAAAAAAAAAA
AAAAAAAAAAAAAAAAAAAAAAAAAAAAAAAAAAAAAAAAAAAAAAAAAAAAAAAAAAAAAAAAAAAAAAAAAAAAAAAAAAAAAAAAAAAAAAAAAAAAAAAA
AAAAAAAAAAAAAAAAAAAAAAAAAAAAAAAAAAAAAAAAAAAAAAAAAAAAAAAAAAAAAAAAAAAAAAAAAAAAAAAAAAAAAAAAAAAAAAAAAAAAAAAA
AAAAAAAAAAAAAAAAAAAAAAAAAAAAAAAAAAAAAAAAAAAAAAAAAAAAAAAAAAAAAAAAAAAAAAAAAAAAAAAAAAAAAAAAAAAAAAAAAAAAAAAA
AAAAAAAAAAAAAAAAAAAAAAAAAAAA
AAAAAAAAAAAAAAAAAAAAAAAAAAAAAAAAAAAAAAAAAAAA
AAAAAAAAAAAAAAAAAAAAAAAAAAAAAAAAAAAAAAAAAAAA
AAAAAAAAAAAAAAAAAAAAAAAAAAAAAAAAAAAAAAAAAAAA
AAAAAAAAAAA
*Physical inactivity: No reported exercise, recreation, or physical activities (other than regularjob duties) during the previous month.
Percent
FIGURE 2a. Prevalence of physical inactivity* among white men — Behavioral RiskFactor Surveillance System, 1994
15.0 to 23.0
23.1 to 29.4
29.5 to 34.6
34.7 to 47.3
Data missing /
Sample <50
AAAAAAAAAAAAAAAA
AAAAAAAA
D.C.
AAAAAAAAAAAAAAAAAAAAAAAAAAAAAAAAAAAAAAAAAAAAAAAAAAAAAAAAAAAA
AAAAAAAAAAAAAAAAAAAAAAAAAAAAAAAAAAAAAAAAAAAAAAAAAAAAAAAAAAAA
AAAAAAAAAAAAAAAAAAAAAAAAAAAAAAAAAAAAAAAAAAAAAAAAAAAAAAAAAAAA
AAAAAAAAAAAAAAAA
AAAAAA
AAAA
AAAAAAAAAAAAAAAAAAAAAAAAAAAAAAAAAAAAAAAAAAAAAAAAAAAAAA
AAAAAAAAAAAAAAAAAAAAAAAAAAAAAAAAAAAAAAAAAAAAAAAAAAAA
AAAAAAAAAAAAAAAAAAAAAAAAAAAAAAAAAAAAAAAAAAAAAAAAAAAA
AAAAAAAAAAAAAAAAAAAAAAAAAAAAAAAAAAAAAAAAAAAAAAAAAAAA
AAAAAAAA
AAAAAAAAAAAA
AAAAAAAAAAAA
AAAAAAA
AAAAAAAAAAAAAAAAAAAAAAAAAAAA
AAAAAAAAAAAAAAAAAAAAAAAAAAAA
AAAAAAAAAAAAAAAAAAAAAAAAAAAA
AAAAAAAAAAAAAAAAAAAAAAAAAAAAAAAAAAAAAAAA
AAAAAAAAAAAAAAAAAAAAAAAAAAAAAAAAAAAAAAAA
AAAAAAAAAAAAAAAAAAAAAAAAAAAA
AAAAAAAAAAAAAAAAAAAAAAAAAAAAAAAAAAAAAAAAAAAAAAAAAAAAAAAAAAAAAAAAAAAAAAAA
AAAAAAAAAAAAAAAAAAAAAAAAAAAAAAAAAAAAAAAAAAAAAAAAAAAAAAAAAAAAAAAAAAAAAAAA
AAAAAAAAAAAAAAAAAAAAAAAAAAAAAAAAAAAAAAAAAAAAAAAAAAAAAAAAAAAAAAAAAAAAAAAA
AAAAAAAAAAAAAAAAAAAAAAAAAAAA
AAAAAAAAAAAAAAAAAAAAAAAAAAAA
AAAAAAAAAAAAAAAAAAAAA
AAAAAAAAAAAAAAAAAAAAAAAAAAAAAAAAAAAAAAAAAAAAAAAAAAAAAAAAAAAAAAAAAAAAAAAAAAAAAAAAAAAAAAAAAAAAAAAAAAAA
AAAAAAAAAAAAAAAAAAAAAAAAAAAAAAAAAAAAAAAAAAAAAAAAAAAAAAAAAAAAAAAAAAAAAAAAAAAAAAAAAAAAAAAAAAAAAAAAAAAA
AAAAAAAAAAAAAAAAAAAAAAAAAAAAAAAAAAAAAAAAAAAAAAAAAAAAAAAAAAAAAAAAAAAAAAAAAAAAAAAAAAAAAAAAAAAAAAAAAAAA
AAAAAAAAAAAAAAAAAAAAAAAAAAAAAAAAAAAAAAAAAAAAAAAAAAAAAAAAAAAAAAAAAAAAAAAAAAAAAAAAAAAAAAAAAAAAAAAAAAAA
AAAAAAAAAAAAAAAAAAAAAAAAAAAAAAAAAAAAAAAAAAAAAAAAAAAAAAAAAAAAAAAAAAAAAAAAAAAAAAAAAAAAAAAAAAAAAAAAAAAA
AAAAAAAAAAAAAAAAAAAAAAAAAAAAAAAAAAAAAAAAAAAAAAAAAAAAAAAAAAAAAAAAAAAAAAAAAAAAAAAAAAAAAAAAAAAAAAAAAAAA
A
AAAAAAAA
AAAAAAAAAAAAAAAAAAAAAAAAAAAAAAAAAAAA
AAAAAAAAAAAAAAAAAAAAAAAAAAAAAAAAAAAA
AAAAAAAAAAAAAAAAAAAAAAAAAAAAAAAAAAAA
AAAAAAAAAAAAAAAAAA
AAAAAAAAAAAAAAAAAAAAAAAAAA
AAAAAAAAAAAAAAAAAAAAAAAAAAAAAAAAAAAAAAAAAAAA
AAAAAAAAAAAAAAAAAAAAAAAAAAAAAAAAAAAAAAAAAAAA
AAAAAAAAAAAAAAAAAAAAAA
*Physical inactivity: No reported exercise, recreation, or physical activities (other than regularjob duties) during the previous month.
Percent
FIGURE 2b. Prevalence of physical inactivity* among white women — BehavioralRisk Factor Surveillance System, 1994
56 MMWR December 11, 1998

20.2 to 26.3
26.4 to 31.5
31.6 to 37.3
37.4 to 50.3
Data missing /Sample <50
AAAAAAAAAAAAAAAA
AAAAAAAA
D.C.AAAA
AA
A
AA
AA
AA
AAAAAAAAAAAAAAAAAAAAAAAAAAAAAAAAAAAAAAAAAAAAAAAAAAAAAAAAAAAAAAAAAAAAAAAAAAAAAAAAAAAAAAAAAAAAAAAAAAAAAAAA
AAAAAAAAAAAAAAAAAAAAAAAAAAAAAAAAAAAAAAAAAAAAAAAAAAAAAAAAAAAAAAAAAAAAAAAAAAAAAAAAAAAAAAAAAAAAAAAAAAAAAAAA
AAAAAAAAAAAAAAAAAAAAAAAAAAAAAAAAAAAAAAAAAAAAAAAAAAAAAAAAAAAAAAAAAAAAAAAAAAAAAAAAAAAAAAAAAAAAAAAAAAAAAAAA
AAAAAAAAAAAAAAAAAAAAAAAAAAAAAAAAAAAAAAAAAAAAAAAAAAAA
AAAAAAAAAAAAAAAAAAAAAAAAAAAAAAAAAAAAAAAAAAAAAAAAAAAAAAAA
AAAAAAAAAAAAAAAAAAAAAAAAAAAAAAAAAAAAAAAAAAAAAAAAAAAAAAAA
AA
AA
AAAAAAAAAAAAAAAAAAAAAAAAAAAAAAAAAAAAAAAA
AAAAAAAAAAAAAAAAAAAAAAAAAAAAAAAAAAAAAAAA
AAAAAAAAAAAAAAAAAAAA
AAAAA
AAAAAAAAAAAAAAAAAAAA
AAAAAAAAAAAAAAAAAAAA
AAAAA
AA
AAAAAAAA
AAAAAAAAAAAAAAAAAAAAAAAAAAAAAAAAAAAA
AAAAAAAAAAAAAAAAAAAAAAAAAAAAAAAAAAAA
AAAAAAAAAAAAAAAAAAAAAAAAAAAAAAAAAAAA
AAAAAAAAAAAAAAAAAA
*Physical inactivity: No reported exercise, recreation, or physical activities (other than regularjob duties) during the previous month.
Percent
FIGURE 2c. Prevalence of physical inactivity* among black men — Behavioral RiskFactor Surveillance System, 1994
19.2 to 39.1
39.2 to 43.1
43.2 to 46.9
47.0 to 62.9
Data missing /Sample <50
AAAAAAAAAAAAAAAA
AAAAAAAA
D.C.
AAAAAAAAAAAAAAAA
AAAAAA
AAAA
AAAAAAAAAAAAAAAAAAAAAAAAAAAAAAAAAAAAAAAAAAAAAAAAAAAAAA
AAAAAAAAAAAAAAAAAAAAAAAAAAAAAAAAAAAAAAAAAAAAAAAAAAAA
AAAAAAAAAAAAAAAAAAAAAAAAAAAAAAAAAAAAAAAAAAAAAAAAAAAA
AAAAAAAAAAAAAAAAAAAAAAAAAAAAAAAAAAAAAAAAAAAAAAAAAAAA
AAAA
AAAAAAAAAAAAAAAAAAAA
AAAAAAAAAAAAAAAAAAAA
AAAAA
AAAAAAA
AAAAAAAAAAAAAAAAAAAAAAAAAAAA
AAAAAAAAAAAAAAAAAAAAAAAAAAAA
AAAAAAAAAAAAAAAAAAAAAAAAAAAA
AAAAAAAAAAAAAAAAAAAAAAAAAAAAAAAAAAAAAAAA
AAAAAAAAAAAAAAAAAAAAAAAAAAAAAAAAAAAAAAAA
AAAAAAAAAAAAAAAAAAAAAAAAAAAAAAAAAAAAAAAA
AAAAAAAAAAAAAAAAAAAAAAAAAAAAAAAAAAAAAAAA
AAAAAAAAAAAAAAAAAAAAAAAAAAAA
AAAAAAAAAAAAAAAAAAAAAAAAAAAA
AAAAAAAAAAAAAAAAAAAAA
AA
AAAAAAAAAAAAAAAAAAAAAAAAAAAAAAAAAAAAAAAAAAAA
AAAAAAAAAAAAAAAAAAAAAAAAAAAAAAAAAAAAAAAAAAAA
AAAAAAAAAAAAAAAAAAAAAA
*Physical inactivity: No reported exercise, recreation, or physical activities (other than regularjob duties) during the previous month.
Percent
FIGURE 2d. Prevalence of physical inactivity* among black women — BehavioralRisk Factor Surveillance System, 1994
Vol. 47 / No. SS-5 MMWR 57
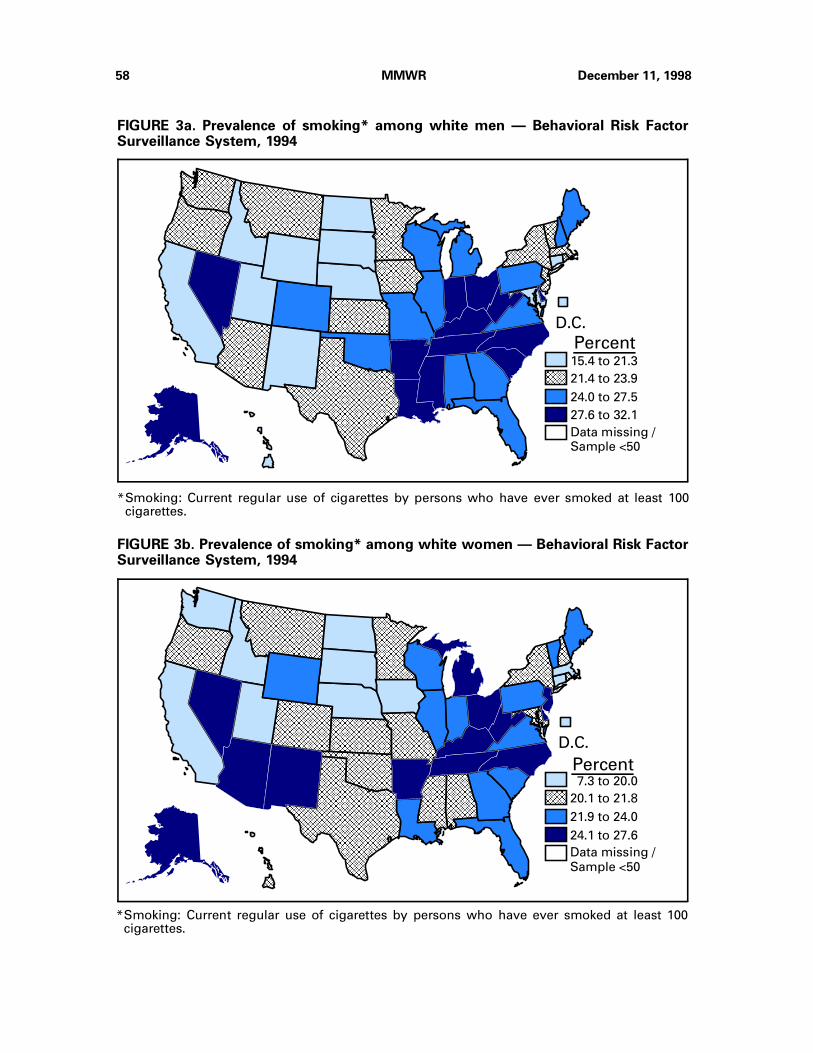
*Smoking: Current regular use of cigarettes by persons who have ever smoked at least 100cigarettes.
15.4 to 21.3
21.4 to 23.9
24.0 to 27.5
27.6 to 32.1
Data missing /Sample <50
AAAAAAAAAAAAAAAA
AAAA
D.C.
AAAAAAAAAAAAAAAAAAAAAAAAAAAAAAAAAAAAAAAAAAAAAAAAAAAAAAAAAAAA
AAAAAAAAAAAAAAAAAAAAAAAAAAAAAAAAAAAAAAAAAAAAAAAAAAAAAAAAAAAA
AAAAAAAAAAAAAAAAAAAAAAAAAAAAAAAAAAAAAAAAAAAAAAAAAAAAAAAAAAAA
AAAAAAAAAAAAAAAAAAAAAAAAAAAAAAAA
AAAAAAAAAAAAAAAAAAAAAAAAAAAAAAAA
AAAAAAAAAAAAAAAAAAAAAAAA
AAAAAAAAAAAAAAAAAAAAAAAAAAAAAAAA
AAAAAAAAAAAAAAAAAAAAAAAAAAAAAAAA
AAAAAAAAAAAAAAAAAAAAAAAAAAAAAAAA
AAAAAAAA
AAAAAAAAAAAAAAAAAAA
AAAAAAAAAAAA
AAAAAAAAAAAAAAAAAAAAAAAAAAAAAAAAAAAAAAAAAAAAAAAAAAAAAAAA
AAAAAAAAAAAAAAAAAAAAAAAAAAAAAAAAAAAAAAAAAAAAAAAAAAAAAAAA
AAAAAAAAAAAAAAAAAAAAAAAAAAAAAAAAAAAAAAAAAAAAAAAAAAAAAAAA
AAAAAAAAAAAAAAAAAAAAAAAAAAAAAAAAAAAAAAAAAAAAAAAAAAAA
AAAAAAAAAAAAAAAAAAAAAAAAAAAAAAAAAAAAAAAAAAAAAAAAAAAA
AAAAAAAAAAAAAAAAAAAAAAAAAAAAAAAAAAAAAAAAAAAAAAAAAAAA
AAAAAAAAAAAAAAAAAAAAAAAAAAAAAAAAAAAAAAAAAAAAAAAAAAAA
AAAAAAAAAAAAAAAAAAAAAAAAAA
AAAAAAAAAAAAAAAAAAAAAAAA A
AA
AAAAAAAAAAAAAAAAAAAAAAAAAAAAAAAAAAAAAAAAAAAAAAAA
AAAAAAAAAAAAAAAAAAAAAAAAAAAAAAAAAAAAAAAAAAAAAAAA
AAAAAAAAAAAAAAAAAAAAAAAAAAAAAAAAAAAAAAAAAAAAAAAA
AAAAAAAAAAAA
AAAAAAAAAAAAAAAAAAAAAAAAAAAAAAAAAAAAAAAAAAAAAAAAAAAA
AAAAAAAAAAAAAAAAAAAAAAAAAAAAAAAAAAAAAAAAAAAAAAAAAAAA
AAAAAAAAAAAAAAAAAAAAAAAAAAAAAAAAAAAAAAAAAAAAAAAAAAAA
AAAAAAAAAAAAAAAAAAAAAAAAAA
AAAAAAAAA
AAAAAAAAAAAAAAAAAAAAAAAAAAAAAAAAAAAAAAAAAAAAAAAAAAAAAAAAAAAAAAAAAAAAAAAAAAAAAAAAAAAAAAAAAAAAAAAAAAAAAAAA
AAAAAAAAAAAAAAAAAAAAAAAAAAAAAAAAAAAAAAAAAAAAAAAAAAAAAAAAAAAAAAAAAAAAAAAAAAAAAAAAAAAAAAAAAAAAAAAAAAAAAAAA
AAAAAAAAAAAAAAAAAAAAAAAAAAAAAAAAAAAAAAAAAAAAAAAAAAAAAAAAAAAAAAAAAAAAAAAAAAAAAAAAAAAAAAAAAAAAAAAAAAAAAAAA
AAAAAAAAAAAAAAAAAAAAAAAAAAAAAAAAAAAAAAAAAAAAAAAAAAAAAAAAAAAAAAAAAAAAAAAAAAAAAAAAAAAAAAAAAAAAAAAAAAAAAAAA
AAAAAAAAAAAAAAAAAAAAAAAAAAAAAAAAAAAAAAAAAAAAAAAAAAAAAAAAAAAAAAAAAAAAAAAAAAAAAAAAAAAAAAAAAAAAAAAAAAAAAAAA
AAAAAAAAAAAAAAAAAAAAAAAAAAAAAAAAAAAAAAAAAAAAAAAAAAAAAAAAAAAAAAAAAAAAAAAAAAAAAAAAAAAAAAAAAAAAAAAAAAAAAAAA
AAAAAAAAAAAAAAAAAAAAAAAA
AAAA
AAAAAAAAAAAAAAAAAAAAAAAAAAAAAAAAAAAAAAAA
AAAAAAAAAAAAAAAAAAAAAAAAAAAAAAAAAAAAAAAA
AAAAAAAAAAAAAAAAAAAAAAAAAAAAAAAAAAAAAAAA
Percent
FIGURE 3a. Prevalence of smoking* among white men — Behavioral Risk FactorSurveillance System, 1994
7.3 to 20.0
20.1 to 21.8
21.9 to 24.0
24.1 to 27.6
Data missing /
Sample <50
AAAAAAAAAAAAAAAA
AAAA
D.C.
AAAAAAAAAAAAAAAAAAAAAAAAAAAAAAAAAAAAAAAAAAAAAAAA
AAAAAAAAAAAAAAAAAAAAAAAAAAAAAAAAAAAAAAAAAAAAAAAA
AAAAAAAAAAAAAAAAAAAAAAAAAAAAAAAAAAAAAAAAAAAAAAAA
AAAAAAAAAAAAAAAAAAAAAAAAAAAAAAAAAAAAAAAAAAAAAAAA
AAAAAAAAAAAAAAAAAAAAAAAAAAAAAAAAAAAAAAAAAAAAAAAA
AAAAAAAAAAAA
AAAA
AAAAAAAA
AA
AAAAAA
AAAAAA
AAAAAAAAAAAAAAAA
AAAAAAAAAAAAAAAAAAAAAAAAAAAAAAAA
AAAAAAAAAAAAAAAAAAAAAAAAAAAAAAAA
AAAAAAAAAAAAAAAAAAAAAAAAAAAAAAAA
AAAAAAAAAAAAAAAA
AAA
AAAAAAAAAAAAAAAAAAAA
AAAAAAAAAAAAAAAAAAAA
AAAAAAAAAAAAAAAAAAAAAAAAAAAAAAAAAAAAAAAAAAAAAAAAAAAAAAAA
AAAAAAAAAAAAAAAAAAAAAAAAAAAAAAAAAAAAAAAAAAAAAAAAAAAAAAAA
AAAAAAAAAAAAAAAAAAAAAAAAAAAAAAAAAAAAAAAAAAAAAAAAAAAAAAAA
AAAAAAAAAAAAAAAAAAAAAAAAAAAAAAAAAAAAAAAAAAAA
AAAAAAAAAAAAAAAAAAAAAAAAAAAAAAAAAAAAAAAAAAAA
AAAAAAAAAAAAAAAAAAAAAAAAAAAAAAAAAAAAAAAAAAAA
AAAAAAAAAAAAAAAAAAAAAAAAAAAAAAAAAAAAAAAAAAAAAAAAAA
AAAAAAAAAAAAAAAAAAAAAAAAAAAAAAAAAAAA
AAAAAAAAAAAAAAAAAAAAAAAAAAAAAAAAAAAAAAAAAAAAAAAAAAAA
AAAAAAAAAAAAAAAAAAAAAAAAAAAAAAAAAAAAAAAAAAAAAAAAAAAA
AAAAAAAAAAAAAAAAAAAAAAAAAAAAAAAAAAAAAAAAAAAAAAAAAAAA
AAAAAAAAAAAAAAAAAAAAAAAAAAAAAAAAAAAAAAAAAAAAAAAAAAAA
AAAAAAAAAAAAAAAAAAAAAAAAAA
AAAAAAAAAAAAAAAAAAAAAAAAAAAA
AAAAA
AAAAAAAAAAAAAAAAAAAAAAAAAAAAAAAAAAAAAAAAAAAAAAAA
AAAAAAAAAAAAAAAAAAAAAAAAAAAAAAAAAAAAAAAAAAAAAAAA
AAAAAAAAAAAAAAAAAAAAAAAAAAAAAAAAAAAAAAAAAAAAAAAA
AAAAAAAAAAAA
AAAAAAAAAAAAAAAAAAAAAAAAAAAAAAAAAAAA
AAAAAAAAAAAAAAAAAAAAAAAAAAAAAAAAAAAA
AAAAAAAAAAAAAAAAAAAAAAAAAAAAAAAAAAAA
AAAAAAAAAAAAAAAAAAAAAAAAAAA
AAAAAAAAAAAAAAAAAAAAAAAAAAAAAAAAAAAAAAAAAAAAAAAAAAAA
AAAAAAAAAAAAAAAAAAAAAAAAAAAAAAAAAAAAAAAAAAAAAAAAAAAA
AAAAAAAAAAAAAAAAAAAAAAAAAAAAAAAAAAAAAAAAAAAAAAAAAAAA
AAAAAAAAAAAAAAAAAAAAAAAAAAAAAAAAAAAAAAA
AAAAAAAAA
AAAAAAAAAAAAAAAAAAAAAAAAAAAAAAAAAAAAAAAAAAAAAAAAAAAAAAAAAAAAAAAAAAAAAAAAAAAAAAAAAAAAAAAAAAAAAAAAAAAA
AAAAAAAAAAAAAAAAAAAAAAAAAAAAAAAAAAAAAAAAAAAAAAAAAAAAAAAAAAAAAAAAAAAAAAAAAAAAAAAAAAAAAAAAAAAAAAAAAAAA
AAAAAAAAAAAAAAAAAAAAAAAAAAAAAAAAAAAAAAAAAAAAAAAAAAAAAAAAAAAAAAAAAAAAAAAAAAAAAAAAAAAAAAAAAAAAAAAAAAAA
AAAAAAAAAAAAAAAAAAAAAAAAAAAAAAAAAAAAAAAAAAAAAAAAAAAAAAAAAAAAAAAAAAAAAAAAAAAAAAAAAAAAAAAAAAAAAAAAAAAA
AAAAAAAAAAAAAAAAAAAAAAAAAAAAAAAAAAAAAAAAAAAAAAAAAAAAAAAAAAAAAAAAAAAAAAAAAAAAAAAAAAAAAAAAAAAAAAAAAAAA
AAAAAAAAAAAAAAAAAAAAAAAAAAAAAAAAAAAAAAAAAAAAAAAAAAAAAAAAAAAAAAAAAAAAAAAAAAAAAAAAAAAAAAAAAAAAAAAAAAAA
*Smoking: Current regular use of cigarettes by persons who have ever smoked at least 100cigarettes.
Percent
FIGURE 3b. Prevalence of smoking* among white women — Behavioral Risk FactorSurveillance System, 1994
58 MMWR December 11, 1998
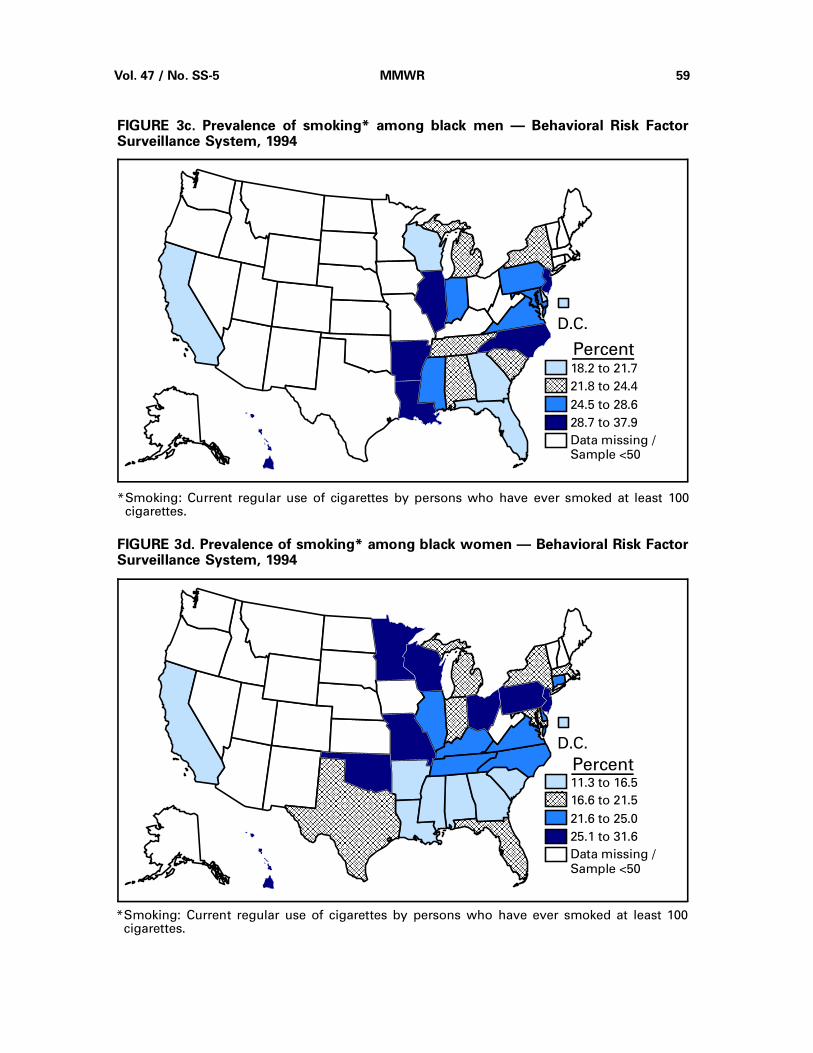
18.2 to 21.7
21.8 to 24.4
24.5 to 28.6
28.7 to 37.9
Data missing /Sample <50
AAAAAAAAAAAA
AAA
D.C.
AAAAAAAAAAAAAAAAAAAAAAAAAAAAAAAAAAAAAAAAAAAAAAAA
AAAAAAAAAAAAAAAAAAAAAAAAAAAAAAAAAAAA
AAAAAAA
AAAAAAAAAAAAAAAAAAAAAAAAAAAA
AAAAAAAAAAAAAAAAAAAAAAAAAAAA
AAAAAAAAAAAAAAAAAAAAA
AAAAAAAAAAAAAAAAAAAAAAAAAAAAAAAAAAAAAAAA
AAAAAAAAAAAAAAAAAAAAAAAAAAAAAAAAAAAAAAAA
AAAAAA
AAAAAAAAAAAAAAAAAAAAAAAAAAAAAAAAAAAAAAAAAAAAAAAA
AAAAAAAAAAAAAAAAAAAAAAAAAAAAAAAAAAAAAAAAAAAAAAAA
AAAAAAAAAAAAAAAAAAAAAAAAAAAAAAAAAAAAAAAAAAAAAAAA
AAAAAAAAAAAAAAAAAAAAAAAA
AAAAAAAAAAAAAAAAAAAAAAAAAAAA
AAAAAAAAAAAAAAAAAAAAAAAAAAAA
AAAAAAAAAAAAAA
AAAAAAAAAAAAAAAAAAAAAAAAAAAA
AAAAAAAAAAAAAAAAAAAAAAAAAAAA
AAAAAAAAAAAAAAAAAAAAAAAAAAAA
AAAAAAAAAAAAAAAAAAAAAAAAAAAA
*Smoking: Current regular use of cigarettes by persons who have ever smoked at least 100cigarettes.
Percent
FIGURE 3c. Prevalence of smoking* among black men — Behavioral Risk FactorSurveillance System, 1994
11.3 to 16.5
16.6 to 21.5
21.6 to 25.0
25.1 to 31.6
Data missing /
Sample <50
AAAAAAAAAAAAAAAA
AAAA
D.C.
AAAAAA
AAAA
AAAAAAAAAA
AAAAAAAAAAAAAAAAAAAAAAAAAAAAAAAAAAAAAAAAAAAAAAAA
AAAAAAAAAAAAAAAAAAAAAAAAAAAAAAAAAAAAAAAAAAAAAAAAAAAA
AAAAAAAAAAAAAAAAAAAAAAAAAAAAAAAAAAAAAAAAAAAAAAAAAAAA
AAAAAAAAAAAAAAAAAAAAAAAAAAAAAAAAAAAAAAA
AAAAAAAAAAAAAAAAAAAAAAAAAAAAAAAAAAAAAAAA
AAAAAAAAAAAAAAAAAAAA
AAAAAAAA
AAAAAAAAAAAAAAAAAAAA
AAAAAAAAAA
AAA
AAAAAAAAAAAAAAAAAAAA
AAAAAAAAAAAAAAAAAAAA
AAAA
AAAAAAAAAAAAAAAAAAAAAAAA
AAAAAAAAAAAAAAAAAAAAAAAA
AAAAAAAAAAAAAAAAAA
AAAAAAAAAAAAAAAAAAAAAAAAAAAAAAAAAAAAAAAA
AAAAAAAAAAAAAAAAAAAAAAAAAAAAAAAAAAAAAAAA
AAAA
AAAAAAAAAAAAAAAAAAAAAAAAAAAAAAAAAAAAAAAAAAAA
AAAAAAAAAAAAAAAAAAAAAAAAAAAAAAAAAAAAAAAAAAAA
AAAAAAAAAAAAAAAAAAAAAAAAAAAAAAAAAAAAAAAAAAAA
AAAAAAAAAAAAAAAAAAAAAA
AAAAAAAAAAAAAAAAAAAAAAAAAAAAAAAAAAAAAAAAAAAAAAAAAAAAAAAAAAAAAAAAAAAAAAAAAAAAAAAAAAAAAAAAAAAAAAAAAAAA
AAAAAAAAAAAAAAAAAAAAAAAAAAAAAAAAAAAAAAAAAAAAAAAAAAAAAAAAAAAAAAAAAAAAAAAAAAAAAAAAAAAAAAAAAAAAAAAAAAAA
AAAAAAAAAAAAAAAAAAAAAAAAAAAAAAAAAAAAAAAAAAAAAAAAAAAAAAAAAAAAAAAAAAAAAAAAAAAAAAAAAAAAAAAAAAAAAAAAAAAA
AAAAAAAAAAAAAAAAAAAAAAAAAAAAAAAAAAAAAAAAAAAAAAAAAAAAAAAAAAAAAAAAAAAAAAAAAAAAAAAAAAAAAAAAAAAAAAAAAAAA
AAAAAAAAAAAAAAAAAAAAAAAAAAAAAAAAAAAAAAAAAAAAAAAAAAAAAAAAAAAAAAAAAAAAAAAAAAAAAAAAAAAAAAAAAAAAAAAAAAAA
AAAAAAAAAAAAAAAAAAAAAAAAAAAAAAAAAAAAAAAAAAAAAAAAAAAAAAAAAAAAAAAAAAAAAAAAAAA
*Smoking: Current regular use of cigarettes by persons who have ever smoked at least 100cigarettes.
Percent
FIGURE 3d. Prevalence of smoking* among black women — Behavioral Risk FactorSurveillance System, 1994
Vol. 47 / No. SS-5 MMWR 59
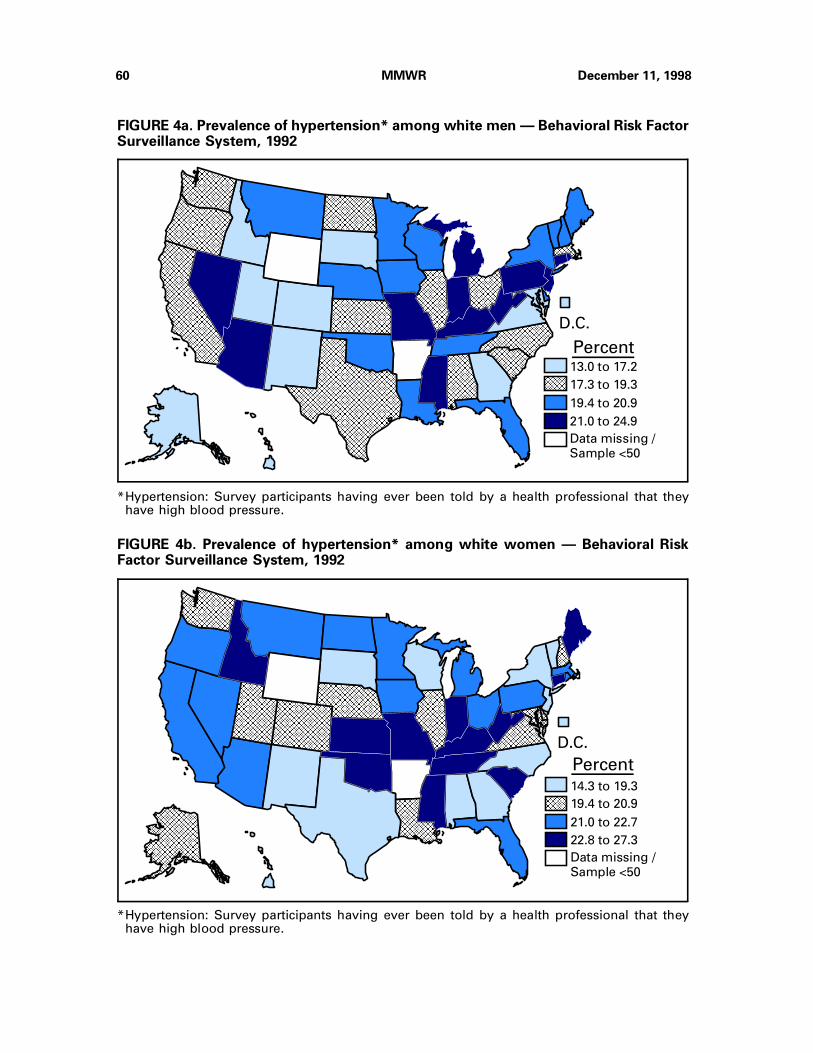
13.0 to 17.2
17.3 to 19.3
19.4 to 20.9
21.0 to 24.9
Data missing /
Sample <50
AAAAAAAAAAAAAAAA
AAAAAAAA
D.C.
AAAAAAAAAAAAAAAAAAAAAAAAAAAAAAAAAAAAAAAAAAAAAAAA
AAAAAAAAAAAAAAAAAAAAAAAAAAAAAAAAAAAAAAAAAAAAAAAA
AA
AA
A
AA
AA
A
AAAAAAAAAAAAAAAAAAAAAAAAAAAAAAAAAAAAAAAAAAAAAAAAAAAAAAAAAAAAAAAAAAAAAAAAAAAAAAAAAAAAAAAAAAAAAAAAAAAA
AAAAAAAAAAAAAAAAAAAAAAAAAAAAAAAAAAAAAAAAAAAAAAAAAAAAAAAAAAAAAAAAAAAAAAAAAAAAAAAAAAAAAAAAAAAAAAAAAAAA
AAAAAAAAAAAAAAAAAAAAAAAAAAAAAAAAAAAAAAAAAAAAAAAAAAAAAAAAAAAAAAAAAAAAAAAAAAAAAAAAAAAAAAAAAAAAAAAAAAAA
AAAAAAAAAAAAAAAAAAAAAAAAAAAAAAAAAAAAAAAAAAAAAAAAAA
AAAAAAAAAAAAAAAAAAAAAAAAAAAAAAAAAAAAAAAAAAAAAAAAAAAAAAAA
AAAAAAAAAAAAAAAAAAAAAAAAAAAAAAAAAAAAAAAAAAAAAAAAAAAAAAAA
AAAAAAAAAAAAAAAAAAAAAAAAAAAAAAAA
AAAAAAAAAAAAAAAAAAAAAAAAAAAAAAAA
AAAAAAAAAAAAAAAAAAAAAAAAAAAAAAAA
AAAAAAAAAAAAAAAA
AAAAAAAAAAAAAAAAAAAA
AAAAAAAAAAAA
AAAAAAAAAAAAAAAAAAAAAAAAAAAAAAAA
AAAAAAAAAAAAAAAAAAAAAAAAAAAAAAAA
AAAAAAAAAAAAAAAAAAAAAAAAAAAAAAAA
AAAAAAAAAAAAAAAAAAAAAAAA
AAAAAAAAAAAAAAAAAAAAAAAAAAAAAAAA
AAAAAAAAAAAAAAAAAAAAAAAAAAAAAAAA
AAAAAAAAAAAAAAAAAAAAAAAAAAAAAAAA
AAAAAAAAAAAAAAAAAAAAAAAAAAAAAAAAAAAAAAAA
AAAAAAAAAAAAAAAAAAAAAAAAAAAAAAAAAAAAAAAA
AAAAAAAAAAAAAAAAAAAAAAAAAAAAAAAAAAAAAAAAAAAAAAAAAAAA
AAAAAAAAAAAAAAAAAAAAAAAAAAAAAAAAAAAAAAAAAAAAAAAAAAAA
AAAAAAAAAAAAAAAAAAAAAAAAAAAAAAAAAAAAAAAAAAAAAAAAAAAA
AAAAAAAAAAAAAAAAAAAAAAAAAAAAAAAAAAAAAAA
AAAAAAAAAAAAAAAAAAAAAAAAAAAA
AAAAAAAAAAAAAAAAAAAAAAAAAAAA
AAAAAAAAAAAAAA
AAAAAAAAAAAAAAAAAAAAAAAAAAAAAAAAAAAAAAAAAAAAAAAAAAAAAAAAAAAAAAAAAAAAAAAAAAAAAAAAAAAAAAAAAAAAAAAAAAAA
AAAAAAAAAAAAAAAAAAAAAAAAAAAAAAAAAAAAAAAAAAAAAAAAAAAAAAAAAAAAAAAAAAAAAAAAAAAAAAAAAAAAAAAAAAAAAAAAAAAA
AAAAAAAAAAAAAAAAAAAAAAAAAAAAAAAAAAAAAAAAAAAAAAAAAAAAAAAAAAAAAAAAAAAAAAAAAAAAAAAAAAAAAAAAAAAAAAAAAAAA
AAAAAAAAAAAAAAAAAAAAAAAAAAAAAAAAAAAAAAAAAAAAAAAAAAAAAAAAAAAAAAAAAAAAAAAAAAAAAAAAAAAAAAAAAAAAAAAAAAAA
AAAAAAAAAAAAAAAAAAAAAAAAAAAAAAAAAAAAAAAAAAAAAAAAAAAAAAAAAAAAAAAAAAAAAAAAAAAAAAAAAAAAAAAAAAAAAAAAAAAA
AAAAAAAAAAAAAAAAAAAAAAAAAAAAAAAAAAAAAAAAAAAAAAAAAAAAAAAAAAAAAAAAAAAAAAAAAAAAAAAAAAAAAAAAAAAAAAAAAAAA
AAAA
AAAAAAAAAAAAAAAAAAAAAAAAAAAAAAAAAAAAAAAA
AAAAAAAAAAAAAAAAAAAAAAAAAAAAAAAAAAAAAAAA
AAAAAAAAAAAAAAAAAAAAAAAAAAAAAAAAAAAAAAAA
*Hypertension: Survey participants having ever been told by a health professional that theyhave high blood pressure.
Percent
FIGURE 4a. Prevalence of hypertension* among white men — Behavioral Risk FactorSurveillance System, 1992
14.3 to 19.3
19.4 to 20.9
21.0 to 22.7
22.8 to 27.3
Data missing /
Sample <50
AAAAAAAAAAAAAAAA
AAAA
D.C.AAAAAAAAAAAAAAAAAAAAAAAAAAAAAAAAAAAAAAAAAAAAAAAA
AAAAAAAAAAAAAAAAAAAAAAAAAAAAAAAAAAAAAAAAAAAAAAAA
AAAAAAAAAAAAAAAAAAAAAAAAAAAAAAAAAAAAAAAAAAAAAAAA
AAAAAAAAAAAA
AAAAAAAAAAAA
AAAAAAAAAAAAAAAAAAAAAAAAAAAAAAAAAAAAAAAAAAAAAAAAAAAAAAAA
AAAAAAAAAAAAAAAAAAAAAAAAAAAAAAAAAAAAAAAAAAAAAAAAAAAAAAAA
A
AAAA
AAAAAAAAAAAAAAAAAAAAAAAAAAAAAAAAAAAAAAAA
AAAAAAAAAAAAAAAAAAAAAAAAAAAAAAAAAAAAAAAA
AAAAAAAAAAAAAAAAAAAAAAAAAAAAAA
AAA
AAAAAAAAAAAAAAAAAAAA
AAAAAAAAAAAAAAAAAAAA
AAAAAAAAAAAAAAAAAAAAAAAAAAAAAAAAAAAA
AAAAAAAAAAAAAAAAAAAAAAAAAAAAAAAAAAAA
AAAAAAAAAAAAAAAAAAAAAAAAAAAAAAAAAAAA
AAAAAAAAAAAAAAAAAA
AAAAAAAAAAAAAAAAAAAAAAAAAAAA
AAAAAAAAAAAAAAAAAAAAAAAAAAAAAAAAAAAAAAAAAAAAAAAAAAAA
AAAAAAAAAAAAAAAAAAAAAAAAAAAAAAAAAAAAAAAAAAAAAAAAAAAA
AAAAAAAAAAAAAAAAAAAAAAAAAA
A
AAAAAAAA
AAAAAAAAAAAAAAAAAAAAAAAAAAAAAAAAAAAA
AAAAAAAAAAAAAAAAAAAAAAAAAAAAAAAAAAAA
AAAAAAAAAAAAAAAAAAAAAAAAAAAAAAAAAAAA
AAAAAAAAAAAAAAAAAA
AAAA
AAAAAAAAAAAAAAAAAAAAAAAAAAAAAAAAAAAA
AAAAAAAAAAAAAAAAAAAAAAAAAAAAAAAAAAAA
AAAAAAAAAAAAAAAAAAAAAAAAAAAAAAAAAAAA
AAAAAAAAA
AAAAAAAAAAAAAAAAAAAAAAAAAAAAAAAAAAAAAAAAAAAAAAAAAAAAAAAAAAAAAAAAAA
AAAAAAAAAAAAAAAAAAAAAAAAAAAAAAAAAAAAAAAAAAAAAAAAAAAAAAAAAAAAAAAA
AAAAAAAAAAAAAAAAAAAAAAAAAAAAAAAAAAAAAAAAAAAAAAAAAAAAAAAAAAAAAAAA
AAAAAAAAAAAAAAAAAAAAAAAAAAAAAAAAAAAAAAAAAAAAAAAAAAAAAAAAAAAAAAAA
AAAAAAAAAAAAAAAAAAAAAAAAAAAAAAAA
AAAAAAAAA
AAAAAA
AAAAAAAA
*Hypertension: Survey participants having ever been told by a health professional that theyhave high blood pressure.
Percent
FIGURE 4b. Prevalence of hypertension* among white women — Behavioral RiskFactor Surveillance System, 1992
60 MMWR December 11, 1998
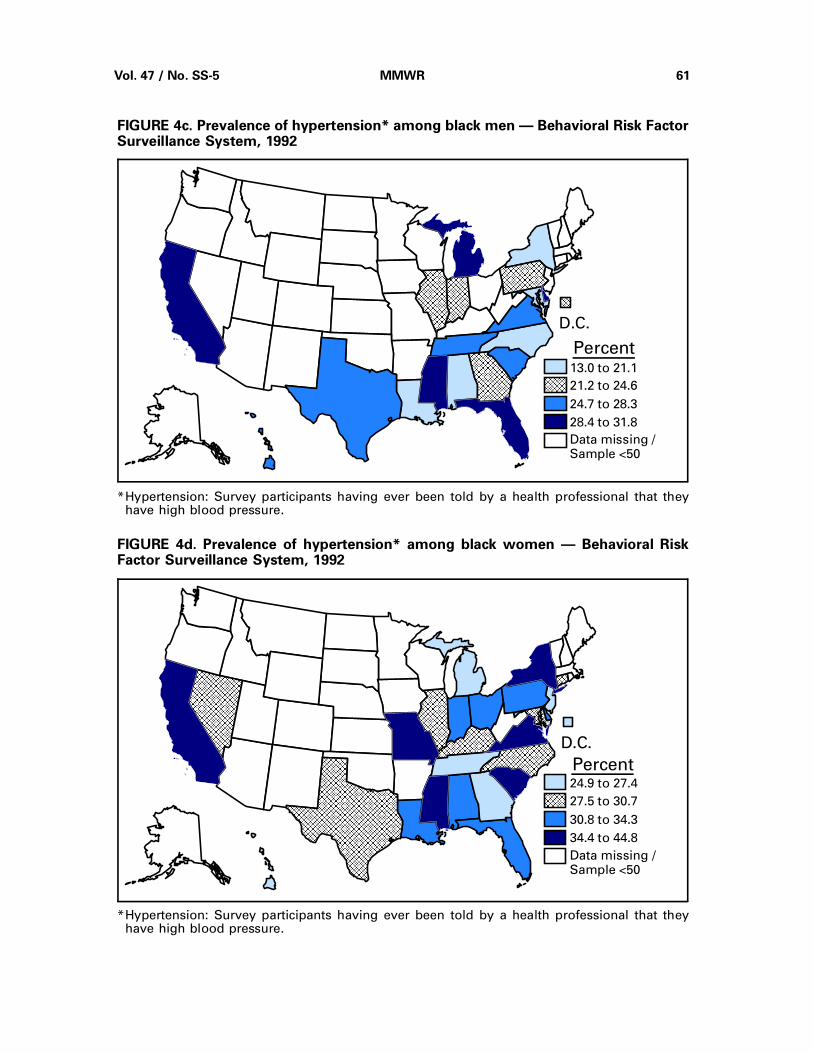
13.0 to 21.1
21.2 to 24.6
24.7 to 28.3
28.4 to 31.8
Data missing /Sample <50
AAAAAAAAAAAAAAAA
AAAAAAAA
D.C.
AAAAAAAAAAAAAAAAAAAAAAAAAAAAAAAAAAAAAAAAAAAA
AAAAAAAAAAAAAAAAAAAAAAAAAAAAAAAAAAAAAAAAAAAA
AAAAAAAAAAAAAAAAAAAAAAAAAAAAAAAAA
AAAAAAAAAAAAAAAAAAAAAAAAAAAAAAAAAAAAAAAAAAAAAAAAAAAAAAAA
AAAAAAAAAAAAAAAAAAAAAAAAAAAAAAAAAAAAAAAAAAAAAAAAAAAAAAAA
AAAAAAAAAAAAAAAAAAAAAAAAAAAAAAAAAAAAAAAA
AAAAAAAAAAAAAAAAAAAA
AAAAAAAAAAAAAAAAAAAAAAAAAAAA
AAAAAAAAAAAAAAAAAAAAAAAAAAAA
AAAAAAAAAAAAAA
AAAAAAAAA
*Hypertension: Survey participants having ever been told by a health professional that theyhave high blood pressure.
Percent
FIGURE 4c. Prevalence of hypertension* among black men — Behavioral Risk FactorSurveillance System, 1992
24.9 to 27.4
27.5 to 30.7
30.8 to 34.3
34.4 to 44.8
Data missing /Sample <50
AAAAAAAAAAAAAAAA
AAAAAAAA
D.C.
AAAAAAAAAAAAAAAA
AAAAAAAAAAAAAAAAAAAAAAAAAAAAAAAAAAAAAAAAAAAAAAAAAAAAAAAA
AAAAAAAAAAAAAAAAAAAAAAAAAAAAAAAAAAAAAAAAAAAAAAAAAAAAAAAA
AAAAAAAAAAAAAAAAAAAAAAAAAAAAA
AAAAAAAAAAAAAAAAAAAAAAAAAAAA
AAAAAAAAAAAAAAAAAAAAAAAAAAAA
AAAAAAA AAAA
AAAAAAAAAAAAAAAAAAAAAA
AAAAAAAAAAAAAAAAAAAA
AAAAA
AAAAAAAAAAAAAAAAAAAAAAAAAAAAAAAA
AAAAAAAAAAAAAAAAAAAAAAAAAAAAAAAA
AAAAAAAAAAAAAAAAAAAAAAAAAAAAAAAA
AAAAAAAAAAAAAAAAAAAAAAAAAAAAAAAA
AAAAAAAAAAAAAAAAAAAAAAAAAAAAAAAAAAAAAAAAAAAAAAAAAAAAAAAAAAAAAAAAAAAAAAAA
AAAAAAAAAAAAAAAAAAAAAAAAAAAAAAAAAAAAAAAAAAAAAAAAAAAAAAAAAAAAAAAAAAAAAAAA
AAAAAAAAAAAAAAAAAAAAAAAAAAAAAAAAAAAAAAAAAAAAAAAAAAAAAAAAAAAAAAAAAAAAAAAA
AAAAAAAAAAAAAAAAAAAAAAAAAAAAAAAAAAAAAAAAAAAAAAAAAAAAAAAAAAAAAAAAAAAAAAAAAAAAAAAAAAAAAAAAAAAAAAAAAAAA
AAAAAAAAAAAAAAAAAAAAAAAAAAAAAAAAAAAAAAAAAAAAAAAAAAAAAAAAAAAAAAAAAAAAAAAAAAAAAAAAAAAAAAAAAAAAAAAAAAAA
AAAAAAAAAAAAAAAAAAAAAAAAAAAAAAAAAAAAAAAAAAAAAAAAAAAAAAAAAAAAAAAAAAAAAAAAAAAAAAAAAAAAAAAAAAAAAAAAAAAA
AAAAAAAAAAAAAAAAAAAAAAAAAAAAAAAAAAAAAAAAAAAAAAAAAAAAAAAAAAAAAAAAAAAAAAAAAAAAAAAAAAAAAAAAAAAAAAAAAAAA
AAAAAAAAAAAAAAAAAAAAAAAAAAAAAAAAAAAAAAAAAAAAAAAAAAAAAAAAAAAAAAAAAAAAAAAAAAAAAAAAAAAAAAAAAAAAAAAAAAAA
AAAAAAAAAAAAAAAAAAAAAAAAAAAAAAAAAAAAAAAAAAAAAAAAAAAAAAAAAAAAAAAAAAAAAAAAAAAAAAAAAAAAAAAAAAAAAAAAAAAA
*Hypertension: Survey participants having ever been told by a health professional that theyhave high blood pressure.
Percent
FIGURE 4d. Prevalence of hypertension* among black women — Behavioral RiskFactor Surveillance System, 1992
Vol. 47 / No. SS-5 MMWR 61

2.0 to 3.4
3.5 to 4.0
4.1 to 4.7
4.8 to 6.2
Data missing /
Sample <50
AAAAAAAAAAAAAAAA
AAAA
D.C.
AAAAAAAAAAAAAAAAAAAAAAAAAAAAAAAAAAAAAAAAAAAAAAAA
AAAAAAAAAAAAAAAAAAAAAAAAAAAAAAAAAAAA
AAAA
AA
A
AA
AA
A
AAAAAAAAAAAAAAAAAAAAAAAAAAAAAAAAAAAAAAAAAAAAAAAAAAAAAAAAAAAAAAAAAAAAAAAAAAAAAAAAAAAAAAAAAAAAAAAAAAAA
AAAAAAAAAAAAAAAAAAAAAAAAAAAAAAAAAAAAAAAAAAAAAAAAAAAAAAAAAAAAAAAAAAAAAAAAAAAAAAAAAAAAAAAAAAAAAAAAAAAA
AAAAAAAAAAAAAAAAAAAAAAAAAAAAAAAAAAAAAAAAAAAAAAAAAAAAAAAAAAAAAAAAAAAAAAAAAAAAAAAAAAAAAAAAAAAAAAAAAAAA
AAAAAAAAAAAAAAAAAAAAAAAAAAAAAAAAAAAAAAAAAAAAAAAAAA
AAAAAAAAAAAAAAAAAAAAAAAAAAAAAAAAAAAAAAAAAAAAAAAA
AAAAAAAAAAAAAAAAAAAAAAAAAAAAAAAAAAAAAAAAAAAAAAAA
AAAAAAAAAAAAAAAAAAAAAAAAAAAAAAAAAAAAAAAAAAAAAAAA
AAAAAAAAAAAA
AAAAAAAAAAAAAAAA
AAAAAAAAAAAAAAAAAAAAAAAAAAAAAAAA
AAAAAAAAAAAAAAAAAAAAAAAAAAAAAAAA
AAAAAAAAAAAAAAAAAAAAAAAA
AAAAAAAAAAAAAAAAAAAAAAAAAAAAAAAAAAAAAAAAAAAAAAAAAAAAAAAAAAAAAAAAAAAAAAAA
AAAAAAAAAAAAAAAAAAAAAAAAAAAAAAAAAAAAAAAAAAAAAAAAAAAAAAAAAAAAAAAAAAAAAAAA
AAAAAAAAAAAAAAAAAAAAAAAAAAAAAAAAAAAAAAAAAAAAAAAAAAAAAA
AAAAAAAAAAAAAAAAAAAA
AAAAAAAA
AAAAAAA
AA
AAAAAAAAAAAAAAAAAAAAAAAAAAAA
AAAAAAAAAAAAAAAAAAAAAAAAAAAA
AAAAAAAAAAAAAAAAAAAAA
AAAAAAAAAAAAAAAAAAAAAAAAAAAAAAAAAAAAAAAA
AAAAAAAAAAAAAAAAAAAAAAAAAAAAAAAAAAAAAAAA
AAAAAAAAAAAAAAAAAAAAAAAAAAAAAAAAAAAAAAAAAAAAAAAAAAAAAAAA
AAAAAAAAAAAAAAAAAAAAAAAAAAAAAAAAAAAAAAAAAAAAAAAAAAAAAAAA
AAAAAAAAAAAAAAAAAAAAAAAAAAAAAAAAAAAAAAAAAA
AAAAAAAAAAAAAAAAAAAAAAAAAAAAAAAA
AAAAAAAAAAAAAAAAAAAAAAAAAAAAAAAA
AAAAAAAAAAAAAAAAAAAAAAAAAAAAAAAA
AAAAAAAAAAAAAAAAAAAAAAAAAAAAAAAA
AAAAAAAAAAAAAAAAAAAAAAAAAAAAAAAA
AAAAAAAAAAAAAAAAAAAAAAAAAAAAAAAA
AAAAAAAAAAAAAAAA
AAAAAAAAAAAAAAAAAAAAAAAAAAAAAAAAAAAAAAAA
AAAAAAAAAAAAAAAAAAAAAAAAAAAAAAAAAAAAAAAA
AAAAAAAAAAAAAAAAAAAAAAAAAAAAAAAAAAAAAAAAAAAAAAAAAAAA
AAAAAAAAAAAAAAAAAAAAAAAAAAAAAAAAAAAAAAAAAAAAAAAAAAAA
AAAAAAAAAAAAAAAAAAAAAAAAAAAAAAAAAAAAAAAAAAAAAAAAAAAA
AAAAAAAAAAAAAAAAAAAAAAAAAA
AAAAAAAAAAAAAAAAAAAAAAAAAA
AAAAAAAAAAAAAAAAAAAAAAAAAAAAAAAAAAAAAAAAAAAA
AAAAAAAAAAAAAAAAAAAAAAAAAAAAAAAAAAAAAAAAAAAA
AAAAAAAAAAA
*Diabetes mellitus: Survey participants having ever been told by a physician that they havediabetes.
Percent
FIGURE 5a. Prevalence of diabetes mellitus* among white men — Behavioral RiskFactor Surveillance System, 1994
1.9 to 3.1
3.2 to 3.8
3.9 to 4.6
4.7 to 6.1
Data missing /
Sample <50
AAAAAAAAAAAAAAAA
AAAAAAAA
D.C.AA
AA
A
AA
AA
A
AAAAAAAAAAAAAAAAAAAAAAAAAAAAAAAAAAAAAAAAAAAAAAAAAAAAAAAAAAAAAAAAAAAAAAAAAAAAAAAAAAAAAAAAAAAAAAAAAAAA
AAAAAAAAAAAAAAAAAAAAAAAAAAAAAAAAAAAAAAAAAAAAAAAAAAAAAAAAAAAAAAAAAAAAAAAAAAAAAAAAAAAAAAAAAAAAAAAAAAAA
AAAAAAAAAAAAAAAAAAAAAAAAAAAAAAAAAAAAAAAAAAAAAAAAAAAAAAAAAAAAAAAAAAAAAAAAAAAAAAAAAAAAAAAAAAAAAAAAAAAA
AAAAAAAAAAAAAAAAAAAAAAAAAAAAAAAAAAAAAAAAAAAAAAAAAA
AAAAAAAAAAAAAAAAAAAAAAAAAAAAAAAAAAAAAAAAAAAA
AAAAAAAAAAAAAAAAAAAAAAAAAAAAAAAAAAAAAAAAAAAA
AAAAAAAAAAAAAAAAAAAAAAAAAAAAAAAAA
A
AA
AAAAAAAAAAAAAAAAAAAAAAAAAAAAAAAAAAAAAAAA
AAAAAAAAAAAAAAAAAAAAAAAAAAAAAAAAAAAAAAAA
AAAAAAAAAAAAAAAAAAAAAAAAAAAAAA
AAAAAAAAAA
AAAAAAAAAAAA
AAAAAAAAAAAA
AAAAAAAAAAAAAAAAAAAAAAAAAAAAAAAAAAAAAAAAAAAAAAAAAA
AAAAAAAAAAAAAAAAAAAAAAAAAAAAAAAAAAAA
AAAAAAAAAAAAAAAAAAAAAAAAAAAAAAAA
AAAAAAAAAAAAAAAAAAAAAAAAAAAAAAAA
AAAAAAAAAAAAAAAAAAAAAAAAAAAAAAAA
AAAAAAAAAAAAAAAAAAAAAAAA
AAAAAAAAAAAAAAAAAAAAAAAAAAAAAAAA
AAAAAAAAAAAAAAAAAAAAAAAAAAAAAAAA
AAAAAAAAAAAAAAAAAAAAAAAAAAAAAAAA
AAAAAAAAAAAAAAAAAAAAAAAA A
AA
AAAAAAAAAAAAAAAAAAAAAAAAAAAAAAAAAAAAAAAAAAAAAAAA
AAAAAAAAAAAAAAAAAAAAAAAAAAAAAAAAAAAAAAAAAAAAAAAA
AAAAAAAAAAAAAAAAAAAAAAAAAAAAAAAAAAAAAAAAAAAAAAAA
AAAAAAAAAAAA
AAAAAAAAAAAAAAAAAAAAAAAAAAAAAAAAAAAAAAAAAAAAAAAAAAAA
AAAAAAAAAAAAAAAAAAAAAAAAAAAAAAAAAAAAAAAAAAAAAAAAAAAA
AAAAAAAAAAAAAAAAAAAAAAAAAAAAAAAAAAAAAAAAAAAAAAAAAAAA
AAAAAAAAAAAAAAAAAAAAAAAAAAAAAAAAAAAAAAA
AAAAAAAAAAAAAAAAAAAAAAAAAAAAAAAAAAAAAAAA
AAAAAAAAAAAAAAAAAAAAAAAAAAAAAAAAAAAAAAAA
AAAAAAAAAAAAAAAAAAAAAAAAAAAAAAAAAAAAAAAA
AAAAAAAAAA
AAAAAAAAAAAAAAAAAAAAAAAAAAAAAAAAAAAAAAAAAAAAAAAAAAAA
AAAAAAAAAAAAAAAAAAAAAAAAAAAAAAAAAAAAAAAAAAAAAAAAAAAA
AAAAAAAAAAAAAAAAAAAAAAAAAAAAAAAAAAAAAAA
A
AAAAAAAAAAAA
AAAAAAAAAAAAAAAAAAAAAAAAAAAAAAAAAAAA
AAAAAAAAAAAAAAAAAAAAAAAAAAAAAAAAAAAA
AAAAAAAAAAAAAAAAAAAAAAAAAAAAAAAAAAAA
AAAAAAAAAAAAAAAAAA
AAAA
AAAAAAAAAAAAAAAAAAAAAAAAAAAAAAAAAAAAAAAA
AAAAAAAAAAAAAAAAAAAAAAAAAAAAAAAAAAAAAAAA
AAAAAAAAAAAAAAAAAAAAAAAAAAAAAAAAAAAAAAAA
AAAAAAAAAAAAAAAAAAAAAAAAAAAAAAAAAAAAAAAAAAAAAAAA
AAAAAAAAAAAAAAAAAAAAAAAAAAAAAAAAAAAAAAAAAAAAAAAA
AAAAAAAAAAAAAAAAAAAAAAAAAAAAAAAAAAAAAAAAAAAAAAAA
AAAAAAAAAAAA
*Diabetes mellitus: Survey participants having ever been told by a physician that they havediabetes.
Percent
FIGURE 5b. Prevalence of diabetes mellitus* among white women — Behavioral RiskFactor Surveillance System, 1994
62 MMWR December 11, 1998

0.5 to 5.1
5.2 to 6.2
6.3 to 6.8
6.9 to 13.4
Data missing /Sample <50
AAAAAAAAAAAAAAAA
AAAA
D.C.
AAAAAAAAAAAAAAAAAAAAAAAAAAAAAAAAAAAA
AAAAAAAAAAAAAAAAAAAAAAAAAAAAAAAAAAAA
AAAAAAAAA
AAAA
AAAA
AAAAAAAAAAAAAAAAAAAAAAAAAAAAAAAAAAAAAAAA
AAAAAAAAAAAAAAAAAAAAAAAAAAAAAAAAAAAAAAAA
AAAAAAAAAAAAAAAAAAAA
AAAAAAAAAAAAAAAAAAAAAAAAAAAAAAAA
AAAAAAAAAAAAAAAAAAAAAAAAAAAAAAAA
AAAAAAAAAAAAAAAAAAAAAAAAAAAAAAAA
AAAAAAAAAAAAAAAAAAAAAAAAAAAAAAAA
AAAAAAAAAAAAAAAAAAAAAAAA
AA
AAAAAAAA
AAAAAAAAAAAAAAAAAAAAAAAAAAAAAAAAAAAA
AAAAAAAAAAAAAAAAAAAAAAAAAAAAAAAAAAAA
AAAAAAAAAAAAAAAAAAAAAAAAAAAAAAAAAAAA
AAAAAAAAAAAAAAAAAA
*Diabetes mellitus: Survey participants having ever been told by a physician that they havediabetes.
Percent
FIGURE 5c. Prevalence of diabetes mellitus* among black men — Behavioral RiskFactor Surveillance System, 1994
1.1 to 6.0
6.1 to 6.7
6.8 to 10.7
10.8 to 18.2
Data missing /
Sample <50
AAAAAAAAAAAAAAAA
AAAAAAAA
D.C.
AAAAAAAAAAAAAAAAAAAAAAAAAAAAAAAAAAAAAAAAAAAAAAAA
AAAAAAAAAAAAAAAAAAAAAAAAAAAAAAAAAAAAAAAAAAAAAAAA
AAAAAAAAAAAAAAAA
AAAAAA
AAAA
AAAAAAAAAAAAAAAAAAAAAAAAAAAAAAAAAAAAAAAAAAAAAAAAAAAAAA
AAAAAAAAAAAAAAAAAAAAAAAAAAAAAAAAAAAAAAAAAAAAAAAAAAAA
AAAAAAAAAAAAAAAAAAAAAAAAAAAAAAAAAAAAAAAAAAAAAAAAAAAA
AAAAAAAAAAAAAAAAAAAAAAAAAAAAAAAAAAAAAAAAAAAAAAAAAAAA
AAAA
AAAAAA
AAAA
AAAAAA
AAAAAA
AAAAAAAAAAAAAAAA
AAAAAAAAAAAAAAAAAAAAAAAAAAAAAAAAAAAAAAAA
AAAAAAAAAAAAAAAAAAAA
AAAAAAAAAAAAAAAAAAAAAAAAAAAAA
AAAAAAAAAAAAAAAAAAAAAAAAAAAA
AAAAAAAAAAAAAAAAAAAAAAAAAAAA
AAAAAAA
AAAAAAAAAAAAAAAAAAAAAAAAAAAAAAAA
AAAAAAAAAAAAAAAAAAAAAAAAAAAAAAAA
AAAAAAAAAAAAAAAAAAAAAAAAAAAAAAAA
AAAAAAAAAAAAAAAAAAAAAAAA
AAAAAAAAAAAAAAAAAAAAAAAAAAAAAAAAAAAAAAAA
AAAAAAAAAAAAAAAAAAAAAAAAAAAAAAAAAAAAAAAA
*Diabetes mellitus: Survey participants having ever been told by a physician that they havediabetes.
Percent
FIGURE 5d. Prevalence of diabetes mellitus* among black women — Behavioral RiskFactor Surveillance System, 1994
Vol. 47 / No. SS-5 MMWR 63
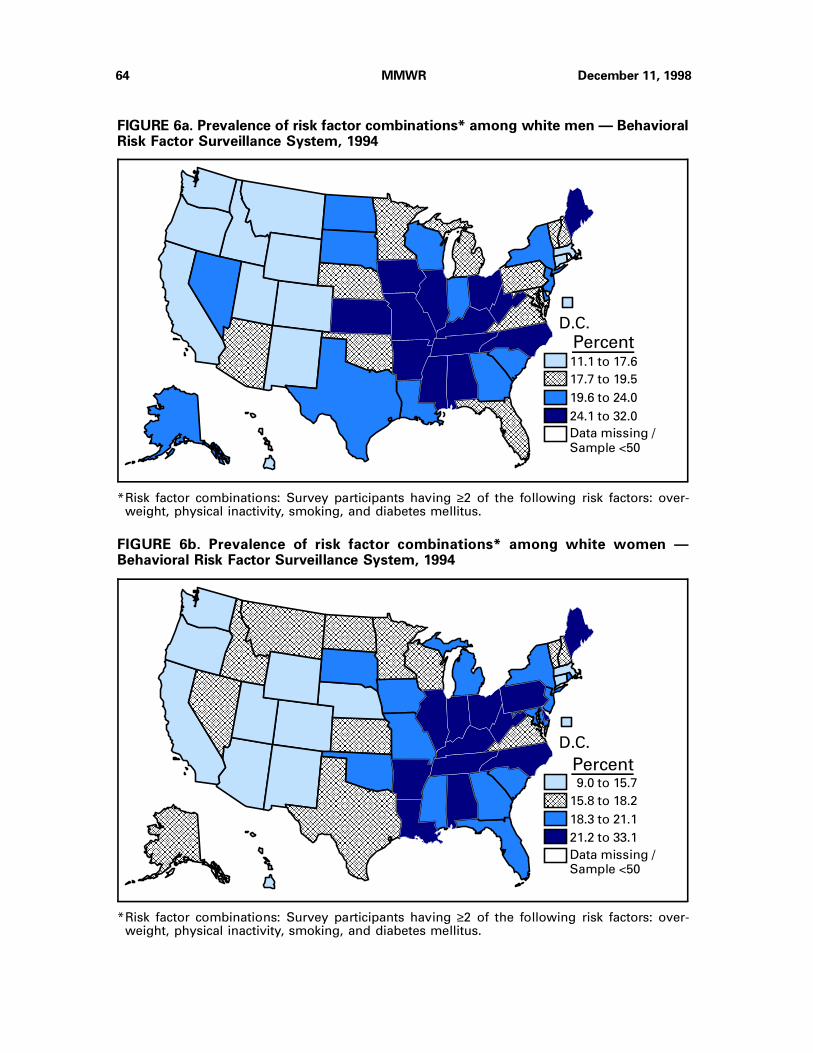
11.1 to 17.6
17.7 to 19.5
19.6 to 24.0
24.1 to 32.0
Data missing /
Sample <50
AAAAAAAAAAAAAAAA
AAAAAAAA
D.C.
AAAAAAAAAAAAAAAAAAAAAAAAAAAAAAAAAAAAAAAAAAAAAAAAAAAAAAAAAAAA
AAAAAAAAAAAAAAAAAAAAAAAAAAAAAAAAAAAAAAAAAAAAAAAAAAAAAAAAAAAA
AAAAAAAAAAAAAAAAAAAAAAAAAAAAAAAAAAAAAAAAAAAAAAAAAAAAAAAAAAAA
AAAAAAA
AAAA
AAAAAAAA
AAAAAAAAAAAAAAAAAAAAAAAAAAAAAAAAAAAAAAAAAAAAAAAAAAAA
AAAAAAAAAAAAAAAAAAAAAAAAAAAAAAAAAAAAAAAAAAAAAAAAAAAAAAAA
AAAAAAAAAAAAAAAAAAAAAAAAAAAAAAAAAAAAAAAAAAAAAAAAAAAAAAAA
AAAAAAAAAAAAAAAAAAAAAAAAAAAAAAAAAAAAAAAAAAAAAAAAAAAAAAAA
AAA
AAAAAAAAAAAAAAAAAAAA
AAAAAAAAAAAAAAAAAAAA
AAAAA
AAAAA
A
AAAAAAAAAAAAAAAAAAAAAAAA
AAAAAAAAAAAAAAAAAAAAAAAA
AAAAAAAAAAAAAAAAAAAAAAAA
AAAAAAAAAAAAAAAAAAAAAAAAAAAAAAAAAAAAAAAA
AAAAAAAAAAAAAAAAAAAAAAAAAAAAAAAAAAAAAAAA
AAAAAAAAAAAAAAAAAAAAAAAAAAAAAAAAAAAAAAAAAAAAAAAAAAAAAAAAAAAA
AAAAAAAAAAAAAAAAAAAAAAAAAAAAAAAAAAAAAAAAAAAAAAAAAAAAAAAAAAAA
AAAAAAAAAAAAAAAAAAAAAAAAAAAAAAAAAAAAAAAAAAAAAAAAAAAAAAAAAAAA
AAAAAAAAAAAAAAAAAAAAAAAAAAAAAAAA
AAAAAAAAAAAAAAAAAAAAAAAAAAAAAAAA
AAAAAAAAAAAAAAAAAAAAAAAAAAAAAAAA
AAAAAAAAAAAAAAAAAAAAAAAA
AAAAAAAAAAAAAAAAAAAAAAAAAAAA
AAAAAAAAAAAAAAAAAAAAAAAAAAAAAAAAAAAAAAAA
AAAAAAAAAAAAAAAAAAAAAAAAAAAAAAAAAAAAAAAA
AAAAAAAAAAAAAAAAAAAAAAAAAAAAAAAAAAAAAAAA
AAAAAAAAAAAAAAAAAAAAAAAAAAAAAA
AAAAAAAAAAAAAAAAAAAAAAAAAAAA
AAAAAAAAAAAAAAAAAAAAAAAAAAAA
AAAAAAAAAAAAAA AA
AAAA
A
AAAAAAAAAAAA
AAAAAAAAAAAAAAAAAAAAAAAAAAAAAAAAAAAA
AAAAAAAAAAAAAAAAAAAAAAAAAAAAAAAAAAAA
AAAAAAAAAAAAAAAAAAAAAAAAAAAAAAAAAAAA
AAAAAAAAAAAAAAAAAA
AAAAAAAAAAAAAAAAAAAAAAAA
*Risk factor combinations: Survey participants having ≥2 of the following risk factors: over-weight, physical inactivity, smoking, and diabetes mellitus.
Percent
FIGURE 6a. Prevalence of risk factor combinations* among white men — BehavioralRisk Factor Surveillance System, 1994
9.0 to 15.7
15.8 to 18.2
18.3 to 21.1
21.2 to 33.1
Data missing /Sample <50
AAAAAAAAAAAAAAAA
AAAAAAAA
D.C.
AAAAAAAAAAAAAAAAAAAAAAAAAAAAAAAAAAAAAAAAAAAAAAAAAAAAAAAAAAAAAAAAAAAAAAAA
AAAAAAAAAAAAAAAAAAAAAAAAAAAAAAAAAAAAAAAAAAAAAAAAAAAAAAAAAAAAAAAAAAAAAAAA
AAAAAAAAAAAAAAAAAAAAAAAAAAAAAAAAAAAAAAAAAAAAAAAAAAAAAA
AAAAAAAAAAAAAAAAAAAAAAAAAAAAAAAA
AAAAAAAAAAAAAAAAAAAAAAAAAAAAAAAA
AAAAAAAAAAAAAAAAAAAAAAAAAAAAAAAA
AAAAAAAAAAAAAAAA
AAAAAAAAAAAAAAAAAAAAAAAAAAAAAAAAAAAAAAAAAAAAAAAAAAAAAAAA
AAAAAAAAAAAAAAAAAAAAAAAAAAAAAAAAAAAAAAAAAAAAAAAAAAAAAAAA
AAAAAAAAAAAAAAAAAAAAAAAAAAAAAAAAAAAAAAAAAAAAAAAAAAAAAAAA
AAAAAAAAAAAAAAAAAAAAAAAAAAAAAAAAAAAAAAAAAAAAAAAAAAAA
AAAAAAAAAAAAAAAAAAAAAAAAAAAAAAAAAAAAAAAAAAAAAAAAAAAA
AAAAAAAAAAAAAAAAAAAAAAAAAAAAAAAAAAAAAAAAAAAAAAAAAAAA
AAAAAAAAAAAAAAAAAAAAAAAAAAAAAAAAAAAAAAAAAAAAAAAAAAAA
AAAAAAAAAAAAAAAAAAAAAAAAAA
AAAAAAAAAAAAAAAAAAAAAAAAAAAAAAAA
AAAAAAAAAAAAAAAAAAAAAAAAAAAAAAAA
AAAAAAAAAAAAAAAAAAAAAAAAAAAAAAAA
AAAAAAAAAAAAAAAAAAAAAAAAAAAA
AAAAAAAAAAAAAAAAAAAAAAAAAAAAAAAAAAAAAAAAAAAAAAAAAAAAAAAAAAAAAAAAAAAAAAAA
AAAAAAAAAAAAAAAAAAAAAAAAAAAAAAAAAAAAAAAAAAAAAAAAAAAAAAAAAAAAAAAAAAAAAAAA
AAAAAAAAAAAAAAAAAAAAAAAAAAAAAAAAAAAAAAAAAAAAAAAAAAAAAA
AAAAAAAAAAAAAAAAAAAAAAAAAAAAAAAAAAAAAAAAAAAAAAAAAAAAAAAAAAAAAAAAAAAAAAAAAAAAAAAAAAAAAAAAAAAAAAAAAAAA
AAAAAAAAAAAAAAAAAAAAAAAAAAAAAAAAAAAAAAAAAAAAAAAAAAAAAAAAAAAAAAAAAAAAAAAAAAAAAAAAAAAAAAAAAAAAAAAAAAAA
AAAAAAAAAAAAAAAAAAAAAAAAAAAAAAAAAAAAAAAAAAAAAAAAAAAAAAAAAAAAAAAAAAAAAAAAAAAAAAAAAAAAAAAAAAAAAAAAAAAA
AAAAAAAAAAAAAAAAAAAAAAAAAAAAAAAAAAAAAAAAAAAAAAAAAAAAAAAAAAAAAAAAAAAAAAAAAAAAAAAAAAAAAAAAAAAAAAAAAAAA
AAAAAAAAAAAAAAAAAAAAAAAAAAAAAAAAAAAAAAAAAAAAAAAAAAAAAAAAAAAAAAAAAAAAAAAAAAAAAAAAAAAAAAAAAAAAAAAAAAAA
AAAAAAAAAAAAAAAAAAAAAAAAAAAAAAAAAAAAAAAAAAAAAAAAAAAAAAAAAAAAAAAAAAAAAAAAAAAAAAAAAAAAAAAAAAAAAAAAAAAA
A
AAAAAAAAAAAA
AAAAAAAAAAAAAAAAAAAAAAAAAAAAAAAAAAAA
AAAAAAAAAAAAAAAAAAAAAAAAAAAAAAAAAAAA
AAAAAAAAAAAAAAAAAAAAAAAAAAAAAAAAAAAA
AAAAAAAAAAAAAAAAAA
AAAAAAAAAAAAAAAAAAAAAAAAAA
AAAAAAAAAAAAAAAAAAAAAAAAAAAAAAAAAAAAAAAAAAAA
AAAAAAAAAAAAAAAAAAAAAAAAAAAAAAAAAAAAAAAAAAAA
AAAAAAAAAAAAAAAAAAAAAA
AAAAAAAAAAAAA
AAAAAAAAAAAAAAAAAAAAAAAAAAAAAAAAAAAAAAAAAAAAAAAAAAAAAAAAAAAA
AAAAAAAAAAAAAAAAAAAAAAAAAAAAAAAAAAAAAAAAAAAAAAAAAAAAAAAAAAAAAAAA
AAAAAAAAAAAAAAAAAAAAAAAAAAAAAAAAAAAAAAAAAAAAAAAAAAAAAAAAAAAAAAAA
AAAAAAAAAAAAAAAAAAAAAAAAAAAAAAAAAAAAAAAAAAAAAAAAAAAAAAAAAAAAAAAA
AAAAAAAAAAAAAAAAAAAAAAAAAAAAAAAA
AAAAAAAAA
AAAAAAAAAAAA
AAAAAAA
*Risk factor combinations: Survey participants having ≥2 of the following risk factors: over-weight, physical inactivity, smoking, and diabetes mellitus.
Percent
FIGURE 6b. Prevalence of risk factor combinations* among white women —Behavioral Risk Factor Surveillance System, 1994
64 MMWR December 11, 1998

16.0 to 21.6
21.7 to 24.7
24.8 to 31.3
31.4 to 39.7
Data missing /Sample <50
AAAAAAAAAAAAAAAA
AAAAAAAA
D.C.
AAAAAAA
AAAA
AAAAAAAA
AAAAAAAAAAAAAAAAAAAAAAAAAAAAAAAAAAAAAAAAAAAAAAAAAAAA
AAAAAAAAAAAAAAAAAAAAAAAAAAAAAAAAAAAAAAAAAAAAAAAAAAAAAAAA
AAAAAAAAAAAAAAAAAAAAAAAAAAAAAAAAAAAAAAAAAAAAAAAAAAAAAAAA
AAAAAAAAAAAAAAAAAAAAAAAAAAAAAAAAAAAAAAAAAAAAAAAAAAAAAAAA
AAA
AAAAAAAAAAAAAAAAAAAA
AAAAAAAAAAAAAAAAAAAA
AAAAA
AAA
AAAAAAAAAAAAAAAAAAAAAAAAAAAAAAAAAAAAAAAAAAAAAAAA
AAAAAAAAAAAAAAAAAAAAAAAAAAAAAAAAAAAAAAAAAAAAAAAA
AAAAAAAAAAAAAAAAAAAAAAAAAAAAAAAAAAAAAAAAAAAAAAAA
AAAAAAAAAAAAAA
AAAAAAAAAAAAAAAAAAAAAAAAAAAAAAAAAAAAAAAAAAAA
AAAAAAAAAAAAAAAAAAAAAAAAAAAAAAAAAAAAAAAAAAAA
AAAAAAAAAAAAAAAAAAAAAA
AAAAAAAAA
*Risk factor combinations: Survey participants having ≥2 of the following risk factors: over-weight, physical inactivity, smoking, and diabetes mellitus.
Percent
FIGURE 6c. Prevalence of risk factor combinations* among black men — BehavioralRisk Factor Surveillance System, 1994
17.1 to 30.4
30.5 to 32.7
32.8 to 36.5
36.6 to 42.9
Data missing /Sample <50
AAAAAAAAAAAAAAAA
AAAAAAAA
D.C.
A
AA
AAAAAAAAAAAAAAAAAAAAAAAAAAAAAAAAAAAAAAAA
AAAAAAAAAAAAAAAAAAAAAAAAAAAAAAAAAAAAAAAA
AAAAAAAAAAAAAAAAAAAA
AAAAAAAA
AAAAAAAAAAAA
AAAAAAAAAAAA
AAAA
AAAAAAAAAAAAAAAAAAAA
AAAAAAAAAAAAAAAAAAAA
AAAAA
AAAAAAA
AAAAAAAAAAAAAAAAAAAAAAAAAAAA
AAAAAAAAAAAAAAAAAAAAAAAAAAAA
AAAAAAAAAAAAAAAAAAAAAAAAAAAA
AAAAAAAAAAAAAAAAAAAAAAAAAAAAAAAAAAAAAAAA
AAAAAAAAAAAAAAAAAAAAAAAAAAAAAAAAAAAAAAAA
AAAAAAAAAAAAAAAAAAAAAAAAAAAAAAAAAAAAAAAAAAAAAAAAAAA
AAAAAAAAAAAAAAAAAAAAAAAAAAAAAAAAAAAA
AAAAAAAAAAAAAAAAAAAAAAAAAAAA
AAAAAAAAAAAAAAAAAAAAAAAAAAAA
AAAAAAAAAAAAAA
A
AAAAAAAA
AAAAAAAAAAAAAAAAAAAAAAAAAAAAAAAAAAAA
AAAAAAAAAAAAAAAAAAAAAAAAAAAAAAAAAAAA
AAAAAAAAAAAAAAAAAAAAAAAAAAAAAAAAAAAA
AAAAAAAAAAAAAAAAAA
*Risk factor combinations: Survey participants having ≥2 of the following risk factors: over-weight, physical inactivity, smoking, and diabetes mellitus.
Percent
FIGURE 6d. Prevalence of risk factor combinations* among black women — BehavioralRisk Factor Surveillance System, 1994
Vol. 47 / No. SS-5 MMWR 65

70.8 to 80.8
80.9 to 84.3
84.4 to 87.2
87.3 to 91.1
Data missing /Sample <50
AAAAAAAAAAAAAAAA
AAAA
D.C.
AAAAAAAAAAAAAAAAAAAAAAAAAAAAAAAAAAAAAAAAAAAAAAAAAAAAAAAAAAAA
AAAAAAAAAAAAAAAAAAAAAAAAAAAAAAAAAAAAAAAAAAAAAAAAAAAAAAAAAAAA
AAAAAAAAAAAAAAAAAAAAAAAAAAAAAAAAAAAAAAAAAAAAAAAAAAAAAAAAAAAA
AAAAAAAAAAAAAAAAAAAAAAAAAAAAAAAAAAAAAAAAAAAA
AAAAAAAAAAAAAAAAAAAAAAAAAAAAAAAAAAAAAAAAAAAA
AAAAAAAAAAAAAAAAAAAAAA
AAAAAAAAAAAAAAAAAAAAAAAAAAAAAAAAAAAAAAAAAAAAAAAAAAAAAAAAAAAAAAAAAAAAAAAA
AAAAAAAAAAAAAAAAAAAAAAAAAAAAAAAAAAAAAAAAAAAAAAAAAAAAAAAAAAAAAAAAAAAAAAAA
AAAAAAAAAAAAAAAAAAAAAAAAAAAAAAAAAAAAAAAAAAAAAAAAAAAAAA
AAAAAAAAAAAAAAAAAAAAAAAAAAAAAAAAAAAAAAAAAAAAAAAAAAAAAAAA
AAAAAAAAAAAAAAAAAAAAAAAAAAAAAAAAAAAAAAAAAAAAAAAAAAAAAAAA
AAAAAAAAAAAAAAAAAAAAAAAAAAAAAAAA
AAAAAAAAAAAAAAAAAAAAAAAAAAAAAAAA
AAAAAAAAAAAAAAAAAAAAAAAAAAAAAAAA
AAAAAAAAAAAAAAAAAAAAAAAAAAAAAAAA
AAAAAAAAAAAAAAAAAAAAAAAAAAAAAAAA
AAAAAAAAAAAAAAAAAAAAAAAAAAAAAAAA
AAAAAAAAAAAAAAAA
AAAAAAAAAAAAAAAAAA
AAAAAAAAAAAAAAAAAAAAAAAAAAAAAAAAAAAAAAAAAAAAAAAAAAAAAAAA
AAAAAAAAAAAAAAAAAAAAAAAAAAAAAAAAAAAAAAAAAAAAAAAAAAAAAAAA
AAAAAAAAAAAAAAAAAAAAAAAAAAAAAAAAAAAAAAAAAAAAAAAAAAAAAAAA
AAAAAAAAAAAAAA
AA
AAAAAAAAAAAAAAAAAAAAAAAAAAAAAAAAAAAAAAAAAAAAAAAA
AAAAAAAAAAAAAAAAAAAAAAAAAAAAAAAAAAAAAAAAAAAAAAAA
AAAAAAAAAAAAAAAAAAAAAAAAAAAAAAAAAAAAAAAAAAAAAAAA
AAAAAAAAAAAAAAAAAAAAAAAA
AAAAAAAAAAAAAAAAAAAAAAAAAAAAAAAAAAAAAAAA
AAAAAAAAAAAAAAAAAAAAAAAAAAAAAAAAAAAAAAAA
AAAAAAAAAAAAAAAAAAAAAAAAAAAAAAAAAAAAAAAA
AAAAAAAAAAAAAAAAAAAAAAAA
AAAAAAAAAAAAAAAAAAAAAAAA
AAAAAAAAAAAAAAAAAAAAAAAA
AAAAAAAAAAAAAAAAAA
AAAAAAAAAAAAAAAAAAAAAAAA
AAAAAAAAA
*Weight loss: Survey participants trying to lose or maintain or keep from gaining weight andwho are either eating fewer calories or eating less fat or are using physical activity or exerciseto maintain, lose, or keep from gaining weight.
Percent
FIGURE 7a. Prevalence of weight loss* among white men — Behavioral Risk FactorSurveillance System, 1994
81.6 to 88.1
88.2 to 89.9
90.0 to 91.9
92.0 to 94.1
Data missing /Sample <50
AAAAAAAAAAAAAAAA
AAAAAAAA
D.C.
AAAAAAAAAAAAAAAAAAAAAAAAAAAAAAAAAAAA
AAAAAAAAAAAAAAAAAAAAAAAAAAAAAAAAAAAA
AAAAAAAAA
AAAAAAAAAAAAAAAAAAAAAAAAAAAAAAAAAAAAAAAAAAAAAAAAAAAAAAAAAAAAAAAA
AAAAAAAAAAAAAAAAAAAAAAAAAAAAAAAAAAAAAAAAAAAAAAAAAAAAAAAAAAAAAAAA
AAAAAAAAAAAAAAAAAAAAAAAAAAAAAAAAAAAAAAAAAAAAAAAAAAAAAAAAAAAAAAAA
AAAAAAAAAAAAAAAA
AAAAAA
AAAA
AAAAAAAA
AAAAAAAAAAAAAAAAAAAAAAAAAAAAAAAAAAAAAAAAAAAAAAAAAAAA
AAAAAAAAAAAAAAAAAAAAAAAAAAAAAAAAAAAAAAAAAAAAAAAAAAAAAAAA
AAAAAAAAAAAAAAAAAAAAAAAAAAAAAAAAAAAAAAAAAAAAAAAAAAAAAAAA
AAAAAAAAAAAAAAAAAAAAAAAAAAAAAAAAAAAAAAAAAAAAAAAAAAAAAAAA
AAAAAAAAAAAAAAAAAAAAAAAAAAAAAAAAAAAAAAAAAAAAAAAAAAAAAAAA
AAAAAAAAAAAAAAAAAAAAAAAAAAAAAAAAAAAAAAAAAAAAAAAAAAAAAAAA
AAAAAAAAAAAAAAAAAAAAAAAAAAAAAAAAAAAAAAAAAAAAAAAAAAAAAAAA
AAAAAAAAAAAAAAAAAAAAAAAAAAAAAAAAAAAAAAAAAAAAAAAAAAAAAAAA
AAAAAAAAAAAAAAAAAAAAAAAAAAAAAAAAAAAAAAAAAAAAAAAAAAAAAAAA
AAAAAAAAAAAAAAAAAAAAAAAAAAAAAAAAAAAAAAAAAAAAAAAAAAAA
AAAAAAAAAAAAAAAAAAAAAAAAAAAAAAAAAAAAAAAAAAAAAAAAAAAA
AAAAAAAAAAAAAAAAAAAAAAAAAAAAAAAAAAAAAAAAAAAAAAAAAAAA
AAAAAAAAAAAAAAAAAAAAAAAAAAAAAAAAAAAAAAAAAAAAAAAAAAAA
AAAAAAAAAAAAAAAAAAAAAAAAAA
AAAAAAAAAAAAAAAAAAAAAAAAAAAAAAAAAAAA
AAAAAAAAAAAAAAAAAAAAAAAAAAAAAAAAAAAA
AAAAAAAAAAAAAAAAAAAAAAAAAAAAAAAAAAAA
AAAAAAAAAAAAAAAAAAAAAAAAAAAAAAAAAAAAAAAAAAAAAAAAAAAAAAAA
AAAAAAAAAAAAAAAAAAAAAAAAAAAAAAAAAAAAAAAAAAAAAAAAAAAAAAAA
AAAAAAAAAAAAAAAAAAAAAAAAAAAAAAAAAAAAAAAAAAAAAAAAAAAAAAAA
AAAAAAAAAAAAAA
AAAAAAAAAAAAAAAAAAAAAAAAAAAAAAAAAAAA
AAAAAAAAAAAAAAAAAAAAAAAAAAAAAAAAAAAAAAAA
AAAAAAAAAAAAAAAAAAAAAAAAAAAAAAAA
AAAAAAAAAAAAAAAAAAAAAAAAAAAAAAAAAAAA
AAAAAAAAAAAAAAAAAAAAAAAAAAAAAAAAAAAA
AAAAAAAAA
AAAAAAAAAAAAAAAAAAAAAAAAAAAA
*Weight loss: Survey participants trying to lose or maintain or keep from gaining weight andwho are either eating fewer calories or eating less fat or are using physical activity or exerciseto maintain, lose, or keep from gaining weight.
Percent
FIGURE 7b. Prevalence of weight loss* among white women — Behavioral RiskFactor Surveillance System, 1994
66 MMWR December 11, 1998

67.3 to 77.4
77.5 to 83.6
83.7 to 87.1
87.2 to 91.1
Data missing /
Sample <50
AAAAAAAAAAAAAAAA
AAAAAAAA
D.C.
AAAAAAAAAAAAAAAAAAAAAAAAAAAAAAAAAAAAAAAAAAAAAAAA
AAAAAAAAAAAAAAAAAAAAAAAAAAAAAAAAAAAAAAAAAAAAAAAA
AAAAAAAAAAAA
AAAAAA
AAAA
AAAAAAAAAAAAAAAAAAAAAAAAAAAAAAAAAAAAAAAAAAAAAAAAAAAAAAAAAA
AAAAAAAAAAAAAAAAAAAAAAAAAAAAAAAAAAAAAAAAAAAAAAAAAAAAAAAA
AAAAAAAAAAAAAAAAAAAAAAAAAAAAAAAAAAAAAAAAAAAAAAAAAAAAAAAA
AAAAAAAAAAAAAAAAAAAAAAAAAAAAAAAAAAAAAAAAAAAAAAAAAAAAAAAA
AAAAAAAAAAAAAAAAAAAAAAAAAAAAAAAAAAAAAAAAAAAAAAAAAAAAAAAA
AAAAAAAAAAAAAAAAAAAAAAAAAAAAAAAAAAAAAAAAAAAAAAAAAAAAAAAA
A
AA
AAAAAAAAAAAAAAAAAAAAAAAAAAAAAAAAAAAAAAAA
AAAAAAAAAAAAAAAAAAAAAAAAAAAAAAAAAAAAAAAA
AAAAAAAAAAAAAAAAAAAA
*Weight loss: Survey participants trying to lose or maintain or keep from gaining weight andwho are either eating fewer calories or eating less fat or are using physical activity or exerciseto maintain, lose, or keep from gaining weight.
Percent
FIGURE 7c. Prevalence of weight loss* among black men — Behavioral Risk FactorSurveillance System, 1994
75.2 to 82.0
82.1 to 86.6
86.7 to 89.8
89.9 to 95.3
Data missing /
Sample <50
AAAAAAAAAAAAAAAA
AAAAAAAA
D.C.AAAAAAAAAAAAAAAAAAAAAAAAAAAAAAAAAAAAAAAAAAAAAAAAAAAA
AAAAAAAAAAAAAAAAAAAAAAAAAAAAAAAAAAAAAAAAAAAAAAAAAAAA
AAA
AAAAAAAAAAAAAAAAAAAAAAAAAAAAAAAAAAAAAAAA
AAAAAAAAAAAAAAAAAAAAAAAAAAAAAAAAAAAAAAAA
AAAAAAAAAAAAAAAAAAAA
AAAAAAAAAAAAAAAAAAAAAAAAAAAAAAAAAAAAAAAAAAAAAAAA
AAAAAAAAAAAAAAAAAAAAAAAAAAAAAAAAAAAAAAAAAAAAAAAA
AAAAAAAAAAAAAAAAAAAAAAAAAAAAAAAAAAAAAAAAAAAAAAAA
AAAAAAAAAAAAAAAAAAAAAAAAAAAA A
A
AAAAAAAAAAAAAAAAAAAAAAAAAAAAAAAAAAAAAAAAAAAA
AAAAAAAAAAAAAAAAAAAAAAAAAAAAAAAAAAAAAAAAAAAA
AAAAAAAAAAAAAAAAAAAAAAAAAAAAAAAAAAAAAAAAAAAA
AAAAAAAAAAAAAAAAAAAAAA
AAAAAAAAAAAAAAAAAAAAAAAA
AAAAAAAAAAAAAAAAAAAAAAAA
AAAAAAAAAAAAAAAAAAAAAAAA
AAAAAAAAAAAAAAAAAA
AAA
AAAAAAAAAAAAAAAAAAAAAAAAAAAAAAAAAAAAAAAAAAAA
AAAAAAAAAAAAAAAAAAAAAAAAAAAAAAAAAAAAAAAAAAAA
AAAAAAAAAAAAAAAAAAAAAA
*Weight loss: Survey participants trying to lose or maintain or keep from gaining weight andwho are either eating fewer calories or eating less fat or are using physical activity or exerciseto maintain, lose, or keep from gaining weight.
Percent
FIGURE 7d. Prevalence of weight loss* among black women — Behavioral Risk FactorSurveillance System, 1994
Vol. 47 / No. SS-5 MMWR 67
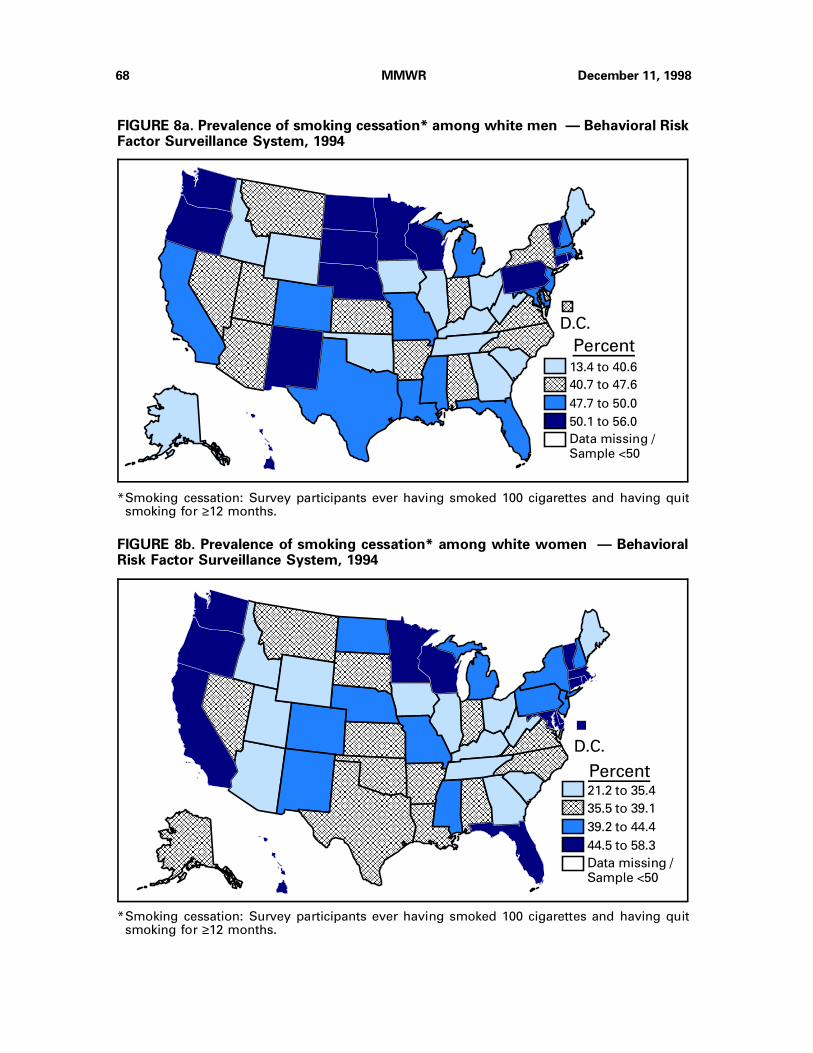
13.4 to 40.6
40.7 to 47.6
47.7 to 50.0
50.1 to 56.0
Data missing /
Sample <50
AAAAAAAAAAAAAAAA
AAAAAAAA
D.C.
AAAAAAAAAAAAAAAAAAAAAAAAAAAAAAAAAAAAAAAAAAAAAAAA
AAAAAAAAAAAAAAAAAAAAAAAAAAAAAAAAAAAAAAAAAAAAAAAA
AAAAAAAAAAAAAAAAAAAAAAAAAAAAAAAAAAAA
AAAAAAAAAAAAAAAAAAAAAAAAAAAAAAAAAAAA
AAAAAAAAA
AAAAAAAAAAAAAAAAAAAAAAAAAAAAAAAAAAAAAAAAAAAAAAAAAAAAAAAAAAAA
AAAAAAAAAAAAAAAAAAAAAAAAAAAAAAAAAAAAAAAAAAAAAAAAAAAAAAAAAAAA
AAAAAAAAAAAAAAAAAAAAAAAAAAAAAAAAAAAAAAAAAAAAAAAAAAAAAAAAAAAA
AAAAAAAAAAAAAAA
AAAAAAAAAAAAAAAAAAAAAAAAAAAAAAAAAAAAAAAA
AAAAAAAAAAAAAAAAAAAA
AAAAAAAAAAAAAAAAAAAAAAAAAAAAAAAA
AAAAAAAAAAAAAAAAAAAAAAAAAAAAAAAA
AAAAAAAAAAAAAAAAAAAAAAAAAAAAAAAA
AAAAAAAAAAAAAAAA
AAAAAAAAAAAAAAAAAAAAAAAAAAAAAAAAAAAAAAAAAAAAAAAA
AAAAAAAAAAAAAAAAAAAAAAAAAAAAAAAAAAAAAAAAAAAAAAAA
AAAAAAAAAAAAAAAAAAAAAAAAAAAAAAAAAAAAAAAAAAAAAAAA
AAAAAAAAAAAAAAAAAAAAAAAAAAAAAAAAAAAAAAAAAAAAAAAA
AAAAAAAAAAAAAAAAAAAAAAAA
AAAAAAAAAAAAAAAAAAAAAAAAAAAAAAAA
AAAAAAAAAAAAAAAAAAAAAAAAAAAAAAAA
AAAAAAAAAAAAAAAAAAAAAAAAAAAAAAAA
AAAAAAAAAAAAAAAAAAAAAAAA
AAAAAAAAAAAAAAAAAAAAAAAAAAAAAAAAAAAAAAAAAAAAAAAAAAAAAAAAAAAAAAAAAAAAAAAAAAAA
AAAAAAAAAAAAAAAAAAAAAAAAAAAAAAAAAAAAAAAAAAAAAAAAAAAAAAAAAAAAAAAAAAAAAAAAAAAA
AAAAAAAAAAAAAAAAAAAAAAAAAAAAAAAAAAAAAAAAAAAAAAAAAAAAAAAAAAAAAAAAAAAAAAAAAAAA
AA
AAAAAAAAAAAAAAAAAAAAAAAAAAAAAAAAAAAAAAAAAAAAAAAA
AAAAAAAAAAAAAAAAAAAAAAAAAAAAAAAAAAAAAAAAAAAAAAAA
AAAAAAAAAAAAAAAAAAAAAAAAAAAAAAAAAAAAAAAAAAAAAAAA
AAAAAAAAAAAA
AAAAAAAAAAAAAAAAAAAAAAAAAAAAAAAAAAAAAAAAAAAAAAAAAAAA
AAAAAAAAAAAAAAAAAAAAAAAAAAAAAAAAAAAAAAAAAAAAAAAAAAAA
AAAAAAAAAAAAAAAAAAAAAAAAAAAAAAAAAAAAAAA
AA
AAAAAAAA
AAAAAAAAAAAAAAAAAAAAAAAAAAAAAAAAAAAA
AAAAAAAAAAAAAAAAAAAAAAAAAAAAAAAAAAAA
AAAAAAAAAAAAAAAAAAAAAAAAAAAAAAAAAAAA
AAAAAAAAAAAAAAAAAA
AAAAAAAAA
*Smoking cessation: Survey participants ever having smoked 100 cigarettes and having quitsmoking for ≥12 months.
Percent
FIGURE 8a. Prevalence of smoking cessation* among white men — Behavioral RiskFactor Surveillance System, 1994
21.2 to 35.4
35.5 to 39.1
39.2 to 44.4
44.5 to 58.3
Data missing /Sample <50
AAAAAAAAAAAAAAAA
AAAA
D.C.
AAAAAAAAAAAAAAAAAAAAAAAAAAAAAAAAAAAAAAAAAAAAAAAA
AAAAAAAAAAAAAAAAAAAAAAAAAAAAAAAAAAAA
AAAAAAAAAAAAAAAAAAAAAAAAAAAAAAAAAAAA
AAAAAAAAAAAAAAAAAAAAAAAAAAAAAAAAAAAA
AAAAAAAAAAAAAAAAAA
AAAAAAAAAAAAAAAAAAAAAAAAAAAAAAAAAAAAAAAAAAAA
AAAAAAAAAAAAAAAAAAAAAA
AAAAAAAAAAAAAAAAAAAAAAAAAAAAAAAA
AAAAAAAAAAAAAAAAAAAAAAAAAAAAAAAA
AAAAAAAAAAAAAAAAAAAAAAAAAAAAAAAA
AAAAAAAA
A
AAAA
AAAAAAAAAAAAAAAAAAAAAAAAAAAAAAAAAAAAAAAA
AAAAAAAAAAAAAAAAAAAAAAAAAAAAAAAAAAAAAAAA
AAAAAAAAAAAAAAAAAAAAAAAAAAAAAA
AAAAAAAAAAAAAAAAAAAAAAAAAAAAAAAAAAAAAAAAAAAAAAAAAAAA
AAAAAAAAAAAAAAAAAAAAAAAAAAAAAAAAAAAAAAAAAAAAAAAAAAAA
AAAAAAAAAAAAAAAAAAAAAAAAAAAAAAAAAAAAAAAAAAAAAAAAAAAA
AAAAAAAAAAAAAAAAAAAAAAAAAAAAAAAAAAAAAAAAAAAAAAAAAAAA
AAAAAAAAAAAAAAAAAAAAAAAAAA
AAAAAAAAAAAAAAAAAAAAAAAAAAAAAAAA
AAAAAAAAAAAAAAAAAAAAAAAAAAAAAAAA
AAAAAAAAAAAAAAAAAAAAAAAAAAAAAAAA
AAAAAAAAAAAAAAAAAAAAAAAAAAAAAAAA
AAAAAAAAAAAAAAAAAAAAAAAAAAAAAAAAAAAAAAAAAAAAAAAAAAAAAAAAAAAAAAAAAAAAAAAAAAAA
AAAAAAAAAAAAAAAAAAAAAAAAAAAAAAAAAAAAAAAAAAAAAAAAAAAAAAAAAAAAAAAAAAAAAAAAAAAA
AAAAAAAAAAAAAAAAAAAAAAAAAAAAAAAAAAAAAAAAAAAAAAAAAAAAAAAAAAAAAAAAAAAAAAAAAAAA
AAAAAAAAAAAAAAAAAAAAAAAAAAAAAAAAAAAAAAAA
AAAAAAAAAAAAAAAAAAAAAAAAAAAAAAAAAAAAAAAA
AAAAAAAAAAAAAAAAAAAAAAAAAAAAAAAAAAAAAAAA
AAAAAAAAAAAAAAAAAAAAAAAAAAAAAAAAAAAAAAAA
AAAAAAAAAAAAAAAAAAAAAAAAAAAAAAAAAAAAAAAA
AAAAAAAAAAAAAAAAAAAAAAAAAAAAAAAAAAAAAAAA
AAAAAAAAAAAAAAAAAAAAAAAAAAAAAAAAAAAAAAAA
AAAAAAAAAA
AAAAAAAAAAAAAAAAAAAAAAAAAAAAAAAAAAAAAAAAAAAAAAAAAAAAAAAAAAAAAAAAAAAAAAAAAAAAAAAAAAAAAAAAAAAAAAAAAAAAAAAA
AAAAAAAAAAAAAAAAAAAAAAAAAAAAAAAAAAAAAAAAAAAAAAAAAAAAAAAAAAAAAAAAAAAAAAAAAAAAAAAAAAAAAAAAAAAAAAAAAAAAAAAA
AAAAAAAAAAAAAAAAAAAAAAAAAAAAAAAAAAAAAAAAAAAAAAAAAAAAAAAAAAAAAAAAAAAAAAAAAAAAAAAAAAAAAAAAAAAAAAAAAAAAAAAA
AAAAAAAAAAAAAAAAAAAAAAAAAAAAAAAAAAAAAAAAAAAAAAAAAAAAAAAAAAAAAAAAAAAAAAAAAAAAAAAAAAAAAAAAAAAAAAAAAAAAAAAA
AAAAAAAAAAAAAAAAAAAAAAAAAAAAAAAAAAAAAAAAAAAAAAAAAAAAAAAAAAAAAAAAAAAAAAAAAAAAAAAAAAAAAAAAAAAAAAAAAAAAAAAA
AAAAAAAAAAAAAAAAAAAAAAAAAAAAAAAAAAAAAAAAAAAAAAAAAAAAAAAAAAAAAAAAAAAAAAAAAAAAAAAAAAAAAAAAAAAAAAAAAAAAAAAA
AAAAAAA
AAAAAAAAAAAAAAAAAAAAAAAAAAAAAAAAAAAA
AAAAAAAAAAAAAAAAAAAAAAAAAAAAAAAAAAAA
AAAAAAAAAAAAAAAAAAAAAAAAAAAAAAAAAAAA
AAAAAAAAAAAAAAAAAA
AAAAAAAAAAAA
AAAAAAAAAAAAAAAAAAAAAAAAAAAAAAAAAAAAAAAAAAAAAAAAAAAAAAAAAAAA
AAAAAAAAAAAAAAAAAAAAAAAAAAAAAAAAAAAAAAAAAAAAAAAAAAAAAAAAAAAAAAAA
AAAAAAAAAAAAAAAAAAAAAAAAAAAAAAAAAAAAAAAAAAAAAAAAAAAAAAAAAAAAAAAA
AAAAAAAAAAAAAAAAAAAAAAAAAAAAAAAAAAAAAAAAAAAAAAAAAAAAAAAAAAAAAAAA
AAAAAAAAAAAAAAAAAAAAAAAAAAAAAAAAAAAAAAAAAAAAAAAA
AAAAAAAAA
AAAAAAAA
AAAAAAAAAA
*Smoking cessation: Survey participants ever having smoked 100 cigarettes and having quitsmoking for ≥12 months.
Percent
FIGURE 8b. Prevalence of smoking cessation* among white women — BehavioralRisk Factor Surveillance System, 1994
68 MMWR December 11, 1998

16.4 to 26.1
26.2 to 32.1
32.2 to 35.7
35.8 to 41.1
Data missing /Sample <50
AAAAAAAAAAAAAAAA
AAAAAAAA
D.C.
AAAAAAAAAAAAAAAAAAAAAAAAAAAAAAAAAAAAAAAAAAAA
AAAAAAAAAAAAAAAAAAAAAAAAAAAAAAAAAAAAAAAAAAAA
AAAAAAAAAAAAAAAAAAAAAA
AA
AA
AAAAAAAAAAAAAAAAAAAAAAAAAAAAAAAAAAAAAAAA
AAAAAAAAAAAAAAAAAAAAAAAAAAAAAAAAAAAAAAAA
AAAAAAAAAAAAAAAAAAAA
AAAAAAAAAAAAAAAAAAAAAAAA
AAAAAAAAAAAAAAAAAAAAAAAA
AAAAAAAAAAAAAAAAAAAAAAAA
AAAAAAAAAAAAAAAAAA
AAAAAAAAA
*Smoking cessation: Survey participants ever having smoked 100 cigarettes and having quitsmoking for ≥12 months.
Percent
FIGURE 8c. Prevalence of smoking cessation* among black men — Behavioral RiskFactor Surveillance System, 1994
14.8 to 22.5
22.6 to 27.9
28.0 to 34.6
34.7 to 37.8
Data missing /
Sample <50
AAAAAAAAAAAA
AAAAAA
D.C.
AAAAAAAAAAAAAAAAAAAAAAAAAAAAAAAAAAAAAAAAAAAAAAAA
AAAAAAAAAAAAAAAAAAAAAAAAAAAAAAAAAAAAAAAAAAAAAAAA
AAAAAAAAAAAAAAAAAAAAAAAA
AAAAAAAAAAAAAAAAAAAAAAAAAAAA
AAAAAAAAAAAAAAAAAAAAAAAAAAAA
AAAAAAAAAAAAAAAAAAAAA
AA
AAAAAAAA
AAAAAAAAAAAAAAAAAAAAAAAAAAAAAAAAAAAA
AAAAAAAAAAAAAAAAAAAAAAAAAAAAAAAAAAAA
AAAAAAAAAAAAAAAAAAAAAAAAAAAAAAAAAAAA
AAAAAAAAAAAAAAAAAA
AAA
AAAAAAAAAAAAAAAAAAAAAAAAAAAAAAAAAAAAAAAAAAAA
AAAAAAAAAAAAAAAAAAAAAAAAAAAAAAAAAAAAAAAAAAAA
AAAAAAAAAAAAAAAAAAAAAA
*Smoking cessation: Survey participants ever having smoked 100 cigarettes and having quitsmoking for ≥12 months.
Percent
FIGURE 8d. Prevalence of smoking cessation* among black women — BehavioralRisk Factor Surveillance System, 1994
Vol. 47 / No. SS-5 MMWR 69

70 MMWR December 11, 1998

Vol. 47 / No. SS-5 MMWR 71

72 MMWR December 11, 1998
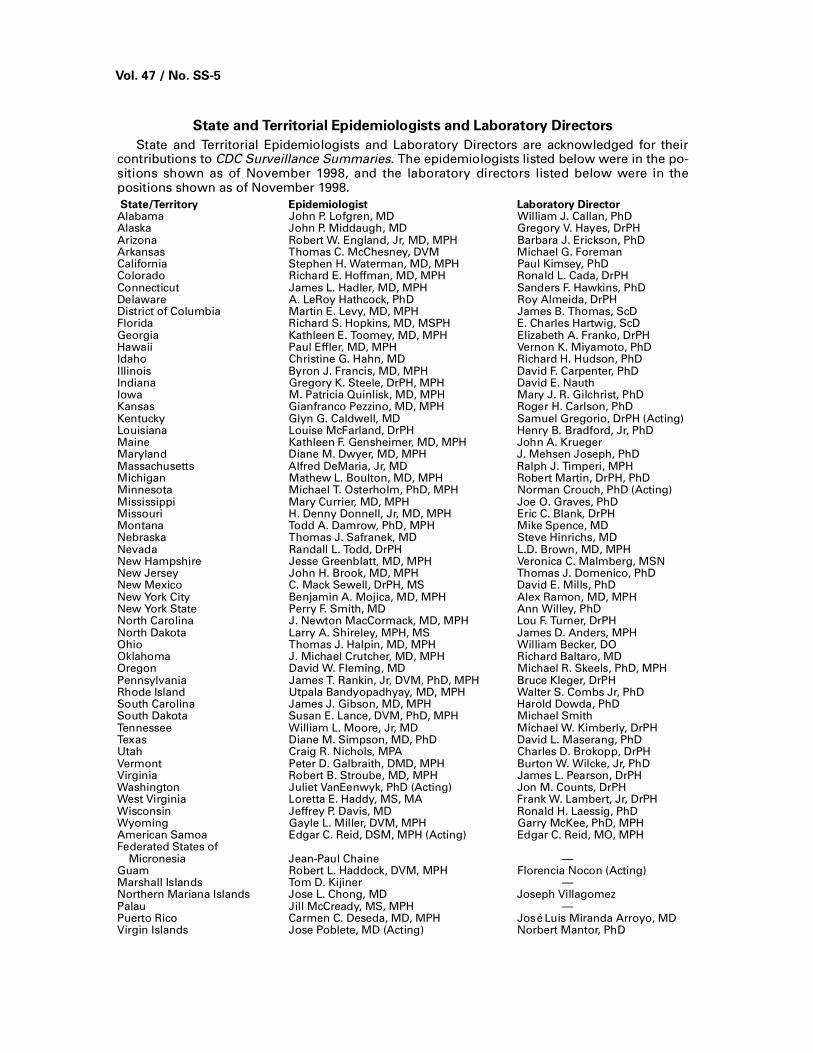
State and Territorial Epidemiologists and Laboratory Directors
State and Territorial Epidemiologists and Laboratory Directors are acknowledged for theircontributions to CDC Surveillance Summaries. The epidemiologists listed below were in the po-sitions shown as of November 1998, and the laboratory directors listed below were in thepositions shown as of November 1998.
State/Territory Epidemiologist Laboratory DirectorAlabama John P. Lofgren, MD William J. Callan, PhDAlaska John P. Middaugh, MD Gregory V. Hayes, DrPHArizona Robert W. England, Jr, MD, MPH Barbara J. Erickson, PhDArkansas Thomas C. McChesney, DVM Michael G. ForemanCalifornia Stephen H. Waterman, MD, MPH Paul Kimsey, PhDColorado Richard E. Hoffman, MD, MPH Ronald L. Cada, DrPHConnecticut James L. Hadler, MD, MPH Sanders F. Hawkins, PhD Delaware A. LeRoy Hathcock, PhD Roy Almeida, DrPHDistrict of Columbia Martin E. Levy, MD, MPH James B. Thomas, ScDFlorida Richard S. Hopkins, MD, MSPH E. Charles Hartwig, ScDGeorgia Kathleen E. Toomey, MD, MPH Elizabeth A. Franko, DrPHHawaii Paul Effler, MD, MPH Vernon K. Miyamoto, PhDIdaho Christine G. Hahn, MD Richard H. Hudson, PhDIllinois Byron J. Francis, MD, MPH David F. Carpenter, PhDIndiana Gregory K. Steele, DrPH, MPH David E. NauthIowa M. Patricia Quinlisk, MD, MPH Mary J. R. Gilchrist, PhDKansas Gianfranco Pezzino, MD, MPH Roger H. Carlson, PhDKentucky Glyn G. Caldwell, MD Samuel Gregorio, DrPH (Acting)Louisiana Louise McFarland, DrPH Henry B. Bradford, Jr, PhDMaine Kathleen F. Gensheimer, MD, MPH John A. KruegerMaryland Diane M. Dwyer, MD, MPH J. Mehsen Joseph, PhDMassachusetts Alfred DeMaria, Jr, MD Ralph J. Timperi, MPHMichigan Mathew L. Boulton, MD, MPH Robert Martin, DrPH, PhDMinnesota Michael T. Osterholm, PhD, MPH Norman Crouch, PhD (Acting)Mississippi Mary Currier, MD, MPH Joe O. Graves, PhDMissouri H. Denny Donnell, Jr, MD, MPH Eric C. Blank, DrPHMontana Todd A. Damrow, PhD, MPH Mike Spence, MDNebraska Thomas J. Safranek, MD Steve Hinrichs, MDNevada Randall L. Todd, DrPH L.D. Brown, MD, MPHNew Hampshire Jesse Greenblatt, MD, MPH Veronica C. Malmberg, MSNNew Jersey John H. Brook, MD, MPH Thomas J. Domenico, PhDNew Mexico C. Mack Sewell, DrPH, MS David E. Mills, PhDNew York City Benjamin A. Mojica, MD, MPH Alex Ramon, MD, MPHNew York State Perry F. Smith, MD Ann Willey, PhDNorth Carolina J. Newton MacCormack, MD, MPH Lou F. Turner, DrPHNorth Dakota Larry A. Shireley, MPH, MS James D. Anders, MPHOhio Thomas J. Halpin, MD, MPH William Becker, DOOklahoma J. Michael Crutcher, MD, MPH Richard Baltaro, MDOregon David W. Fleming, MD Michael R. Skeels, PhD, MPHPennsylvania James T. Rankin, Jr, DVM, PhD, MPH Bruce Kleger, DrPHRhode Island Utpala Bandyopadhyay, MD, MPH Walter S. Combs Jr, PhDSouth Carolina James J. Gibson, MD, MPH Harold Dowda, PhDSouth Dakota Susan E. Lance, DVM, PhD, MPH Michael SmithTennessee William L. Moore, Jr, MD Michael W. Kimberly, DrPHTexas Diane M. Simpson, MD, PhD David L. Maserang, PhDUtah Craig R. Nichols, MPA Charles D. Brokopp, DrPHVermont Peter D. Galbraith, DMD, MPH Burton W. Wilcke, Jr, PhDVirginia Robert B. Stroube, MD, MPH James L. Pearson, DrPHWashington Juliet VanEenwyk, PhD (Acting) Jon M. Counts, DrPHWest Virginia Loretta E. Haddy, MS, MA Frank W. Lambert, Jr, DrPHWisconsin Jeffrey P. Davis, MD Ronald H. Laessig, PhDWyoming Gayle L. Miller, DVM, MPH Garry McKee, PhD, MPHAmerican Samoa Edgar C. Reid, DSM, MPH (Acting) Edgar C. Reid, MO, MPHFederated States of Micronesia Jean-Paul Chaine —Guam Robert L. Haddock, DVM, MPH Florencia Nocon (Acting)Marshall Islands Tom D. Kijiner —Northern Mariana Islands Jose L. Chong, MD Joseph VillagomezPalau Jill McCready, MS, MPH —Puerto Rico Carmen C. Deseda, MD, MPH José Luis Miranda Arroyo, MDVirgin Islands Jose Poblete, MD (Acting) Norbert Mantor, PhD
Vol. 47 / No. SS-5

The Morbidity and Mortality Weekly Report (MMWR) Series is prepared by the Centers for Disease Controland Prevention (CDC) and is available free of charge in electronic format and on a paid subscription basisfor paper copy. To receive an electronic copy on Friday of each week, send an e-mail message [email protected]. The body content should read SUBscribe mmwr-toc. Electronic copy also isavailable from CDC’s World-Wide Web server at http://www.cdc.gov/ or from CDC’s file transfer protocolserver at ftp.cdc.gov. To subscribe for paper copy, contact Superintendent of Documents, U.S. GovernmentPrinting Office, Washington, DC 20402; telephone (202) 512-1800.
Data in the weekly MMWR are provisional, based on weekly reports to CDC by state health departments.The reporting week concludes at close of business on Friday; compiled data on a national basis are officiallyreleased to the public on the following Friday. Address inquiries about the MMWR Series, including materialto be considered for publication, to: Editor, MMWR Series, Mailstop C-08, CDC, 1600 Clifton Rd., N.E., Atlanta,GA 30333; telephone (888) 232-3228.
All material in the MMWR Series is in the public domain and may be used and reprinted withoutpermission; citation as to source, however, is appreciated.
✩U.S. Government Printing Office: 1998-733-228/87046 Region IV
MMWR