Surrogate Endpoints: The Challenges are Greater than they Seem March 7, 2005 Thomas R. Fleming,...
61
Surrogate Endpoints: The Challenges are Greater than they Seem March 7, 2005 Thomas R. Fleming, Ph.D. Professor and Chair of Biostatistics University of Washington NIDDK Workshop:
-
Upload
carmella-boyd -
Category
Documents
-
view
215 -
download
1
Transcript of Surrogate Endpoints: The Challenges are Greater than they Seem March 7, 2005 Thomas R. Fleming,...

Surrogate Endpoints: The Challenges are
Greater than they Seem
March 7, 2005
Thomas R. Fleming, Ph.D.Professor and Chair of Biostatistics
University of Washington
NIDDK Workshop:

Surrogate Endpoints
• Criteria for Study Endpoints
• A Correlate does not a Surrogate Make
• Validation of Surrogates
• Controversial Issues with AA

Criteria for Study Endpointsin Clinical Trials
• Measurable/Interpretable
• Sensitive
• Clinically relevant ~ Retinopathy, Nephropathy ~ Major hypoglycemic events: Coma/Seizure

Use of Surrogate Endpoints
Treatment Effects on Surrogate Endpoints eg: ~ Oncology: Tumor Burden Outcomes ~ HIV/AIDS: CD4, Viral Load
~ Cardiovascular Dis: B.P., Cholesterol ~ Type 1 Diabetes: HbA1c , C-Peptide
• Establishes Biological Activity
• But Not Necessarily Clinical Efficacy
Surrogate Endpoints
• Criteria for Study Endpoints
• A Correlate does not a Surrogate Make
• Validation of Surrogates
• Controversial Issues with AA
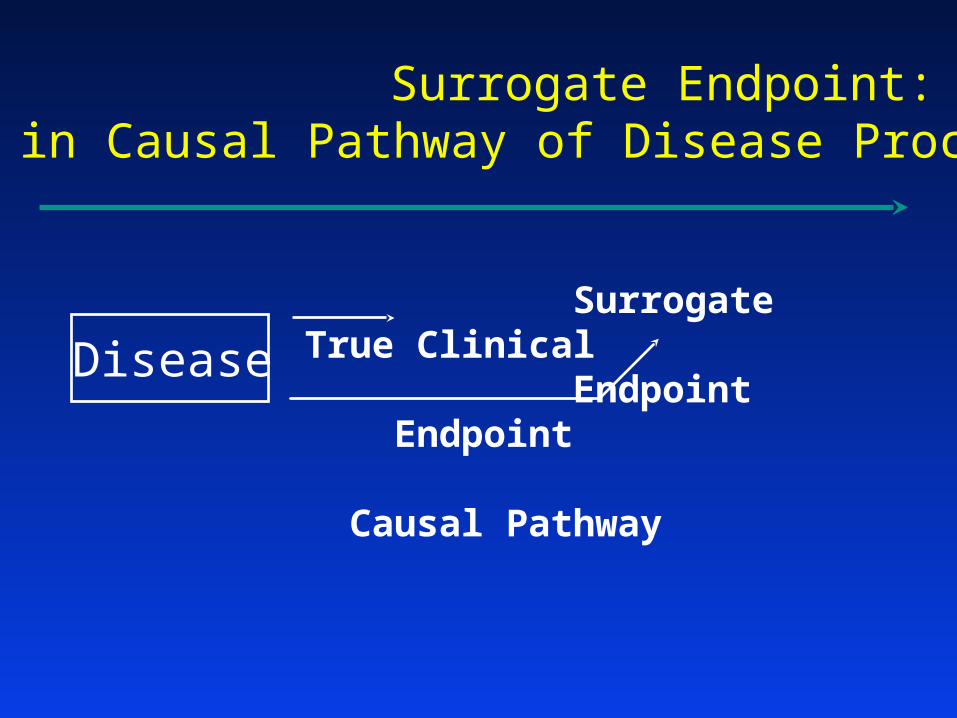
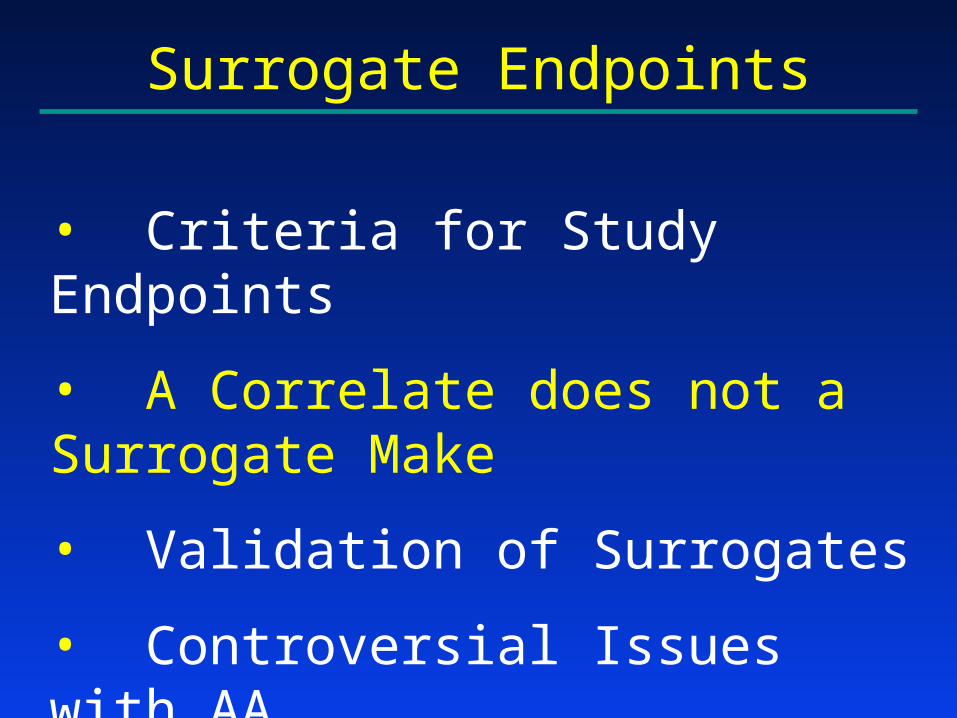
Surrogate Endpoint:Not in Causal Pathway of Disease Process
Disease Surrogate True Clinical Endpoint Endpoint
Causal Pathway
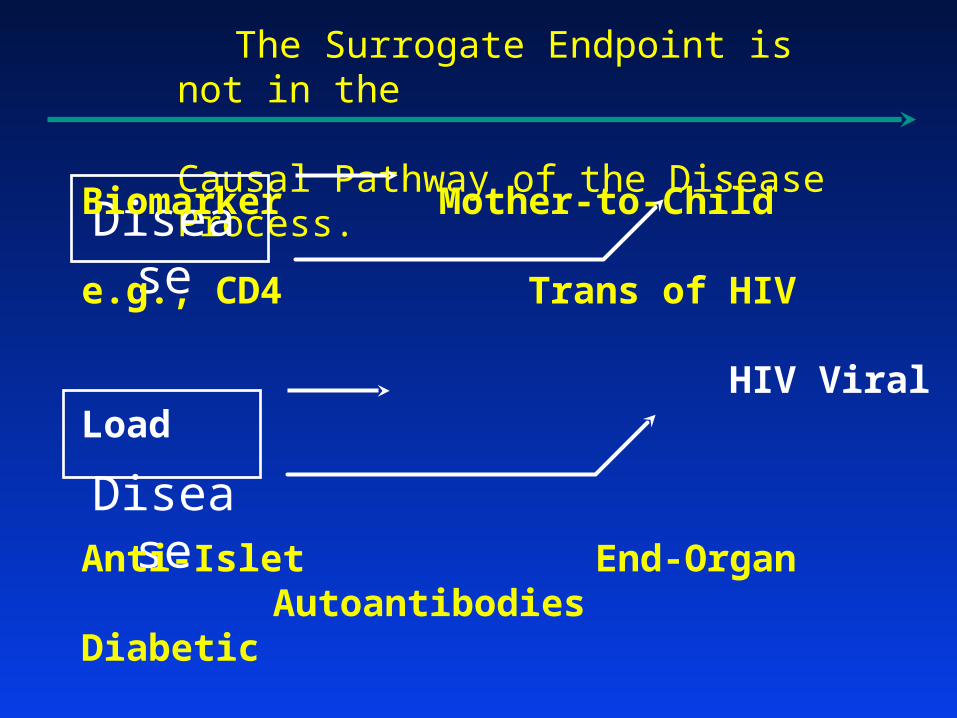
The Surrogate Endpoint is not in the Causal Pathway of the Disease Process.
Disease
Disease
Biomarker Mother-to-Child e.g., CD4 Trans of HIV
HIV Viral Load
Anti-Islet End-Organ Autoantibodies Diabetic
Complications β-Cell Function
• “Correlates”: Useful for Disease Diagnosis, or Assessing Prognosis and Effect Modification• “Valid Surrogates”: Replacement Endpoints

Surrogate True ClinicalEndpoint Endpoint
Intervention
Disease
True Clinical Endpoint
Surrogate Endpoint
Disease
Intervention
Multiple Pathways of the Disease Process

Surrogate True ClinicalEndpoint Endpoint
Intervention
Disease
End-Organ DiabeticComplications HbA1c
Glycemic Control
Disease
Intervention
Multiple Pathways of the Disease Process
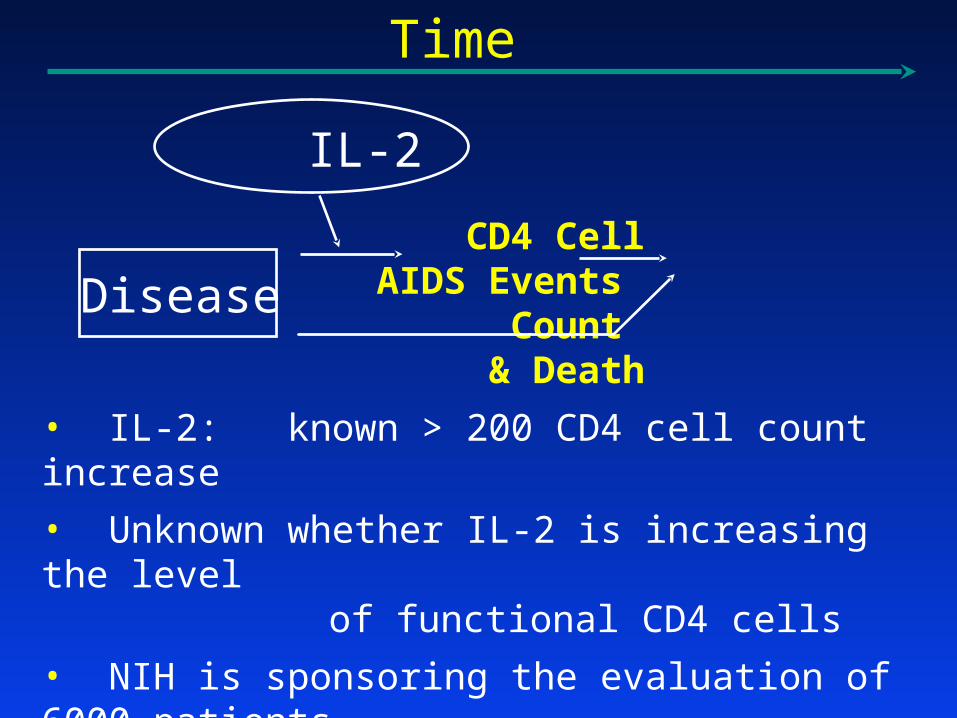
CD4 Cell AIDS Events Count & Death
IL-2
Disease
• IL-2: known > 200 CD4 cell count increase
• Unknown whether IL-2 is increasing the levelof functional CD4 cells
• NIH is sponsoring the evaluation of 6000 patients,followed for >5 years, in SILCAAT and ESPRIT
Time

Surrogate True Clinical Endpoint EndpointDisease
Intervention
Interventions having Mechanisms of Action Independent of the Disease Process

Arrhythmia OverallSuppression SurvivalDisease
Intervention
Interventions having Mechanisms of Action Independent of the Disease Process

Surrogate Endpoints
• Criteria for Study Endpoints
• A Correlate does not a Surrogate Make
• Validation of Surrogates
• Controversial Issues with AA

End Stage Renal Disease
Goal: Normalize Hematocrit Values and reduce Death and MI

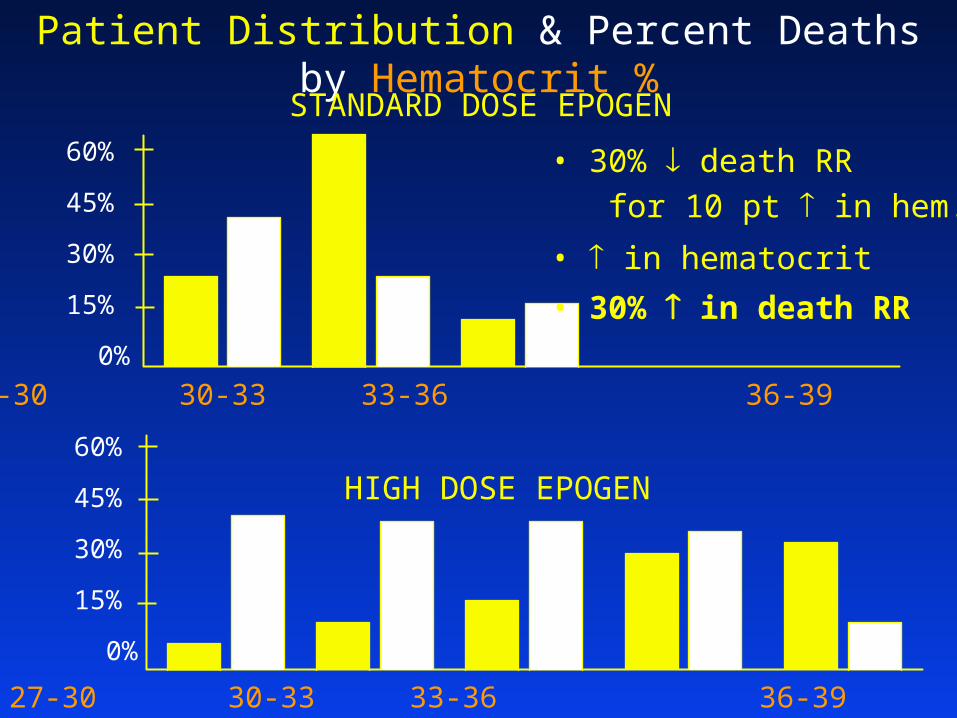
Patient Distribution & Percent Deaths by Hematocrit %
27-30 30-33 33-36 36-39 39-42
STANDARD DOSE EPOGEN
60%
45%
30%
15%
0%

End Stage Renal Disease
Goal: Normalize Hematocrit Values and reduce Death and MI

End Stage Renal Disease
High Dose EpogenStandard Dose Epogen
R
Goal: Normalize Hematocrit Values and reduce Death and MI

Patient Distribution & Percent Deaths by Hematocrit %
27-30 30-33 33-36 36-39 39-42
STANDARD DOSE EPOGEN
60%
45%
30%
15%
0%

Patient Distribution & Percent Deaths by Hematocrit %
27-30 30-33 33-36 36-39 39-42
STANDARD DOSE EPOGEN
HIGH DOSE EPOGEN
• 30% death RR
for 10 pt in hem.
60%
45%
30%
15%
0%
60%
45%
30%
15%
0%
27-30 30-33 33-36 36-39 39-42

Patient Distribution & Percent Deaths by Hematocrit %
27-30 30-33 33-36 36-39 39-42
STANDARD DOSE EPOGEN
HIGH DOSE EPOGEN
• 30% death RR
for 10 pt in hem.
60%
45%
30%
15%
0%
60%
45%
30%
15%
0%
27-30 30-33 33-36 36-39 39-42

Patient Distribution & Percent Deaths by Hematocrit %
27-30 30-33 33-36 36-39 39-42
STANDARD DOSE EPOGEN
HIGH DOSE EPOGEN
• 30% death RR
for 10 pt in hem.
• in hematocrit
60%
45%
30%
15%
0%
60%
45%
30%
15%
0%
27-30 30-33 33-36 36-39 39-42
Patient Distribution & Percent Deaths by Hematocrit %
27-30 30-33 33-36 36-39 39-42
STANDARD DOSE EPOGEN
HIGH DOSE EPOGEN
• 30% death RR
for 10 pt in hem.
• in hematocrit
• 30% in death RR
60%
45%
30%
15%
0%
60%
45%
30%
15%
0%
27-30 30-33 33-36 36-39 39-42

End Stage Renal Disease
High Dose EpogenStandard Dose Epogen
R
Goal: Normalize Hematocrit Values and reduce Death and MI
Besarab et al, NEJM 339:584-590, 1998:“ in incidence of thrombosis of vascular access sites”

How does onevalidate
asurrogate endpoint?

Validation of Surrogate Endpoints
Property of a Valid Surrogate
Effect of the Intervention on the Clinical Endpoint
is reliably predicted by the
Effect of the Intervention on the Surrogate Endpoint

Prentice’s Sufficient Conditions
1. The surrogate endpointmust be correlated with
the clinical outcome
2. The surrogate endpoint must fully capture
the net effect of the intervention on the clinical outcome

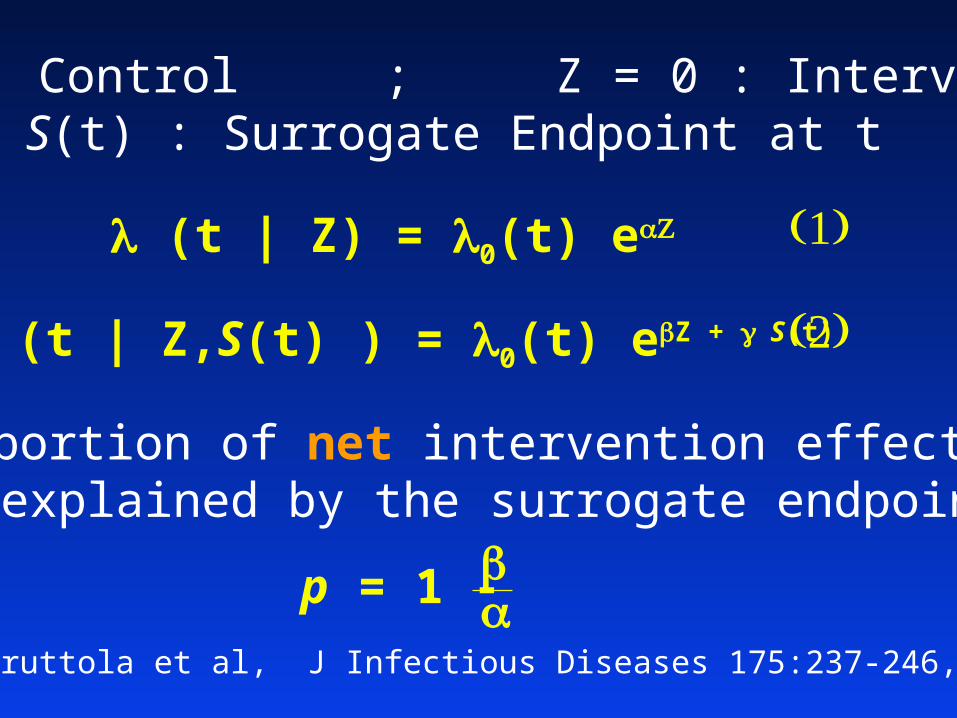
Z = 1 : Control ; Z = 0 : InterventionS(t) : Surrogate Endpoint at t
(t | Z) = 0(t) e
(t | Z,S(t) ) = 0(t) eZ + S(t)
Proportion of net intervention effectexplained by the surrogate endpoint:
DeGruttola et al, J Infectious Diseases 175:237-246, 1997
p = 1 -

Meta-analysesare required to explore
the validityof surrogate endpoints
Z = 1 : Control ; Z = 0 : InterventionS(t) : Surrogate Endpoint at t
(t | Z) = 0(t) e
(t | Z,S(t) ) = 0(t) eZ + S(t)
Proportion of net intervention effectexplained by the surrogate endpoint:
DeGruttola et al, J Infectious Diseases 175:237-246, 1997
p = 1 -

HbA1c Major Clinical Glycemic Control Events
• Unintended negative effects
• Alternative beneficial effects
Disease
Intervention
Time

Validation of Surrogate Endpoints
Statistical Meta-analyses of clinical trials data
Clinical Comprehensive understanding of the
~ Causal pathways of the disease process ~ Intervention’s intended and unintended
mechanisms of action

Hazard Ratios for DFS vs Overall Survival
0.5
0.6
0.7
0.8
0.9
1
1.1
1.2
1.3
0.5 0.6 0.7 0.8 0.9 1 1.1 1.2 1.3
Disease Free Survival Hazard Ratio
Ove
rall
Su
rviv
al H
azar
d R
atio

Endpoint Hierarchy
• True Clinical Efficacy Measure
• Validated Surrogate Endpoint (Rare)
• Non-validated Surrogate Endpoint that is “reasonably likely to predict clinical benefit”
• Correlate that is solely a measure of Biological Activity

Illustrations of Valid Surrogates
Preventing Mother-to-Child Transmission of HIV when using short course antiretrovirals
~ Prevention of AIDS and Death often occurring within two years
Substantial Sustained Reduction in Blood Pressure when using β-blockers or low dose diuretics
~ Prevention of Fatal and Non-fatal Stroke

Hierarchy for Outcome Measures
• True Clinical Efficacy Measure
• Validated Surrogate Endpoint (Rare)
• Non-validated Surrogate Endpoint that is “reasonably likely to predict clinical benefit”
• Correlate that is solely a measure of Biological Activity

Establishing a Level #3 Outcome Measure
• Accurately representing the treatment’s effect on the predominant mechanism through which the disease process induces clinical risks
• Lack of large adverse effects on clinical endpoint not captured by the outcome measure
• Net effect on the clinical endpoint is consistent with what would be predicted by
level of effect on the outcome measure
• Targeted effect on outcome measure sufficiently strong and durable to predict meaningful benefit

Hierarchy for Outcome Measures
• True Clinical Efficacy Measure
• Validated Surrogate Endpoint (Rare)
• Non-validated Surrogate Endpoint that is “reasonably likely to predict clinical benefit”
• Correlate that is solely a measure of Biological Activity

Surrogate Endpoints
• Criteria for Study Endpoints
• A Correlate does not a Surrogate Make
• Validation of Surrogates
• Controversial Issues with AA

FDA Oncology Drugs AC: 3/12-13/03
’95-’00: 12 Accelerated Approvals Facts presented to ODAC: Of 12 AA, 8 remain unresolved:
• Average time from AA to Completion of Validation Trial projected to be 10 years
• In one case, sponsor enrolled 8 pts/year
• In 3 cases, Validation Trial indicated minimal treatment benefit

FDA Oncology Drugs AC: 3/12-13/03
’95-’00: 12 Accelerated Approvals
Disturbing Issues re Validation Trials:• Enrollment difficulties into validation trials
• Cross-ins on the control arm
• Loss of “sense of urgency” by sponsor
• Lack of clear vision for proper process when the validation trial
is not conclusively positive

FDA Oncology Drugs AC: 3/12-13/03
’95-’00: 12 Accelerated Approvals Facts presented to ODAC: Of 12 AA, 8 remain unresolved:
• Average time from AA to Completion of Validation Trial projected to be 10 years
• In one case, sponsor enrolled 8 pts/year
• In 3 cases, Validation Trial indicated minimal treatment benefit

FDA Oncology Drugs AC: 3/12-13/03
’95-’00: 12 Accelerated Approvals
Disturbing Issues re Validation Trials:• Enrollment difficulties into validation trials
• Cross-ins on the control arm
• Loss of “sense of urgency” by sponsor
• Lack of clear vision for proper process when the validation trial
is not conclusively positive

Hierarchy for Outcome Measures
• True Clinical Efficacy Measure
• Validated Surrogate Endpoint (Rare)
• Surrogate Endpoint that is “reasonably likely to predict clinical benefit”
• None of the Above: A Correlate that is solely a measure of Biological Activity

Use of Biological Markers
• As “Correlates”… Disease Diagnosis, or assessing
Prognosis or Effect Modification
• In Screening or Proof of Concept Trials… Primary Endpoint
• In Definitive Trials… Supportive Data on Mechanism of Action

NIDDK Workshop
• Surrogate Endpoints
• The Next Step after the Phase 1
Trial

Development Strategies
After Phase 1: What should be the next step?
~ Phase 2
~ Phase 2B (Intermediate Trial)
~ Phase 3

Why Conduct a Phase 2 Trial?
Obtain improved insights:
• Biological Activity: Proof of Concept• Refinements in dose/schedule• Safety• Improving adherence to interventions• Improving quality of trial conduct
- Timely accrual- High quality study implementation- High quality data, including retention

Development Strategies
After Phase 1: What should be the next step?
~ Phase 2
~ Phase 2B (Screening Trial)
~ Phase 3

The Randomized Phase 2B “Screening Trial”
Illustration: Type 1 Diabetes
Primary Endpoint:
Time to Hypoglycemic Events or
End-Organ Diabetic Complications
Targeted Treatment Effect:
33% reduction in progression rate

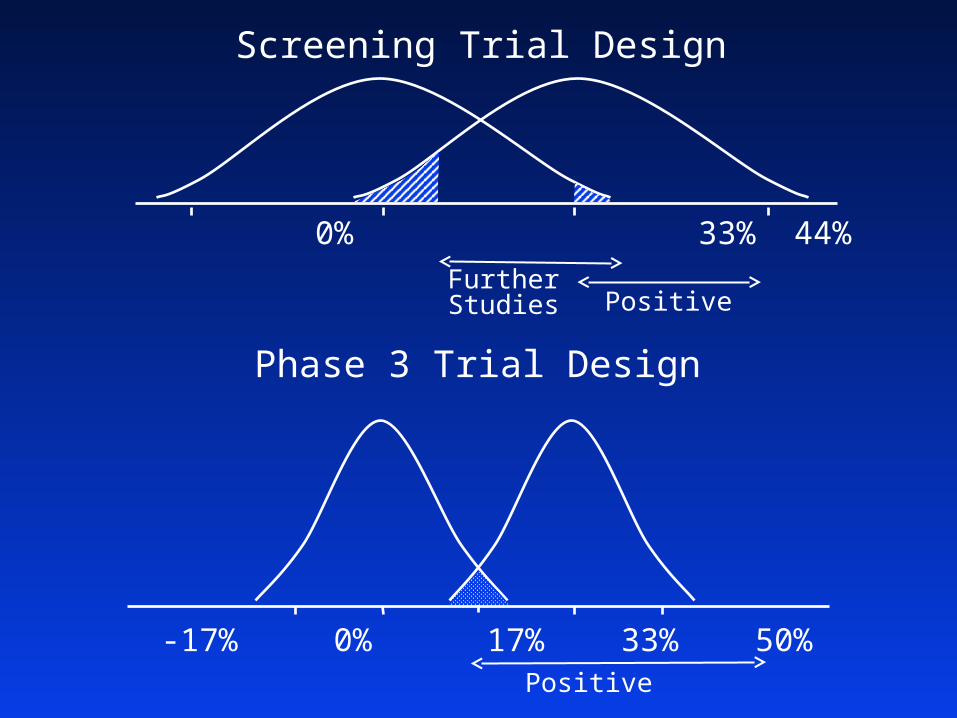
Screening Trial Design
Phase 3 Trial Design
-33% 0% 33% 44% 67%
FurtherStudies Positive
-17% 0% 17% 33% 50%Positive
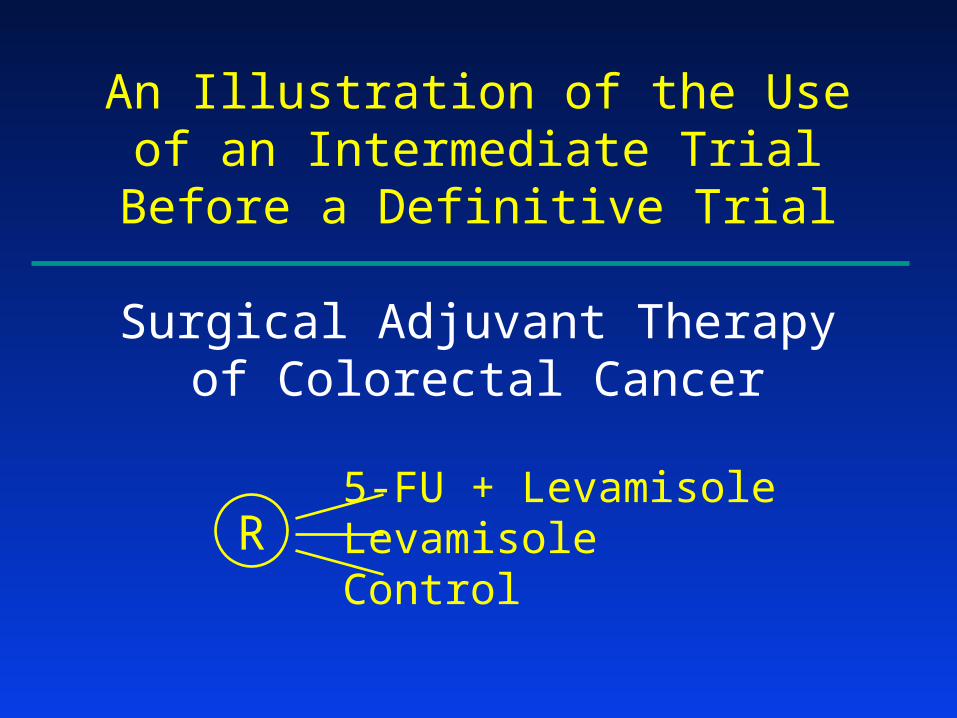
An Illustration of the Useof an Intermediate TrialBefore a Definitive Trial
Surgical Adjuvant Therapyof Colorectal Cancer
5-FU + LevamisoleLevamisoleControl
R

SURGICAL ADJUVANT THERAPYOF COLORECTAL CANCER
Surv
i vin
g, %
0 1 2 3 4 5 6
100 -
80 -
60 -
40 -
20 -
0
Years from randomization
NCCTG Trial
5-FU+LEV n=91Levamisole n=85Control n=86

Screening Trial Design
Phase 3 Trial Design
-33% 0% 33% 44% 67%
FurtherStudies Positive
-17% 0% 17% 33% 50%Positive

SURGICAL ADJUVANT THERAPYOF COLORECTAL CANCER
Surv
i vin
g, %
0 1 2 3 4 5 6
100 -
80 -
60 -
40 -
20 -
0
Years from randomization
NCCTG Trial
5-FU+LEV n=91Levamisole n=85Control n=86
SURGICAL ADJUVANT THERAPYOF COLORECTAL CANCER
Surv
i vin
g, %
0 1 2 3 4 5 6
100 -
80 -
60 -
40 -
20 -
0
Years from randomization
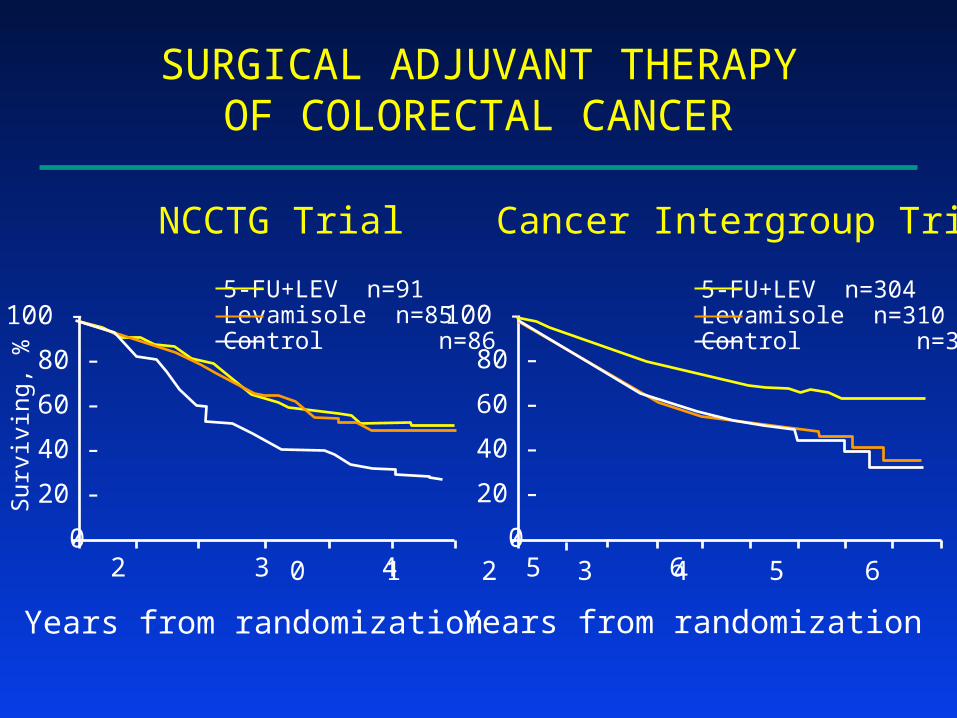
NCCTG Trial Cancer Intergroup Trial
0 1 2 3 4 5 6 7 8 9
100 -
80 -
60 -
40 -
20 -
0
Years from randomization
5-FU+LEV n=91Levamisole n=85Control n=86
5-FU+LEV n=304Levamisole n=310Control n=315

Important Observations
• Confirmatory trials of promising results from Intermediate Trials can be performed successfully
• Confirmatory trials- can reveal true positives (eg, 5-FU+Lev)- can reveal true negatives (eg, Levamisole)

SURGICAL ADJUVANT THERAPYOF COLORECTAL CANCER
Surv
i vin
g, %
0 1 2 3 4 5 6
100 -
80 -
60 -
40 -
20 -
0
Years from randomization
NCCTG Trial Cancer Intergroup Trial
0 1 2 3 4 5 6 7 8 9
100 -
80 -
60 -
40 -
20 -
0
Years from randomization
5-FU+LEV n=91Levamisole n=85Control n=86
5-FU+LEV n=304Levamisole n=310Control n=315

RAZT Labor/Delivery/1 wk to I
NVP Single doses to M/I
Illustration of a Screening Trial with “Compelling” Results: HIVNET 012
• 8/99 Results Lancet 1999; 354: 795-802
MCT of HIV N 6-8 wks 14-16 wks
AZT 302 59 (21.3%) 65 (25.1%)
NVP 307 35 (11.9%) 37 (13.1%)
1p = 0.0014 1p = 0.0003
Screening Trial Design
Phase 3 Trial Design
-33% 0% 33% 44% 67%
FurtherStudies Positive
-17% 0% 17% 33% 50%Positive

Goals in Development of Diabetes Drugs
• Using Biomarkers to achieve a cost-effective research strategy
• Achieving rapid availability of drugs providing improved benefit-to-risk profile
• Achieving reliable as well as timelyevaluation of both efficacy and safety
of new interventions