Surrey Sussex Eye Health Needs Assessment DRAFT 18082015
52
Surrey and Sussex Eye Health Needs Assessment
Transcript of Surrey Sussex Eye Health Needs Assessment DRAFT 18082015

Surrey and Sussex Eye Health Needs Assessment

OFFICIAL
2
Surrey and Sussex Eye Health Needs Assessment Version number: 1:0 First published: August 2015 Prepared by: Richard Broughton , FCOptom DipCLP, Chair of Local Eye Health Professional Network Steering Group for Surrey and Sussex David Harries, Health Analyst, Quality Observatory, South, Central and West Commissioning Support Unit The National Health Service Commissioning Board was established on 1 October 2012 as an executive non-departmental public body. Since 1 April 2013, the National Health Service Commissioning Board has used the name NHS England for operational purposes.

OFFICIAL
3
Contents 1 EXECUTIVE SUMMARY ..................................................................................... 5
1.1 Aim ................................................................................................................ 5
1.2 Why focus on eye health? ............................................................................. 5
1.3 Population ..................................................................................................... 5
1.4 Eye conditions ............................................................................................... 5
1.4.1 Definition of macular degeneration ......................................................... 5
1.4.2 Definition of glaucoma ............................................................................ 6
1.4.3 Definition of cataract ............................................................................... 6
1.4.4 Definition of uncorrected refractive error ................................................. 6
1.4.5 Definition of visual impairment ................................................................ 7
1.5 Local prevalence of eye conditions ............................................................... 7
1.6 Factors affecting eye conditions .................................................................... 7
1.7 Vision loss ..................................................................................................... 8
1.8 Preventing vision loss .................................................................................... 8
1.8.1 Case detection ........................................................................................ 8
1.8.2 Management ........................................................................................... 8
1.9 Care and Support services for people with vision loss .................................. 9
RECOMMENDATIONS ............................................................................................ 10
Macular Degeneration ........................................................................................... 10
Glaucoma .............................................................................................................. 10
Cataracts ............................................................................................................... 10
Children’s Vision ................................................................................................... 11
Other health conditions and disability ................................................................... 11
2 INTRODUCTION ............................................................................................... 12
2.1 Authors ........................................................................................................ 12
2.2 Acknowledgement ....................................................................................... 12
2.3 Definition of a health needs assessment ..................................................... 12
2.4 Aim .............................................................................................................. 12
2.5 Eye health ................................................................................................... 12
3 METHODOLOGY .............................................................................................. 13
3.1 Estimates of prevalence of eye disease ...................................................... 13
3.2 Population ................................................................................................... 13
3.3 Literature ..................................................................................................... 13
3.4 Activity data ................................................................................................. 13
4 POLICY DRIVERS ............................................................................................ 13
4.1 UK vision strategy........................................................................................ 13
4.2 Public Health Outcomes Framework ........................................................... 14
4.3 NHS Outcomes Framework 2012/13 ........................................................... 14
4.4 Quality Innovation Productivity and Prevention (QIPP) Programme ............ 15
4.5 Call to Action for Eye Health 2014 ............................................................... 15
4.6 NHS Five Year Forward View 2014 ............................................................. 15
5 DESCRIPTION OF POPULATION CHARACTERISTICS ................................. 16
5.1 Age .............................................................................................................. 16
5.2 Ethnicity ....................................................................................................... 17
5.3 Deprivation .................................................................................................. 18
5.4 Smoking ...................................................................................................... 20

OFFICIAL
4
6 EYECARE WORKFORCE ................................................................................. 21
7 DEFINITIONS OF VISUAL IMPAIRMENT ......................................................... 23
Children and young people ................................................................................... 26
7.1 Care and Support services for people with vision loss ................................ 27
7.1.1 Rehabilitation support ........................................................................... 27
7.2 Eye Care for Disadvantaged Patients and those with Disabilities ............... 29
7.2.1 Patients with Learning Disabilities ......................................................... 29
7.2.2 Dementia and sight loss ........................................................................ 29
7.2.3 Homeless People, Prisoners and the Traveller Community .................. 30
7.2.4 Other health conditions and disability ................................................... 30
7.2.5 Recommendations ................................................................................ 30
8 IMPACT OF VISUAL IMPAIRMENT .................................................................. 30
9 PREVALENCE AND TREATMENT OF EYE DISEASE .................................... 32
9.1 Macular Degeneration ................................................................................. 32
9.1.1 Description ............................................................................................ 32
9.1.2 Factors affecting the development of AMD ........................................... 33
9.1.3 Local services ....................................................................................... 33
9.1.4 Intervention and prevention .................................................................. 33
9.1.5 Recommendations ................................................................................ 34
9.2 Glaucoma .................................................................................................... 35
9.2.1 Description ............................................................................................ 35
9.2.2 Factors affecting development of glaucoma ......................................... 35
9.2.3 Local services ....................................................................................... 36
9.2.4 Interventions and prevention ................................................................. 37
9.2.5 Recommendations ................................................................................ 37
9.3 Cataracts ..................................................................................................... 39
9.3.1 Description ............................................................................................ 39
9.3.2 Factors affecting the development of cataract ...................................... 39
9.3.3 Local prevalence ................................................................................... 39
9.3.4 Local services ....................................................................................... 40
9.3.5 Interventions and prevention ................................................................. 40
9.3.6 Recommendations ................................................................................ 40
9.4 Uncorrected refractive error ......................................................................... 41
9.4.1 Description ............................................................................................ 41
9.4.2 Local prevalence ................................................................................... 41
9.4.3 Local services ....................................................................................... 42
9.4.4 Sight tests in screening for treatable eye disease ................................. 43
9.5 Children’s Vision .......................................................................................... 44
9.5.1 Existing National Recommendations .................................................... 44
9.5.2 Recommendations ................................................................................ 45
10 SUMMARY AND CONCLUSIONS .................................................................. 46
10.1 Local prevalence of eye conditions .......................................................... 46
10.2 Vision loss ................................................................................................ 47
10.3 Preventing vision loss............................................................................... 47
10.4 Case detection ......................................................................................... 47
10.5 Management ............................................................................................ 47
10.6 Care of people with vision loss ................................................................. 48
11 REFERENCES ............................................................................................... 49

OFFICIAL
5
1 EXECUTIVE SUMMARY
1.1 Aim
The aim of this assessment is to develop knowledge of eye health in relation to current and future needs of the local population and to use this to influence the commissioning of suitable eye care services and avoid preventable blindness. Methods used include literature review, and quantitative and qualitative data analysis.
1.2 Why focus on eye health?
Good vision care impacts on other aspects of health such as the ability of patients to manage other chronic conditions and the avoidance of injurious falls. People with visual impairment are more likely to require residential and community care and additional support through adaptations of their environment. Such support and the loss of quality of life incur considerable costs both to the individual and society. Because of this, specific initiatives to improve eye health, such as the UK Vision Strategy, should not be considered in isolation. Rather, alongside the planning of other strategies designed to meet broader health and social care objectives as outlined in public health and NHS outcomes frameworks, and considered in the design of multi-professional services, such as those aimed at reducing falls or smoking cessation for example.
1.3 Population
In this assessment the population of Surrey is 1,132,390 and Sussex including Brighton and Hove 1,606,932 (ONS 2011 census) is the resident population of the 12 Clinical Commissioning Groups within Surrey and Sussex and one (North East Hants and Farnham) that straddles the border between Surrey and Hampshire.
1.4 Eye conditions
The health issues under study are eye conditions that lead to visual impairment if undetected. Visual impairment may be preventable or its severity limited if diagnosed and managed appropriately. The RNIB have determined that 53% of blindness may be prevented with suitable intervention and treatment. The main causes of permanent visual impairment have been identified as age related macular degeneration (AMD), glaucoma and diabetic retinopathy. Cataracts and uncorrected refractive error also cause registerable levels of visual impairment which may be resolved with appropriate treatment. All of these conditions, with the exception of diabetic retinopathy are covered in this analysis. 1.4.1 Definition of macular degeneration
Patients with AMD lose their central vision so tasks that involve detail like reading and face recognition become difficult if not impossible (see figure 3). Peripheral

OFFICIAL
6
vision is usually preserved. There are two types of AMD, commonly known as “dry” and “wet”. In dry AMD ageing causes the development of “drusen” which are yellow deposits in the retina. This disrupts the retinal cells leading to breakdown in function and gradual loss of central vision. In wet AMD, the ageing changes in the macular area of the retina promote the development of new blood vessels (neovascularisation). These blood vessels are more fragile and prone to rupture leading to leakage of fluid into the retina causing severe loss of central vision often accompanied by distortion. Excessive fluid may lead to localised detachment of the retina. When fluid subsides, a scar usually remains. Vision loss is much more rapid than in the dry type. A protein (VEGF) has been found to be implicated in the growth of the new vessels. NICE has confirmed that in some cases treatment by injection with an anti VEGF agent Ranibizumab (Lucentis) can reduce loss of vision (NICE 2008). 1.4.2 Definition of glaucoma
Glaucoma refers to a group of conditions characterised by visual field loss, and pathological changes in the optic nerve head. There may also be raised intra-ocular pressure (IOP) as in Chronic Open Angle Glaucoma (COAG) which is a common form of the condition. Low tension glaucoma, means that the optic nerve is damaged like it is in other types of glaucoma but eye pressure is well within normal ranges. Sight loss in glaucoma is not reversible. Ocular hypertension (OHT) refers to patients who have raised IOP but do not have any sign of glaucomatous damage at the optic nerve head or visual field loss. Patients diagnosed with OHT still require ongoing monitoring as they have significantly increased risk of developing COAG later (Meleros and Wienreb 2009). Glaucoma suspects may have early signs of optic nerve damage but may not yet exhibit detectable field loss. They may or may not have raised IOP. The onset of glaucoma is gradual. The early signs are often subtle and may not be not easily identified in a single visit. Patients who are suspected of having glaucoma often require at least two visits to establish a diagnosis. 1.4.3 Definition of cataract
A cataract is the development of irregularities in the structure of the crystalline lens that leads to a reduction of transparency. Cataracts may be classified as Nuclear, Cortical or Subcapsular. Nuclear cataracts affect the inner core of the lens. Cortical cataracts affect the outer layers and subcapsular cataracts occur on the lens surface. 1.4.4 Definition of uncorrected refractive error
Refractive errors refer to the focusing errors of short and long sight and astigmatism. All of these conditions give rise to blurred images on the retina unless corrected with glasses or contact lenses.

OFFICIAL
7
1.4.5 Definition of visual impairment
Visual impairment is usually classified as either ’sight impaired’ or ‘severely sight impaired’. Sight impairment is usually defined as having poor visual acuity (3/60 to 6/60) but having a full field of vision, or having a combination of slightly reduced visual acuity (up to 6/24) and a reduced field of vision or having blurriness or cloudiness in your central vision, or having relatively good visual acuity (up to 6/18) but a significantly reduced field of vision. Severely sight impaired usually falls into one of three categories; having very poor visual acuity (less than 3/60), but having a full field of vision, having poor visual acuity (between 3/60 and 6/60) and a severe reduction in your field of vision or having slightly reduced visual acuity (6/60 or better) and a significantly reduced field of vision.
1.5 Local prevalence of eye conditions
For the population of Surrey and Sussex the National Eye Health Epidemiological Model (NEHEM) predicts that up to 151,651 people may be affected by AMD; of which approximately 13% may be of the wet type that is amenable to treatment with anti-VEGF agents such as Lucentis. There are likely to be approximately 29,338 glaucoma cases present in the population (mean prevalence based on the best available evidence NEHEM), however the subtle nature of the presentation of this condition means that any care system for glaucoma must also accommodate the needs of up to 103,712 glaucoma suspects and 57,512 ocular hypertension patients who will require careful monitoring. The model further predicts 30,631 cataract cases. Consideration of additional research indicates that there may be up to 51,010 children and 688,520 people of working age in Surrey and Sussex will have some degree of refractive error, whilst, between 14,280 and 49,980 of Surrey and Sussex over 60s have uncorrected refractive error (not wearing up to date spectacles or contact lenses). Taking all the leading causes of visual impairment and blindness used in the NEHEM, approximately 343,500 people in the Surrey and Sussex population are at risk of visual loss if these conditions are not carefully monitored and treated. In addition up to 789,500 people in the Surrey and Sussex population will have some degree of refractive error and are at risk of visual loss if these conditions are not appropriately detected and treated.
1.6 Factors affecting eye conditions
All of these conditions increase in prevalence with age. By 2020 the proportion of over 60’s in Surrey and Sussex is expected to increase overall by approximately 8%. The proportion of over 80s is predicted to increase by 18%. It may be expected therefore that the incidence of eye conditions will also increase. AMD and some types of cataract are influenced by smoking. Indeed smokers are four times more likely to develop AMD than non-smokers. Poor diet also contributes to the development of AMD.

OFFICIAL
8
Glaucoma is also influenced by ethnicity. The Black and Asian populations are at increased risk of this condition. Family history is also a risk factor for this disease.
1.7 Vision loss
14,270 people in Surrey and Sussex are already registered as either blind or partially sighted (Health and Social Care Information Centre, 2014). There are expected to be double this number of people with permanent vision loss by 2050. This figure represents a fall in the number registered as blind or partially sighted from the previous years and maybe an under estimate. There are many factors affecting registration including access to the process and a desire for some patients not to be “labelled” as visually impaired. As the Certificate of Visual Impairment (CVI) is to be used as the indicator of success in preventing vision loss, it would be worthwhile exploring the factors that affect registration locally so that this measure may be more accurately determined and better understood. More importantly than whether CVI is an indicator for prevention or not; is that people with certifiable sight loss are known to the services so that appropriate support is available for them. Under reporting, if present, will result in underestimated need.
1.8 Preventing vision loss
The priority for the prevention of visual loss in the majority of conditions is early case detection and good management post diagnosis. There is also a case for multi-professional working in the prevention of disease, particularly with regard to co-operation on smoking cessation initiatives and the promotion of good diet. There should be an emphasis on reaching populations identified as having multiple deprivations as people within such populations tend to present to health services rather later than average and as such are more at risk of vision loss. 1.8.1 Case detection
The most logical tool for case detection in the general population is the sight test as this includes both refraction, with prescription of spectacles where required, and an assessment of eye health with onward referral in cases of possible eye disease. Figures on sight tests from the Health and Social Care Information Centre (HSCIC) suggest that only 1 in 5 children and approximately 1 in 10 adults of working age have had their eyes tested. The figures for older adults were rather better as 3 in 5 over 60s have had their eyes tested but this still means that 40% of this high risk group may have undetected ocular conditions. The HSCIC typically report on NHS funded activity only and are not necessarily remitted to report on the private eye care sector. For example, the HSCIC figures do not include the number of sight tests taken up by regular VDU users, funded through their employers. Therefore these figures are not likely to be representative of the population as a whole given the greater usage of NHS treatment by people living in socially deprived neighbourhoods or by the elderly population. 1.8.2 Management
Once detected, adequate treatment and regular follow up of patients with eye conditions is needed to minimise vision loss. Unfortunately, local hospital episode

OFFICIAL
9
statistics data is not sufficiently detailed for the adequacy of supply of secondary care ophthalmology services for the population to be estimated for glaucoma or AMD. Difficulty with coding of outpatient cases means that it was not possible to determine how many of the predicted cases of eye conditions are currently known and managed by local services. Similarly, detailed data on waiting times, clinic capacities and service quality was not available due to the complexity and size of the data collection exercise that would be required to achieve this. Data sourced from Hospital Episode Statistics on NHS Hospitals and NHS commissioned activity in the independent sector for cataract removal (3 year average 2009-10 to 2011-12) showed that an average of 57% of predicted cases (NEHEM) receive treatment in Surrey and Sussex (compared to average of 70% across England). However, the use of private health care maybe distorting the treatment rates and needs to be considered along with other factors to understand the extent of any geographical variation in treatment rates. If the efficiency of services currently offered is to be assessed and service improvements are to be measured the quality of data available needs to be much improved and readily accessible.
1.9 Care and Support services for people with visio n loss
The RNIB Sight Loss Data Tool identified hospital locations providing outpatient ophthalmology appointments and mapped the hospital to specific local authorities based on postcode. Across Surrey and Sussex 8 out of 16 hospitals were mapped as providing outpatient ophthalmology appointments having some form of early intervention support available in the eye clinic. A hospital was counted as having some form of emotional and practical support in place if: • Eye Clinic Liaison Officers were in post.
• Other professionals were providing an ECLO-type role, for example an ophthalmic nurse with an element of patient support built into their role, or some form of Patient Support Service was in place.
• Volunteers were in place
Visual impairment rehabilitation is an intervention delivered by specialist professionals. Rehabilitation Officers help people to maximise their functional vision and skills for confident daily living. A survey conducted by the Social Care Association in 2012 mapped the provision of this support in England. The survey estimated that the number of Rehabilitation Officers - Visual Impairment working in Surrey and Sussex was 29. In 2012/13, there were 1,595 blind and partially sighted people in receipt of adult social care services paid for or provided by the local authority. Published figures for 2013 sourced from the Department for Work and Pensions show 2,510 blind and partially sighted people are claiming Disability Living Allowance in Surrey and Sussex.

OFFICIAL
10
RECOMMENDATIONS
Macular Degeneration
• Consistent use of AMD urgent referral guidance across Surrey and Sussex
• Full coverage across Surrey and Sussex of best practice fast track referral pathways from Optometrists and GPs which minimise avoidable delays to starting treatment.
• Secure electronic referrals to be introduced to improve the speed and quality of
referrals. In many areas, faxes are still used for transfer of information. • Treatment of confirmed wet AMD to start within 2 weeks of diagnosis and for
timely review and re-treatment appointments to occur on time.
• Separate clinics for monitoring stable wet AMD. • Ensure that optometrists and GPs, particularly locums, receive regular support /
training to recognise the symptoms and signs of wet AMD and should be familiar with the local process for urgent referrals.
• Ensure that all patients who have visual loss have access to an ECLO service
and services which provide support and visual rehabilitation.
Glaucoma
• Referrals to secondary care for glaucoma should be of a high quality in Surrey
and Sussex with schemes in place across the area for glaucoma referral refinement.
• Those patients diagnosed with ocular hypertension and glaucoma who are
deemed to be of low risk can be appropriately seen in the community allowing the acute trusts capacity to see the more complex and high risk patients. This will ensure follow up appointments for patients with glaucoma are not delayed.
Cataracts
• Adoption of community based direct referral by optometrists to reduce the number of false positive referrals for cataract surgery.
• Patients should only be referred in line with the current CCG criteria, following
counselling on the risks and benefits of surgery. Common criteria for referral should be adopted across Surrey and Sussex. Significant co-existing eye disease and patient related complicating factors should be considered before direct referral for cataract surgery.
• Providers should be required to follow the Royal College of Ophthalmologists,
Cataract Surgery Guidelines (2010)

OFFICIAL
11
• After uncomplicated cataract surgery, the patient should be reviewed by an
accredited eye health professional for post-op examination and refraction and where possible this should be in the community. In community based schemes professionals should provide feedback on the post-op clinical, visual acuity and refractive data to the unit where the surgery took place and to refer the patient back to the unit if complications are found.
• Ensure that the cataract pathway caters for every individual's need e.g.
dementia, learning difficulties or where general anaesthetic is indicated.
Children’s Vision
• Awareness of the importance of children’s eye health and the need for regular sight tests throughout childhood should be promoted from an early age by health visitors and other health care professionals.
• Orthoptic-Led vision screening programmes should be provided for all eligible children in the 4-5 year age range, to minimum standards in line with BIOS Guidelines. This includes children in mainstream state, independent and special schools and those who are home tutored. (BIOS statement on Orthoptic-Led vision screening 2015)
• A standardised referral pathway for managing screening fails should be adopted (BIOS vision screening care pathway)
Other health conditions and disability
• Improve access within the community to eye examinations for people with learning disabilities
• Decrease the disparity between the eye health of people with learning disabilities and that of the general population.
• Improve the quality of eye services for people with learning disabilities.
• Improve access within the community to eye examinations for people with dementia.
Improve appropriate access to eye examinations for Homeless People, Prisoners, Gypsy and Travellers

OFFICIAL
12
2 INTRODUCTION
2.1 Authors
Richard Broughton FCOptom DipCLP, Chair of Local Eye Health Professional Network Steering Group for Surrey and Sussex and David Harries, Health Analyst, Quality Observatory, South, Central and West Commissioning Support Unit.
2.2 Acknowledgement
The Surrey and Sussex Local Eye Health Network acknowledge the contribution to this document from the Greater Manchester Eye Health Needs Assessment 2012 and wish to thank Dr Sarah Slade PhD for giving permission to use content
2.3 Definition of a health needs assessment
A health needs assessment may be defined as a systematic method for reviewing the health issues facing a population, leading to agreed priorities and resource allocation that will improve health and reduce inequalities (Cavanagh & Chadwick, 2005).
2.4 Aim
The aim of this assessment is to improve local knowledge of eye health in relation to the perceived needs of the local population and to use this to influence the commissioning of suitable eye care services and avoid preventable blindness.
2.5 Eye health
The health issues under study are eye conditions that lead to visual impairment if undetected but which may be preventable if diagnosed and managed appropriately. The RNIB have determined that 53% of blindness may be prevented with suitable intervention and treatment. Although part of this figure for preventable sight loss is due to mild to moderate impairment from uncorrected refractive error. The main causes of permanent visual impairment have been identified as age related macular degeneration (AMD), glaucoma and diabetic retinopathy (Bunce et al 2010). Cataracts and uncorrected refractive error also cause registerable levels of visual impairment which may be resolved with appropriate treatment. All of these conditions, with the exception of diabetic retinopathy are covered in this analysis. The annual reports of the four screening programmes in Surrey, East and West Sussex and Brighton and Hove already deal with this topic in some detail.

OFFICIAL
13
3 METHODOLOGY
3.1 Estimates of prevalence of eye disease
After consideration of a number of sources and methods used in other health needs assessments (Surrey and Sussex 2012, NHS Brighton and Hove 2011) the National Eye Health Epidemiological Model (NEHEM) has been used to estimate the prevalence of glaucoma, cataract and macular degeneration in the Surrey and Sussex population. The estimates predicted by the model are based on the 2001 census data, so the population data on which it is based are slightly out of date but it is the most robust method available given that available research literature on the prevalence of eye disease in the UK population is sparse.
3.2 Population
Prevalence rates have been customised for Surrey and Sussex using 2011 Census population as the base population as they provide a consistent ethnic group breakdown by age and sex population groups. The model outputs the numbers of people with a specific eye condition for each area chosen. Total prevalence are calculated by multiplying the NEHEM base prevalence rates in each age/sex/ethnic group by the 2011 Census population count in each age/sex/ethnic group. Elsewhere, demographic data to show the age profile of Surrey and Sussex uses the latest available resident population estimates (mid-year 2013) and latest projected population estimates (2012 based) available from the Office of National Statistics (ONS).
3.3 Literature
Key websites included in the literature search include those of NICE, RNIB, College of Optometrists, Royal College of Ophthalmologists and NEHEM.
3.4 Activity data
Information relating to general ophthalmic services was sourced from the Health and Social Care Information Centre (www.hscic.gov.uk). Clinical activity data was collected from locally held hospital episode statistics and audit data relating to local enhanced services.
4 POLICY DRIVERS There are multiple policy drivers for producing a needs assessment relating to eye health in Surrey and Sussex.
4.1 UK vision strategy
Published by the UK Vision 2020 strategic advisory group the primary aim of the strategy is to eliminate avoidable blindness by the year 2020 (RNIB 2008). It has three key aims:
• To improve the eye health of the people of the UK

OFFICIAL
14
• Eliminate avoidable sight loss and deliver excellen t support to those with a visual impairment
• Enhance the inclusion, participation and independen ce of blind and
partially sighted people
4.2 Public Health Outcomes Framework
Indicator 4.12 of the recently published public health outcomes framework confirms a commitment to reduce avoidable blindness that mirrors the Vision 20:20 UK aim of avoiding preventable blindness by the year 2020.
• 4.12 Proportion of Certificate of Visual Impairment (CVI) registrations that are due to age related macular degeneration (A MD), glaucoma and diabetic retinopathy
• 2.24 Falls and Injuries in the over 65’s
• 4.14 Hip fractures in the over 65’s
• 2.23 Self-reported well being
• 4.13 Health related quality of life for older people
Improvements in the additional indicators listed may also be assisted by improvements in eye health. It has been shown that visual impairment is a risk factor for falls in older people (Scuffham et al 2002). People with visual impairment are more likely to be depressed (Evans et al 2007). Self-care for other systemic conditions is likely to be affected (Douglas et al 2006) resulting in poorer health outcomes for these patients than those who are not visually impaired.
4.3 NHS Outcomes Framework 2012/13
Two of the five overarching indicators in the NHS outcomes framework can be directly and positively influenced by efficient eye care services:
• Number 2: Enhancing quality of life for people with long term conditions • Number 3: Ensuring that people have a positive expe rience of care.
In addition, good eye care services could indirectly influence the following individual indicators by enabling people to self-manage their other health conditions:
• 1a, Reduction in potential years of life lost from causes amenable to healthcare
• 3.6 Helping older people to recover their independe nce after illness or surgery

OFFICIAL
15
4.4 Quality Innovation Productivity and Prevention (QIPP)
Programme
Ophthalmology has been identified by a number of the emerging CCGs as being an area in which they feel may benefit from development under the Quality Innovation Productivity and Prevention (QIPP) programme. There is scope to optimise use of the available workforce and improve treatment pathways for patients as outlined by the National Eye care Steering Group 1st Report (Busby 2004).
4.5 Call to Action for Eye Health 2014
The Call to Action for Eye Health highlighted the following key areas both in Surrey and Sussex and at National level
• IT/Communications – need to integrate primary and secondary care.
• Restructure delivery of care to provide more emphasis on services in the community
• Integrated Pathways – need to improve capacity and skills
• Need to increase accessibility of sight tests particularly in relation to high risk groups
4.6 NHS Five Year Forward View 2014
The NHS Five Year Forward Plan sets out four priorities to improve health
• Cancer
• Mental Health
• Learning Disabilities
• Diabetes
And four key priorities for service redesign
• Urgent and emergency care
• Strengthen primary care
• Elective Care
• Reshaping specialised services

OFFICIAL
16
5 DESCRIPTION OF POPULATION CHARACTERISTICS
5.1 Age
The data currently available for individual areas are 2013 mid-year population estimates based on updated results of the 2011 census data reported via the Office of National Statistics (ONS). As all data is collected in a consistent way the combination of data from the different areas to create a combined population for Surrey and Sussex is less problematic. Similarly, the assumptions made within the population projections (2012 based) from ONS will be consistent between areas. Whilst these forecasts may not be completely accurate, any additional complications that may be created by compounding the data into a single dataset (figure 1) will be minimised.
FIGURE 1: Percentage of population split by age in Surrey and Sussex compared with England average, 2013, 2023 and 2033
Source: 2013 Mid-Year Population Estimates, Office for National Statistics © Crown Copyright 2014

OFFICIAL
17
FIGURE 2: Percentage of population split by age in Surrey and Sussex compared with England average, 2013 and 2033
The prevalence of many eye diseases increases with increasing age. Surrey and Sussex has a greater proportion of adults aged 45 and over than the England average. The number of people over 65 in Surrey and Sussex is projected to increase from 555,200 (19.9% of total population) in 2013 to 671,700 (22.3%) by 2023 and 846,300 (26.3% of total population) by 2033. The proportion of people over 85 is expected to increase by 60%. The area has a lower proportion of children and younger adults than the England average with those aged 0-19 years of age accounting for 22.8% of the Surrey and Sussex population. The combined profile for the whole of Surrey and Sussex does conceal some large differences in distribution of age between some localities. For example Brighton and Hove has more people aged between 20-30 years and the older age groups are under-represented. The reverse is true in areas most noticeably in Rother (East Sussex) and Arun (West Sussex) where there are a far greater proportion of older people. The prevalence of many eye conditions increases with age so such variation needs to be taken into account when planning services in a particular locality.
5.2 Ethnicity
Available ethnicity data is derived from the 2011 census and provided by ONS and is aggregated from County and Unitary authorities within Surrey and Sussex. It is of interest as glaucoma is more prevalent in Black and Asian populations.

OFFICIAL
18
FIGURE 3: Ethnicity of Surrey and Sussex population (%)
5.3 Deprivation
Populations where there are multiple deprivation indicators have been shown to be more likely to present with eye disease later than others (Fraser et al 2001). This increases the risk of sight loss in deprived areas. The exploration of the effect of deprivation on presentation and whether the population of deprived areas is accessing services is more difficult. The first map below shows the Index of Multiple Deprivation (IMD) score by Lower Super Output Area (LSOA) within Surrey and Sussex CCG boundaries. The LSOAs are shaded on the map using five equally sized groups (quintiles), so that 20 per cent of LSOAs fall into each group. Lighter shaded colours indicate less deprivation whilst darker shades more deprived. The second map highlights those LSOAs shaded dark that are the most deprived 20 per cent LSOAs within Surrey and Sussex. However, corresponding data that would highlight whether people in these areas are accessing services when needed is not readily available.

OFFICIAL
19
Map 1: Index of Multiple Deprivation (2010) score by Lower Super Output Area, Surrey and Sussex
Map 2: Most deprived Lower Super Output Areas within Surrey and Sussex
In interpreting these maps it is important to remember that our perception of these patterns is partially influenced by differences in size of the LSOAs. LSOAs are synthetic statistical areas built from postcodes and designed specifically to capture small areas of similar population size (averaging around 1,600 people). Accordingly urban LSOAs are much smaller (in area) than rural ones.

OFFICIAL
20
5.4 Smoking
Smoking has been implicated in the development of more than one eye disease. Public Health statistics available by County and Unitary authority show a large variation in smoking prevalence across Surrey and Sussex. Latest estimates (Figure 3) for 2013 from the Integrated Household Survey show 25.2% of adults in Brighton and Hove i.e. approximately 1 in 4 adults are smokers. This is significantly higher than the average for the South East (17.2%) and significantly higher than the average for England (18.4%). Surrey (14.8%) has a significantly lower rate than England whilst both East and West Sussex have similar rates to the England average. FIGURE 4: Estimates of smoking prevalence across Surrey and Sussex by County and Unitary Authority.

OFFICIAL
21
2008 2009 2010 2011 2012 2013
Surrey and Sussex 507 519 552 578 570 576
England 9,540 10,023 10,409 10,806 11,133 11,457
Brighton & Hove City PCT 58 60 63 63 59 57
East Sussex Downs & Weald PCT 54 55 60 60 62 61
Hastings & Rother PCT 28 28 30 30 31 31
Surrey PCT 235 237 253 274 273 279
West Sussex PCT 132 139 146 151 145 148
Data source: Health and Social Care Information Centre, 2014
2008 2009 2010 2011 2012 2013
Surrey and Sussex 19.3 19.6 20.7 21.5 21.0 21.2
England 18.4 19.2 19.8 20.3 20.8 21.4
Brighton & Hove City PCT 22.1 22.6 23.4 23.1 21.4 20.7
East Sussex Downs & Weald PCT 16.0 16.2 17.6 17.4 17.9 17.6
Hastings & Rother PCT 15.4 15.4 16.4 16.4 16.9 16.9
Surrey PCT 21.5 21.5 22.7 24.4 24.1 24.6
West Sussex PCT 16.7 17.5 18.2 18.7 17.8 18.2
Data source: Health and Social Care Information Centre, 2014
6 EYECARE WORKFORCE Primary eye care services are provided by community optometrists, a small number of ophthalmic medical practitioners (OMPs) and GPs. Community optometrists (and OMPs) provide both private and general ophthalmic services (GOS) sight tests and prescribe spectacles or contact lenses where these are required. Sight tests include tests that assess the eye health. Optometrists have a duty of care to refer patients to other appropriate professionals, usually ophthalmologists, where disease or abnormality of the eye is detected. The dispensing of glasses, contact lenses and in some case low vision aids may be carried out by dispensing opticians in addition to optometrists. Table 1 below shows the number of ophthalmic practitioners (Optometrists and Ophthalmic Medical Practitioners) who were authorised, by NHS England, to carry out NHS funded sight tests as at 31 December each year. Table 1: Number of ophthalmic practitioners in Surrey and Sussex by AT and PCT, as at 31 December each year
Calculating the number of ophthalmic practitioners per 100,000 population allows us to compare across local areas and against the England average. Whilst overall the Surrey and Sussex number is similar to England, there is some variation between local areas, with the lowest number of ophthalmic practitioners in Hastings and Rother (16.9 per 100,000 population) compared with Surrey (24.6 per 100,000 population). Table 2: Number of ophthalmic practitioners per 100,000 population in Surrey and Sussex by AT and PCT, as at 31 December each year

OFFICIAL
22
Number of contractors involved in services Ho
rsh
am
an
d C
raw
ley
Co
ast
al W
est
Su
sse
x
Ea
stb
ou
rne
& H
ast
ing
Lew
es
& H
igh
We
ald
Bri
gh
ton
&b
Ho
ve
Ea
st S
urr
ey
Su
rre
y D
ow
ns
No
rth
We
st S
urr
ey
Gu
ildfo
rd &
Wa
ve
rle
y
Su
rre
y H
ea
th
NE
Ha
nts
& F
arn
ha
m
Total number of GOS contractors 48 50 44 17 20 20 30 44 19 8 6
cataract direct referral 0 22 14 10 21 32 12 5 6
cataract post-op 0 20 14 0 0 0 0 0
Aces/Pears 11 5 0 0 0 0 0
Stable Glaucoma Monitoring 2 5 6 0 0 0 0 0
glaucoma repeat measures/referral refinement 4 25 11 16 14 0 0 32 12 5 6
AMD 0 0 0 0 0 10 21 32 12 5
Figure 5: Number of ophthalmic practitioners per 100,000 population in Surrey and Sussex compared with England, as at 31 December each year
All Surrey and Sussex community optometric practices provide GOS services. In some areas of Surrey and Sussex optometrists also provide enhanced eye care services such as diagnosis of acute red eye conditions, repeat pressures for suspect glaucoma patients and cataract care as shown in table 3. TABLE 3: Number of optometric contractors involved in enhanced services
GPs are often the initial point of contact of patients who are concerned about the health of their eyes. This is especially true for minor ailments such as conjuncitivitis, blepharitis and meibomian cysts (styes) which account for around 70% of eye complaints dealt with by GPs (McDonnell 1988). It has been estimated that 1.5% of

OFFICIAL
23
Secondary Care Trust NH
S B
rig
hto
n &
Ho
ve
CC
G
NH
S C
oa
sta
l We
st
Su
sse
x C
CG
NH
S C
raw
ley
CC
G
NH
S E
ast
Su
rre
y C
CG
NH
S E
ast
bo
urn
e
Ha
ilsh
am
& S
ea
ford
NH
S G
uild
ford
&
Wa
ve
rle
y C
CG
NH
S H
ast
ing
s &
Ro
the
r C
CG
NH
S H
igh
We
ald
Lew
es
Ha
ve
ns
CC
G
NH
S H
ors
ha
m &
Mid
Su
sse
x C
CG
NH
S N
ort
h W
est
Su
rre
y C
CG
NH
S S
urr
ey
Do
wn
s
CC
G
NH
S S
urr
ey
He
ath
CC
G
NH
S N
ort
h E
ast
Ha
mp
shir
e &
Fa
rnh
am
CC
G
WESTERN SUSSEX HOSPITALS NHS TRUST � � �
EAST SUSSEX HEALTHCARE NHS TRUST � � �
SURREY AND SUSSEX HEALTHCARE NHS TRUST � � � � � �
BRIGHTON AND SUSSEX UNIVERSITY HOSPITALS NHS TRUST � � � � � �
ASHFORD AND ST PETER'S HOSPITALS NHS FOUNDATION TRUST � �
ROYAL SURREY COUNTY HOSPITAL NHS FOUNDATION TRUST � � � � � �
QUEEN VICTORIA HOSPITAL NHS FOUNDATION TRUST � � � � � � � � �
FRIMLEY PARK HOSPITAL NHS FOUNDATION TRUST ���� ���� ���� ����
CCG
Direct Cataract
Referral
Post
Cataract
IOP
Refinement
Repeat Fields OHT & Stable
Glaucoma
Fast Track
Direct ARMD
Stable ARMD
(OCT)
ACES/PEARS Low Vision
NE East Hants & Farnham Yes No Yes Yes No Yes No Proposed
Guildford & Waverley Yes Yes Yes Yes No Yes No Proposed
Surrey Heath Yes No Yes Yes No Yes No Proposed
NW Surrey Yes No Yes Yes No No No No
Surrey Downs Yes No No No No Yes No No
East Surrey ? No No No Yes ? No No
Brighton & Hove Yes Yes Yes No No No Yes No
Coastal West Sussex Yes Yes Yes No No No No Yes
Crawley No No Yes No No No No Yes
Eastbourne, Hailsham & Seaford Yes Yes Yes No Yes No No No
Hastings and Rother Yes Yes Yes No Yes No No No
High Weald Lewes Havens Yes Yes Yes No Yes No No No
Horsham & Mid Sussex No No Yes No No No No Yes
GP consultations relate to eye problems (Sheldrick et al 1993). GPs may refer a patient to an optometrist, a GP specialist or onward to ophthalmology. A number of hospitals are involved in the provision of secondary care hospital eye services. The majority of hospital eye services in each locality however are provided by ophthalmologists in the eight NHS trusts listed in table 4. Ophthalmologists are medically trained specialists in eye disease and treatment. They are supported by ophthalmic nurses, orthoptists (who provide diagnostics related to abnormalities of binocular vision including visual fields and childhood strabismus (squint)), and hospital optometrists. TABLE 4: Principal secondary care providers of eye care services in Surrey and Sussex
Table 5 provides an overview of the provision of local enhanced services commissioned by Clinical Commissioning Groups across Surrey and Sussex. TABLE 5: Optometric contractors involved in enhanced services
7 DEFINITIONS OF VISUAL IMPAIRMENT Blindness or severe sight impairment is defined in the National Assistance Act 1948 as “where a person is so blind as to be unable to perform any work for which sight is essential”. In practical terms the Department of Health guidance defines blindness as having vision of less than 3/60 as measured by a traditional Snellen eye test chart. This means that a person who is blind can see less at 3 metres than a normally sighted person could see at 60 metres.

OFFICIAL
24
FIGURE 6: Visual impairment patterns expected in different eye conditions compared to normal vision
Partial sight is defined as where a person is “substantially and permanently handicapped by defective vision caused by congenital defect or illness or injury”. A person with “partial sight” or “sight impairment” can see better than 3/60 but less than 6/60 i.e. can see less at 6 metres than a normally sighted person could see at 60 metres. Both of the above Snellen vision standards assume that the person has normal peripheral vision. A person may still be classed as partially sighted even if the vision is better than the limits above if their peripheral field is also restricted perhaps due to conditions such as glaucoma or because of a stroke. A person is registered as sight impaired or severely sight impaired by an ophthalmologist using the certificate of visual impairment (CVI) that replaced the older BD8 form in 2003. Not all patients who qualify for registration/certification as visually impaired will wish to be registered, especially if they feel that this will reduce their chances of finding work or if they can already access support services without it. Others may simply not wish to be labelled as visually impaired. Certification may also be overlooked when engaged in resolving the medical issues relating to treatment of eye disease. Because of these factors (and others) the number of certifications is decreasing (Bunce et al 2010). Nevertheless, the number of patients certified as having visual impairment is the measure by which the success of initiatives to reduce blindness will be measured in the public health outcomes framework as it is the best currently available indicator of vision loss. Data published for 2008 (Access Economics 2009) indicate that there were 1.8 million people with sight loss in the UK. This number was expected to increase by 22% by 2020 and to double to 3.9million people by 2050.

OFFICIAL
25
Total Blind Partially sighted Total Blind Partially sighted
2008 18,430 9,720 8,710 1,355 605 750
2011 18,205 9,860 8,345 1,200 605 595
2014 14,270 8,040 6,230 1,450 725 725
Year
All cases New cases
In the most recently published data, which is for 2014, (table 6) there were 14,270 registered cases of blindness and partial sight in total in Surrey and Sussex. Of these, 1,450 were newly registered that year. For the reasons mentioned already, these figures are likely to be an underestimate of the number of people with sight impairment. If the percentage increase is similar to that projected for the UK, Surrey and Sussex can expect to have at least 17,400 registered visually impaired people by 2020 and 28,500 by 2050. TABLE 6: Number of people registered as blind or partially sighted within Surrey and Sussex, 2008 to 2014
Data source: Health and Social Care Information Centre, 2014
Since 2011 there has been a significant reduction in the number of people registered as blind or partially sighted with Surrey and Sussex. A significant proportion of this reduction can be largely attributed to a data clean up exercise carried out during the transfer of historic registrations from a legacy system to the new IT system in West Sussex. This data cleaning exercise removed a large number of deceased people who had remained on the register since the administrators of the system had not always been reliably informed of deaths. Of the 14,270 people registered as blind or partially sighted in Surrey and Sussex, 71 per cent are aged 75 years and over; 7.9 per cent are between 65 and 74 years; 18 per cent are of working age (18–64 years); and 3.2 per cent are aged 17 years or under. Figure 7: Age distribution of registered blind and partially sighted people in Surrey and Sussex, 2014

OFFICIAL
26
Of the 14,270 people registered as blind or partially sighted in Surrey and Sussex, 33 per cent were reported as having an additional disability. Of those people registered as blind or partially sighted with an additional disability, 12.9 per cent have a mental health problem, 1.9 per cent have a learning disability, 58.5 per cent have a physical disability and 26.2 per cent have a hearing impairment. Figure 8: Percentage of people on the register of blind and partially sighted people by additional disability in Surrey and Sussex, 2014
Children and young people
The RNIB Sight Loss Data Tool estimates that there are around 1,065 blind and partially sighted children and young people aged 0-16 in Surrey and Sussex, and 571 aged 17-25. Around half of these will have additional disabilities and/or special educational needs. Many of these children and young people will need help and support in order to maximise their potential in education and in other activities.
• There are an estimated 1,065 blind and partially sighted children aged 0-16
• There are an estimated 571 blind and partially sighted young people aged 17-25
• There are an estimated 533 blind and partially sighted children with additional
needs
• There are 322 pupils with a statement of special education needs (SEN) or at School Action Plus with visual impairment as their primary SEN

OFFICIAL
27
7.1 Care and Support services for people with visio n loss
The provision of emotional and practical support at the right time can help people who are experiencing sight loss to retain their independence and access the support they need. Patient experience in the eye clinic is crucial. It is here that people receive their diagnosis, undergo treatment and potentially go through the process of receiving a Certificate of Vision Impairment. Equally, when someone experiences sight loss it is vital for them to have support in their homes and communities, including social care paid for by provided by local authorities. The RNIB Sight Loss Data Tool identified hospital locations providing outpatient ophthalmology appointments and mapped the hospital to specific local authorities based on postcode. Across Surrey and Sussex 8 out of 16 hospitals were mapped as providing outpatient ophthalmology appointments having some form of early intervention support available in the eye clinic. It should be noted when viewing these figures that Hospitals often provide services to patients from multiple local authorities. TABLE 7: Eye clinic support mapped to Local Authorities, 2013
Source: RNIB (2013) Eye clinic mapping data
A hospital was counted as having some form of emotional and practical support in place if: • Eye Clinic Liaison Officers were in post.
• Other professionals were providing an ECLO-type role, for example an ophthalmic nurse with an element of patient support built into their role, or some form of Patient Support Service was in place.
• Volunteers were in place.
This indicator does not take into account the possible varying quality of support. It also does not take into account the varying sizes of eye clinics. 7.1.1 Rehabilitation support
Visual impairment rehabilitation is an intervention delivered by specialist professionals. Rehabilitation Officers help people to maximise their functional vision and skills for confident daily living. A survey conducted by the Social Care Association in 2012 mapped the provision of this support in England. The survey estimated that the number of Rehabilitation Officers - Visual Impairment working in Surrey and Sussex was 29.
Brighton East Sussex Surrey West Sussex Surrey and Sussex
Number of hospitals providing
ophthalmic outpatient clinics 2 3 7 4 16
Number with early intervention
support in place 1 3 3 1 8

OFFICIAL
28
TABLE 8: Number of Rehabilitation Officers
Source: SCA (2012) Estimated number of ROVIs currently working in the UK. Social Care Association (figures validated and updated May
2015)
Notes:
East Sussex also has 3 x FTE assistant resource Officers and 1 x 12hrs Mobility Officer commissioned through Third Sector
West Sussex FTE figure includes 3 unqualified Rehabilitation Officers
Blind Veterans UK have 7 Rehabilitation Officers based at one of their headquarters near Brighton
FTE – Full time equivalent
In 2012/13, there were 1,595 blind and partially sighted people in receipt of adult social care services paid for or provided by the local authority. TABLE 9: Number of people registered of blind and partially sighted in receipt of Adult Social Care services, 2012/13
Source: NASCIC (2013) Adult social care: Referrals, Assessments and Packages of Care data, 2012/13. National Adult Social Care
Information Centre.
**Notes: Please note that there may be inaccuracies and data quality issues with the West Sussex figures for 2012-13.
Figure 9: Proportion of people registered blind and partially sighted in receipt of Adult Social Care services, 2012/13
TABLE 10: Number of people registered of blind and partially sighted claiming Disability Living Allowance, 2013
Source: DWP (2013) Benefit claimants: Disability Living Allowance by disabling condition. Department for Work and Pensions.
Disability Living Allowance (DLA) is a benefit paid to help people with the extra costs incurred as a result of a disability, and it is paid at different rates depending on the level of need. Published figure for 2013 sourced from the Department for Work and
Brighton East Sussex Surrey West Sussex Surrey and Sussex
Number of Rehab Officers (FTE) 3 3.8 10 9 26
Brighton East Sussex Surrey West Sussex Surrey and Sussex
Number of blind and partially sighted
people in receipt of adult social care 100 945 420 130 1,595
Brighton East Sussex Surrey West Sussex Surrey and Sussex
Number of DLA claimants 300 510 930 770 2,510

OFFICIAL
29
Pensions show 2,510 blind and partially sighted people are claiming Disability Living Allowance in Surrey and Sussex.
7.2 Eye Care for Disadvantaged Patients and those w ith
Disabilities
There are several groups of people who may find it hard to access eye care services or who may need special provision or adaptation of services. Amongst these groups are children and adults with learning disabilities, the homeless, Black and minority ethnic communities, patients with dementia, the Traveller community, the Prison population and some ethnic groups at particular risk of eye problems 7.2.1 Patients with Learning Disabilities
Children with learning disabilities are significantly more likely to have refractive error and visual impairment than the normal population (Das et al. 2010). A study funded by SeeAbility and RNIB found that prevalence of visual impairment amongst children with learning disabilities is 28 times greater than amongst the general population of children (Emerson and Robertson, 2011). For children of vision screening age 4-5 years commissioning should ensure equality of access across Surrey & Sussex. Equality of care can be achieved by commissioning a multi-disciplinary team an orthoptist and optometrist/ophthalmologist to conduct primary vision screening in special schools and main stream schools with specialist units to ensure equality of access for complex children. Adults: Seeability also have good evidence for visual problems being much higher in people with learning disabilities. Therefore commissioning for these groups should include local well publicised services giving longer community optometry appointments. There should be commissioning of transition clinics between children’s hospital services and adult specialist ophthalmology, and specialist clinics for those with learning difficulties, dementia, co-morbidities and, other adults who need a longer appointment and higher staff ratios.
7.2.2 Dementia and sight loss
Dementia and sight loss are both more frequent in older age. Quite often they will occur together. People with dementia still require eye examinations and frequently need longer appointments and therefore, similar extended services should be available. Reduced vision from cataract can be easily missed by carers and their symptoms put down to dementia. The RNIB Sight Loss Data Tool estimates that in Surrey and Sussex 20,398 people aged 65 and over are living with dementia

OFFICIAL
30
7.2.3 Homeless People, Prisoners and the Traveller Community
These patients may find it difficult to access sight care services. They will not normally be able to access GOS sight tests and each of these groups may move around frequently making continuity of care difficult. This can put patients’ sight at risk particularly for example in patients with diabetes where regular screening is required to detect potentially sight threatening retinopathy. 7.2.4 Other health conditions and disability
There are other health conditions and/or disabilities that are relevant when thinking about services for blind and partially sighted people. Sight loss is linked to age, and as people get older they may be living with a number of different conditions at the same time. The RNIB Sight Loss Data Tool estimates that in Surrey and Sussex: • for those aged 65 and above 5,351 falls were directly attributable to sight loss;
and 432 required hospital treatment
• 14,080 people aged 65 and over are living with the consequences of a stroke
• 297,300 people are living with a moderate or severe hearing impairment; and 7,053 people are living with a profound hearing impairment
7.2.5 Recommendations
• Improve access within the community to eye examinations for people with
learning disabilities • Decrease the disparity between the eye health of people with learning
disabilities and that of the general population. • Improve the quality of eye services for people with learning disabilities. • Improve access within the community to eye examinations for people with
dementia. • Improve appropriate access to eye examinations for Homeless People,
Prisoners, Gypsy and Travellers.
8 IMPACT OF VISUAL IMPAIRMENT The impact of visual impairment is such that it affects most other facets of life resulting in higher costs for health and social care. People with even moderate levels of visual impairment often struggle to do simple everyday tasks such as dressing, or accurate administration of medication and require additional support. Indeed it has been noted in a US study that patients with visual impairment are three times more likely to have difficulty managing their medications than those patients who have normal vision (US Dept. of Health and Human Services, 1994). Visually impaired people of working age are less likely to be
OFFICIAL
31
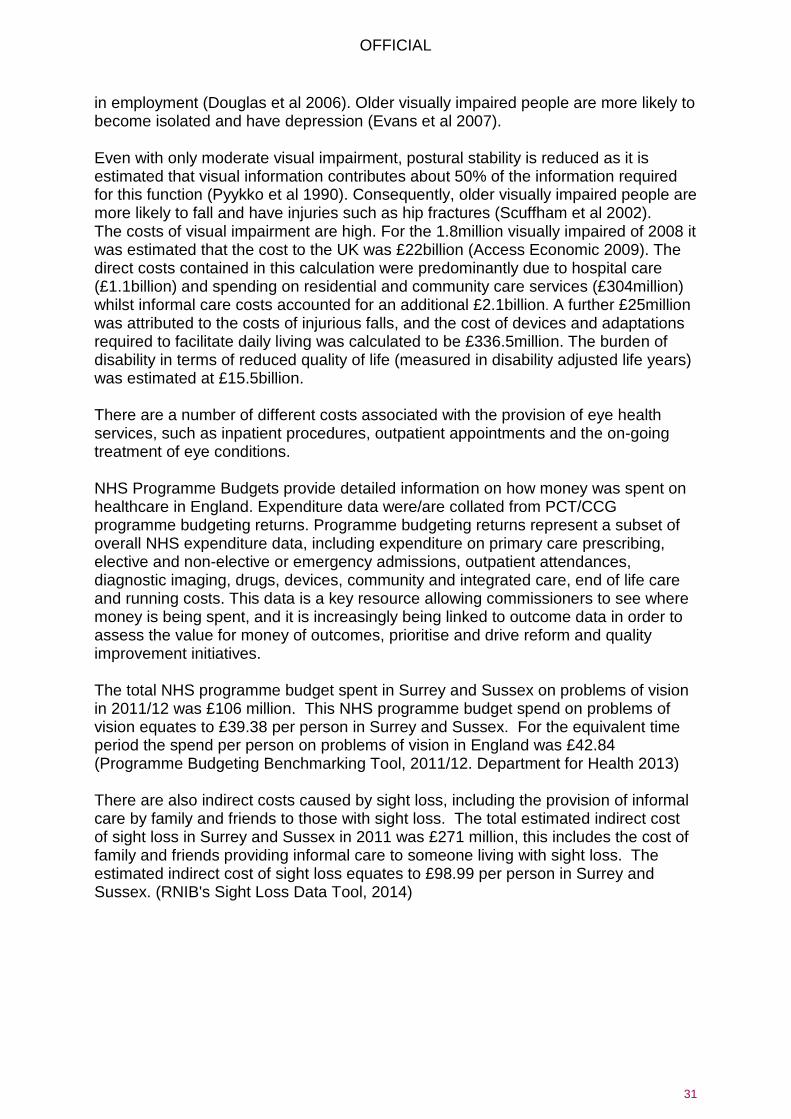
in employment (Douglas et al 2006). Older visually impaired people are more likely to become isolated and have depression (Evans et al 2007). Even with only moderate visual impairment, postural stability is reduced as it is estimated that visual information contributes about 50% of the information required for this function (Pyykko et al 1990). Consequently, older visually impaired people are more likely to fall and have injuries such as hip fractures (Scuffham et al 2002). The costs of visual impairment are high. For the 1.8million visually impaired of 2008 it was estimated that the cost to the UK was £22billion (Access Economic 2009). The direct costs contained in this calculation were predominantly due to hospital care (£1.1billion) and spending on residential and community care services (£304million) whilst informal care costs accounted for an additional £2.1billion. A further £25million was attributed to the costs of injurious falls, and the cost of devices and adaptations required to facilitate daily living was calculated to be £336.5million. The burden of disability in terms of reduced quality of life (measured in disability adjusted life years) was estimated at £15.5billion. There are a number of different costs associated with the provision of eye health services, such as inpatient procedures, outpatient appointments and the on-going treatment of eye conditions. NHS Programme Budgets provide detailed information on how money was spent on healthcare in England. Expenditure data were/are collated from PCT/CCG programme budgeting returns. Programme budgeting returns represent a subset of overall NHS expenditure data, including expenditure on primary care prescribing, elective and non-elective or emergency admissions, outpatient attendances, diagnostic imaging, drugs, devices, community and integrated care, end of life care and running costs. This data is a key resource allowing commissioners to see where money is being spent, and it is increasingly being linked to outcome data in order to assess the value for money of outcomes, prioritise and drive reform and quality improvement initiatives. The total NHS programme budget spent in Surrey and Sussex on problems of vision in 2011/12 was £106 million. This NHS programme budget spend on problems of vision equates to £39.38 per person in Surrey and Sussex. For the equivalent time period the spend per person on problems of vision in England was £42.84 (Programme Budgeting Benchmarking Tool, 2011/12. Department for Health 2013) There are also indirect costs caused by sight loss, including the provision of informal care by family and friends to those with sight loss. The total estimated indirect cost of sight loss in Surrey and Sussex in 2011 was £271 million, this includes the cost of family and friends providing informal care to someone living with sight loss. The estimated indirect cost of sight loss equates to £98.99 per person in Surrey and Sussex. (RNIB's Sight Loss Data Tool, 2014)
OFFICIAL
32
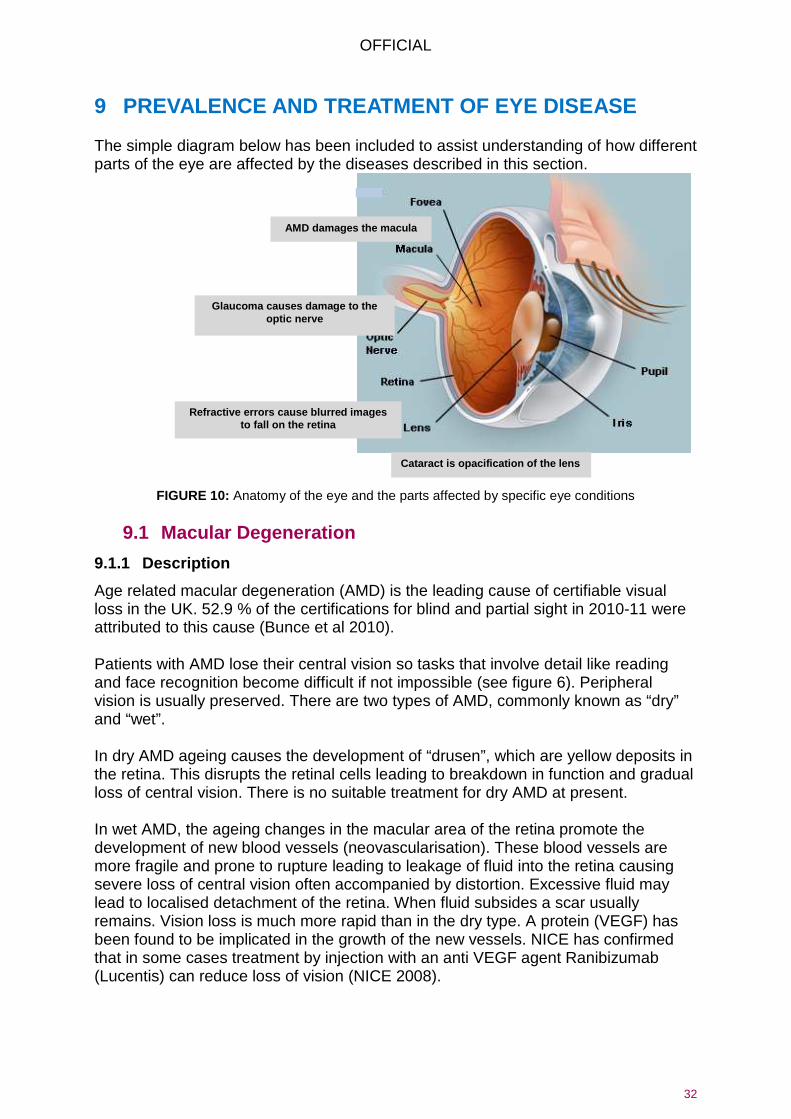
9 PREVALENCE AND TREATMENT OF EYE DISEASE The simple diagram below has been included to assist understanding of how different parts of the eye are affected by the diseases described in this section.
FIGURE 10: Anatomy of the eye and the parts affected by specific eye conditions
9.1 Macular Degeneration
9.1.1 Description
Age related macular degeneration (AMD) is the leading cause of certifiable visual loss in the UK. 52.9 % of the certifications for blind and partial sight in 2010-11 were attributed to this cause (Bunce et al 2010). Patients with AMD lose their central vision so tasks that involve detail like reading and face recognition become difficult if not impossible (see figure 6). Peripheral vision is usually preserved. There are two types of AMD, commonly known as “dry” and “wet”. In dry AMD ageing causes the development of “drusen”, which are yellow deposits in the retina. This disrupts the retinal cells leading to breakdown in function and gradual loss of central vision. There is no suitable treatment for dry AMD at present. In wet AMD, the ageing changes in the macular area of the retina promote the development of new blood vessels (neovascularisation). These blood vessels are more fragile and prone to rupture leading to leakage of fluid into the retina causing severe loss of central vision often accompanied by distortion. Excessive fluid may lead to localised detachment of the retina. When fluid subsides a scar usually remains. Vision loss is much more rapid than in the dry type. A protein (VEGF) has been found to be implicated in the growth of the new vessels. NICE has confirmed that in some cases treatment by injection with an anti VEGF agent Ranibizumab (Lucentis) can reduce loss of vision (NICE 2008).
Cataract is opacification of the lens
Glaucoma causes damage to the optic nerve
AMD damages the macula
Refractive errors cause blurred images to fall on the retina
OFFICIAL
33
9.1.2 Factors affecting the development of AMD
9.1.2.1 Ageing
The prevalence of AMD increases with age (NICE 2008).
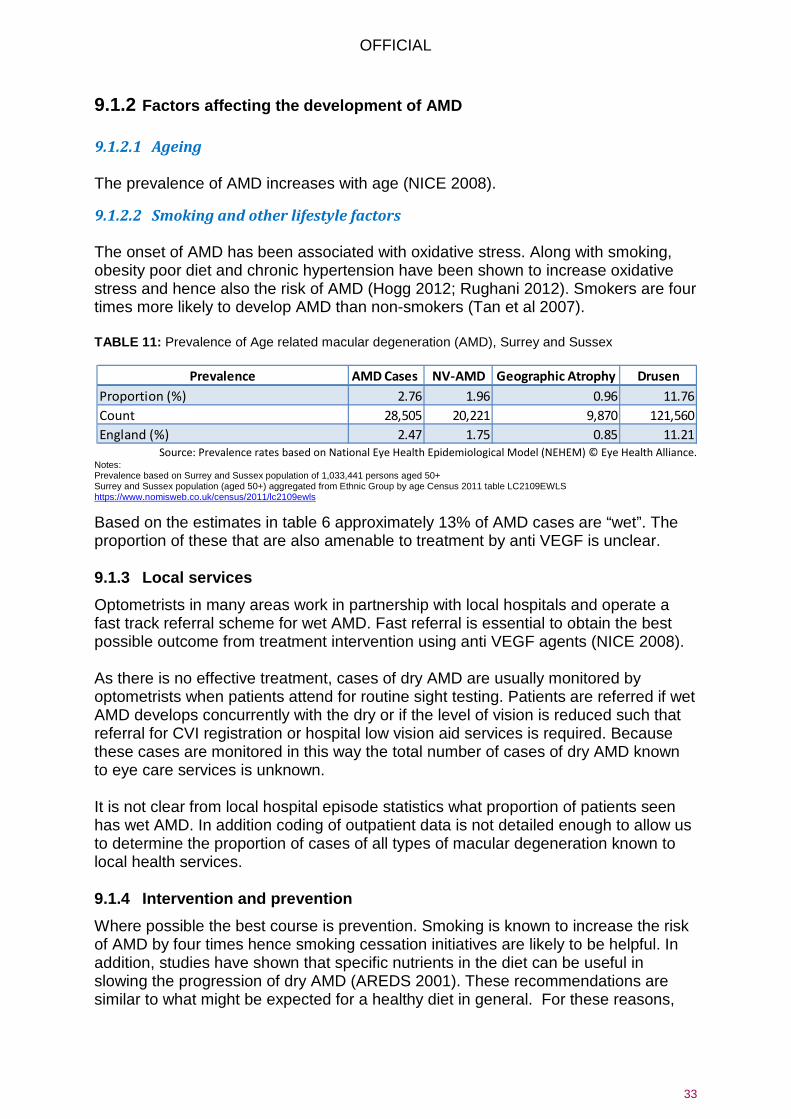
9.1.2.2 Smoking and other lifestyle factors The onset of AMD has been associated with oxidative stress. Along with smoking, obesity poor diet and chronic hypertension have been shown to increase oxidative stress and hence also the risk of AMD (Hogg 2012; Rughani 2012). Smokers are four times more likely to develop AMD than non-smokers (Tan et al 2007). TABLE 11: Prevalence of Age related macular degeneration (AMD), Surrey and Sussex
Source: Prevalence rates based on National Eye Health Epidemiological Model (NEHEM) © Eye Health Alliance. Notes: Prevalence based on Surrey and Sussex population of 1,033,441 persons aged 50+ Surrey and Sussex population (aged 50+) aggregated from Ethnic Group by age Census 2011 table LC2109EWLS https://www.nomisweb.co.uk/census/2011/lc2109ewls
Based on the estimates in table 6 approximately 13% of AMD cases are “wet”. The proportion of these that are also amenable to treatment by anti VEGF is unclear. 9.1.3 Local services
Optometrists in many areas work in partnership with local hospitals and operate a fast track referral scheme for wet AMD. Fast referral is essential to obtain the best possible outcome from treatment intervention using anti VEGF agents (NICE 2008). As there is no effective treatment, cases of dry AMD are usually monitored by optometrists when patients attend for routine sight testing. Patients are referred if wet AMD develops concurrently with the dry or if the level of vision is reduced such that referral for CVI registration or hospital low vision aid services is required. Because these cases are monitored in this way the total number of cases of dry AMD known to eye care services is unknown. It is not clear from local hospital episode statistics what proportion of patients seen has wet AMD. In addition coding of outpatient data is not detailed enough to allow us to determine the proportion of cases of all types of macular degeneration known to local health services. 9.1.4 Intervention and prevention
Where possible the best course is prevention. Smoking is known to increase the risk of AMD by four times hence smoking cessation initiatives are likely to be helpful. In addition, studies have shown that specific nutrients in the diet can be useful in slowing the progression of dry AMD (AREDS 2001). These recommendations are similar to what might be expected for a healthy diet in general. For these reasons,
Prevalence AMD Cases NV-AMD Geographic Atrophy Drusen
Proportion (%) 2.76 1.96 0.96 11.76
Count 28,505 20,221 9,870 121,560
England (%) 2.47 1.75 0.85 11.21

OFFICIAL
34
stop smoking initiatives and dietary advice are probably the most likely interventions to help reduce the incidence and slow the progression of AMD. Where “wet” AMD still occurs, prompt treatment using an anti-VEGF agent such as Lucentis is appropriate (NICE 2008). Preventable sight loss due to AMD is an indicator included in the Public Health Outcomes Framework. Table 12 below shows the crude rates of certification of sight loss from AMD (wet + dry) in those aged 65+ per 100,000 population by County and Unitary Authority in Surrey and Sussex. There is significant variation across Surrey and Sussex with East Sussex having a significantly higher rate than other local areas and the England rate. Table 12: Crude rate of sight loss due to age related macular degeneration (AMD) in those aged 65+ per 100,000 population
Source: Calculated by Public Health England (from data provided by Moorfields Eye Hospital and Office for National Statistics)
9.1.4.1 Rapid access direct referral pathways
There are currently rapid access direct referral pathways for patients with Wet AMD in most of the Surrey CCG areas and these ensure that patients identified by optometrists at a GOS sight test as having wet AMD are seen by the HES within one week. In Sussex, only Brighton and Hove CCG currently offers rapid access for appropriate patients with Wet AMD to specialist clinics for investigation and treatment or to low vision services, social services, rehabilitation support etc. for patients with dry AMD. 9.1.5 Recommendations
• Consistent use of AMD urgent referral guidance across Surrey and Sussex • Full coverage across Surrey and Sussex of best practice fast track referral
pathways from Optometrists and GPs which minimise avoidable delays to starting treatment.
• Secure electronic referrals to be introduced to improve the speed and quality of referrals. In many areas, faxes are still used for transfer of information.
• Treatment of confirmed wet AMD to start within 2 weeks of diagnosis and for timely review and re-treatment appointments to occur on time.
• Separate clinics for monitoring stable wet AMD. • Ensure that optometrists and GPs, particularly locums, receive regular support /
training to recognise the symptoms and signs of wet AMD and should be familiar with the local process for urgent referrals.
• Ensure that all patients who have visual loss have access to an ECLO service and services which provide support and visual rehabilitation.
Count Value 95%Lower CI 95%Upper CI
Brighton and Hove 36 98.4 69 136.2
East Sussex 208 165.5 144 189.5
Surrey 233 114.6 100 130.3
West Sussex 85 48.7 38.9 60.2
England 9,453 104.4 102 106.5

OFFICIAL
35
9.2 Glaucoma
9.2.1 Description
Glaucoma refers to a group of conditions characterised by visual field loss, and pathological changes in the optic nerve head. There may also be raised intra-ocular pressure as in Chronic Open Angle Glaucoma (COAG) which is a common form of the condition. Sight loss in glaucoma is not reversible. Ocular hypertension (OHT) refers to patients who have raised intra-ocular pressure but do not have any sign of glaucomatous damage at the optic nerve head or visual field loss. Patients diagnosed with OHT still require ongoing monitoring as they have significantly increased risk of developing COAG later in life (Meleros and Wienreb 2009). Glaucoma suspects may have early signs of optic nerve damage but may not yet exhibit field loss. They may or may not have raised IOP. The onset of glaucoma is gradual. The early signs are often subtle and may not be not easily identified in a single visit. Patients who are suspected of having glaucoma often require at least two review visits to establish a diagnosis. 9.2.2 Factors affecting development of glaucoma
9.2.2.1 Ageing The prevalence of COAG is related to increasing age (Rudnicka et al 2006).
9.2.2.2 Ethnicity
COAG is approximately three times more prevalent amongst black rather than Caucasian populations of similar age (Rudnicka et al 2006). However, the increase in prevalence with age is steeper in Caucasians than for other ethnic backgrounds.
9.2.2.3 Family history
There is an increased risk of developing COAG if there is a close relative who has the condition (Leske et al 2012).
9.2.2.4 Social and lifestyle factors
Patients from deprived areas have been shown to present later than those in relatively affluent areas and are therefore more likely to experience visual loss (Fraser et al, 2001). As the causation of glaucoma is thought to be at least partly vascular in nature it might be expected that smoking and obesity may affect the incidence of glaucoma. However, studies completed so far have proved inconclusive (Hogg 2012).

OFFICIAL
36
TABLE 13: Prevalence of Glaucoma within Surrey and Sussex
Source: Prevalence rates based on National Eye Health Epidemiological Model (NEHEM) © Eye Health Alliance Notes: The ‘high’ and ‘low’ estimates are the upper and lower ‘95% confidence limits’, i.e., there is 95% confidence that the true number of glaucoma cases lies between the high and low values. Prevalence based on Surrey and Sussex population of 1,033,441 persons aged 50+ Surrey and Sussex population (aged 50+) aggregated from Ethnic Group by age Census 2011 table LC2109EWLS https://www.nomisweb.co.uk/census/2011/lc2109ewls
It is likely that the NEHEM estimates are an underestimate of prevalence as the definition of glaucoma used is more likely to pick up more advanced cases and miss early cases with subtle changes. An equity profile produced by Bradford and Airedale PCT suggests that NEHEM may underestimate the prevalence of glaucoma by 1.5 to 2 times. The advice given for early detection of glaucoma, particularly if an individual is at high risk, is that that they should be regularly reviewed by their optometrist from around age 40 yrs. as this is when it may be clinically detectable or glaucomatous damage may develop. Preventable sight loss due to glaucoma is an indicator included in the Public Health Outcomes Framework. Table 14 below shows the crude rate of certification of vision impairment from glaucoma in those aged 40+ per 100,000 population by County and Unitary Authority in Surrey and Sussex. There is significant variation across Surrey and Sussex with East Sussex having a significantly higher rate (22.3 per 100,000 population aged 40+) than other local areas and the England rate (12.5). Table 14: Crude rate of sight loss due to glaucoma in those aged 40+ per 100,000 population
9.2.3 Local services
Generally, initial detection relies on the opportunistic case finding ability of routine sight testing. In some areas, prompted by NICE guideline CG85 (NICE, 2009) and the adverse event report (NPSA, 2009) additional repeat measurement systems in optometric practice have been introduced with the intention of decreasing the burden of potential false positive referrals to the hospital eye service. It should be noted that these systems reduce the number of false positive cases reaching the hospital but do not play a part in the care of patients with diagnosed glaucoma. They are not a substitute for hospital care.
Prevalence
Mean Estimated
Glaucoma Cases
High Estimated
Glaucoma Cases
Low Estimated
Glaucoma Cases
Suspects
Under 60
Suspects
60+
Total
Suspects
Ocular
Hypertension
Proportion (%) 1.63 2.33 1.02 5.00 7.00 5.77 3.20
Count 29,338 41,934 18,331 55,240 48,472 103,712 57,512
England (%) 1.56 2.24 0.98

OFFICIAL
37
All diagnosed glaucoma patients in Surrey and Sussex are currently treated by the hospital eye service. In the East Surrey CCG area a number of patients with stable glaucoma are reviewed in the Community by Optometrists in five participating practices under the supervision of Fiona O’Sullivan Consultant Ophthalmologist at Surrey & Sussex Hospital at Redhill. The majority of glaucoma patients however are routinely reviewed on a recurring and regular basis in outpatients. 9.2.4 Interventions and prevention
The majority of the factors identified as having an influence on glaucoma onset in the previous section cannot be modified by intervention to prevent incidence. As the condition may not be cured, successful prevention of vision loss relies on adequate control through medication or surgery and regular monitoring. It would also be of value to encourage the uptake of sight tests as this would improve the likelihood of disease detection in the absence of a more formal screening programme. The Sight tests already include routine IOP screening in patients aged over 40 and patients of this age with a family history of the disease are entitled to NHS sight tests under GOS. 9.2.5 Recommendations
• Referrals to secondary care for glaucoma should be of a high quality in Surrey and Sussex with schemes in place across the area for glaucoma referral refinement.
• Those patients diagnosed with ocular hypertension and glaucoma who are deemed to be of low risk can be appropriately seen in the community allowing the acute trusts capacity to see the more complex and high risk patients. This will ensure follow up appointments for patients with glaucoma are not delayed.

OFFICIAL
38
Intervention Case Study- Effectiveness of referral refinement. Repeating intraocular pressure measurement in Stockport
In April 2009, National Institute for Clinical Excellence (NICE) published its guidance for the diagnosis and management of chronic open angle glaucoma (COAG) and ocular hypertension (OHT). Although the referral of suspect glaucoma and OHT was not covered by the guideline, by defining an intra-ocular pressure (IOP) above which diagnosis should occur, it effectively set a threshold for referral. Historically, many optometrists had retained patients with pressures in the low twenties if there were no other signs of glaucoma. NICE now indicated that those patients with a repeatable pressure by contact tonometry of above 21mmHg should be investigated using a battery of tests that they listed in the guidance, and diagnosed by someone suitably qualified. As there was no facility within GOS for repeat IOP testing
patients with high pressures on a single reading were referred to the HES for repeat measures and diagnosis if required. Referrals to ophthalmology increased; not only of patients with genuine pressures over 21mmHg, but also of those with unverified raised pressures. To counteract this, a funded optometric repeat IOP scheme was introduced by NHS Stockport. Initial results are very encouraging. In the first 12 months of operation in Stockport 548 patients were rechecked under the Level 1a scheme and 425, or 78%, were deflected from the referral that would otherwise have occurred as a result of NICE. 59% were deflected by just one repeat, with a further 19% deflected by the 2nd repeat. Only 41% required a 2nd repeat measure. Of those first repeats, 42% were carried out using Goldmann tonometers and 58% using Perkins.

OFFICIAL
39
9.3 Cataracts
9.3.1 Description
A cataract is the development of irregularities in the structure of the crystalline lens that leads to a reduction of transparency. Cataracts may be classified as Nuclear, Cortical or Subcapsular. Nuclear cataracts affect the inner core of the lens. Cortical cataracts affect the outer layers and subcapsular cataracts occur just below lens surface. 9.3.2 Factors affecting the development of cataract
9.3.2.1 Ageing
The prevalence of cataract increases with age (Frost et al 2001).
9.3.2.2 Smoking and lifestyle factors Smoking has been implicated in increased prevalence of nuclear and posterior subcapsular cataracts (Kelly et al 2005) as has increased UVB exposure such as may be found in frequent sunbed use or foreign travel (Klein et al 2002). The Blue Mountain and Beaver Dam eye studies also noted increased cataract prevalence amongst patients with diabetes.
9.3.2.3 Medical
Development of cataract has been linked to steroid use (Klein et al 2002). 9.3.3 Local prevalence
Cataract prevalence as determined by NEHEM is an estimate of “surgical” cataract. A surgical cataract is a cataract that is also causing patient symptoms and therefore extraction is more likely to be beneficial. The prevalence of non-symptomatic cataract is likely to be higher but not necessarily of interest as treatment is not indicated. The NEHEM provides a high and a low estimate of cataract prevalence as the estimates in the studies consulted were very broad. The high estimate is based on an Australian study where they have a higher incidence of the type of light that is more likely to lead to cataract formation (i.e. increased UV). The low estimate is based on a study conducted in London and is more likely to be representative of our Surrey and Sussex population. TABLE 15: Cataract prevalence, Surrey and Sussex
Prevalence High Estimate Low Estimate
Proportion (%) 7.23 2.11
Count 104,860 30,631
England (%) 6.39 1.81 Notes: Prevalence based on Surrey and Sussex population of 1,449,564 persons aged 40+ Surrey and Sussex population (aged 40+) aggregated from Ethnic Group by age Census 2011 table LC2109EWLS https://www.nomisweb.co.uk/census/2011/lc2109ewls

OFFICIAL
40
9.3.4 Local services
9.3.4.1 Surgery
Local hospital episode statistic’s inpatient data is more robust than outpatients because payment for procedures under payment by results relies on accurate coding of these procedures. Patients undergoing day case procedures such as cataract are “admitted” and are therefore covered by inpatient data. Taking the low estimate in table 8 as being more likely to represent the Surrey and Sussex population as it is based on the UK population then data sourced from Hospital Episode Statistics on hospital procedures for cataract removal (3 year average 2009-10 to 2011-12) showed that an average of 57% of predicted cases receive treatment in Surrey and Sussex (compared to average of 70% across England).
9.3.4.2 Optometrist referral and post-op In most areas of Surrey & Sussex local optometrists operate direct referral schemes for cataract patients. The patient is assessed as to whether they meet local referral criteria, counselled regarding the risks and benefits of cataract extraction and clinically examined for the existence of co-existing eye conditions. Cataract referral pathways such as these have been found to significantly improve the number of patients who have surgery on referral to secondary care by filtering out patients who do not wish to have surgery in advance. There is some variation in the details of the protocols used in different areas. 9.3.5 Interventions and prevention
The main intervention is cataract extraction. This is a very successful procedure with less than 2% of cases being reported as having complications by the Royal College of Ophthalmologists. Development strategies for cataract services should include encouraging take up of this procedure. In addition, strategies to reduce smoking could be helpful in reducing the incidence and progression of cataract. 9.3.6 Recommendations
• Adoption of community based direct referral by optometrists to reduce the
number of false positive referrals for cataract surgery.
• Patients should only be referred in line with the current CCG criteria, following counselling on the risks and benefits of surgery. Common criteria for referral should be adopted across Surrey and Sussex. Significant co-existing eye disease and patient related complicating factors should be considered before direct referral for cataract surgery.
• Providers should be required to follow the Royal College of Ophthalmologists, Cataract Surgery Guidelines (2010).

OFFICIAL
41
• After uncomplicated cataract surgery, the patient should be reviewed by an accredited eye health professional for post-op examination and refraction and where possible this should be in the community. In community based schemes professionals should provide feedback on the post-op clinical, visual acuity and refractive data to the unit where the surgery took place and to refer the patient back to the unit if complications are found.
• Ensure that the cataract pathway caters for every individual's need e.g. dementia, learning difficulties or where general anaesthetic is indicated.
9.4 Uncorrected refractive error
9.4.1 Description
Refractive errors refer to the focusing errors of short and long sight and astigmatism. All of these conditions give rise to blurred images on the retina unless corrected. Correction of refractive error is beneficial at all stages of life. In childhood, visual development can be adversely affected if refractive errors are left uncorrected, especially if the error is different between eyes or the child has strabismus (squint) as these conditions can give rise to amblyopia in the longer term. Amblyopia is a failure of normal visual development so if undetected or untreated in childhood, prescribing glasses in later life will not restore normal vision. Not wearing spectacles when they are needed also leads to reduced academic attainment and may limit future career options. For people of working age the visual demands of modern occupations mean that a good level of eye sight is required e.g. for VDU work or driving. Older people often experience changes in refractive error related to the onset of conditions such as cataract. At all ages the onset of change may be gradual so it may not be immediately realised that vision levels are reduced or no longer sufficient for driving. Hence, routine eye examinations are a required to ensure all errors are detected. 9.4.2 Local prevalence
It is estimated that 6% of children at age 6-7years and 10% of children at age 12-13 may have a refractive error (O’Donoghue et al 2010). Not all of these children will present with symptoms or be found at school entry screening (O’Donoghue et al 2012). In adults, there is little data for those aged between 18 and 30 years. For adults aged 30-70 40% will have a refractive error (Bourne et al 2004; Hyams et al 1977). Those that regularly visit the optometrist will already have spectacles even if they don’t always wear them when needed. The fact that 68% of people attending the optometrist for a sight test have spectacles does suggest that some people, probably those with higher levels of impairment, do self-refer (Optical Confederation 2011). This does not rule out significant levels of refractive error being present in the remainder of the population who do not have regular sight tests.
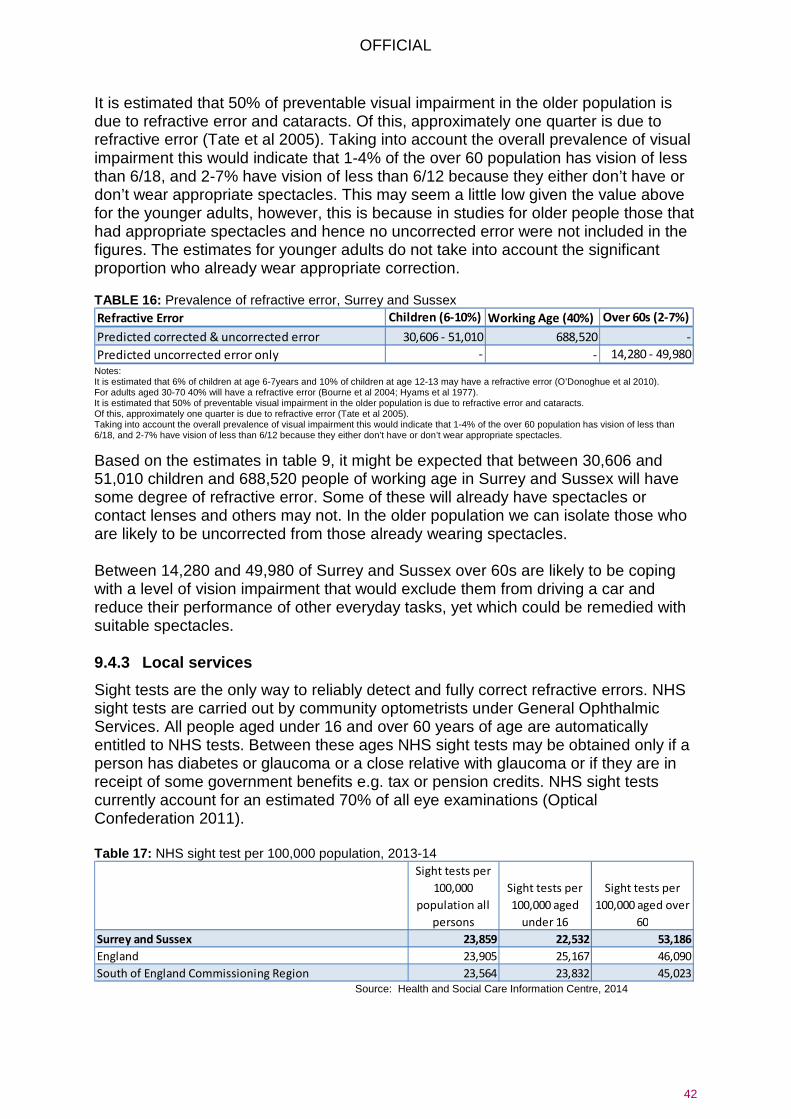
OFFICIAL
42
It is estimated that 50% of preventable visual impairment in the older population is due to refractive error and cataracts. Of this, approximately one quarter is due to refractive error (Tate et al 2005). Taking into account the overall prevalence of visual impairment this would indicate that 1-4% of the over 60 population has vision of less than 6/18, and 2-7% have vision of less than 6/12 because they either don’t have or don’t wear appropriate spectacles. This may seem a little low given the value above for the younger adults, however, this is because in studies for older people those that had appropriate spectacles and hence no uncorrected error were not included in the figures. The estimates for younger adults do not take into account the significant proportion who already wear appropriate correction. TABLE 16: Prevalence of refractive error, Surrey and Sussex
Notes: It is estimated that 6% of children at age 6-7years and 10% of children at age 12-13 may have a refractive error (O’Donoghue et al 2010). For adults aged 30-70 40% will have a refractive error (Bourne et al 2004; Hyams et al 1977). It is estimated that 50% of preventable visual impairment in the older population is due to refractive error and cataracts. Of this, approximately one quarter is due to refractive error (Tate et al 2005). Taking into account the overall prevalence of visual impairment this would indicate that 1-4% of the over 60 population has vision of less than 6/18, and 2-7% have vision of less than 6/12 because they either don’t have or don’t wear appropriate spectacles.
Based on the estimates in table 9, it might be expected that between 30,606 and 51,010 children and 688,520 people of working age in Surrey and Sussex will have some degree of refractive error. Some of these will already have spectacles or contact lenses and others may not. In the older population we can isolate those who are likely to be uncorrected from those already wearing spectacles. Between 14,280 and 49,980 of Surrey and Sussex over 60s are likely to be coping with a level of vision impairment that would exclude them from driving a car and reduce their performance of other everyday tasks, yet which could be remedied with suitable spectacles. 9.4.3 Local services
Sight tests are the only way to reliably detect and fully correct refractive errors. NHS sight tests are carried out by community optometrists under General Ophthalmic Services. All people aged under 16 and over 60 years of age are automatically entitled to NHS tests. Between these ages NHS sight tests may be obtained only if a person has diabetes or glaucoma or a close relative with glaucoma or if they are in receipt of some government benefits e.g. tax or pension credits. NHS sight tests currently account for an estimated 70% of all eye examinations (Optical Confederation 2011). Table 17: NHS sight test per 100,000 population, 2013-14
Source: Health and Social Care Information Centre, 2014
Refractive Error Children (6-10%) Working Age (40%) Over 60s (2-7%)
Predicted corrected & uncorrected error 30,606 - 51,010 688,520 -
Predicted uncorrected error only - - 14,280 - 49,980
Sight tests per
100,000
population all
persons
Sight tests per
100,000 aged
under 16
Sight tests per
100,000 aged over
60
Surrey and Sussex 23,859 22,532 53,186
England 23,905 25,167 46,090
South of England Commissioning Region 23,564 23,832 45,023

OFFICIAL
43
The total number of NHS sight tests carried out in Surrey and Sussex is at a similar level to that in England as a whole and slightly more than the South of England Commissioning Region average (table 10). The rate of sight tests for those aged 60 and over is significantly higher in Surrey and Sussex compared with both the England and Commissioning Region averages. However, sight tests for those under 16, is less than both the England and Commissioning Region averages. Map 3: NHS sight tests per 100,000 population by Area Team, England, 2013-14
Based on the assumption that the average interval between adult sight tests is approximately two years (Optical Confederation 2011) the data in table 11 indicates that overall only half the adult Surrey and Sussex population has a sight test over this period. Consequently, half the population may not have been screened for refractive error in recent years. Children would normally be recalled on an annual basis so an even lower proportion has had their sight tested - only 22%. 9.4.4 Sight tests in screening for treatable eye di sease
In addition to the detection of refractive error the sight test is used as a tool for opportunistic detection of eye diseases e.g. Glaucoma. This is reflected in the inclusion of disease related exemption categories for GOS sight tests. Sudden or significant changes in sight may prompt a person to attend for an eye test as the first point of contact with health services. However, more subtle disease changes may not produce noticeable symptoms in the early stages so routine sight tests, in those high risk groups would contribute to the early detection and management of sight impairing eye conditions.

OFFICIAL
44
9.5 Children’s Vision
The UK National Screening Committee recommends systematic population orthoptic led vision screening at school entry (UK National Screening committee Dec 2013). This should be commissioned across Surrey and Sussex so we create equality of care and access for everyone. There should be screening of all children between 4-5 years to detect visual problems. Early detection is essential for improving the provision of care and outcomes for children with eye disease, especially amblyopia (Barnes GR et al, 2001). It is imperative that this is total population screening, including children in private/home education, special schools, travelling communities and other hard to reach groups who currently may be missing out. Referrals from the primary screening service should be to a community service with a multi-disciplinary team of orthoptists and optometrists reducing false positive rates, treating refractive error and mild to moderate amblyopia (to protocol) with access to hospital services when necessary. Joint orthoptist / optometrist community clinics offer a high level of care and combined expertise at a one stop shop. The information from the screening should be entered into the appropriate local software to ensure rigorous child safeguarding is maintained. This will enable health and social care professionals have access to this information. Feedback to the schools should be provided to allow information to be included in the health and wellbeing section of the Ofsted report. 9.5.1 Existing National Recommendations
Target Population: Recommendation: Neonatal period and early infancy:
a) Very low birth weight and premature babies
b) All new-borns and 6-8 week old infants
Specialist ophthalmic examination to detect retinopathy of prematurity (UK retinopathy of prematurity guidelines 2008) NHS New-born & Infant Physical Examination (NIPE) New born and 6-8 week physical examination of the eye including red reflex to detect media opacities (particularly congenital cataract) and eye anomalies. http://newbornphysical.screening.nhs.uk/
Primary School age entry (4 -5 years of age)
All children between 4-5 years of age: to detect reduced visual acuity (primarily amblyopia but may also detect uncorrected refractive error and strabismus)
Orthoptic-led service – delivered by orthoptists or professional trained, supported and audited by orthoptists. http://www.screening.nhs.uk/vision-child

OFFICIAL
45
9.5.2 Recommendations
• Awareness of the importance of children’s eye health and the need for regular sight tests throughout childhood should be promoted from an early age by health visitors and other health care professionals.
• Orthoptic-Led vision screening programmes should be provided for all eligible children in the 4-5 year age range, to minimum standards in line with BIOS Guidelines. This includes children in mainstream state, independent and special schools and those who are home tutored. (BIOS statement on Orthoptic-Led vision screening 2015)
• A standardised referral pathway for managing screening fails should be adopted (BIOS vision screening care pathway)

OFFICIAL
46
10 SUMMARY AND CONCLUSIONS Good vision care impacts on other aspects of health such as the ability of patients to manage other chronic conditions and the avoidance of injurious falls. People with visual impairment are more likely to require residential and community care and additional support through adaptations of their environment. Such support and the loss of quality of life incur considerable costs both to the individual and society. Because of this, specific initiatives to improve eye health, such as the UK Vision Strategy, should not be considered in isolation. Rather, alongside the planning of other strategies designed to meet broader health and social care objectives as outlined in public health and NHS outcomes frameworks, and considered in the design of multi-professional services, such as those aimed at reducing falls or smoking cessation, for example.
10.1 Local prevalence of eye conditions
The main causes of visual impairment are age-related macular degeneration (AMD), glaucoma, cataracts and uncorrected refractive error. For the population of Surrey and Sussex the National Eye Health Epidemiological Model predicts that up to 151,651 people may be affected by AMD, of which approximately 13% may be of the wet type that is amenable to treatment with anti-VEGF agents such as Lucentis. There are likely to be approximately 29,338 glaucoma cases present in the population, however the subtle nature of the presentation of this condition means that any care system for glaucoma must also accommodate the needs of up to 103,712 glaucoma suspects and 57,512 ocular hypertension patients who will require careful monitoring. The model further predicts 30,631 cataract cases. . Consideration of additional research indicates that there may be up to 51,010 children and 688,520 people of working age in Surrey and Sussex will have some degree of refractive error, whilst, between 14,280 and 49,980 of Surrey and Sussex over 60s, have uncorrected refractive error (not wearing up to date spectacles or contact lenses). Taking all the leading causes of visual impairment and blindness, approximately 343,500 people in the Surrey and Sussex population are at risk of visual loss if these conditions are not carefully monitored and treated. In addition up to 789,500 people in the Surrey and Sussex population will have some degree of refractive error and are at risk of visual loss if these conditions are not appropriately detected and treated. All of these conditions increase in prevalence with age. As the proportion of over 60’s in Surrey and Sussex is expected to increase overall by 27% (the proportion of over 80’s is predicted to increase by 60%) in the next 20 years it may be expected that the incidence of these conditions will also increase.

OFFICIAL
47
AMD and some types of cataract are influenced by smoking. Indeed smokers are four times more likely to develop AMD than non-smokers. Poor diet also contributes to the development of AMD. Glaucoma is also influenced by ethnicity: the Black and Asian populations are at increased risk of this condition. Family history is also a risk factor for this disease.
10.2 Vision loss
14,270 people in Surrey and Sussex are registered as either blind or partially sighted (Health and Social Care Information Centre, 2014). There are expected to be double this number of people with permanent vision loss by 2050. This figure is likely to be an underestimate, as there are many factors affecting registration including access to the process and a desire for some patients not to be “labelled” as visually impaired. As the Certificate of Visual Impairment (CVI) is to be used as the indicator of success in preventing vision loss, it would be worthwhile exploring the factors that affect registration locally, so that this may be more accurate and fully understood.
10.3 Preventing vision loss
The priority for the prevention of visual loss in the majority of conditions is early case detection and good management post diagnosis. There is also a case for multi-professional working in the prevention of disease particularly with regard to co-operation on smoking cessation initiatives and the promotion of good diet. There should be an emphasis on reaching populations identified as having multiple deprivations as people within such populations tend to present to health services rather later than average and as such are more at risk of vision loss.
10.4 Case detection
The most logical tool for case detection in the general population is the sight test, as this includes both refraction with prescription of spectacles if required, and an assessment of eye health with onward referral for suspect cases of eye disease. The Surrey and Sussex area has a similar level of NHS sight testing as other areas in the South East however; this still only covers approximately one quarter of the total population. Figures on sight tests from the Health and Social Care Information Centre suggest that only 1 in 5 children and approximately 1 in 10 adults of working age have had their eyes tested. The figures for older adults were rather better as 3 in 5 over 60’s have had their eyes tested but this still means that 40% of this high risk group may have undetected ocular conditions.
10.5 Management
Once detected, adequate treatment and regular follow up of patients with eye conditions is needed to minimise vision loss. Unfortunately, local hospital episode

OFFICIAL
48
statistics data is not sufficiently detailed for the adequacy of supply of secondary care ophthalmology services for the population to be estimated for glaucoma or AMD. Difficulty with coding of outpatient cases means that it was not possible to determine how many of the predicted cases of eye conditions are currently known and managed by local services. Similarly detailed data on waiting times, clinic capacities and service quality was not available due to the complexity and size of the data collection exercise that would be required to achieve this. Data on cataracts showed that an average of 77% of predicted cases receive treatment. There are some significant local examples of good practice in community optometry particularly Direct Referral schemes for Cataract and increasingly referral refinement schemes for patients with suspected glaucoma. However, the overall impact of such schemes is somewhat limited as not all schemes are available in all CCG areas and the uptake of these can be low. If the efficiency of services currently offered is to be assessed and service improvements are to be measured the quality of data available needs to be much improved and more readily accessible.
10.6 Care of people with vision loss
This paper focuses on the eye health needs of the population and the prevention of vision loss. However, there will be some patients for whom vision loss is unavoidable. A further evaluation that encompasses the nature and quality of the services available for these patients is required to inform a comprehensive vision strategy for Surrey and Sussex. .

OFFICIAL
49
11 REFERENCES Access Economics (2009) “Future Sight Loss UK 1: Economic Impact of Partial Sight and Blindness in the UK adult population”. RNIB Report Age Related Eye Disease Study Research Group (AREDS) (2001) “A Randomised, Placebo Controlled, Clinical Trial of High Dose Supplementation with Vitamins C and E, Beta Carotene and Zinc for Age-Related Macular Degeneration and Vision Loss: AREDS Report No. 8” Archives of Ophthalmology 119:1417-1436 Barnes GR, Hess RF, Dumoulin SO, Achtman RL, Pike GB, (2001).The cortical deficit in humans with strabismic amblyopia. J Physiol-London 533:281–97 NHS Bradford (2011) “NHS Bradford and Airedale & NHS Leeds: Eye Health Equity Profile” http://www.observatory.bradford.nhs.uk/SiteCollectionDocuments/equity%20profile%20report%20-%20final.pdf NHS Brighton and Hove (2011). “Rapid Needs Assessment: Primary Eye Care in Brighton and Hove” Public Health Department Bosanquet N and Mehta P (2008) “Evidence Base to Support the UK Vision Strategy” London: RNIB, http://www.vision2020uk.org.uk/UKVisionstrategy/page.asp?section=32§ionTitle=About+the+Strategy#Download%20the%20UK%20Vision%20Strategy
Bourne RR, Dineen BP, Ali SM, Noorul Hug DM, Johnson CJ (2004) “Prevalence of Refractive Error in Bangladeshi Adults: Results of the National Blindness and Low Vision Survey of Bangladesh” Ophthalmology 2004 June: 111(6) 1150-60 Bunce C, Xing W and Wormald R (2010) “Causes of Blind and Partial Sight Certifications in England and Wales April 2007 –March 2008”. Eye 24 1692-1699 http:/www.nature.com/eye Busby D (2004) “First Report of the National Eye Health Steering Group” London: Department of Health DH/Optical policy/Shadow SHA Gateway ref 3170 Cavanagh S, Chadwick K. (2005) “Health Needs Assessment: A Practical Guide”. London: NICE, 2005. http://www.nice.org.uk/media/150/35/Health_Needs_Assessment_A_Practical_Guide.pdf Das, M ; Spowart, K; Crossley, S ; Dutton, Gn (2010) Evidence that children with special needs all require visual assessment. Archives of Disease in Childhood, Vol.95(11), pp.888-892. Douglas G, Corcoran C and Pavey S. (2006) “Network 1000, Opinions and Circumstances of Visually Impaired People in Britain” Visual Impairment Centre for Teaching and Research (VICTAR) School of Education, University of Birmingham. Emerson and Robertson (2011). The estimated prevalence of visual impairment among people with learning disabilities in the UK

OFFICIAL
50
Evans JR, Fletcher AE, and Wormald RP (2007) “Depression and Anxiety in Visually Impaired Older People” Ophthalmology Feb 2007 114(2):283-288 Fraser S, Bunce C, Wormald R, Brunner E (2001) “Deprivation and Late Presentation of Glaucoma: Case-control Study” British Medical Journal March 17 2001 322(7287) 639-643 http://www.jstor.org/stable/25466466. Frost A, Hopper C, Frankel S, Peters TJ, Durant J, Sparrow J (2001) “The Population Requirement for Cataract Extraction: A Cross-Sectional Study” Eye 2001 December 15(6):745-53 Hyams SW, Pokotilo E, Shkurko G (1977)”Prevalence of Refractive Errors in Adults Over 40: A Survey of 8102 Eyes” British Journal of Ophthalmology 1977 61 428-48 Hogg Ruth (2012) “Healthy Lifestyle Equals Healthier Eyes” (2012) Optometry Today April 6th 2012 41-4 Kelly SP, Thornton J, Edwards R, Sahu A, Harrison R (2005) “Smoking and Cataract: Review of Causal Association” Journal of Refractive Surgery 2005 December; 31(12):2395-404 Klein BE, Klein R, Lee KE “Incidence of Age–Related Cataract over a 10 Year Interval: The Beaver Dam Eye Study” Ophthalmology 2002 November; 109(11):2052-7 Lash SC, Prendiville CP, Smason A, Lewis K, Munneke R, Parkin BT (2006) “Optometrist Referrals for Cataract and “Action on Cataracts” Guidelines: Are Optometrists Following Them and Are They Effective?” Ophthalmic and Physiological Optics 2006 September;26(5)464-7 Leske MC, Wu SY, Hennis A, Honkanen R, Nemesure B, BES Study Group (2008) “Risk Factors for Incident Open Angle Glaucoma: The Barbados Eye Studies” Ophthalmology 2008 Jan; 115(1):85-93 McDonnell PJ (1988), “How do General Practitioners Manage Eye Disease in the Community?” British Journal of Ophthalmology, Vol. 72: 733-736 Meleros Felipe A, Weinreb Robert N (2009) “Estimating Risk of Developing Glaucoma” The Open Ophthalmology Journal 2009 3 50-53 National Institute for Health and Clinical Excellence. (2008) “Ranibizumab and Pegaptanib For the Treatment of Age-related Macular Degeneration” NICE technology appraisal guidance 155. London: NICE, 2008. http://www.nice.org.uk/nicemedia/live/12057/41719/41719.pdf
National Institute for Health and Clinical Excellence (2009) National Collaborating Centre for Acute Care. “Glaucoma: Diagnosis and Management of Chronic Open Angle Glaucoma and Ocular Hypertension. Clinical Guideline CG85. NICE, London. http://www.nice.org.uk/nicemedia/live/12145/43887/43887.pdf

OFFICIAL
51
National Patient Safety Agency (2009) Rapid Response Report NPSA/2009/RRR004 “Preventing Delay to Follow Up for Patients with Glaucoma” www.nrls.npsa.nhs.uk/EasySiteWeb/getresource.axd?AssetID=60252&type=full&servicetype=Attachment
NHS Programme Budgeting PCT Benchmarking Tool 2011-12) http://webarchive.nationalarchives.gov.uk/+/www.dh.gov.uk/en/Managingyourorganisation/Financeandplanning/programmebudgeting/dh_075743 O’Donoghue L, McClelland JF, Logan NS, Rudnicka AR, Owen CG, Saunders KJ (2010) “Refractive Error and Visual Impairment in School Children in Northern Ireland” British Journal of Ophthalmology 2010 doi10.1136/bjo2009.176040 O’Donoghue L, Rudnicka AR, McClelland JF, Logan NS, Saunders KJ (2012) “Visual Acuity Measures do not Reliably Detect Childhood Refractive Errors: An Epidemiological Study” PLoS ONE 7(3):e34441 doi 10.1371/journal.pone.0034441 Optical Confederation (2011) “Optics at a Glance” London: December 2011 www.fodo.com Pyykko I, Jantti P, Aalto H (1990) “Postural Control in Elderley Subjects” Age Ageing 19, 215-241 RNIB, (2008) UK Vision Strategy: Setting the direction for eye health and sight loss services. London: RNIB http://www.vision2020uk.org.uk/UKVisionstrategy/page.asp?section=32§ionTitle=About+the+Strategy#Download%20the%20UK%20Vision%20Strategy
RNIB, (2014) Sight Loss Data Tool http://www.rnib.org.uk/knowledge-and-research-hub-key-information-and-statistics/sight-loss-data-tool Rughani Sonal (2012) “The Vital Role of Optometry in Disease Detection” Optometry Today March 9th 41-4 Rudnicka AR, My-Isa S, Owen CG, Cook DG, Ashby D. (2006) “Variations in Primary Open Angle Glaucoma Prevalence by Age, Gender and Ethnicity: A Bayesian Meta-analysis”. Investigative Ophthalmology and Vision Science October 2006, 47(10):4254-61 Scuffham PA, Legood R, Wilson E, Kennedy-Martin T (2002) “Incidence and Cost of Injurious Falls Associated with Visual Impairment” Visual Impairment Research April 2002 4 1-14 SeeAbility (2015). Children in Focus, the story so far. www.seeability.org/childreninfocus

OFFICIAL
52
Sheldrick JH, Wilson AD, Vernon SA, Sheldrick CM (1993) “Management of Ophthalmic Disease in General Practice” British Journal of General Practice 43: 459-462 Sussex Wide Review: Age-Related Macular Degeneration Services, Case for change, May 2015 Tan JS, Mitchell P, Kifley A, Flood V, Smith W, Wang JJ (2007) “Smoking and the Long Term Incidence of Age-Related Macular Degeneration: The Blue Mountains Eye Study” Archives of Ophthalmology August 2007 125(8):1089-95 Tate R, Smeeth L, Evans J, Fletcher A, Owens C, Rudnicka A (2005) “The Prevalence of Visual Impairment in the UK: A Review of the Literature” London RNIB US Department of Health and Human Services (1998) “National Health Interview Survey, 1994: Second Supplement of Aging” National Centre for Health Statistics, Hyattsville MD.