Surface Tension of Ionic Liquids Analogues Using …ijcea.org/papers/271-I005.pdfSurface Tension of...
5
Abstract—Deep eutectic solvents (DESs) are mixture complexes being introduced in many applications due to their favorable physicochemical characteristics. However, due to the lack of experimental data, prediction of their physical properties is challenging. One of the important physical properties that provides considerable insight of the molecular influence on intensity of interactions in the mixture is the surface tension. In this work, the QSPR prediction method was employed to predict the DESs surface tension. The parachors of selected DESs based on ammonium and phosphunium salts were determined experimentally and also calculated from the molecular structure of their constituting components using available parachor contribution data for neutral compounds. The results showed that the calculated and experimental parachors of DESs were notably comparable and the parachor contribution data developed for neutral compounds can be successfully utilized for DESs. The calculated parachors were employed to predict the surface tension using their experimental densities values. Index Terms—Surface tension, deep eutectic solvents, prediction. I. INTRODUCTION The growing number of publications in Deep Eutectic Solvents (DESs) literature reveals that they are gaining much attention by the scientific community. This is due to their potential as environment friendly solvents and advantages over conventional solvents and ionic liquids such as non-toxicity, non-reactivity with water and above all being biodegradable [1]. Moreover, they are synthesized easily in high purity at low cost in contrast to Ionic liquids which are very expensive and difficult to handle [2]. One of the fascinating features of using DESs is their potential as tunable solvents that can be customized to a particular type of chemistry. Surface tension is one of the essential DESs physical properties. Its evaluation is necessary to resolve various industrial related problems and develop new separation technologies. The awareness of this property provides considerable information of the molecular influence on the intensity of interactions in the mixture. Furthermore, the surface tension plays an important role in mass transfer processes like distillation, absorption, separation and extraction [3]. The experimental values for DESs surface Manuscript received January 5, 2013; received March 9, 2013. F. S. Mjalli is with Petroleum and Chemical Engineering Department, Sultan Qaboos University, Oman (e-mail: [email protected]). K. Shahbaz is with the School of Engineering, Taylor’s University, 47500 Selangor, Malaysia (e-mail: [email protected]). M. A. Hashim is with University of Malaya, Chemical Engineering Department, Kuala Lumpur, Malaysia (e-mail: [email protected]). I. M. AlNashef is with King Saud University, Chemical Engineering Department, Riyadh, Saudi Arabia (e-mail: [email protected]). tension are either rare or even absent. It is also impractical to experimentally evaluate surface tension in many cases. Thus, prediction methods for surface tension of DESs are required. For this purpose the theoretical or empirical methods must be examined to find an acceptable and accurate method for prediction of surface tension. Due to the large potential number of DESs in various salts and hydrogen bond donors (HBD) combinations; it is not practical to find a unique correlation for predicting DESs surface tension. A desirable method for prediction of DESs surface tension and even DESs physical properties could be through their structures e.g. using quantitative structure property relationship (QSPR) [4]. Several methods have been suggested for prediction of the surface tension. Amongst them the empirical formula recommended by Macleod is the uncomplicated method [5]. This method expresses the temperature-independent relationship between surface tension and density of liquid, eq. 1: 1/ 4 . K (1) where σ is surface tension, ρ is density and K is a constant which is temperature independent. Sugden [6] modified the Macleod equation by multiplying each side of equation with molecular weight (M w ) to give a constant which is called parachor (P), Eq. 3: 1/ 4 . . . w w M M K (2) 1/4 . . w w M P M K (3) Indeed, the parachor is a link between the surface tension, density and structure of a compound [7]. The parachor of a compound is the sum of its parachor contribution [6]. It is clear from Eq. 3 that through the parachors of a compound, the compound surface tension is predictable from knowledge of density and vice versa. Mumford et al. [8] and Quayle [9] improved Sugden’ original parachor contribution values for neutral compounds. In addition, Knotts et al. [10] developed a QSPR correlation for the parachors using the huge amount of physical data available for neutral organic compounds in the DIPPR database [11]. Knotts et al. [10] reported two individual parachor contribution data sets; the first data set was achieved using a training set containing experimental surface tension values with an uncertainty less than 5% and the second was obtained using surface tension data with uncertainties of less than 1%. Although the parachor correlation proposed by Knotts et al. [10] has been considered for uncharged compound and no investigations were performed to develop QSPR correlation F. S. Mjalli, K. Shahbaz, M. A. Hashim, and I. M. AlNashef Surface Tension of Ionic Liquids Analogues Using the QSPR Correlation International Journal of Chemical Engineering and Applications, Vol. 4, No. 3, June 2013 96 DOI: 10.7763/IJCEA.2013.V4.271
Transcript of Surface Tension of Ionic Liquids Analogues Using …ijcea.org/papers/271-I005.pdfSurface Tension of...

Abstract—Deep eutectic solvents (DESs) are mixture
complexes being introduced in many applications due to their
favorable physicochemical characteristics. However, due to the
lack of experimental data, prediction of their physical properties
is challenging. One of the important physical properties that
provides considerable insight of the molecular influence on
intensity of interactions in the mixture is the surface tension. In
this work, the QSPR prediction method was employed to predict
the DESs surface tension. The parachors of selected DESs based
on ammonium and phosphunium salts were determined
experimentally and also calculated from the molecular structure
of their constituting components using available parachor
contribution data for neutral compounds. The results showed
that the calculated and experimental parachors of DESs were
notably comparable and the parachor contribution data
developed for neutral compounds can be successfully utilized for
DESs. The calculated parachors were employed to predict the
surface tension using their experimental densities values.
Index Terms—Surface tension, deep eutectic solvents,
prediction.
I. INTRODUCTION
The growing number of publications in Deep Eutectic
Solvents (DESs) literature reveals that they are gaining much
attention by the scientific community. This is due to their
potential as environment friendly solvents and advantages
over conventional solvents and ionic liquids such as
non-toxicity, non-reactivity with water and above all being
biodegradable [1]. Moreover, they are synthesized easily in
high purity at low cost in contrast to Ionic liquids which are
very expensive and difficult to handle [2]. One of the
fascinating features of using DESs is their potential as tunable
solvents that can be customized to a particular type of
chemistry. Surface tension is one of the essential DESs
physical properties. Its evaluation is necessary to resolve
various industrial related problems and develop new
separation technologies. The awareness of this property
provides considerable information of the molecular influence
on the intensity of interactions in the mixture. Furthermore,
the surface tension plays an important role in mass transfer
processes like distillation, absorption, separation and
extraction [3]. The experimental values for DESs surface
Manuscript received January 5, 2013; received March 9, 2013.
F. S. Mjalli is with Petroleum and Chemical Engineering Department,
Sultan Qaboos University, Oman (e-mail: [email protected]).
K. Shahbaz is with the School of Engineering, Taylor’s University, 47500
Selangor, Malaysia (e-mail: [email protected]).
M. A. Hashim is with University of Malaya, Chemical Engineering
Department, Kuala Lumpur, Malaysia (e-mail: [email protected]).
I. M. AlNashef is with King Saud University, Chemical Engineering
Department, Riyadh, Saudi Arabia (e-mail: [email protected]).
tension are either rare or even absent. It is also impractical to
experimentally evaluate surface tension in many cases. Thus,
prediction methods for surface tension of DESs are required.
For this purpose the theoretical or empirical methods must be
examined to find an acceptable and accurate method for
prediction of surface tension. Due to the large potential
number of DESs in various salts and hydrogen bond donors
(HBD) combinations; it is not practical to find a unique
correlation for predicting DESs surface tension. A desirable
method for prediction of DESs surface tension and even DESs
physical properties could be through their structures e.g. using
quantitative structure property relationship (QSPR) [4].
Several methods have been suggested for prediction of the
surface tension. Amongst them the empirical formula
recommended by Macleod is the uncomplicated method [5].
This method expresses the temperature-independent
relationship between surface tension and density of liquid, eq.
1: 1/4 .K
(1)
where σ is surface tension, ρ is density and K is a constant
which is temperature independent. Sugden [6] modified the
Macleod equation by multiplying each side of equation with
molecular weight (Mw) to give a constant which is called
parachor (P), Eq. 3:
1/4. . .w wM M K (2)
1/4.. w
w
MP M K
(3)
Indeed, the parachor is a link between the surface tension,
density and structure of a compound [7]. The parachor of a
compound is the sum of its parachor contribution [6]. It is
clear from Eq. 3 that through the parachors of a compound,
the compound surface tension is predictable from knowledge
of density and vice versa.
Mumford et al. [8] and Quayle [9] improved Sugden’
original parachor contribution values for neutral compounds.
In addition, Knotts et al. [10] developed a QSPR correlation
for the parachors using the huge amount of physical data
available for neutral organic compounds in the DIPPR
database [11]. Knotts et al. [10] reported two individual
parachor contribution data sets; the first data set was achieved
using a training set containing experimental surface tension
values with an uncertainty less than 5% and the second was
obtained using surface tension data with uncertainties of less
than 1%.
Although the parachor correlation proposed by Knotts et al.
[10] has been considered for uncharged compound and no
investigations were performed to develop QSPR correlation
F. S. Mjalli, K. Shahbaz, M. A. Hashim, and I. M. AlNashef
Surface Tension of Ionic Liquids Analogues Using the
QSPR Correlation
International Journal of Chemical Engineering and Applications, Vol. 4, No. 3, June 2013
96DOI: 10.7763/IJCEA.2013.V4.271
for ions, recently Deetlefs et al. [12] attempted to employ the
Knotts’s parachor correlation for prediction of ionic liquids
surface tension. They calculated parachors of ionic liquids
using the neutral parachor contribution values and revealed
that the differences between the corresponding experimental
and calculated parachor values were sufficiently small. Then
using the calculated parachor values they predicted surface
tension of ionic liquids from densities and vice versa.
Consequently, they suggested that the QSPR correlation
could be used for salts with electrostatic interactions in the
salts. Afterwards, Gardas et al. [13] indicated that the QSPR
correlation for parachors suggested by Knotts et al. [10] can
be successfully extended for ionic liquids. They utilized the
QSPR correlation along with a density prediction method
proposed by themselves for estimation of ionic liquids surface
tension in wide range of temperature (268.15-393.15 K) [14].
For validating the QSPR correlation for ionic liquids, they
compared the predicted surface tension with the experimental
values collected from literature and a database for ionic
liquids surface tension.
To predict the surface tension of deep eutectic solvents by
using Eq. (3), density data are required. Since density data is
unavailable in many cases, lately, we have reported an
empirical group contribution method to predict densities of
DESs [1]. In that method the critical properties of salt and
HBD were estimated separately using the modified
Lydersen-Joback-Reid method, while that of the mixture were
calculated using Lee-Kesler equation. The Rackett equation
modified by Spencer and Danner was employed to predict the
DES density. Moreover, newly, we developed an artificial
neural network model to predict densities of three classes of
deep eutectic solvents based on - phosphonium and -
ammonium salts [15].
Since there are no studies dedicated for the prediction of
DESs surface tension, the QSPR correlation proposed by
Knotts et al. [10] will here be investigated for its ability to
predict surface tension of DESs. In this work, nine DESs at
different salts to HBD molar compositions will be considered
for calculating their parachors that consequently will be used
to predict their surface tension.
II. EXPERIMENTAL
A. Chemicals
Methyltriphenylphosphonium bromide (C19H18PBr),
Choline chloride (C5H14ClNO) and N,N-Diethylenethanol
ammonium chloride (C6H16ClNO) as salts and glycerol
(C3H8O3), ethylene glycol (C2H6O2), triethylene glycol
(C6H14O4), 2,2,2-trifluoroacetamide (C2H2F3NO) and 1,
4-Butanediol (C4H10O2) as hydrogen bond donors were
purchased from Merck Chemicals with high purity )≥ 98 ( %
and utilized for the synthesis of DESs without further
purification
B. DESs Synthesis
In this study, three different salts namely; Choline chloride,
N,N-Diethylenethanol ammonium chloride and
methyltriphenylphosphonium bromide and five different
HBD namely; glycerol, ethylene glycol, triethylene glycol,
2,2,2-trifluoroacetamide and 1, 4-Butanediol were selected to
synthesize the nine DESs with different compositions. The
deep eutectic solvents were synthesized by mixing the salt
with different HBD in different mole fraction of salt under an
argon atmosphere and at 353.15 K until a homogenous and
colorless liquid appeared. Table I presents the compositions
of the different DESs synthesized in this study.
TABALE I: COMPOSITIONS AND ABBREVIATION OF THE SYNTHESIZED DEEP EUTECTIC SOLVENTS.
Salt HBD xsalt xHBD Abbreviation
Choline chloride
Glycerol 0.33 0.67 DES1
Ethylene glycol 0.33 0.67 DES2
1, 4-Butanediol 0.25 0.75 DES3
Methyltriphenylphosphonium bromide
Glycerol 0.25 0.75 DES4
Ethylene glycol 0.20 0.80 DES5
Triethylene glycol 0.16 0.84 DES6
N,N-Diethylenethanol ammonium chloride
Glycerol 0.20 0.80 DES7
Ethylene glycol 0.25 0.75 DES8
2,2,2-Trifluoroacetamide 0.33 0.67 DES9
C. DESs Characterization
The freezing point of all DESs were measured using
Mettler Toledo Differential Scanning Calorimeter) DSC 1
STARe System) which was calibrated against known
standards (water and 2-propanol) to ensure the
measurement’s accuracy. Furthermore, the water content of
all DESs was determined by Karl Fisher titration method and
the measurement accuracy of the Karl Fisher coulometer was
checked with Hydranal-water standard 1.00 mg/g. This
standard was supplied in glass ampoules from Sigma–Aldrich,
Malaysia. Table II shows the freezing temperature and water
content of studied DESs in this work.
Densities of the synthesized DESs in this study were
determined using a DMA 4500 vibrating tube density/specific
gravity meter (Anton Paar, Austria). To check the density
meter adjustment, density of water (degassed bi-distillated)
was measured at 298.15 K and compared with the
corresponding value in the density tables [16]. The results
showed a difference of ± 0.00003 g cm-3
which confirmed the
accuracy of machine. Density measurements were performed
at 298.15 K with three replicates for each reading, the
uncertainty in density measurements was ± 0.00005 g·cm-3
.
International Journal of Chemical Engineering and Applications, Vol. 4, No. 3, June 2013
97
TABAL II: FREEZING TEMPERATURES AND WATER CONTENT FOR
SYNTHESIZED DEEP EUTECTIC SOLVENTS.
DES Freezing temperature
(K)
Water content
(mg/kg) 1 237.00 403.17
2 207.14 655.00
3 241.15 479.53
4 267.59 528.08
5 223.81 724.00
6 251.60 816.66
7 275.12 465.00
8 250.90 617.00
9 273.05 419.30
The surface tension measurements of all DES were carried
out using a Krüss K100 tensiometer by the Du Noüy ring
method [17]. The tensiometer was equipped with LabDesk
3.2 software for data collation and automatic control. The
platinum-iridium ring was cleaned by flaming and the
glassware was rinsed consecutively with acetone and
distillated water before beginning each measurement. The
calibration of equipment was determined by measuring the
surface tension of pure water before using. The Surface
tensions of all studied DESs were measured at 298.15 K and
for each measurement three replicates were conducted and the
uncertainties of the surface tension and temperature values
were within the range of ± 0.2 mN m-1
and ± 0.1K,
respectively.
III. RESULTS AND DISCUSSION
The nine different DESs based on ammonium and
phosphonium salts were selected and synthesized to test the
QSPR method for predicting the surface tension. The mole
fractions of salt and HBD used to synthesize each DES in this
work were selected based on the lowest freezing temperature
attained for DES. As can be seen from Table II, all
synthesized DESs (DES1 to DES9) had low freezing
temperatures as compared to their constituting components
and were liquids at ambient temperature. This is a main
characteristic of deep eutectic solvents. Furthermore, water
content, which has a significant effect on the physical
properties of deep eutectic solvents, of all DESs (DES1 to
DES9) was less than 0.1 wt% (Table II) which is comparable
to that reported in the literature.
Table III lists the molecular weights and measured
densities and surface tensions of all studied DESs in this work
at 298.15± 0.1 K. Since impurities like water affect physical
property values, all measurements for each DES were carried
out with the same sample to ensure reproducibility. Due to
lack of studies of DESs physical properties, it was not
possible to compare our experimental results of the surface
tension of DESs. However, Harris [18] reported data for the
surface tension of some choline chloride-based DESs as
function of temperature. The surface tension value reported
for choline chloride:glycerol DES (DES1) at 0.33 mole
fraction of choline chloride and at 298.15 K was 55.4 mN m-1
which is close enough to the value obtained in this work, i.e.
57.24 mN m-1
. In addition, our measured surface tension
value of 47.17 mN m-1
for DES3 (Choline chloride: 1,
4-Butanediol DES at 0.25 mole fraction of salt) at 298.15±
0.1 K is slightly lower than that reported by Harris (2008) of
47.4 mN m-1
. These differences in surface tension values
might be due to the difference in water content in samples of
Harris work and this work. The values of measured densities
of DES2, DES5, DES8 and DES9 are almost equal to that
reported in our previous work [19].
To calculate the parachor of each DES, the parachors of
constituting individual components (salt and HBD) of each
DES were calculated using the published parachor
contribution data [10]. In this study, only the accurate
parachor data set (with uncertainties of less than 1%)
proposed by Knotts et al. [10] were employed. After
calculation the parachors of salt and HBD of each DES, the
Eq. 4 was employed for calculation of DES parachor.
i iP x P (4)
where xi refers to the mole fraction of the pure constituent and
Pi refers to parachor of pure constituent.
TABLE III: MEASURED DENSITIES AND SURFACE TENSIONS OF THE STUDIED
DESS AT 298.15± 0.1 K.
DES Mw (g mol-1) ρexp (g cm-3) σexp (mN m-1)
T/K= 298.15 T/K= 298.15
1 107.94 1.1920 57.24
2 87.92 1.1168 48.91
3 102.49 1.0610 47.17
4 158.38 1.2976 58.94
5 121.10 1.2325 51.29
6 184.68 1.1858 49.85
7 104.41 1.2201 59.35
8 84.96 1.1014 47.51
9 126.57 1.2934 40.27
Table IV shows the calculated parachors for all DESs
(DES1 to DES9) using Eq.4 and experimental parachors. The
experimental parachor of each DES was determined using
Eq.3 through the measured density and surface tension of
DES. In addition the percentage of errors (% E) obtained
using Eq. 5 are given in Table IV.
( )% 100
( )
Value Experimental calculatedE
Value Experimental
(5)
As indicated by Table IV, the percentage errors obtained
for calculated and experimental parachors of all DES were
very small. Moreover, a comparative plot (Fig. 1) of
calculated parachors against experimental parachors for
studied DESs revealed that experimental and calculated
parachores value were extremely correlated (R2= 0.9987) and
highly similar. Accordingly, there is a good agreement for
employing the parachor contribution data for prediction of
surface tension of deep eutectic solvents, despite the fact that
International Journal of Chemical Engineering and Applications, Vol. 4, No. 3, June 2013
98
parachor contribution data proposed by Knotts et al. [10]
were considered based on covalent bonds and did not take
into account coordinate bonds.
TABLE IV: CALCULATED PARACHORS AND PREDICTED SURFACE TENSIONS
OF THE STUDIED DESS.
DES Pexp Pcal
% E σexp
T/K
σp
T/K % E
1 249.0
7
246.7
1 0.94
57.2
4
55.0
9 3.74
2 208.1
9
205.0
4 1.51
48.9
1
46.0
1 5.91
3 253.1
6
248.6
8 1.77
47.1
7
43.9
1 6.89
4 338.1
9
335.5
5 0.78
58.9
4
57.1
1 3.09
5 262.9
4
258.9
8 1.50
51.2
9
48.2
6 5.90
6 413.8
3
406.7
1 1.71
49.8
5
46.5
0 6.70
7 237.5
0
237.0
8 0.18
59.3
5
58.9
1 0.73
8 202.5
2
198.8
0 1.83
47.5
1
44.1
1 7.14
9 246.5
2
236.8
1 3.93
40.2
7
34.2
9
14.8
4
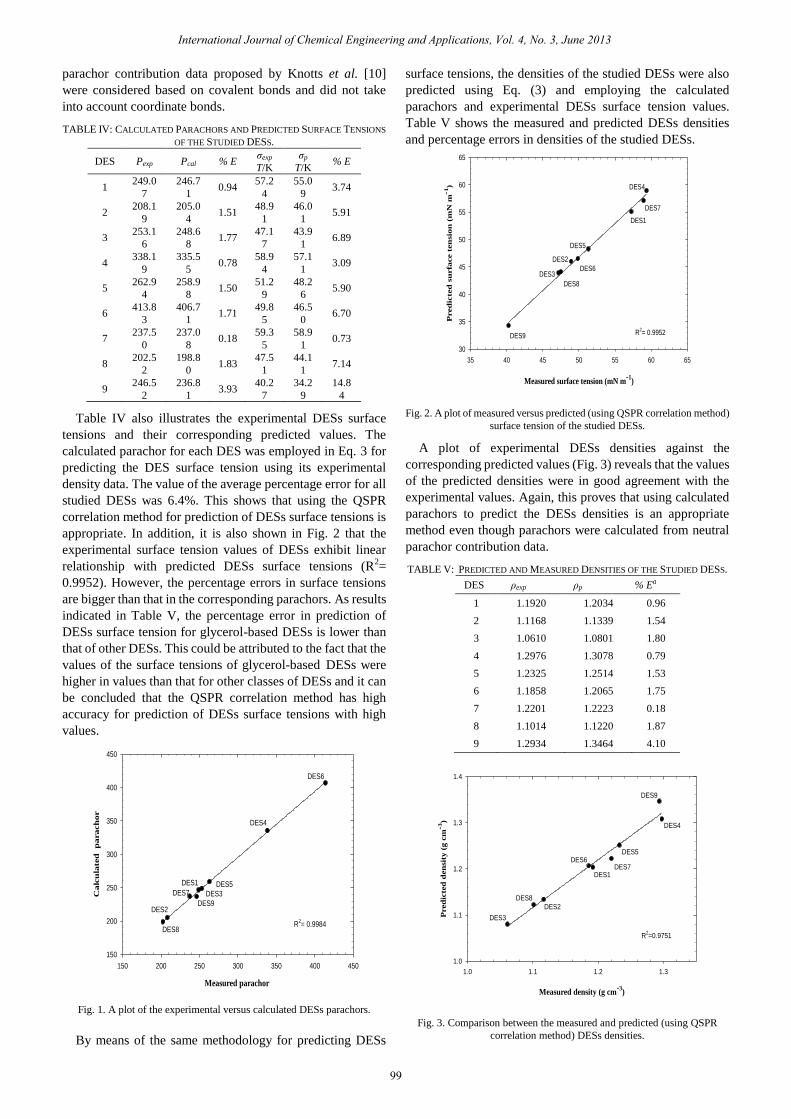
Table IV also illustrates the experimental DESs surface
tensions and their corresponding predicted values. The
calculated parachor for each DES was employed in Eq. 3 for
predicting the DES surface tension using its experimental
density data. The value of the average percentage error for all
studied DESs was 6.4%. This shows that using the QSPR
correlation method for prediction of DESs surface tensions is
appropriate. In addition, it is also shown in Fig. 2 that the
experimental surface tension values of DESs exhibit linear
relationship with predicted DESs surface tensions (R2=
0.9952). However, the percentage errors in surface tensions
are bigger than that in the corresponding parachors. As results
indicated in Table V, the percentage error in prediction of
DESs surface tension for glycerol-based DESs is lower than
that of other DESs. This could be attributed to the fact that the
values of the surface tensions of glycerol-based DESs were
higher in values than that for other classes of DESs and it can
be concluded that the QSPR correlation method has high
accuracy for prediction of DESs surface tensions with high
values.
Measured parachor
150 200 250 300 350 400 450
Ca
lcu
late
d
pa
ra
ch
or
150
200
250
300
350
400
450
DES4
DES6
DES5
DES3
DES9
DES1
DES7
DES8
DES2
R2= 0.9984
Fig. 1. A plot of the experimental versus calculated DESs parachors.
By means of the same methodology for predicting DESs
surface tensions, the densities of the studied DESs were also
predicted using Eq. (3) and employing the calculated
parachors and experimental DESs surface tension values.
Table V shows the measured and predicted DESs densities
and percentage errors in densities of the studied DESs.
Measured surface tension (mN m-1
)
35 40 45 50 55 60 65
Pred
icte
d s
urfa
ce t
en
sio
n (
mN
m-1
)
30
35
40
45
50
55
60
65
DES9
DES4
DES7
DES1
DES5
DES6
DES2
DES8
DES3
R2= 0.9952
Fig. 2. A plot of measured versus predicted (using QSPR correlation method)
surface tension of the studied DESs.
A plot of experimental DESs densities against the
corresponding predicted values (Fig. 3) reveals that the values
of the predicted densities were in good agreement with the
experimental values. Again, this proves that using calculated
parachors to predict the DESs densities is an appropriate
method even though parachors were calculated from neutral
parachor contribution data.
TABLE V: PREDICTED AND MEASURED DENSITIES OF THE STUDIED DESS.
DES ρexp ρp % Ea
1 1.1920 1.2034 0.96
2 1.1168 1.1339 1.54
3 1.0610 1.0801 1.80
4 1.2976 1.3078 0.79
5 1.2325 1.2514 1.53
6 1.1858 1.2065 1.75
7 1.2201 1.2223 0.18
8 1.1014 1.1220 1.87
9 1.2934 1.3464 4.10
Measured density (g cm-3
)
1.0 1.1 1.2 1.3
Pred
icte
d d
en
sity
(g
cm
-3)
1.0
1.1
1.2
1.3
1.4
DES9
DES4
DES5
DES7
DES2
DES8
DES3
DES1
DES6
R2=0.9751
Fig. 3. Comparison between the measured and predicted (using QSPR
correlation method) DESs densities.
International Journal of Chemical Engineering and Applications, Vol. 4, No. 3, June 2013
99

IV. CONCLUSIONS
This study introduced a simple method for prediction of
surface tension of deep eutectic solvents. In this method the
parachor plays an important role as a reliable predictive link
between the surface tension and density of DESs and their
molecular structures. The nine different DESs based on
ammonium and phosphunium salts were selected to calculate
their parachors using neutral parachor contribution data. The
results revealed that the difference between calculated and
experimental parachors of DESs was adequately small and
this showed clearly that the parachor contribution data
developed for neutral compounds can be successfully utilized
for deep eutectic solvents. Furthermore, using calculated
parachors and experimental DESs densities values the surface
tensions of DESs were predicted with an average percentage
error of 6.4 %. The results also revealed that using parachor,
the densities of DESs can be predicted from their surface
tensions.
REFERENCES
[1] K. Shahbaz, F. S. Mjalli, M. A. Hashim, and I. M. Alnashef, ―Using
Deep Eutectic Solvents Based on Methyl Triphenyl Phosphunium
Bromide for the Removal of Glycerol from Palm-Oil-Based Biodiesel,‖
Energy and Fuels, vol. 25, pp. 2671-2678, 2011.
[2] Y. Hou, Y. Gu, S. Zhang, F. Yang, H. Ding, and Y. Shan, ―Novel
binary eutectic mixtures based on imidazole,‖ Journal of Molecular
Liquids, vol. 143, pp. 154-159, 2008.
[3] E. Jimenez, M. Cabanas, L. Segade, S. Garca-Garabal, and H. Casas,
―Excess volume, changes of refractive index and surface tension of
binary 1,2-ethanediol + 1-propanol or 1-butanol mixtures at several
temperature,‖ Fluid Phase Equilibria, vol. 180, pp. 151-164, 2001.
[4] A. R. Katritzky, V. S. Lobanov, and M. Karelson, ―QSPR: the
correlation and quantitative prediction of chemical and physical
properties from structure,‖ Chemical Society Reviews, vol. 24, pp.
279-287, 1995.
[5] D. B. Macleod, ―On a relation between surface tension and density,‖
Transactions of the Faraday Society, vol. 19, pp. 38-41, 1923.
[6] S. Sugden, ―VI.-The variation of surface tension with temperature and
some related functions,‖ Journal of the Chemical Society,
Transactions, vol. 125, pp. 32-41, 1924.
[7] J. R. Parthington, ―An Advanced Treatise on Physical Chemistry,‖
London, Longmans, Green and Co, 1951.
[8] S. A. Mumford and J. W. C. Phillips, ― CCLXXIV.-The evaluation and
interpretation of parachors,‖ Journal of the Chemical Society
(Resumed), pp. 2112-2133, 1929.
[9] O. R. Quayle, ―The Parachors of Organic Compounds. An
Interpretation and Catalogue,‖ Chemical Reviews, vol. 53, pp. 439-589,
1953.
[10] T. A. Knotts, W. V. Wilding, J. L. Oscarson, and R. L. Rowley, ―Use of
the DIPPR Database for Development of QSPR Correlations: Surface
Tension,‖ Journal of Chemical & Engineering Data, vol. 46, pp.
1007-1012, 2001.
[11] CrossFire 2000, Version 5.0, Database BS0203AB, Beilstein.
[12] M. Deetlefs, K. R. Seddon, and M. Shara, ―Predicting physical
properties of ionic liquids,‖ Physical Chemistry Chemical Physics, vol.
8, pp. 642-649, 2006.
[13] R. L. Gardas and J. O. A. P. Coutinho, ―Applying a QSPR correlation
to the prediction of surface tensions of ionic liquids,‖ Fluid Phase
Equilibria, vol. 265, pp. 57-65,2008.
[14] R. L. Gardas and J. O. A. P. Coutinho, ―Extension of the Ye and
Shreeve group contribution method for density estimation of ionic
liquids in a wide range of temperatures and pressures,‖ Fluid Phase
Equilibria, vol. 263, pp. 26-32, 2008.
[15] K. Shahbaz, S. Baroutian, F. S. Mjalli, M. A. Hashim, and I. M.
Alnashef, ―Densities of ammonium and phosphonium based deep
eutectic solvents: prediction using artificial intelligent and group
contribution techniques,‖ Thermochimica Acta, vol. 527, pp. 59-66,
2011.
[16] H. Bettin and F. Spieweck , ―Die Dichte des Wassers als Funktion der
Temperatur nach Einführung der Internationalen Temperaturskala,‖
PTB-Mitt, vol. 1, pp. 195-196, 1990.
[17] P. L. Du Noüy, ―An Interfacial Tensiometer for Universal Use,‖ The
Journal of General Physiology, vol. 7, pp. 625-631, 1925.
[18] R. C. Harris, ―Physical Properties of Alcohol Based Deep Eutectic
Solvents,‖ Department of Chemistry Leicester, University of Leicester,
2008.
[19] K. Shahbaz, F. S. Mjalli, M. A. Hashim, and I. M. Alnashef,
―Prediction of deep eutectic solvents densities at different
temperatures,‖ Thermochimica Acta, vol. 515, pp. 67-72, 2011.
Farouq S. Mjalli is an associate professor at the Department of
Petroleum and Chemical Engineering, Faculty of Engineering, Sultan
Qaboos University, Oman.
International Journal of Chemical Engineering and Applications, Vol. 4, No. 3, June 2013
100