
Surface Tension Measurements of Liquid. Metals by the Quasi
17
SurfaceTensionMeasurements of Liquid. Metals by the Quasi-Containerless Pendant Drop Method Kin F. Man Jet Propulsion Laboratory California Institute of Technology Pasadena, CA 91 109 ABSTRACT The surface tension of liquid metals, Zr, Ni, Ti, Mo, and Nb, have been measured using the quasi-containerless pendant drop method. This'method involves meltingtheend of a high-purity metal rod by bombardment with an electron beam to form a pendant drop under ultra-high vacuum conditions to minimize surface contamination. The magnified image of the drop is captured from a high-resolution CCD cameraanddigitized using a frame-grabber.Thedigitalimage is analyzed by reading the pixel intensities from a graphicsfile.Theedgecoordinates of the drop along rows and columns of pixels are searched by a computer program and stored in an array. An optimized theoretical drop shape is computed from the edge coordinates by solving the Young-Laplace differential equation to deduce the surface tension. The measured surface tensions are compared with available experimental results and theoretical calculations. KEY WORDS: digital image analysis; electron beam melting; high temperature liquid metals; pendant drop; quasi-containerless; surface tension; thermophysical property. 1
Transcript of Surface Tension Measurements of Liquid. Metals by the Quasi

Surface Tension Measurements of Liquid. Metals by the Quasi-Containerless Pendant Drop Method
Kin F. Man
Jet Propulsion Laboratory California Institute of Technology
Pasadena, CA 91 109
ABSTRACT
The surface tension of liquid metals, Zr, Ni, Ti, Mo, and Nb, have been measured using the quasi-containerless pendant drop method. This'method involves melting the end of a high-purity metal rod by bombardment with an electron beam to form a pendant drop under ultra-high vacuum conditions to minimize surface contamination. The magnified image of the drop is captured from a high-resolution CCD camera and digitized using a frame-grabber. The digital image is analyzed by reading the pixel intensities from a graphics file. The edge coordinates of the drop along rows and columns of pixels are searched by a computer program and stored in an array. An optimized theoretical drop shape is computed from the edge coordinates by solving the Young-Laplace differential equation to deduce the surface tension. The measured surface tensions are compared with available experimental results and theoretical calculations.
KEY WORDS: digital image analysis; electron beam melting; high temperature liquid metals; pendant drop; quasi-containerless; surface tension; thermophysical property.
1

1 . INTRODUCTION
The surface tension of liquid metals is important to fundamental theories of metallurgical processes and to an understanding of low-gravity processing schemes involving a free surface, such as floating-zone crystal growth. On the ground, under normal gravity conditions, surface tension forces contribute significantly to fluid flow (Marangoni or thermocapillary flows) in crystal growth. In space, where buoyancy convection is minimal, surface tension driven-flow is often the dominant type of fluid flow. Obtaining accurate surface tension data is, therefore, particularly important to understanding the process of crystal growth in space. Since surface tension is determined by the microscopic structure of the surface, it is very sensitive to physical and chemical contamination, particularly at high temperatures.
A comprehensive literature sui’vey of experimentally determined values for +
surface tension of pure molten metals was conducted by Keene up to 1993 [l], as part of a program to obtain the properties of materials. These data were used to predict the surface tension of molten metal alloys. Although the surface tension of a large number of metallic elements have been measured before [1-5J, there remain significant uncertainties in their magnitude [4]. Many of the surface tension measurements were made in a gaseous environment and a small amount of impurities in the gas could strongly affect the accuracy of the measurement. Even trace quantities of oxygen and other surface-active contaminants could change the surface tension of liquid metals significantly [6-lo].
Many techniques have been used to measure the surface tension of high- temperature liquid metals [12-141. Both ground- and spaced-based techniques were described and summarized in a recent article by Thiessen and Man [15]. However, most of the standard ground-based techniques (sessile drop, maximum bubble pressure, and capillary rise) for measuring molten metal surface tension involve contact of the molten metal with a foreign support material. The support material often contaminates the surface, causing very large errors in the measured surface tension [q. The containerless oscillating drop technique employed in the reduced gravity of space can potentially yield high-precision surface tension measurements for very clean liquid-metal surfaces [5, 141. A 1-g version of the oscillating drop method [16] has been used to obtain ground-based results that have surface cleanliness comparable to low-gravity experiments. Unfortunately, gravitational deformation of the
,
2

drop alone can cause uncertainties on the order of 4% in the measurements using this method [I 71.
In the present study, surface tension measurements of several liquid metals have been measured at their melting point using the improved quasi-containerless pendant drop method. In this method, the pendant drop of molten metal is in contact only with its own solid and any initial surface contamination is evaporated away by prolonged heating of the sample near its melting point. This is expected to produce a surface purity comparable to or even better than what can be achieved by the low- gravity containerless method. The pendant drop method has the added advantage that it is a static method, thus presenting less uncertainty in the interpretation of results than with the dynamic oscillating drop method. This method is similar to that used by Allen [2] who analyzed photographs of the drop shape by selected-plane analysis that uses only two diameter measurements of the drop to calculate ‘the surface tension. This improved method involves melting the end of a high-purity metal rod under ultra-high vacuum conditions to form a pendant drop, the shape of which is analyzed using digital image analysis to calculate the surface tension. Digital image analysis allows the full shape of a drop to be determined accurately.
This paper reports the surface tension measurements of liquid metals, Zr, Ni, Ti, Mo and Nb. These metals were selected for their interest in containerless microgravity materials research. The measurements are compared with available experimental results and theoretical calculations. The improved quasi-containerless pendant drop method and its sources of error are also described.
2. EXPERIMENTAL TECHNIQUE
2.1. Apparatus
Detail of the quasi-containerless pendant drop method used for the present measurements has been described elsewhere [17]. Only a brief description essential to the interpretation of results is given here. Figure 1 shows a schematic diagram of the apparatus. The metal samples, in the form of a rod, were heated by an electron beam (Fig. 2) from a tungsten filament. A tantalum focusing plate was used to direct the energetic electrons toward the end of the rod, The filament power was provided by the
,
3

main power outlet through a transformer and potentiometer. The acceleration voltage of the electrons was fixed at -4kV. Both the filament and the focusing plate were kept at the same potential. The grounded sample was mounted on a linear micrometer drive feedthrough to allow the sample to be moved up and down vertically. The apparatus was housed inside a vacuum chamber with a base pressure of below 2x10' Torr.
The imaging system (Fig. 1) consisted of a high-resolution CCD camera and a macro lens of large numerical aperture with a variable extension tube to magnify the image of a small molten drop (-4 mm diameter) at a minimum working distance of 25 cm. This lens allowed the image of the drop to f i l l the full view of the CCD chip to enable a more accurate analysis. For high-temperature molten metals the glowing sample provided good contrast between the drop and the background, thus no external light source was required. A set of neutral density filters was used for adjusting the image brightness'to prevent saturation of the camera. The CCD ca'mera and lens system were mounted on an optical stage assembly that permitted 3-axis translation and 2-axis tilt adjustments. The images were digitized using a frame- grabber card and stored on the computer for subsequent analyses.
2.2. Calibration and Analysis of Data
The magnification factors of the digital image in both the x and y directions were obtained from calibration with precise spheres (specified to within 22.5 pm in diameter) positioned within the vacuum chamber. A digital image of the calibration sphere was made using collimated back lighting from a fiber-optic white light source. The camera settings remained the same throughout the time between calibration and the drop experiments. The precise vertical alignment of the CCD camera with the gravity vector was obtained by imaging a thin plumb wire at the location of the sample and adjusting the camera orientation until the edge of the wire in the digital image aligned with a column of pixels.
Computation of the surface tension from a digital image of a pendant drop was by a computer program E181 that read the pixel intensities from a graphics file containing the digitized image. The edges of the drop along each row or column of pixels were searched and the edge coordinates stored in an array. A trial theoretical drop shape was then computed by solving the Young-Laplace differential equation. This shape depended on four parameters. The first three parameters are boundary
4

conditions to the differential equation that include the x and y coordinates of the drop apex and the radius of curvature, R,, of the drop at its apex. The fourth parameter is the Bond number, p , which is inversely proportional to the surface tension. The trial theoretical drop shape was compared to the experimental edge coordinates through an objective function:
N 2
F = x ( 6 n i ) i= l
where 6ni is the separation of the ith experimental edge point from the theoretical edge along the normal to the theoretical curve. The objective function was minimized by variation of the four parameters. Following parameter optimization, the surface tension, y , was then calculated from t h e following identity:
where g is the gravitational acceleration (9.8016 ms-2 was used in the calculation), and Ap is the density difference between the drop and its surroundings. Since the drop was in vacuum, Ap was simply given by the density of the material at the melting point p,.
The full-shape analysis described here has several advantages over the standard selected-plane analysis [2] which used only two diameter measurements to calculate the surface tension. It generally gives a substantially lower standard deviation. Furthermore, if the theoretical and experimental shapes fail to match closely after optimization, this can indicate nonuniformity in the surface tension arising from temperature gradients or nonuniform impurity distributions along the surface or significant drop oscillations resulting from instrument vibration.
2.3. Sample Preparation and Experimental Procedure
The samples were machined from 6.5 mm diameter metal rods to form a stem of approximately 2.5 mm in diameter on one end. They were etched in an appropriate acid, depending on the material, to remove any initial oxide layer or other surface contamination. Zr, Ni, and Ti were etched for several minutes in a nitric acid solution
5

consisting of o n e part nitric acid to three parts water. The samples were r insed in water and then in ethanol, dried by evaporation, mounted on the micrometer drive, and quickly put inside the vacuum chamber. Mo samples were e tched in o n e part formic acid to nine parts hydrogen peroxide for ten minutes at room temperature [19]. The Nb samples were cleaned by etching in a mixture of HCI (15v%), H2SO4 ( 1 5v%) a n d H2NO3 (8vYo) for 30 seconds [20]. The purity of the metal rods (all from Johnson Matthey) and their relevant properties are given in table 1.
During the experiment, the sample temperature was raised slowly to just below melting for several hours while maintaining good vacuum conditions Torr range) to allow thorough outgassing and evaporation of surface impurities. When the pressure fell to t he low IO” Torr range, the temperature of the sample was then raised slowly until t he tip of the rod w a s molten to form a drop. For Ti a n d Mo, the p ressure went down to the 1 O9 Torr level during the experiment because of the gettering effect from their vapors. The temperature of the drops could be controlled very precisely a n d the solid-melt interface could be moved slowly upward from the d rop apex to the neck where the drop joins the stem. Since the liquid metallic drops were small (typically a few millimeters in diameter) and the thermal conductivity of metals is good, the temperature gradient across the surface of the drop was es t imated to be small. The drops were melted uniformly across the diameter of the stem and maintained at this condition for successive image captures.
3. R E S U L T S A N D D I S C U S S I O N S
The experimental results are shown in table 2. They include the average surface tension at melting temperature, the standard deviation for a large number of runs, and the average Bond number obtained from the experiments. Table 3 shows a comparison of the present measurements with available surface tension data from the literature.
During a typical experimental run, 20 or more images of a single sample were captured. For low evaporation metals, image capture was carried out over a period of several hours until the vacuum chamber windows were significantly coated with metal vapor, reducing the visibility and contrast of the images. The time at which each image was cap tu red was also recorded to study the variation of surface tension as a function
6

of the length of time the drop has been kept molten. Significant variations may indicate the purity of the sample material or surface impurity levels had changed over time. Sets of images were taken on several days for each sample to study the consistency of the results. Average values of the surface tension and standard deviations were calculated from these sets of runs.
Error Analysis
One major advantage of using digital image analysis of pendant drop shapes is the ease of which sources of error in the surface tension measurements can be diagnosed. The objective function itself, as shown in Eq. (l), is a measure of how well the measured drop shape corresponds to the theoretical shape. The magnitude of t h e objective function generally arises from a combination of drop shape distortion and noise in the imaging system. Values above'the noise level may indicate the presence of drop shape oscillation, optical distortion, camera misalignment, surface tension gradients, or nonuniform melting of the pendant drop. Noise in the imaging system was found to cause a consistent scatter of approximately +2 pm in the edge coordinates [ 171.
Oscillation of the molten metal drops was sometimes encountered in the experiments. When oscillation occurred, the runs were postponed until it stabilized to an acceptable level. The oscillation might have originated from vibration of t h e vacuum pump or, more likely, from vibration in the building. It was also possible that the drop shape oscillation was caused by the electron beam heating as has been suggested by other workers [21]. Drop shape oscillation is believed to be the main contributor to the random error indicated by the standard deviation of the surface tension measurements.
A nonaxisymmetric solid-melt-vapor contact line at the top of the drop, which may result from nonuniform melting, can cause distortion of the pendant drop shape. This distortion can, in turn, cause a systematic error in the measurements. The error is expected to be small for our experiments, although the magnitude of such an error cannot be easily estimated. Another source of systematic error is the magnification factors. They are dependent on the sharpness of focus obtained. They have been estimated [17] to be approximately 0.1 Yo. An error of 0.1 Yo in the magnification factor would translate into a 0.2 Yo error in the surface tension.
7

Other sources of systematic error arise from uncertainties in the parameters in Eq. 2. Errors in the surface tension are linearly proportional to errors in the gravitational acceleration and the density of the melt. The pendant drop technique with full-shape analysis actually measures the Bond number, which is a dimensionless quantity containing the gravitational acceleration, melt density, radius of curvature at the drop apex, and surface tension. The Bond number, surface tension, and radius of curvature for each measurement were recorded so that surface tension values can be corrected in the future for improved values of melt density or gravitational acceleration at the experiment location.
3.1. Zirconium Measurements
The average measured surface tension value and standard deviation obtained in this study for Zr are 1463 f 12 mN-m-'. The present surface tension measurements are somewhat lower than the best value of 1480 mN.m-l obtained by Allen [2] using the drop weight method. However, they agree well with Allen's value of 1469f4 rnN-m-', obtained with a similar pendant drop method but using the selected-plane analysis [2]. The present results also agree well with a more recent measurement of 1435 rnN-m-l obtained by Vinet et al [22] using the drop weight method (table 2).
3.2. Nickel Measurements
The average measured surface tension value and standard deviations obtained in this study for Ni are 1687 f 22 mN.rn-l. The surface tension of Nickel has been measured by several researches. Fraser et al [23] used the oscillating drop technique to measure the surface tension of high purity nickel (200ppm impurities) at a temperature of 1550 "C, which is 97 "C above the melting point. They obtained a value of 1998 k 14 mN.m-1 which is substantially higher than the present measurements.
Using the drop weight method, Allen [2] obtained a value of 1780f50mN-m-1. More recently, Sauerland, Eckler and Egry [24] obtained a value of 1868 mN-m-1 using the oscillating drop technique. This measurement was performed near melting point using levitated aspherical liquid nickel droplets and digital image processing.
a

3.3. Titanium Measurements
The average measured surface tension value and standard deviations obtained in this study for Ti are 1475f23 mN.m-'. Namba and lsobe p5] obtained a similar result of 1460 mN-m-' using the drop weight method conducted in vacuum using a 99.92% purity Ti sample. Peterson et al [26] obtained a value of 1390 mN-m-', using the pendant drop method in an Ar atmosphere for a similar purity of Ti. However, a higher value of 1656f4 mN-m-' was reported by Allen [2] who used the pendant drop method in vacuum for his experiments.
3.4. Molybdenum Measurements
The average measured surface tension value and standard deviations obtained in this study for Mo are 2068f70 mN.m-'. This value agrees well with the value of 2049 mN-m-' obtained by Flint [27], who used the pendant drop method to measure a 99.98% purity Mo sample in vacuum. A slightly higher value of 2080 mN-m-' was obtained by Namba and lsobe [25], who used the drop weight method with a 99.7% Mo sample. Employing the pendant drop method, Allen [2] obtained a value of 2239+10 mN-m-' with a sample material purity of 99.9996%. The higher purity material used may partially explain the higher value obtained by Allen.
3.5. Niobium Measurements
The average measured surface tension value and standard deviations obtained in this study for Nb, with 99.8% purity samples, are 1757+47 mN-m-'. Flint [27], using a 99.99% Nb sample in the pendant drop experiments, reported a higher value of 1827 mN-m-'. Allen [2], using an even purer Mo sample of 99.9986% in similar pendant drop experiments, measured a value of 1900 mN-m-'. The differences in the values may be attributed to the differences in the purity of the samples used in the different experiments.
5. CONCLUSIONS
Surface tension measurements of liquid metals, Zr, Ni, Ti, Mo, and Nb, have been measured using the quasi-containerless pendant drop method. The measured
9

results agree well with those in the literature in most cases. The differences in sample purity and in the accuracy of various experimental methods may explain some of the differences in the measurements.
The quasi-containerless pendant drop method has been successfully demonstrated for several high melting metals. The introduction of the CCD camera and full-shape computer analysis have made this method a very powerful tool for high- precision surface tension measurement of metals. This method should be equally applicable to the surface tension measurement of alloys.
ACKNOWLEDGMENTS
'The work described in this paper was carried out at the Jet Propulsion Laboratory, California Institute of Technology, under contract with the National Aeronautics and Space Administration (NASA). Financial support from NASA Code U is gratefully acknowledged. The author would like to express his appreciation to Dr. David B. Thiessen for many fruitful discussions, and thank Dr. Eli Jacobsohn for his assistance in the experiments and Mr. Dan Barber for his technical assistance.
R E F E R E N C E S
1 . B. J. Keene, Int. Mat. Rev. 38: 157 (1 993). 2. B. C. Allen, Trans. AlME 227: 1175 (1 963); B. C. Allen, Liquid Metals, Chemistry
3. K. Nogi, K. Ogino, A. McLean, and W. A. Miller, Metallurg. Trans. B, 17B:163
4. T. lida and R. I. L. Guthrie, The Physical Properties of Liquid Metals, (Clarendon
5. S. Sauerland, G. Lohofer, and I . Egry, J Non-Cryst Solids 156: 833 Part 2 (1993). 6. B. J . Keene, K. C. Mills, A. Kasama, A. McLean, and W. A. Miller, Metallurg.
7. S. C. Hardy, J. Crystal Growth 69:456 (1984); S. C. Hardy, J. Crystal Growth
8. W. D. Kingery and M. Humenik, J. Phys. Chem. 57:359 (1953).
and Physics, ed. S. Z . Beer (Marcel Dekker, 1972), pp. 161-212.
( 1 986).
Press, Oxford, 1988) pp. 109-1 46.
Trans. B, 178: 159 (1986).
71 :602 (1 985).
10

9. 10. 1 1 .
12. 13.
14. 15.
16. 17. 18.
19. 20.
21. 22. 23.
24. 25.
26.
27. 28.
S. Sauerland, G. Lohofer, and I . Egry, J Non-Cryst Solids 156: 833 Part 2 (1 993). E. Ricci, L. Nanni, E. Arato, and P. Costa , J Mater Sci 33: 305 (1998). S. Subramaniam, D. R. White, D. J. Scholl, and W. H. Weber, J Phys D Appl Phys 31 : 1963 (1 998). H. A. Friedrichs, L. W. Ronkow, Y. M. Zhou, Steel Res 68: 209 (1997). Y . Bayazitoglu, U. B. R. Sathuvalli, P. V. R. Suryanarayana, and G. F. Mitchell, Phys Fluids 8: 370 ( 1 996). J. Szekely, E. Schwartz, and R. Hyers, JOM-J Min Met Mat SOC 47: 50 (1 995). D. B. Thiessen and K. F. Man, The measurement, Instrumentation, and Sensor Handbook, ed. John G. Webster, Chapter 31, (CRC Press and IEEE Press , 1999)
I . Egry, J. Mat. Sci. 26: 2997 (1991). D. B. Thiessen and K. F. Man, Int. J. Thermophysi. 16:245 (1 995). D. B. Thiessen, D. J. Chione, C. B. McCreary, and W. B. Krantz, J. Colloid InterfaceSci., 177:658 (1996). P. Walker and W. Tarn, Handbook of Metals Etchants, (CRC FL, 1991), p 821. E.A. Brandes ed., Smithells Metals Reference Book (Butterworth, London, 1983)
PP1-13.
pp. 10-49. J. C. Kelly, J. Sci. Instrum. 36: 89 (1 959). B. Vinet, J. P. Garandet , and L. Cortella, J. Appl. Phys. 73: 3830 (1993). M.E. Fraser, W-K. Lu, A.E. Hamielec, and R. Murarka, Metall. Trans. 2: 817 ( 1 971). S. Sauerland, K. Eckler, I . Egry, J. Mater. Sci. Let. 11: 330 (1992). P. Namba and N. Isobe, Sci. Pap. Inst. Phys. Chem. Res., Tokyo, 57: 5154 ( 1 963). A. W. Peterson, H. Kedesdy, P. H. Keck, and E. Schwartz, J. Appl. Phys., 29: 213 (1 958). J. Flint, J. Nuc. Mat. ,16: 260 (1 965). R. C. Weas t ed., Handbook of Chemistry and Physics, (CRC Press, Inc. Boca Raton, Florida, 69th edition, 1988-1 989) pp. B215-220
1 1

FIGURE CAPTIONS
Figure 1. Schematic diagram of the quasi-containerless pendant drop apparatus showing details of the imaging system. (The white light source shown is used only for back-lighting of the calibration sphere.)
showing details of the electron beam heating system. Figure 2. Schematic diagram of the quasi-containerless pendant drop apparatus
TABLE CAPTIONS
Table 1. Properties of the metals used for the experiments. Table 2. Summary of experimental results. Table 3. Comparison of the results with literature.
12

0 1 1
I I I I
Monitor Computer I
To Vacuum Pump c White-Light Source
0
Neutral Density Filter
I Figure 1 . Schematic diagram of the quasi-containerless pendant drop apparatus
showing details of the imaging system. (The white light source shown is used only for back-lighting of the calibration sphere.)
13

3
Filament
Posts support
.
Ammeter I - - I
Metallic Sample
Focusing Plate
HV Power Supply
'r \-
+I I '
I ' Filament Power Supply
Figure 2. Schematic diagram of the quasi-containerless pendant drop apparatus showing details of the electron beam heating system.
14

Table 1: Properties of the metals used for the experiments.
Metal Sample purity [%I Tm P I P, [g.cm-3]
Zr 99 1852 121 6.06 [2]
Ni 99.995 1453 P I 7.77 PI Ti 99.99 1660 (21 4.1 1 [*I Mo 99.95 261 7 [281 9.33 [281
Nb 99.8 2468 [28] 7.6 [281
,
15

Table 2: Summary of experimental results.
Metal Y(Trn) [mN.m"I Average Bond #, p Average radius of curvature, R, (cm)
Zr 1463f12 0.20472040 0.22445640 N i 1687 f 22 0.22512044 0.21 0981 27 Ti 1475 f 23 0.20697390 0.27528640 Mo 2068 f 70 0.17209774 0.1 971 6234 Nb 1757f47 0.19233724 0.21293083
,
16
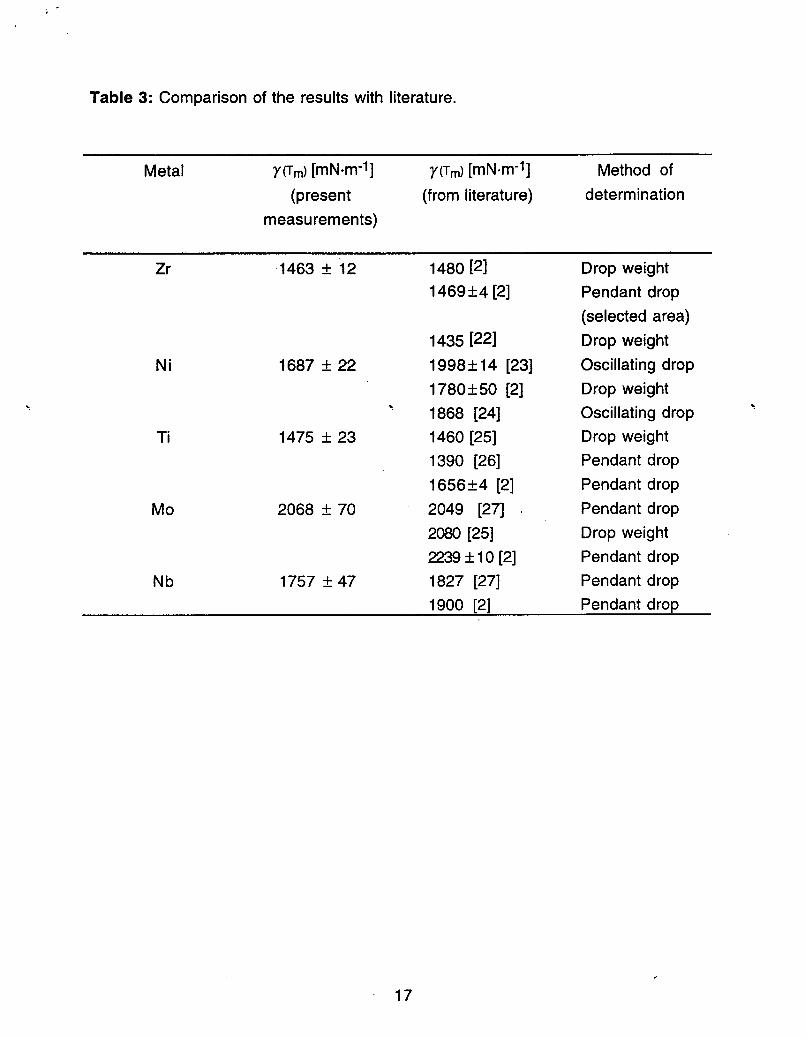
Table 3: Comparison of the results with literature.
Metal YUm) [mN*m-lI YUm) [mN.m-l I Method of (present (from literature) determination
measurements)
Zr ,1463 f 12 1480 [21 Drop weight 1469f4 [2] Pendant drop
(selected area)
Ni 1687 f 22 1998f14 [23] Oscillating drop
' 1868 [24] Oscillating drop
1435 [221 Drop weight
1780f50 [2] Drop weight . Ti 1475 f 23 1460 [25] Drop weight
1390 [26] Pendant drop 1656f4 [2] Pendant drop
Mo 2068 f 70 2049 [27] Pendant drop 2080 [25] Drop weight 2239 + l o [2] Pendant drop
1900 [2] Pendant drop Nb 1757 f 47 1827 [27] Pendant drop