Surface integrity of additive manufacturing parts: a ...
6
ScienceDirect Available online at www.sciencedirect.com www.elsevier.com/locate/procedia Procedia CIRP 87 (2020) 403–408 2212-8271 © 2020 The Authors. Published by Elsevier B.V. This is an open access article under the CC BY-NC-ND license (http://creativecommons.org/licenses/by-nc-nd/4.0/) Peer-review under responsibility of the scientific committee of the 5th CIRP CSI 2020 10.1016/j.procir.2020.02.082 © 2020 The Authors. Published by Elsevier B.V. This is an open access article under the CC BY-NC-ND license (http://creativecommons.org/licenses/by-nc-nd/4.0/) Peer-review under responsibility of the scientific committee of the 5th CIRP CSI 2020 Keywords: AM surface metrology; optical profilometer; time-optimization 1. Introduction Additive manufacturing (AM) enables a new manufacturing paradigm, offering a number of advantages over conventional subtractive techniques [1]. Selective addition of material in layers enables the creation of complex geometries, internal features, and reduces the need for assembly [2]. Among various metallic AM processes that are commercially available [3], powder bed fusion (PBF) is the most popular and it has been considered the process with the greatest economic impact [4]. PBF methods use either a laser (SLM) or electron beam (EBM) to melt and fuse material powder together [5]. This technology is increasingly used in the aerospace and biomedical industries due to the capability 5th CIRP CSI 2020 Surface integrity of additive manufacturing parts: a comparison between optical topography measuring techniques W.Tato a , L. Blunt b , I. Llavori a , A. Aginagalde a , A. Townsend b , A. Zabala a* a Surface Technologies, Mondragon University, Loramendi 4, 20500 Arrasate-Mondragon, Spain b University of Huddersfield, EPSRC Future Metrology Hub, UK * Corresponding author. Tel.: +34-943-794-700 . E-mail address: [email protected] Abstract Additive Manufacturing (AM) presents significant industry-specific advantages allowing the creation of complex geometries and internal features that cannot be produced using conventional manufacturing processes. However, a current limitation of AM is the degraded dimensional control and surface integrity of specific surfaces. The parts are constructed through layer-by-layer approach, each layer presenting a characteristic ‘fingerprint’. The functional performance of the final part is influenced by the morphology of the outer surface as well as by the surface quality introduced at intermediate layers. Surface texture metrology therefore can play an enabling role in AM-related manufacture and research. The use of optical topography measurement instrumentation allows for a high level of detail in the acquisition of topographic information. Some of the most commonly used optical measuring instruments are Vertical Scanning Interferometry (CSI), Imaging Confocal Microscopy (CONF), and Focus Variation (FV), each one has benefits and drawbacks in terms of acquisition time and measurement resolution. AM surfaces overall present complex topographical features, requiring the acquisition of large surface areas and large z-scans which considerably increases the acquisition time. Speed is a key factor in industrial practice, and time optimization is required for quality control and surface analysis before down-stream processes. This paper reports on the measurement and characterisation of the surface texture of metal powder bed fusion AM parts. All measurements were performed in the same SENSOFAR S-NEOX instrument using the commonly used optical technologies (CSI, CONF, and FV) and the latest step in confocal measurement technology called Continuous Confocal (C-CONF). The resolution and acquisition time of each technique is analysed in order to check the suitability of each method to characterize and describe the AM surface microstructures in a time-efficient way.
Transcript of Surface integrity of additive manufacturing parts: a ...

ScienceDirect
Available online at www.sciencedirect.comAvailable online at www.sciencedirect.com
ScienceDirectProcedia CIRP 00 (2017) 000–000
www.elsevier.com/locate/procedia
2212-8271 © 2017 The Authors. Published by Elsevier B.V. Peer-review under responsibility of the scientific committee of the 28th CIRP Design Conference 2018.
28th CIRP Design Conference, May 2018, Nantes, France
A new methodology to analyze the functional and physical architecture of existing products for an assembly oriented product family identification
Paul Stief *, Jean-Yves Dantan, Alain Etienne, Ali Siadat École Nationale Supérieure d’Arts et Métiers, Arts et Métiers ParisTech, LCFC EA 4495, 4 Rue Augustin Fresnel, Metz 57078, France
* Corresponding author. Tel.: +33 3 87 37 54 30; E-mail address: [email protected]
Abstract
In today’s business environment, the trend towards more product variety and customization is unbroken. Due to this development, the need of agile and reconfigurable production systems emerged to cope with various products and product families. To design and optimize productionsystems as well as to choose the optimal product matches, product analysis methods are needed. Indeed, most of the known methods aim to analyze a product or one product family on the physical level. Different product families, however, may differ largely in terms of the number and nature of components. This fact impedes an efficient comparison and choice of appropriate product family combinations for the productionsystem. A new methodology is proposed to analyze existing products in view of their functional and physical architecture. The aim is to clusterthese products in new assembly oriented product families for the optimization of existing assembly lines and the creation of future reconfigurable assembly systems. Based on Datum Flow Chain, the physical structure of the products is analyzed. Functional subassemblies are identified, and a functional analysis is performed. Moreover, a hybrid functional and physical architecture graph (HyFPAG) is the output which depicts the similarity between product families by providing design support to both, production system planners and product designers. An illustrativeexample of a nail-clipper is used to explain the proposed methodology. An industrial case study on two product families of steering columns of thyssenkrupp Presta France is then carried out to give a first industrial evaluation of the proposed approach. © 2017 The Authors. Published by Elsevier B.V. Peer-review under responsibility of the scientific committee of the 28th CIRP Design Conference 2018.
Keywords: Assembly; Design method; Family identification
1. Introduction
Due to the fast development in the domain of communication and an ongoing trend of digitization anddigitalization, manufacturing enterprises are facing importantchallenges in today’s market environments: a continuingtendency towards reduction of product development times andshortened product lifecycles. In addition, there is an increasingdemand of customization, being at the same time in a global competition with competitors all over the world. This trend, which is inducing the development from macro to micro markets, results in diminished lot sizes due to augmentingproduct varieties (high-volume to low-volume production) [1]. To cope with this augmenting variety as well as to be able toidentify possible optimization potentials in the existingproduction system, it is important to have a precise knowledge
of the product range and characteristics manufactured and/or assembled in this system. In this context, the main challenge inmodelling and analysis is now not only to cope with single products, a limited product range or existing product families,but also to be able to analyze and to compare products to definenew product families. It can be observed that classical existingproduct families are regrouped in function of clients or features.However, assembly oriented product families are hardly to find.
On the product family level, products differ mainly in twomain characteristics: (i) the number of components and (ii) thetype of components (e.g. mechanical, electrical, electronical).
Classical methodologies considering mainly single products or solitary, already existing product families analyze theproduct structure on a physical level (components level) which causes difficulties regarding an efficient definition andcomparison of different product families. Addressing this
Procedia CIRP 87 (2020) 403–408
2212-8271 © 2020 The Authors. Published by Elsevier B.V. This is an open access article under the CC BY-NC-ND license (http://creativecommons.org/licenses/by-nc-nd/4.0/) Peer-review under responsibility of the scientific committee of the 5th CIRP CSI 202010.1016/j.procir.2020.02.082
© 2020 The Authors. Published by Elsevier B.V. This is an open access article under the CC BY-NC-ND license (http://creativecommons.org/licenses/by-nc-nd/4.0/) Peer-review under responsibility of the scientific committee of the 5th CIRP CSI 2020
Available online at www.sciencedirect.com
ScienceDirect Procedia CIRP 00 (2019) 000–000
www.elsevier.com/locate/procedia
2212-8271 © 2020 The Authors. Published by Elsevier B.V. This is an open access article under the CC BY-NC-ND license (http://creativecommons.org/licenses/by-nc-nd/4.0/) Peer-review under responsibility of the scientific committee of the 5th CIRP CSI 2020
5th CIRP CSI 2020
Surface integrity of additive manufacturing parts: a comparison between optical topography measuring techniques
W.Tatoa, L. Bluntb, I. Llavoria, A. Aginagaldea, A. Townsend b, A. Zabalaa* aSurface Technologies, Mondragon University, Loramendi 4, 20500 Arrasate-Mondragon, Spain
bUniversity of Huddersfield, EPSRC Future Metrology Hub, UK
* Corresponding author. Tel.: +34-943-794-700 . E-mail address: [email protected]
Abstract
Additive Manufacturing (AM) presents significant industry-specific advantages allowing the creation of complex geometries and internal features that cannot be produced using conventional manufacturing processes. However, a current limitation of AM is the degraded dimensional control and surface integrity of specific surfaces. The parts are constructed through layer-by-layer approach, each layer presenting a characteristic ‘fingerprint’. The functional performance of the final part is influenced by the morphology of the outer surface as well as by the surface quality introduced at intermediate layers. Surface texture metrology therefore can play an enabling role in AM-related manufacture and research. The use of optical topography measurement instrumentation allows for a high level of detail in the acquisition of topographic information. Some of the most commonly used optical measuring instruments are Vertical Scanning Interferometry (CSI), Imaging Confocal Microscopy (CONF), and Focus Variation (FV), each one has benefits and drawbacks in terms of acquisition time and measurement resolution. AM surfaces overall present complex topographical features, requiring the acquisition of large surface areas and large z-scans which considerably increases the acquisition time. Speed is a key factor in industrial practice, and time optimization is required for quality control and surface analysis before down-stream processes. This paper reports on the measurement and characterisation of the surface texture of metal powder bed fusion AM parts. All measurements were performed in the same SENSOFAR S-NEOX instrument using the commonly used optical technologies (CSI, CONF, and FV) and the latest step in confocal measurement technology called Continuous Confocal (C-CONF). The resolution and acquisition time of each technique is analysed in order to check the suitability of each method to characterize and describe the AM surface microstructures in a time-efficient way. © 2020 The Authors. Published by Elsevier B.V. This is an open access article under the CC BY-NC-ND license (http://creativecommons.org/licenses/by-nc-nd/4.0/) Peer-review under responsibility of the scientific committee of the 5th CIRP CSI 2020
Keywords: AM surface metrology; optical profilometer; time-optimization
1. Introduction
Additive manufacturing (AM) enables a new manufacturing paradigm, offering a number of advantages over conventional subtractive techniques [1]. Selective addition of material in layers enables the creation of complex geometries, internal features, and reduces the need for assembly [2].
Among various metallic AM processes that are commercially available [3], powder bed fusion (PBF) is the most popular and it has been considered the process with the greatest economic impact [4]. PBF methods use either a laser (SLM) or electron beam (EBM) to melt and fuse material powder together [5]. This technology is increasingly used in the aerospace and biomedical industries due to the capability
404 W. Tato et al. / Procedia CIRP 87 (2020) 403–408 Author name / Procedia CIRP 00 (2019) 000–000 3
profilometer utilizing different techniques for the quantitative characterization. The following measurement techniques were employed for the comparative study: (i) Vertical Scanning Interferometry (CSI), (ii) Imaging Confocal Microscopy (CONF), (iii) Continuous Confocal (C-CONF) and Focus Variation (FV).
All measurements were conducted using 20x magnification at the same ROI locations (B and W) for the four measuring techniques over an area of 2x1,5 mm2. For CONF, C-CONF and FV technologies, a bright field objective of 20X (NA=0.45) was used and an interferometric objective 20DI (NA=0.40) for CSI. It should be highlighted that using the same instrument to conduct the measurements allows a direct comparison of the technique performance, as the rest of equipment variables (CCD camera, pixel size etc) are identical (only the objective is changed in the CSI technique, since interferometric objective is required).
2.3. Data processing
Data processing was conducted through metrological software SensoMap Premium 7 (Digital Surf). Minimal relocation was required because the measurements were carried out on the same equipment, and it was conducted using “shift surfaces” operator. First, the non-measured points were computed as performance indicator, and then were reconstructed by interpolation using the algorithm “smooth shape calculated from the neighbors”. A least-squares plane fitting was used as the F-operator to remove the global form of the surfaces analyzed in the study. Surface wavelengths <3 µm were filtered, including noise at that scale. No L-filer (high-pass filter) was applied thus preserving all topographic features of the AM process.
A set of topographical parameters from ISO 25178-2 [21] belonging to height (Sq, Ssk, Sku, Sa), spatial (Sal), hybrid (Sdr) and functional (Vmp, Vvv) families were calculated on the primary (SF) surface for detailed comparison of the measurement technologies.
3. Results and discussion
3.1. Qualitative analysis
Fig. 2 presents the scanning electron microscope (SEM) images of the ROIs (B and W). The base B surface (Fig. 2, a, b) presents a typical SLM surface build layer, which is the result of the interactions between the input material and the energy source scanning over the layer. This interaction results in the formation of melt pools, the ejection of particles and large thermal gradients [22] [23]. It can be observed that the surface topography is dominated by weld tracks, which results from the fusion and subsequent solidification of a melt pool [24], providing a strong directional texture (indicating the laser path in the build: hatch direction). Recesses can be observed along the weld tracks, which may result from incomplete seams, discontinuities between weld tracks, or due to open micro porosity [25]. At smaller scales, small arc-shaped ripples are apparent on the weld tracks indicating the beam scanning direction [26]. Finally, sphere-like protrusions
can be observed on the surface, formed either from unmelted or partially-melted powder particles, or spatter particles (melted particles ejected from the pool during beam transversal) [25]. In comparison, the wall surface (Fig. 2 c, d), which is the result from the multiple layers accumulating during the build process (side surface), presents a high concentration of sphere-like protrusions. These defects are originated from the powder attracted by the melt-pool (due to surface tension) from the powder bed, getting partially fused and adhered after solidification [26, p. 18].
Fig. 2. Reference scanning electron microscope (SEM) images of the ROIs.
(a)-(b): B surface; (c)-(d): W surface. (a)-(c) represents the quantitative measuring area (2x1,5 mm2).
3.2. Topographical reconstruction comparison
Fig. 3 and 4 show the crops of the B and W measurements corresponding to the exact locations analyzed in the SEM reference images (Fig. 3 corresponds to Fig. 2 (b) and Fig. 4 corresponds to Fig. 2 (d)). This provides a qualitative overview of how the different technologies reconstructs the same characteristic SLM fingerprint topographies of B (Fig. 3) and W (Fig. 4) surfaces.
Regarding B surface (Fig. 3), close visual inspection yields topographic differences, in particular in relation to FV dataset (d) featuring greater content of high spatial noisy frequencies. The ripple shapes visible in the reference SEM image (Fig. 2 (b)) are not that resolved for the FV dataset (Fig. 3 (d) in comparison to the rest of acquisitions at Fig. 3. This difference is probably coming from the operating principle differences between technologies. FV operates by finding the highest contrast of the target pixel in relation to its surrounding neighbors. If the contrast between adjacent pixels is insufficient, then the surface height of the pixel may not be entirely independent, and this may introduce some smoothing in the data. This provides a poorer lateral resolution comparing to the techniques that computes the distance considering only the pixel width and the optical resolution limit (such as the CSI, CONF and C-CONF). Regarding the side surface (Fig. 4) containing more sphere-like features, both CONF and C-CONF datasets (b)-(c) represent a clear difference regarding the deep surface depression distributions comparing to the CSI (a) and FV (d) measurements. Detailed inspection discloses deep areas in the complex geometry
100 µm
100 µm
(a) (b)
(c) (d)
Weld track
Surf. recesses Weld
Spatter/Non-melted
Spatter/Non-melted powder
2 Author name / Procedia CIRP 00 (2019) 000–000
to produce complex geometries when compared to traditional metal manufacturing techniques [6].
In spite of the popularity and many advantages, the application of PBF is still limited by some major drawbacks, such as low surface quality [7]. Surface integrity of as-built parts has been highlighted as a crucial issue that needs to be improved in additively manufactured parts [8]. During the layer-based manufacturing, a non-solid material phase changes to the continuum solid phase, generating micro-scale textures that are strongly related to the fabrication filling (hatch) patterns. The top surface topography consists of the laser or electron beam melt paths and any spatter that may occur [9] while side surfaces are a result of multiple layers adhering to one another during the build process [10]. The surface texture of AM parts is therefore strongly related to process variables and varies with building orientation angle [11].
The functional performance of the final part is influenced by both the morphology of the outer surface as well as by the surface quality introduced at intermediate layers [12]. Surface texture metrology therefore can play an enabling role in AM-related manufacture and research, both for verifying the compliance to surface texture requirements and as a tool to gain insight into the physical phenomena taking place during the manufacturing process [13]. Additionally, a good understanding of the link between surface topography and AM process can enable designers to optimize products towards minimization of surface post-processing [14].
However, metal PBF surfaces are often highly complex and irregular, presenting significant challenges when measuring with optical instruments due to the presence of particles and high slopes, non-uniformity of reflectivity, and high-aspect-ratio features and undercuts [15]. This leads to measurements often showing discrepancies between measurement technologies [16].
Measuring and characterizing AM surface topography is therefore challenging but critical for process optimization, product inspection and quality control. Accordingly, strategies for surface topography signature feature characterization based on segmentation techniques [17] [18] are being developed, and predictive models based on machine learning algorithms have been recently proposed [19]. However, the optimization of measurement acquisition (in terms of time and quality) is also of great importance in order to set efficient and reliable procedures for surface characterization.
Making faster surface topographic measurements has become a highly desired goal, especially in industrial environments targeting reduction in measurement cost. Measuring speed becomes increasingly important for such surfaces requiring large scan areas and large z scan values, such as additively manufactured surfaces. Thus, the requirements on measuring sensors are increasing in order to provide cost-effective solutions for accurate quality control and surface analysis. Accordingly, SenfoFar [20] developed a new measurement technology coined as “Continuous Confocal”. This new method avoids the discrete (and time-consuming) plane-by plane acquisition of classical confocal microscopy by scanning continuously along the Z axis, providing a significant acquisition time reduction.
This paper reports on the measurement and characterization of the surface texture of metal powder bed fusion AM parts. Measurements using the commonly used optical technologies: Vertical Scanning Interferometry (CSI), Imaging Confocal Microscopy (CONF), Focus Variation (FV), and the latest step in confocal measurement technology called Continuous Confocal (C-CONF) are analyzed and compared. Similarities and discrepancies between the techniques are evaluated by comparing the topographical parameters corresponding to height, spatial, hybrid and volume parameters in accordance with ISO 25178-2:2012. Apart from the surface topographical parameters, the 3D surface reconstructions are used to visualize and compare the results from different techniques. The resolution and acquisition time of each technology is analyzed in order to ascertain the suitability of each method to characterize and describe the AM surface microstructures in a time-efficient way.
2. Methodology
2.1. Sample
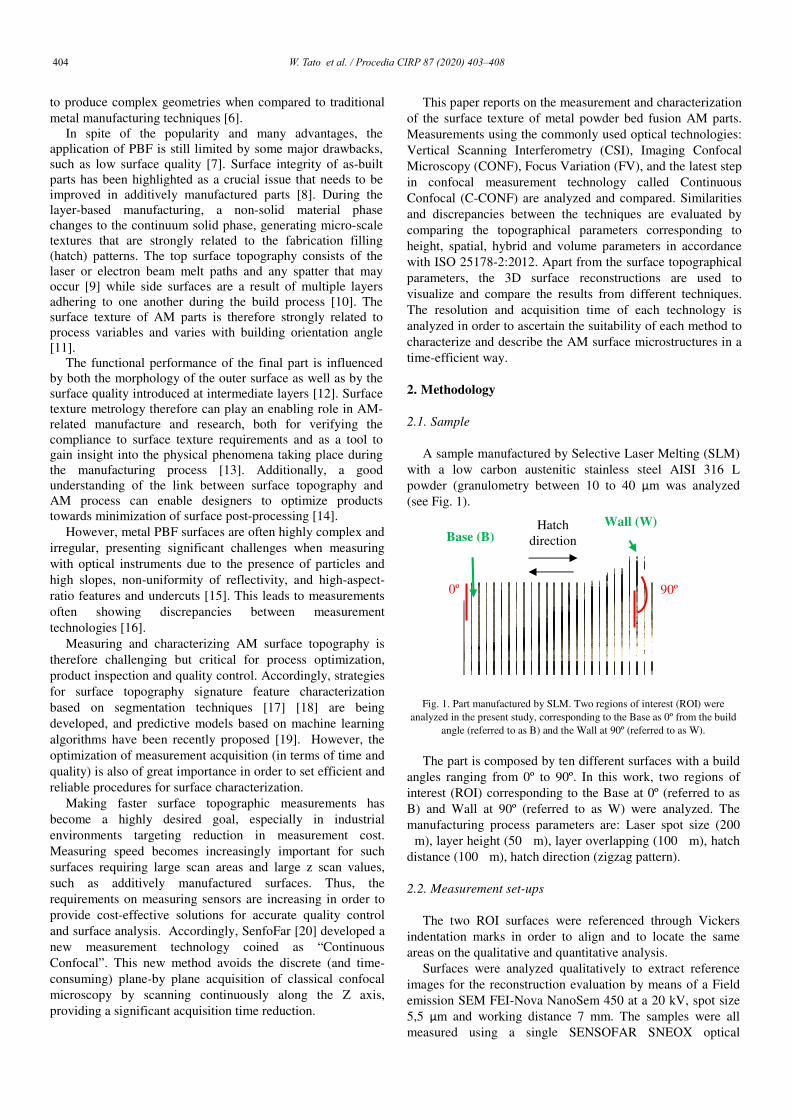
A sample manufactured by Selective Laser Melting (SLM) with a low carbon austenitic stainless steel AISI 316 L powder (granulometry between 10 to 40 µm was analyzed (see Fig. 1).
Fig. 1. Part manufactured by SLM. Two regions of interest (ROI) were analyzed in the present study, corresponding to the Base as 0º from the build
angle (referred to as B) and the Wall at 90º (referred to as W).
The part is composed by ten different surfaces with a build angles ranging from 0º to 90º. In this work, two regions of interest (ROI) corresponding to the Base at 0º (referred to as B) and Wall at 90º (referred to as W) were analyzed. The manufacturing process parameters are: Laser spot size (200 � m), layer height (50 � m), layer overlapping (100 � m), hatch distance (100 � m), hatch direction (zigzag pattern).
2.2. Measurement set-ups
The two ROI surfaces were referenced through Vickers indentation marks in order to align and to locate the same areas on the qualitative and quantitative analysis.
Surfaces were analyzed qualitatively to extract reference images for the reconstruction evaluation by means of a Field emission SEM FEI-Nova NanoSem 450 at a 20 kV, spot size 5,5 µm and working distance 7 mm. The samples were all measured using a single SENSOFAR SNEOX optical
Hatch direction
90º 0º
Base (B) Wall (W)

W. Tato et al. / Procedia CIRP 87 (2020) 403–408 405 Author name / Procedia CIRP 00 (2019) 000–000 3
profilometer utilizing different techniques for the quantitative characterization. The following measurement techniques were employed for the comparative study: (i) Vertical Scanning Interferometry (CSI), (ii) Imaging Confocal Microscopy (CONF), (iii) Continuous Confocal (C-CONF) and Focus Variation (FV).
All measurements were conducted using 20x magnification at the same ROI locations (B and W) for the four measuring techniques over an area of 2x1,5 mm2. For CONF, C-CONF and FV technologies, a bright field objective of 20X (NA=0.45) was used and an interferometric objective 20DI (NA=0.40) for CSI. It should be highlighted that using the same instrument to conduct the measurements allows a direct comparison of the technique performance, as the rest of equipment variables (CCD camera, pixel size etc) are identical (only the objective is changed in the CSI technique, since interferometric objective is required).
2.3. Data processing
Data processing was conducted through metrological software SensoMap Premium 7 (Digital Surf). Minimal relocation was required because the measurements were carried out on the same equipment, and it was conducted using “shift surfaces” operator. First, the non-measured points were computed as performance indicator, and then were reconstructed by interpolation using the algorithm “smooth shape calculated from the neighbors”. A least-squares plane fitting was used as the F-operator to remove the global form of the surfaces analyzed in the study. Surface wavelengths <3 µm were filtered, including noise at that scale. No L-filer (high-pass filter) was applied thus preserving all topographic features of the AM process.
A set of topographical parameters from ISO 25178-2 [21] belonging to height (Sq, Ssk, Sku, Sa), spatial (Sal), hybrid (Sdr) and functional (Vmp, Vvv) families were calculated on the primary (SF) surface for detailed comparison of the measurement technologies.
3. Results and discussion
3.1. Qualitative analysis
Fig. 2 presents the scanning electron microscope (SEM) images of the ROIs (B and W). The base B surface (Fig. 2, a, b) presents a typical SLM surface build layer, which is the result of the interactions between the input material and the energy source scanning over the layer. This interaction results in the formation of melt pools, the ejection of particles and large thermal gradients [22] [23]. It can be observed that the surface topography is dominated by weld tracks, which results from the fusion and subsequent solidification of a melt pool [24], providing a strong directional texture (indicating the laser path in the build: hatch direction). Recesses can be observed along the weld tracks, which may result from incomplete seams, discontinuities between weld tracks, or due to open micro porosity [25]. At smaller scales, small arc-shaped ripples are apparent on the weld tracks indicating the beam scanning direction [26]. Finally, sphere-like protrusions
can be observed on the surface, formed either from unmelted or partially-melted powder particles, or spatter particles (melted particles ejected from the pool during beam transversal) [25]. In comparison, the wall surface (Fig. 2 c, d), which is the result from the multiple layers accumulating during the build process (side surface), presents a high concentration of sphere-like protrusions. These defects are originated from the powder attracted by the melt-pool (due to surface tension) from the powder bed, getting partially fused and adhered after solidification [26, p. 18].
Fig. 2. Reference scanning electron microscope (SEM) images of the ROIs.
(a)-(b): B surface; (c)-(d): W surface. (a)-(c) represents the quantitative measuring area (2x1,5 mm2).
3.2. Topographical reconstruction comparison
Fig. 3 and 4 show the crops of the B and W measurements corresponding to the exact locations analyzed in the SEM reference images (Fig. 3 corresponds to Fig. 2 (b) and Fig. 4 corresponds to Fig. 2 (d)). This provides a qualitative overview of how the different technologies reconstructs the same characteristic SLM fingerprint topographies of B (Fig. 3) and W (Fig. 4) surfaces.
Regarding B surface (Fig. 3), close visual inspection yields topographic differences, in particular in relation to FV dataset (d) featuring greater content of high spatial noisy frequencies. The ripple shapes visible in the reference SEM image (Fig. 2 (b)) are not that resolved for the FV dataset (Fig. 3 (d) in comparison to the rest of acquisitions at Fig. 3. This difference is probably coming from the operating principle differences between technologies. FV operates by finding the highest contrast of the target pixel in relation to its surrounding neighbors. If the contrast between adjacent pixels is insufficient, then the surface height of the pixel may not be entirely independent, and this may introduce some smoothing in the data. This provides a poorer lateral resolution comparing to the techniques that computes the distance considering only the pixel width and the optical resolution limit (such as the CSI, CONF and C-CONF). Regarding the side surface (Fig. 4) containing more sphere-like features, both CONF and C-CONF datasets (b)-(c) represent a clear difference regarding the deep surface depression distributions comparing to the CSI (a) and FV (d) measurements. Detailed inspection discloses deep areas in the complex geometry
100 µm
100 µm
(a) (b)
(c) (d)
Weld track
Surf. recesses Weld
Spatter/Non-melted
Spatter/Non-melted powder
2 Author name / Procedia CIRP 00 (2019) 000–000
to produce complex geometries when compared to traditional metal manufacturing techniques [6].
In spite of the popularity and many advantages, the application of PBF is still limited by some major drawbacks, such as low surface quality [7]. Surface integrity of as-built parts has been highlighted as a crucial issue that needs to be improved in additively manufactured parts [8]. During the layer-based manufacturing, a non-solid material phase changes to the continuum solid phase, generating micro-scale textures that are strongly related to the fabrication filling (hatch) patterns. The top surface topography consists of the laser or electron beam melt paths and any spatter that may occur [9] while side surfaces are a result of multiple layers adhering to one another during the build process [10]. The surface texture of AM parts is therefore strongly related to process variables and varies with building orientation angle [11].
The functional performance of the final part is influenced by both the morphology of the outer surface as well as by the surface quality introduced at intermediate layers [12]. Surface texture metrology therefore can play an enabling role in AM-related manufacture and research, both for verifying the compliance to surface texture requirements and as a tool to gain insight into the physical phenomena taking place during the manufacturing process [13]. Additionally, a good understanding of the link between surface topography and AM process can enable designers to optimize products towards minimization of surface post-processing [14].
However, metal PBF surfaces are often highly complex and irregular, presenting significant challenges when measuring with optical instruments due to the presence of particles and high slopes, non-uniformity of reflectivity, and high-aspect-ratio features and undercuts [15]. This leads to measurements often showing discrepancies between measurement technologies [16].
Measuring and characterizing AM surface topography is therefore challenging but critical for process optimization, product inspection and quality control. Accordingly, strategies for surface topography signature feature characterization based on segmentation techniques [17] [18] are being developed, and predictive models based on machine learning algorithms have been recently proposed [19]. However, the optimization of measurement acquisition (in terms of time and quality) is also of great importance in order to set efficient and reliable procedures for surface characterization.
Making faster surface topographic measurements has become a highly desired goal, especially in industrial environments targeting reduction in measurement cost. Measuring speed becomes increasingly important for such surfaces requiring large scan areas and large z scan values, such as additively manufactured surfaces. Thus, the requirements on measuring sensors are increasing in order to provide cost-effective solutions for accurate quality control and surface analysis. Accordingly, SenfoFar [20] developed a new measurement technology coined as “Continuous Confocal”. This new method avoids the discrete (and time-consuming) plane-by plane acquisition of classical confocal microscopy by scanning continuously along the Z axis, providing a significant acquisition time reduction.
This paper reports on the measurement and characterization of the surface texture of metal powder bed fusion AM parts. Measurements using the commonly used optical technologies: Vertical Scanning Interferometry (CSI), Imaging Confocal Microscopy (CONF), Focus Variation (FV), and the latest step in confocal measurement technology called Continuous Confocal (C-CONF) are analyzed and compared. Similarities and discrepancies between the techniques are evaluated by comparing the topographical parameters corresponding to height, spatial, hybrid and volume parameters in accordance with ISO 25178-2:2012. Apart from the surface topographical parameters, the 3D surface reconstructions are used to visualize and compare the results from different techniques. The resolution and acquisition time of each technology is analyzed in order to ascertain the suitability of each method to characterize and describe the AM surface microstructures in a time-efficient way.
2. Methodology
2.1. Sample
A sample manufactured by Selective Laser Melting (SLM) with a low carbon austenitic stainless steel AISI 316 L powder (granulometry between 10 to 40 µm was analyzed (see Fig. 1).
Fig. 1. Part manufactured by SLM. Two regions of interest (ROI) were analyzed in the present study, corresponding to the Base as 0º from the build
angle (referred to as B) and the Wall at 90º (referred to as W).
The part is composed by ten different surfaces with a build angles ranging from 0º to 90º. In this work, two regions of interest (ROI) corresponding to the Base at 0º (referred to as B) and Wall at 90º (referred to as W) were analyzed. The manufacturing process parameters are: Laser spot size (200 � m), layer height (50 � m), layer overlapping (100 � m), hatch distance (100 � m), hatch direction (zigzag pattern).
2.2. Measurement set-ups
The two ROI surfaces were referenced through Vickers indentation marks in order to align and to locate the same areas on the qualitative and quantitative analysis.
Surfaces were analyzed qualitatively to extract reference images for the reconstruction evaluation by means of a Field emission SEM FEI-Nova NanoSem 450 at a 20 kV, spot size 5,5 µm and working distance 7 mm. The samples were all measured using a single SENSOFAR SNEOX optical
Hatch direction
90º 0º
Base (B) Wall (W)

406 W. Tato et al. / Procedia CIRP 87 (2020) 403–408 Author name / Procedia CIRP 00 (2019) 000–000 5
spatial (Sal) and functional (Vmp, Vvv) parameters produced percentage differences below 8% between the different technologies (Fig. 7). Hybrid parameters (Sdq, Sdr), however, presented big discrepancies (with differences up to 80%) but different trends between the two ROIs under study (B and W). Base surface (B) presented significantly bigger Sdq and Sdr parameter values, especially for the FV dataset, compared to the CSI reference parameter. This is associated with the previously discussed presence of greater noise in the FV measurement, which makes the topography both more steep (bigger Sdq) and also provides increased developed surface area (Sdr). This phenomena, however, is not observed for the W surface, at which both the Sdq and Sdr values reported by FV are below the reference, and the CONF and C-CONF are the ones presenting big discrepancies. The W surface contains a large concentration of hemispherical particles (see Fig 2 (c) and (d)), which presents complex geometries for the confocal technology generating artefacts as discussed before. Fig 8 presents a detail of the profile close to the periphery of one particle in W surface, where the presence of batwings and spikes in the CONF and C-CONF datasets can be observed. Due to the averaging nature of the FV technology, this kind of features are more smoothly captured being the source of the trend differences between the two ROIs (B and W).
Fig .7. Bar charts showing the percentage differences of topographical
parameters calculated from measurements performed on the B (a) and W (b)
ROI by CSI, CON, C-CON and FV technologies (reference= CSI).
Previous works related the differences in the spatial frequencies captured by different technologies based on the differences encountered in the lateral autocorrelation length (Sal) parameter. Current measurements present Sal values of 0.25 mm in B surface, which corresponds to the weld track distance (see Fig 2 (a) and (b)). This feature is captured similarly by the different technologies, thus not presenting differences in the value. However, looking closely at the reconstruction at smaller scales (see Fig 9), differences in the spatial frequencies captured by each technology can be
perceived, where the FV surface does not describe the ripples that can be seen in the CSI, CONF and C-CONF datasets.
Fig .8. Detail of the profiles close to one particle in W surface.
Fig. 9. Cropped area for spatial feature resolution comparison between
different technologies implemented in the S-NEOX: CSI (a), CONF (b), C-
CONF (c), FV(d).
3.5. Discussion
It can be observed that even if the texture parameters can be used to quantify differences between areal topography measurement instruments, the investigation of aligned reconstructed topographies is necessary in order to correctly interpret and analyse the obtained results. Even if the discrepancies across technologies were encountered in terms of noise and resolution capturing high frequency features, the effects in terms of texture field parameters had limited effects except for the hybrid Sdq and Sdr parameters. Most measurement discrepancies were caused by: (i) high local slopes and high aspect ratio features: generating measurement artefacts both in CONF and C-CONF technologies, and (ii) discrepancies in the actual lateral resolution: where FV technology presented less capability to resolve small features due to the averaging computed to define each pixel. The C-CONF technology presented a midway performance between the CONF and FV, bringing a resolution close to CONF within an acquisition time comparable to FV. However, the C-CONF technology includes the drawbacks of the conventional CONF technology in terms of artefacts.
It should be highlighted that the present work compared single measurement datasets from each measurement technology. The confidence interval analysis of consecutive measurements will be interesting to consider the statistical significance of the observed results, as suggested in [9].
Finally, it is important to understand the limitation regarding the portability of these results to different samples, due to the influence of the material (optical reflectivity), different laser or electron beam processes (different scale features) or different measurement equipment (different raw data processing within instruments for example). In this context, the role of the present work was to perform a comparison of different available optical technologies in terms of resolution and acquisition time, and highlight the potential of the upcoming new technologies, such as continuous confocal, to bring new measurement capabilities. Present results suggests that continuous confocal is a
(a) (b) (c) (d)
(a)
(b)
Sq Ssk Sku Sa Sal Sdq Sdr Vmp Vvv
Sq Ssk Sku Sa Sal Sdq Sdr Vmp Vvv
C
CSI CONF C-CONF FV
4 Author name / Procedia CIRP 00 (2019) 000–000
peripheries that probably provides the deeper height levels of the dataset due to the presence of spikes (discussed below).
Fig. 3. 3D reconstruction images of the B surface measurement crops (area: 0.58x0.38 mm2) from CSI (a), CONF (b), C-CONF (c) and FV (d)
acquisitions. (Location corresponds to the reference SEM image Fig2 (b).
Fig. 4. 3D reconstruction images of the W surface measurement crops (area: 0.58x0.38 mm2) from CSI (a), CONF (b), C-CONF (c) and FV (d)
acquisitions. (Location corresponds to the reference SEM image Fig 2 (d).
In order to aid in the comparison, Fig. 5 present the profiles obtained by each technology by cutting the aligned full topographies (area: 2x1.5 mm2) in the same cross-sectioning plane. As it can be observed, the noisier signal of the FV dataset can be observed in both ROIs. Regarding the W surface (Fig. 6 down), it should be highlighted the amount of batwing like spikes observed both for the CONF and C-CONF datasets. This artefacts are commonly observed in the pixels that fall at the edge of the step of confocal measurements [27], and are pronounced for the hemispherical peripheries of the current measurements.
3.3. Measurement details
Fig. 6 presents the measurement details in terms of measured points (%), and acquisition time. CSI was the technique that reported the least number of non-measured points for both ROIs followed by FV, CONF and C-CONF. It
should be highlighted that the amount of non-captured area data was significantly larger for all techniques for W surface measurements, due to the presence of larger amounts of complex high aspect-ratio sphere-like features on the surface. It should also be noted that FV has more measurement points that confocal technologies due to the operating principle using the values of the neighbors’ points. Regarding the acquisition time, the measuring time changed very significantly among different techniques. In relative terms, CSI technique took 13 times more time to perform the measurement comparing to FV, and 5 times more time compared to CONF. It must be highlighted at this point that C-CONF technique presented a similar acquisition time comparing to the fastest technology (FV).
Fig. 5. Profiles obtained by the 4 measurement techniques (CSI, CONF,
C-CONF and FV) acquired at the same location corresponding to the B (a)
and W (b) surfaces. (measurements corresponds to the areas represented in
Fig. 2, (a) and (c) respectively).
Fig. 6. Measurement details of measured point quantity and acquisition
time in relative terms from the optimum performing technology.
3.4. Topographical parameters
Fig. 7 presents the bar charts showing results in relative terms (with respect to the CSI results). Height (Sq, Ssk, Sku, Sa),
(a) (b)
(c) (d)
µm
0
10
20
30
40
50
60
70
80
90
100
µm
0
10
20
30
40
50
60
70
80
90
100
µm
0
10
20
30
40
50
60
70
80
90
100
µm
0
10
20
30
40
50
60
70
80
90
100
110
120
100
0
50
� m
50
100
0
� m
100
0
50
� m 120
0
60
� m
(a) (b)
(c) (d)
µm
0
10
20
30
40
50
60
70
80
µm
0
10
20
30
40
50
60
70
80
90
100
µm
0
10
20
30
40
50
60
70
80
90
µm
0
10
20
30
40
50
60
70
80
0
40
� m 90
0
50
� m
100
0
50
� m 70
0
40
� m
(a)
(b)
CSI CONF C-CONF FV

W. Tato et al. / Procedia CIRP 87 (2020) 403–408 407 Author name / Procedia CIRP 00 (2019) 000–000 5
spatial (Sal) and functional (Vmp, Vvv) parameters produced percentage differences below 8% between the different technologies (Fig. 7). Hybrid parameters (Sdq, Sdr), however, presented big discrepancies (with differences up to 80%) but different trends between the two ROIs under study (B and W). Base surface (B) presented significantly bigger Sdq and Sdr parameter values, especially for the FV dataset, compared to the CSI reference parameter. This is associated with the previously discussed presence of greater noise in the FV measurement, which makes the topography both more steep (bigger Sdq) and also provides increased developed surface area (Sdr). This phenomena, however, is not observed for the W surface, at which both the Sdq and Sdr values reported by FV are below the reference, and the CONF and C-CONF are the ones presenting big discrepancies. The W surface contains a large concentration of hemispherical particles (see Fig 2 (c) and (d)), which presents complex geometries for the confocal technology generating artefacts as discussed before. Fig 8 presents a detail of the profile close to the periphery of one particle in W surface, where the presence of batwings and spikes in the CONF and C-CONF datasets can be observed. Due to the averaging nature of the FV technology, this kind of features are more smoothly captured being the source of the trend differences between the two ROIs (B and W).
Fig .7. Bar charts showing the percentage differences of topographical
parameters calculated from measurements performed on the B (a) and W (b)
ROI by CSI, CON, C-CON and FV technologies (reference= CSI).
Previous works related the differences in the spatial frequencies captured by different technologies based on the differences encountered in the lateral autocorrelation length (Sal) parameter. Current measurements present Sal values of 0.25 mm in B surface, which corresponds to the weld track distance (see Fig 2 (a) and (b)). This feature is captured similarly by the different technologies, thus not presenting differences in the value. However, looking closely at the reconstruction at smaller scales (see Fig 9), differences in the spatial frequencies captured by each technology can be
perceived, where the FV surface does not describe the ripples that can be seen in the CSI, CONF and C-CONF datasets.
Fig .8. Detail of the profiles close to one particle in W surface.
Fig. 9. Cropped area for spatial feature resolution comparison between
different technologies implemented in the S-NEOX: CSI (a), CONF (b), C-
CONF (c), FV(d).
3.5. Discussion
It can be observed that even if the texture parameters can be used to quantify differences between areal topography measurement instruments, the investigation of aligned reconstructed topographies is necessary in order to correctly interpret and analyse the obtained results. Even if the discrepancies across technologies were encountered in terms of noise and resolution capturing high frequency features, the effects in terms of texture field parameters had limited effects except for the hybrid Sdq and Sdr parameters. Most measurement discrepancies were caused by: (i) high local slopes and high aspect ratio features: generating measurement artefacts both in CONF and C-CONF technologies, and (ii) discrepancies in the actual lateral resolution: where FV technology presented less capability to resolve small features due to the averaging computed to define each pixel. The C-CONF technology presented a midway performance between the CONF and FV, bringing a resolution close to CONF within an acquisition time comparable to FV. However, the C-CONF technology includes the drawbacks of the conventional CONF technology in terms of artefacts.
It should be highlighted that the present work compared single measurement datasets from each measurement technology. The confidence interval analysis of consecutive measurements will be interesting to consider the statistical significance of the observed results, as suggested in [9].
Finally, it is important to understand the limitation regarding the portability of these results to different samples, due to the influence of the material (optical reflectivity), different laser or electron beam processes (different scale features) or different measurement equipment (different raw data processing within instruments for example). In this context, the role of the present work was to perform a comparison of different available optical technologies in terms of resolution and acquisition time, and highlight the potential of the upcoming new technologies, such as continuous confocal, to bring new measurement capabilities. Present results suggests that continuous confocal is a
(a) (b) (c) (d)
(a)
(b)
Sq Ssk Sku Sa Sal Sdq Sdr Vmp Vvv
Sq Ssk Sku Sa Sal Sdq Sdr Vmp Vvv
C
CSI CONF C-CONF FV
4 Author name / Procedia CIRP 00 (2019) 000–000
peripheries that probably provides the deeper height levels of the dataset due to the presence of spikes (discussed below).
Fig. 3. 3D reconstruction images of the B surface measurement crops (area: 0.58x0.38 mm2) from CSI (a), CONF (b), C-CONF (c) and FV (d)
acquisitions. (Location corresponds to the reference SEM image Fig2 (b).
Fig. 4. 3D reconstruction images of the W surface measurement crops (area: 0.58x0.38 mm2) from CSI (a), CONF (b), C-CONF (c) and FV (d)
acquisitions. (Location corresponds to the reference SEM image Fig 2 (d).
In order to aid in the comparison, Fig. 5 present the profiles obtained by each technology by cutting the aligned full topographies (area: 2x1.5 mm2) in the same cross-sectioning plane. As it can be observed, the noisier signal of the FV dataset can be observed in both ROIs. Regarding the W surface (Fig. 6 down), it should be highlighted the amount of batwing like spikes observed both for the CONF and C-CONF datasets. This artefacts are commonly observed in the pixels that fall at the edge of the step of confocal measurements [27], and are pronounced for the hemispherical peripheries of the current measurements.
3.3. Measurement details
Fig. 6 presents the measurement details in terms of measured points (%), and acquisition time. CSI was the technique that reported the least number of non-measured points for both ROIs followed by FV, CONF and C-CONF. It
should be highlighted that the amount of non-captured area data was significantly larger for all techniques for W surface measurements, due to the presence of larger amounts of complex high aspect-ratio sphere-like features on the surface. It should also be noted that FV has more measurement points that confocal technologies due to the operating principle using the values of the neighbors’ points. Regarding the acquisition time, the measuring time changed very significantly among different techniques. In relative terms, CSI technique took 13 times more time to perform the measurement comparing to FV, and 5 times more time compared to CONF. It must be highlighted at this point that C-CONF technique presented a similar acquisition time comparing to the fastest technology (FV).
Fig. 5. Profiles obtained by the 4 measurement techniques (CSI, CONF,
C-CONF and FV) acquired at the same location corresponding to the B (a)
and W (b) surfaces. (measurements corresponds to the areas represented in
Fig. 2, (a) and (c) respectively).
Fig. 6. Measurement details of measured point quantity and acquisition
time in relative terms from the optimum performing technology.
3.4. Topographical parameters
Fig. 7 presents the bar charts showing results in relative terms (with respect to the CSI results). Height (Sq, Ssk, Sku, Sa),
(a) (b)
(c) (d)
µm
0
10
20
30
40
50
60
70
80
90
100
µm
0
10
20
30
40
50
60
70
80
90
100
µm
0
10
20
30
40
50
60
70
80
90
100
µm
0
10
20
30
40
50
60
70
80
90
100
110
120
100
0
50
� m
50
100
0
� m
100
0
50
� m 120
0
60
� m
(a) (b)
(c) (d)
µm
0
10
20
30
40
50
60
70
80
µm
0
10
20
30
40
50
60
70
80
90
100
µm
0
10
20
30
40
50
60
70
80
90
µm
0
10
20
30
40
50
60
70
80
0
40
� m 90
0
50
� m
100
0
50
� m 70
0
40
� m
(a)
(b)
CSI CONF C-CONF FV

408 W. Tato et al. / Procedia CIRP 87 (2020) 403–4086 Author name / Procedia CIRP 00 (2019) 000–000
promising technology to bring resolutions close to confocal technologies within acquisition times comparable to focus variation. Future studies will be focused on analysing a broad range of materials and surface types considering statistical significance in order to have better overview on the benefits and limitations of the technology.
4. Conclusion
A qualitative and quantitative comparison of commonly used optical technologies (CSI, CONF, and FV) and the recently proposed continuous confocal technology (C-CONF) for AISI 316 L PBF part characterization was carried out. Indicators of performance were analysed in terms of reconstruction capabilities, variations on topographical parameters and acquisition time. Within the limitations of the study, the following conclusions are drown: • The Wall (W) surface presented more difficulties for
measurement comparing to the Base (B) surface for all technologies, presenting a bigger amount of non-measured points due to the bigger amount of complex high aspect-ratio features on the surface.
• Most measurement discrepancies were caused by (i): high local slopes and high aspect ratio features (resulting in the presence of optical artefacts, especially on CONF and C-CONF technologies), and (ii): discrepancies in the actual lateral resolution (being FV the technology that presented the lowest lateral resolution capability).
• Even if discrepancies are encountered, variations on topographical parameters were below 8% except for the hybrid Sdq and Sdr parameters.
• Acquisition time varied significantly between the commonly used optical technologies: CSI technique took 13 times more time to perform the measurement comparing to FV, and 5 times more compared to CONF.
• The C-CONF technology presented a midway performance between the CONF and FV, bringing a resolution close to CONF within an acquisition time comparable to FV.
Acknowledgements
The authors would like to thanks to Dr. Aitor Zurriarain from Goierri Fundazioa (Ordizia-Spain) for manufacturing the SLM part used in this work. L Blunt would like to gratefully acknowledge the UK’s Engineering and Physical Sciences Research Council (EPSRC) funding of the Future Metrology Hub (Grant Ref: EP/P006930/1).
5. References
[1] B. Berman, ‘3-D printing: The new industrial revolution’, Business
Horizons, vol. 55, no. 2, pp. 155–162, Mar. 2012. [2] I. Gibson, D. W. Rosen, and B. Stucker, ‘Design for Additive
Manufacturing’, in Additive Manufacturing Technologies: Rapid
Prototyping to Direct Digital Manufacturing, I. Gibson, D. W. Rosen, and B. Stucker, Eds. Boston, MA: Springer US, 2010, pp. 299–332.
[3] W. E. Frazier, ‘Metal Additive Manufacturing: A Review’, J. of
Materi Eng and Perform, vol. 23, no. 6, pp. 1917–1928, Jun. 2014. [4] ‘Shaping our national competency in additive manufacturing: a
technology innovation needs analysis’, TSB Additive Manufacturing Special Interest Group, 2012.
[5] V. Bhavar, P. Kattire, V. Patil, S. Khot, K. Gujar, and R. Singh, ‘A review on powder bed fusion technology of metal additive
manufacturing’, in Additive Manufacturing Handbook, 1st ed., A. B. Badiru, V. V. Valencia, and D. Liu, Eds. CRC Press, 2017, pp. 251–253.
[6] I. Gibson, D. Rosen, and B. Stucker, Additive Manufacturing
Technologies: 3D Printing, Rapid Prototyping, and Direct Digital
Manufacturing, 2nd ed. New York: Springer-Verlag, 2015. [7] E. Yasa, J. P. Kruth, and J. Deckers, ‘Roughness improvement in
selective laser melting’, in Proceedings of PMI Conference, Ghent,
Belgium, 2008. [8] ‘Measurement Science Roadmap for Metal-Based Additive
Manufacturing’, National Institute of Standards and Technology, Gaithersburg, MD., 2012.
[9] N. Senin, A. Thompson, and R. K. Leach, ‘Characterisation of the topography of metal additive surface features with different measurement technologies’, Meas. Sci. Technol., vol. 28, no. 9, p. 095003, Sep. 2017.
[10] C. Körner, ‘Additive manufacturing of metallic components by selective electron beam melting — a review’, International Materials
Reviews, vol. 61, no. 5, pp. 361–377, Jul. 2016. [11] G. Strano, L. Hao, R. M. Everson, and K. E. Evans, ‘Surface
roughness analysis, modelling and prediction in selective laser melting’, Journal of Materials Processing Technology, vol. 213, no. 4, pp. 589–597, Apr. 2013.
[12] ‘Materials research to support high performance RM parts. Rapid manufacturing 2nd international conference’, presented at the Rapind manufacturing 2nd international conference, 2007, pp. 147--56.
[13] A. Townsend, N. Senin, L. Blunt, R. K. Leach, and J. S. Taylor, ‘Surface texture metrology for metal additive manufacturing: a review’, Precision Engineering, vol. 46, pp. 34–47, Oct. 2016.
[14] D. E. Cooper, M. Stanford, K. A. Kibble, and G. J. Gibbons, ‘Additive Manufacturing for product improvement at Red Bull Technology’, Materials & Design, vol. 41, pp. 226–230, Oct. 2012.
[15] C. Gomez, R. Su, A. Thompson, J. DiSciacca, S. Lawes, and R. Leach, ‘Optimization of surface measurement for metal additive manufacturing using coherence scanning interferometry’, Opt. Eng, vol. 56, no. 11, p. 111714, Jul. 2017.
[16] A. Thompson, N. Senin, C. Giusca, and R. Leach, ‘Topography of selectively laser melted surfaces: A comparison of different measurement methods’, CIRP Annals, vol. 66, no. 1, pp. 543–546, Jan. 2017.
[17] S. Lou, X. Jiang, W. Sun, W. Zeng, L. Pagani, and P. J. Scott, ‘Characterisation methods for powder bed fusion processed surface topography’, Precision Engineering, vol. 57, pp. 1–15, May 2019.
[18] L. Newton, N. Senin, B. Smith, E. Chatzivagiannis, and R. Leach, ‘Comparison and validation of surface topography segmentation methods for feature-based characterisation of metal powder bed fusion surfaces’, Surf. Topogr.: Metrol. Prop., vol. 7, no. 4, p. 045020, Nov. 2019.
[19] T. Özel, A. Altay, B. Kaftanoğlu, R. Leach, N. Senin, and A. Donmez, ‘Focus Variation Measurement and Prediction of Surface Texture Parameters Using Machine Learning in Laser Powder Bed Fusion’, Journal of Manufacturing Science and Engineering, vol. 142, no. 1, p. 011008, Jan. 2020.
[20] ‘New technologies for 3D surface metrology’, Sensofar, 25-Jan-2017. [21] ISO 25178-2:2012 Geometrical product specifications (GPS) --
Surface texture: Areal -- Part 2: Terms, definitions and surface texture parameters, 2012.
[22] M. J. Matthews, G. Guss, S. A. Khairallah, A. M. Rubenchik, P. J. Depond, and W. E. King, ‘Denudation of metal powder layers in laser powder bed fusion processes’, Acta Materialia, vol. 114, pp. 33–42, Aug. 2016.
[23] S. A. Khairallah, A. T. Anderson, A. Rubenchik, and W. E. King, ‘Laser powder-bed fusion additive manufacturing: Physics of complex melt flow and formation mechanisms of pores, spatter, and denudation zones’, Acta Materialia, vol. 108, pp. 36–45, Apr. 2016.
[24] J. Mazumder, ‘Overview of melt dynamics in laser processing’, OE, vol. 30, no. 8, pp. 1208–1220, Aug. 1991.
[25] M. Simonelli et al., ‘A Study on the Laser Spatter and the Oxidation Reactions During Selective Laser Melting of 316L Stainless Steel, Al-Si10-Mg, and Ti-6Al-4V’, Metall and Mat Trans A, vol. 46, no. 9, pp. 3842–3851, Sep. 2015.
[26] F. Cabanettes et al., ‘Topography of as built surfaces generated in metal additive manufacturing: A multi scale analysis from form to roughness’, Precision Engineering, vol. 52, pp. 249–265, Apr. 2018.
[27] M. Conroy and J. Armstrong, ‘A comparison of surface metrology techniques’, J. Phys.: Conf. Ser., vol. 13, pp. 458–465, Jan. 20