Surface-induced orientational order in stretched nanoscale-sized
37
Surface-induced orientational order in stretched nanoscale-sized polymer dispersed liquid crystal droplets Ichiro Amimori, 1 James N. Eakin, 1 Jun Qi, 2 Gregor Skaˇ cej, 3 Slobodan ˇ Zumer, 3 and Gregory P. Crawford 1,2 1 Division of Engineering, Brown University, Providence, RI 02912, USA 2 Department of Physics, Brown University, Providence, RI 02912, USA 3 Department of Physics, University of Ljubljana, Jadranska 19, SI-1000 Ljubljana, Slovenia (Dated: December 15, 2004) We investigate orientational ordering in stretched polymer dispersed liquid crystal (PDLC) droplets using deuterium nuclear magnetic resonance ( 2 H-NMR), in the nematic and isotropic phase. In the latter case, we estimate the surface order parameter S0 and the thickness of the interfacial layer from the temperature-independent surface ordering model for an elliptical cavity with a varying aspect ratio. A simple phenomenological model well describes the quadrupole splitting frequency of NMR spectra in the isotropic phase. The strain dependence of S0 suggests that stretching-induced changes in the orientation of polymer chains in the PDLC matrix noticeably affect liquid crys- tal surface anchoring. Experimental results are supported by simulated NMR spectra obtained as output from Monte Carlo simulations of paranematic ordering in ellipsoidal droplets based on the Lebwohl-Lasher lattice model. PACS numbers: 61.30.Pq, 61.30.Cz, 64.70.Md I. INTRODUCTION A liquid crystal in physical contact with a solid substrate is partially ordered even above the nematic-isotropic transition temperature. This phenomenon can be treated as orientational wetting of the substrate by the nematic phase at a temperature where the isotropic phase is stable in the bulk [1, 2]. On approaching the nematic-isotropic (NI) transition temperature (T NI ) from above, the thickness of the ordered nematic surface layer assumes either a finite or infinite limiting value, which corresponds to partial or complete orientational wetting regime. To classify the wetting regime as either partial or complete, the adsorption parameter Γ = R ∞ 0 S(z )dz is used, where z is the distance from the order-inducing surface and S(z ) the scalar orientational order parameter [3]. Neglecting biaxiality, the surface-induced ordering in the isotropic phase is well described by S(z ) and the preferred molecular direction n(r) in the surface layer. If Γ diverges as T NI is approached, orientational wetting is known as complete; if Γ remains finite, it is said to be partial. The nature of the wetting regime is strongly correlated to the interaction strength between the liquid crystal and the orienting solid surface, and therefore depends on the magnitude of the surface- induced order parameter in the interfacial layer [4]. If the value of the surface order parameter S 0 exceeds a threshold order parameter S c , then wetting is complete, while below S c wetting is only partial. Within the Landau-de Gennes framework, the threshold value is equal to the bulk nematic order parameter at T NI [1, 2]. The pioneering work of Miyano demonstrated that the surface-induced order parameter could be accessed with pretransitional birefringence measurements [5]. Further experimental efforts include second harmonic generation [6], field-induced twist [7], and evanescent wave ellipsometry [8]. Over a decade ago, it was found by Crawford and coworkers that liquid crystals confined to Nuclepore cavities could be effectively probed with deuterium nuclear magnetic resonance ( 2 H-NMR) [9]. Since the surface-to-volume ratio in these confined systems was large, and the orientation of the liquid crystal in the Nuclepore cavities was uniform with respect to the static magnetic NMR field, a small but measurable quadrupole splitting was measured above the T NI . In fact, it was measurable to temperatures deep in the isotropic phase (T - T NI ∼ 20 K). This early study proved the validity of the 2 H-NMR technique in surface-induced order studies, and showed that 2 H-NMR was capable of measuring S 0 , the interfacial layer thickness l 0 , and the molecular exchange rate between the ordered surface layer and the bulk. The 2 H-NMR technique was later used to study liquid crystals confined to alumina channels of Anopore membranes where anchoring transitions were observed and radically different values of S 0 were measured, depending on the surface alignment layer [3, 4, 10]. The work has recently been extended to smectic liquid crystals where NMR can measure the degree of smectic-nematic coupling [11] and pretransitional smectic layering phenomena [12]. In fact, the NMR technique has been applied to numerous confined liquid crystal systems, including Vycor glass [13–15], silica aerogel [16], and Millipore filters [17]. Most recently, NMR has been used to probe layer order of mesogenic molecules deposited on the cavity walls of Anopore membrane surface [18]. In contrast to intensive efforts devoted to liquid crystals confined to cylindrical and random geometries [19], surface parameters of polymer dispersed liquid crystals (PDLCs) have only been scarcely investigated in comparison. Golemme and coworkers used 2 H-NMR to study spherical liquid crystal droplets [20]. In the pioneering publication on NMR to study PDLCs, they revealed that the weak first-order nematic-isotropic transition was replaced by a continuous
Transcript of Surface-induced orientational order in stretched nanoscale-sized
Surface-induced orientational order in stretched nanoscale-sized polymer dispersed
liquid crystal droplets
Ichiro Amimori,1 James N. Eakin,1 Jun Qi,2 Gregor Skacej,3 Slobodan Zumer,3 and Gregory P. Crawford1,2
1Division of Engineering, Brown University, Providence, RI 02912, USA2Department of Physics, Brown University, Providence, RI 02912, USA
3Department of Physics, University of Ljubljana, Jadranska 19, SI-1000 Ljubljana, Slovenia
(Dated: December 15, 2004)
We investigate orientational ordering in stretched polymer dispersed liquid crystal (PDLC)droplets using deuterium nuclear magnetic resonance (2H-NMR), in the nematic and isotropic phase.In the latter case, we estimate the surface order parameter S0 and the thickness of the interfaciallayer from the temperature-independent surface ordering model for an elliptical cavity with a varyingaspect ratio. A simple phenomenological model well describes the quadrupole splitting frequency ofNMR spectra in the isotropic phase. The strain dependence of S0 suggests that stretching-inducedchanges in the orientation of polymer chains in the PDLC matrix noticeably affect liquid crys-tal surface anchoring. Experimental results are supported by simulated NMR spectra obtained asoutput from Monte Carlo simulations of paranematic ordering in ellipsoidal droplets based on theLebwohl-Lasher lattice model.
PACS numbers: 61.30.Pq, 61.30.Cz, 64.70.Md
I. INTRODUCTION
A liquid crystal in physical contact with a solid substrate is partially ordered even above the nematic-isotropictransition temperature. This phenomenon can be treated as orientational wetting of the substrate by the nematicphase at a temperature where the isotropic phase is stable in the bulk [1, 2]. On approaching the nematic-isotropic(NI) transition temperature (TNI) from above, the thickness of the ordered nematic surface layer assumes either afinite or infinite limiting value, which corresponds to partial or complete orientational wetting regime. To classifythe wetting regime as either partial or complete, the adsorption parameter Γ =
∫ ∞
0S(z)dz is used, where z is the
distance from the order-inducing surface and S(z) the scalar orientational order parameter [3]. Neglecting biaxiality,the surface-induced ordering in the isotropic phase is well described by S(z) and the preferred molecular directionn(r) in the surface layer. If Γ diverges as TNI is approached, orientational wetting is known as complete; if Γ remainsfinite, it is said to be partial. The nature of the wetting regime is strongly correlated to the interaction strengthbetween the liquid crystal and the orienting solid surface, and therefore depends on the magnitude of the surface-induced order parameter in the interfacial layer [4]. If the value of the surface order parameter S0 exceeds a thresholdorder parameter Sc, then wetting is complete, while below Sc wetting is only partial. Within the Landau-de Gennesframework, the threshold value is equal to the bulk nematic order parameter at TNI [1, 2].
The pioneering work of Miyano demonstrated that the surface-induced order parameter could be accessed withpretransitional birefringence measurements [5]. Further experimental efforts include second harmonic generation [6],field-induced twist [7], and evanescent wave ellipsometry [8]. Over a decade ago, it was found by Crawford andcoworkers that liquid crystals confined to Nuclepore cavities could be effectively probed with deuterium nuclearmagnetic resonance (2H-NMR) [9]. Since the surface-to-volume ratio in these confined systems was large, and theorientation of the liquid crystal in the Nuclepore cavities was uniform with respect to the static magnetic NMR field,a small but measurable quadrupole splitting was measured above the TNI . In fact, it was measurable to temperaturesdeep in the isotropic phase (T − TNI ∼ 20 K). This early study proved the validity of the 2H-NMR technique insurface-induced order studies, and showed that 2H-NMR was capable of measuring S0, the interfacial layer thicknessl0, and the molecular exchange rate between the ordered surface layer and the bulk. The 2H-NMR technique was laterused to study liquid crystals confined to alumina channels of Anopore membranes where anchoring transitions wereobserved and radically different values of S0 were measured, depending on the surface alignment layer [3, 4, 10]. Thework has recently been extended to smectic liquid crystals where NMR can measure the degree of smectic-nematiccoupling [11] and pretransitional smectic layering phenomena [12]. In fact, the NMR technique has been applied tonumerous confined liquid crystal systems, including Vycor glass [13–15], silica aerogel [16], and Millipore filters [17].Most recently, NMR has been used to probe layer order of mesogenic molecules deposited on the cavity walls ofAnopore membrane surface [18].
In contrast to intensive efforts devoted to liquid crystals confined to cylindrical and random geometries [19], surfaceparameters of polymer dispersed liquid crystals (PDLCs) have only been scarcely investigated in comparison. Golemmeand coworkers used 2H-NMR to study spherical liquid crystal droplets [20]. In the pioneering publication on NMRto study PDLCs, they revealed that the weak first-order nematic-isotropic transition was replaced by a continuous
2
evolution of order for sufficiently small droplets, a prediction made many years before by Sheng in planar samples [1],and later by Vilfan and coworkers in spherical droplets [21]. Studies of PDLC droplets have continued on far morethan a decade after the seminal publication of Golemme. NMR relaxometry was used to extract the value of S0 fromthe transverse relaxation rate T −1
2 [22]. The ability to measure S0 directly from the 2H-NMR quadrupole splittingfrequency in PDLC systems remains a challenge for two reasons: (1) the droplet director (average orientation ofsymmetry axis of liquid crystal droplet) differs from droplet to droplet with respect to the magnetic field direction;and (2) there tends to be a much larger size distribution in PDLCs compared to the well-defined pores of Nucleporeand Anopore membranes [3, 4, 10].
On the other hand, with the continuous increase of computing power, as well as with the development of simulationtechniques, strongly confined liquid crystal systems are becoming increasingly accessible to computer simulationstudies. In particular, a lot of effort has been invested into exploring nematic ordering inside PDLC droplets, wheremost of the analyses were based on the computationally simple Lebwohl-Lasher lattice model. Typically, Monte Carlo(MC) simulations were carried out for this model system [23]. The resulting numerical output can be expressedin terms of suitable order parameters, or even more conveniently, directly in terms of macroscopic experimentalobservables such as 2H-NMR spectra. The methodology for calculating dynamic NMR spectra, capable of handlingfluctuations of molecular long axes and translational diffusion, has been presented and tested for spherical PDLCdroplets [24]. More recent MC studies of nematic ordering extend to elliptical droplets as well [25, 26].
In this contribution we report on a PDLC system that gives a reasonable quadrupole splitting in the isotropic phase.After PDLC formation using the emulsification technique [27], the PDLC film is subjected to high degree of uniaxialstrain (as much as 400%) to create ellipsoidal droplets whose droplet director and cross-section are nearly uniform [28].These highly aligned droplet samples, currently being developed for light scattering polarizer applications [29], createan ideal system to be studied with 2H-NMR. We present an experimental determination of the surface-induced orderparameter S0 directly obtained from the quadrupole splitting frequency measured above TNI . The experimental workis complemented with quadrupole splitting data derived from MC simulations.
II. SAMPLE PREPARATION AND EXPERIMENTAL METHOD
PDLC films used in this study consisted of dispersions of deuterated 4′-pentyl-4-cyanobiphenyl (5CB-αd2) andpolyvinyl alcohol PVA205 (molecular weight: 25000, degree of hydrolysis: 88%, Kuraray Co., Ltd.), which is awater-soluble polymer. A 20 wt.% aqueous solution of PVA was mixed with the liquid crystal and then dispersed inwater [30]. We used an ultrasonic processor (CPX-400, 400 W, 20 kHz, Cole-Parmer Instrument Co.) at 40% outputwith 1/8” microtip to emulsify the liquid crystal into the PVA aqueous solution. The emulsion was then coated ona smooth polyethylene terephthalate (PET) substrate using a Meyer Bar and processed under ambient conditions.After the water evaporated, the polymer film was carefully released (peeled) from the substrate. The film thicknesswas approximately (16±4) µm and the concentration of liquid crystal in the film was 25 wt.%. The film was stretchedto the desired strain (5%, 20%, 100%, and 400%), cut into strips 20 mm × 6 mm, stacked such that the thicknesswas more than 50 µm, and carefully inserted into a NMR tube.
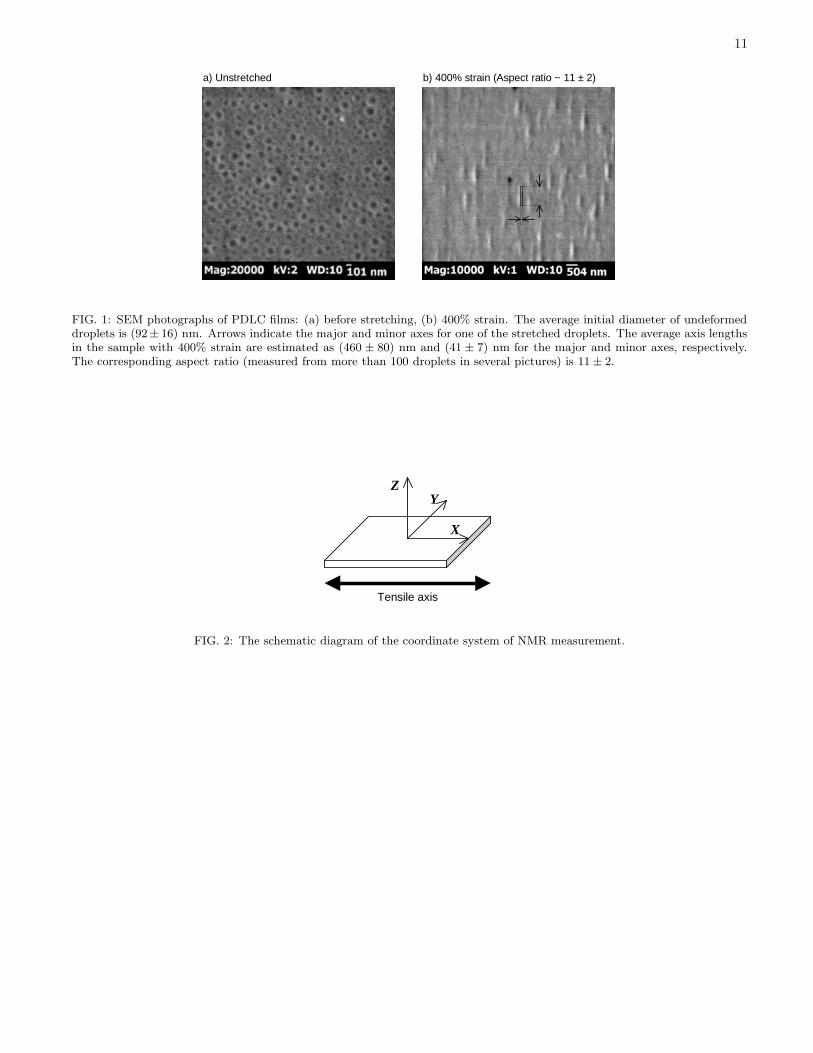
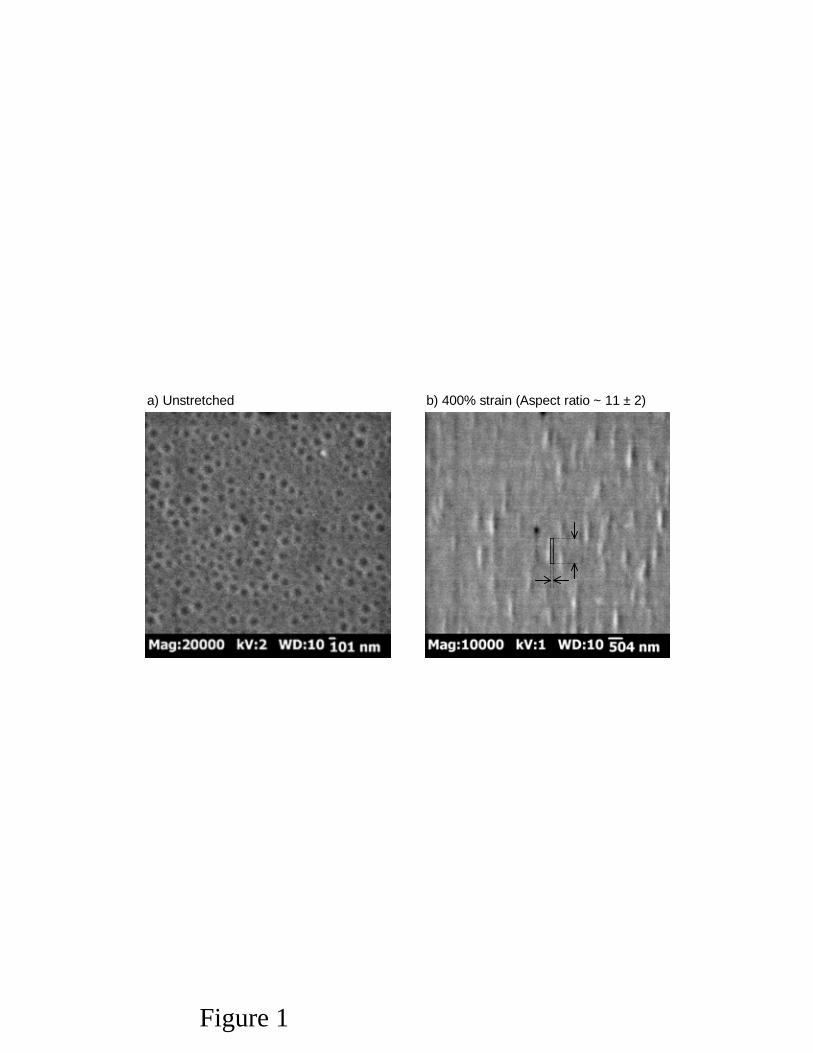
Fig. 1(a) shows scanning electron microscope (SEM) images of a PDLC film before stretching when droplets areapproximately spherical. After stretching, the droplets become elongated, with their major axes along the stretchdirection, as shown in Fig. 1(b) [31]. The stretching is accompanied by an alignment of the nematic director parallel tothe stretch direction within each droplet, which has been proven using optical polarization measurements [26, 28, 29].The average diameter in Fig. 1 was measured to be (92 ± 16) nm. Assuming that the liquid crystal droplet wasincompressible and its initial shape spherical, the minor semiaxis R0 after stretching is approximated by
R0 ∼ Rini(1 + ε)−1/2, (1)
where Rini is the initial radius [(46 ± 8) nm] and ε is the strain. Note that even at zero strain the droplet shapes arenot perfectly spherical, but are close to oblate spheroids with their minor axes perpendicular to the film plane [27].Then, assuming Poisson ratio to be isotropic [32], Eq. (1) is still valid when we define Rini as the initial length of oneof the principal axes. Fig. 1(b) shows the droplets after they have been subjected to 400% strain.
The stretched PDLC film was stacked in the NMR tube such that the stretched axis of the film was parallelto the magnetic field. The NMR experiments were performed on a solid-state spectrometer (AVANCETM 300/UltrashieldTM, 300 MHz, 89 mm, Bruker BioSpin GmbH) with a 7.05 T magnetic field. A modified quadrupolarecho sequence (π/2)x-τ -(π/2)y was employed, where τ = 100 ms and the length of the π/2 pulse was 10 µs. Thefree-induction-decay (FID) was averaged more than 10000 times to achieve a reasonable signal-to-noise ratio. Thetemperature in the sample probe was controlled to within ±0.1C.
3
III. NMR TECHNIQUE
Deuterium nuclei have been used frequently as a NMR probe in studies of molecular structure and dynamics inliquid crystals. 2H-NMR provides the orientational order at the molecular level via time-averaged quadrupole splittingfrequency from selectively deuterated liquid crystal molecules. In the absence of motional averaging, a deuteratedmolecule at position r within a droplet will yield a spectrum of two sharp lines separated by
δν(r) =δνB
SBS(r)
[
3
2cos2 θB(r) − 1
2
]
, (2)
where θB(r) is the angle between the local nematic director and the magnetic field, S(r) the local order parameter, andδνB/SB the ratio between the quadrupole splitting frequency and the order parameter of the bulk nematic. δνB/SB
for 5CB in the nematic phase is 87.5 kHz [10].Our work focuses on uniaxially stretched PDLCs using 5CB-αd2. In our case the magnetic coherence length,
ξm = B−1√
µ0K/∆χ, is ξm ∼ 1.1 µm [33] for reported values of ∆χ = 1.2 × 10⁻⁷, the anisotropy of the diamagneticsusceptibility, K = 6 × 10⁻¹² N, the elastic constant, and µ0 = 4π × 10−7 N/A2, permeability of free space. ξm
is significantly larger than our droplet radii R so that the field has no appreciable aligning effect. Further, thecharacteristic length of diffusion in a NMR measurement is d ∼
√
D/δν. Here D ∼ 10−10 m2/s is the diffusion constantand δν a characteristic frequency in the NMR spectrum. Then, in the nematic phase one has δν ∼ δνB = 52.1 kHz,yielding d ∼ 44 nm, while in the isotropic phase one obtains δν ∼ 500 Hz and d ∼ 450 nm. In our case, d R in theisotropic phase, therefore we can expect complete diffusional averaging.
IV. LIQUID CRYSTAL ALIGNMENT IN NEMATIC PHASE
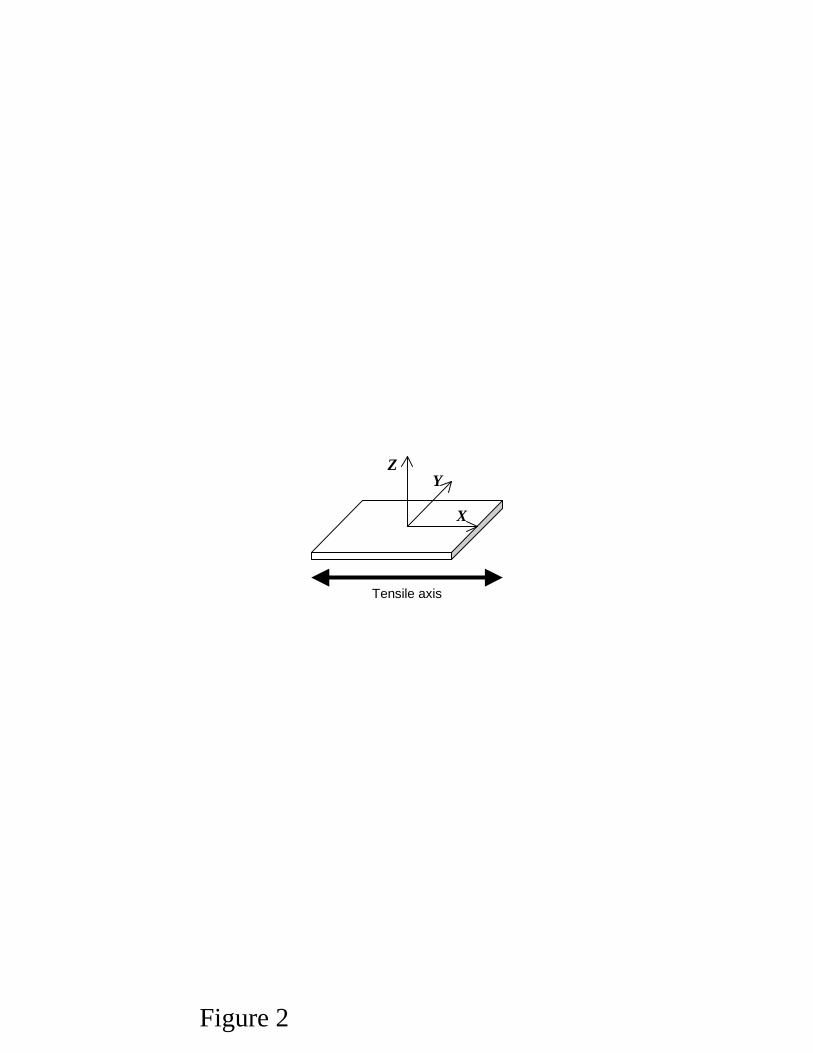
According to optical polarization measurements, liquid crystal molecules confined within stretched PDLC dropletson average align parallel to the stretch direction [26, 28, 29]. This alignment was observed via a change in birefringenceof the droplets, and was not directly measured. In order to directly investigate the liquid crystal alignment, we analyzedNMR spectra of stretched PDLC films in nematic phase. Fig. 2 illustrates the coordinate system of NMR samples.By orienting the sample in the NMR magnetic field parallel to X , Y and Z, we can independently measure the liquidcrystal director distribution with respect to these three axes. We measured NMR spectra in the nematic phase at298 K.
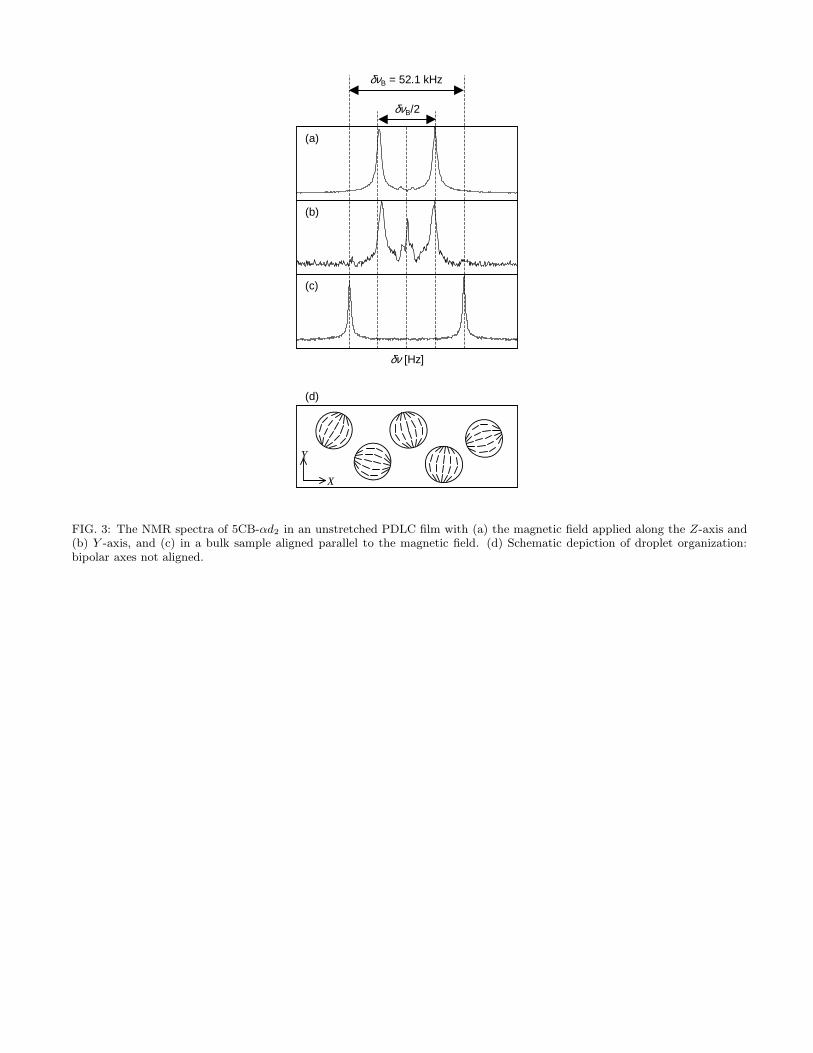
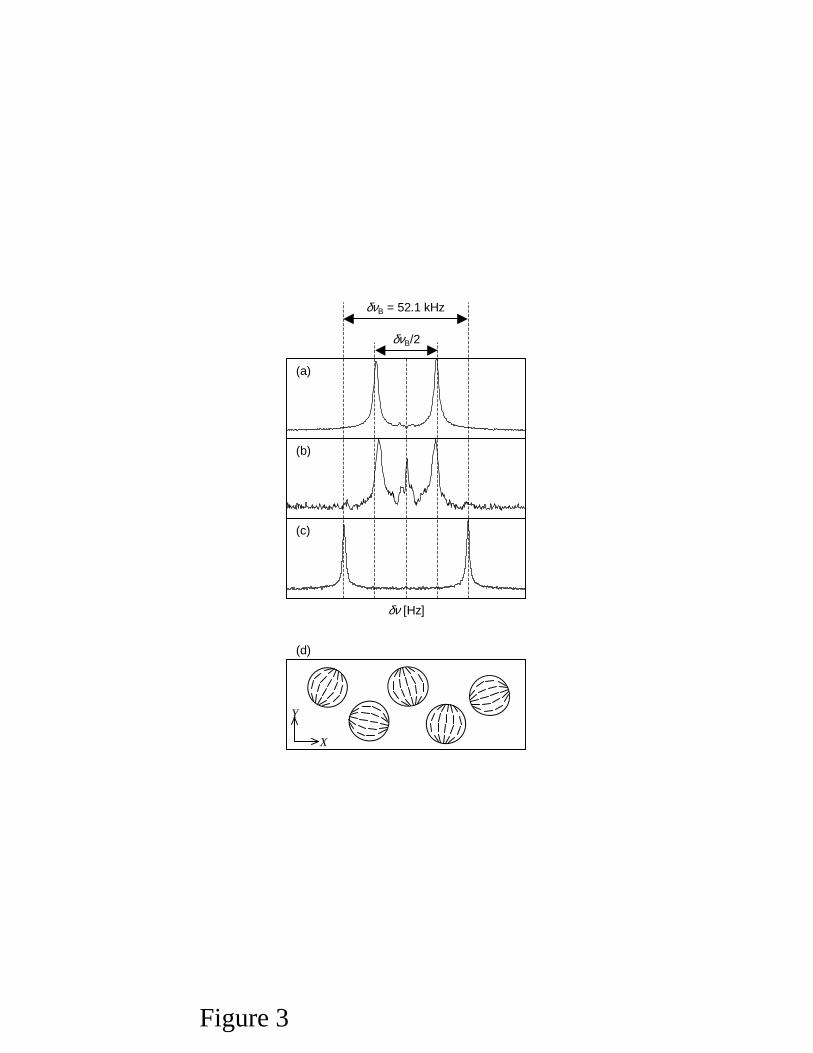
Fig. 3 shows NMR spectra of 5CB-αd2 in an unstretched PDLC film [Figs. 3(a) and (b)] and in the bulk [Fig. 3(c)],as well as a schematic depiction of liquid crystal alignment within droplets. Both NMR measurements where themagnetic field is in X and Y directions (Fig. 2) are equivalent for geometrical reasons. From Eq. (2), the quadrupolesplitting frequency at θB = 90 is one-half that of the bulk aligned splitting. The quadrupole splitting frequency inthe unstretched PDLC when the magnetic field is along Z-axis [Fig. 3(a)] is nearly one-half that of the bulk [Fig. 3(c)],which indicates that liquid crystal molecules align predominantly perpendicular to Z-axis in this composite. Moreover,Fig. 3(b) is similar to the NMR spectrum of a Pake-type powder spectrum which is obtained from a two-dimensionalrandom distribution of liquid crystal molecules [34]. These results indicate that ordering in droplets is bipolar andthat bipolar symmetry axes are randomly oriented in XY plane. This is in agreement with the fact that the PDLCfilm collapses along the Z-axis during the evaporating process, and then the droplet shape becomes an oblate spheroidwith the minor axis perpendicular to the film plane [27]. Such a film is schematically represented in Fig. 3(d). Thereason why the quadrupole line-splitting frequency is slightly smaller than the expected bulk values is attributed tothe curvature of the director field in the droplet [35].
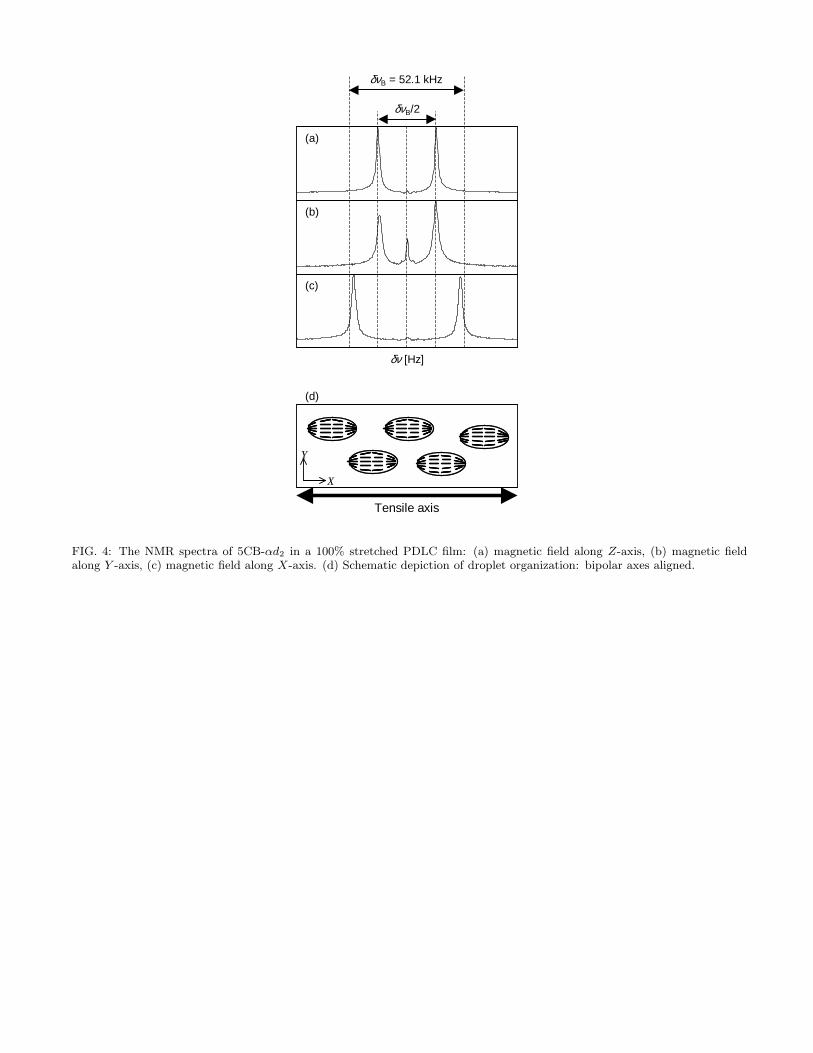
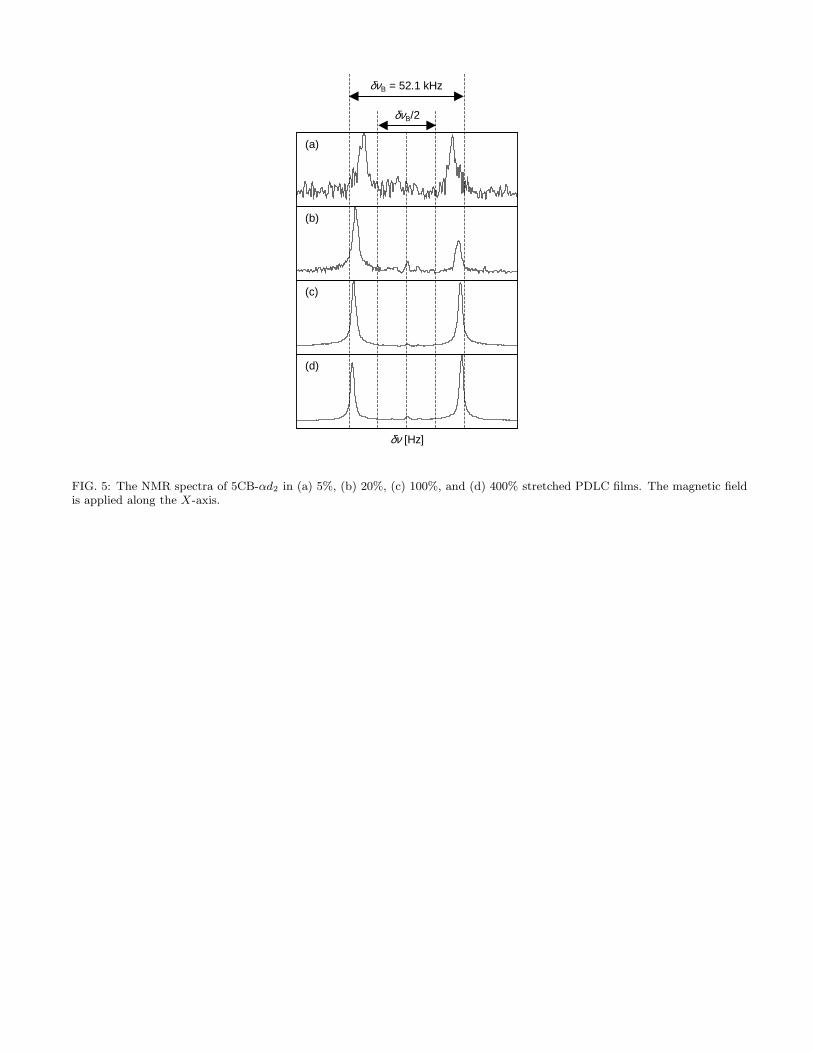
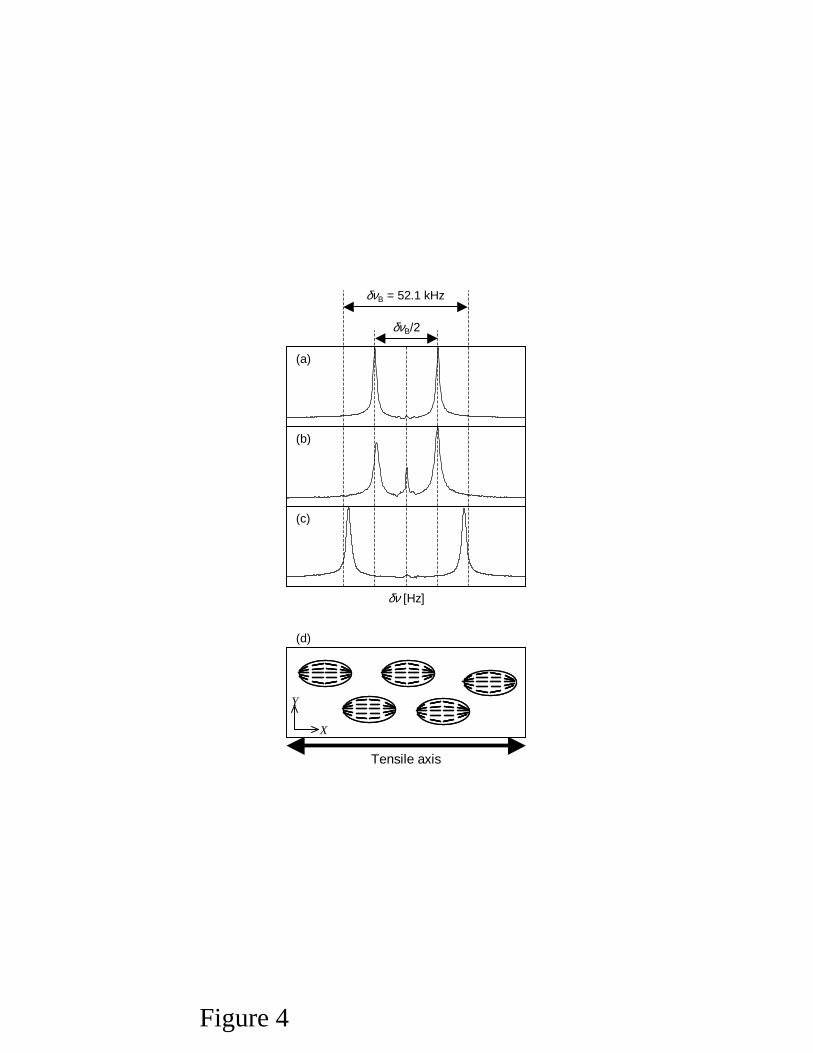
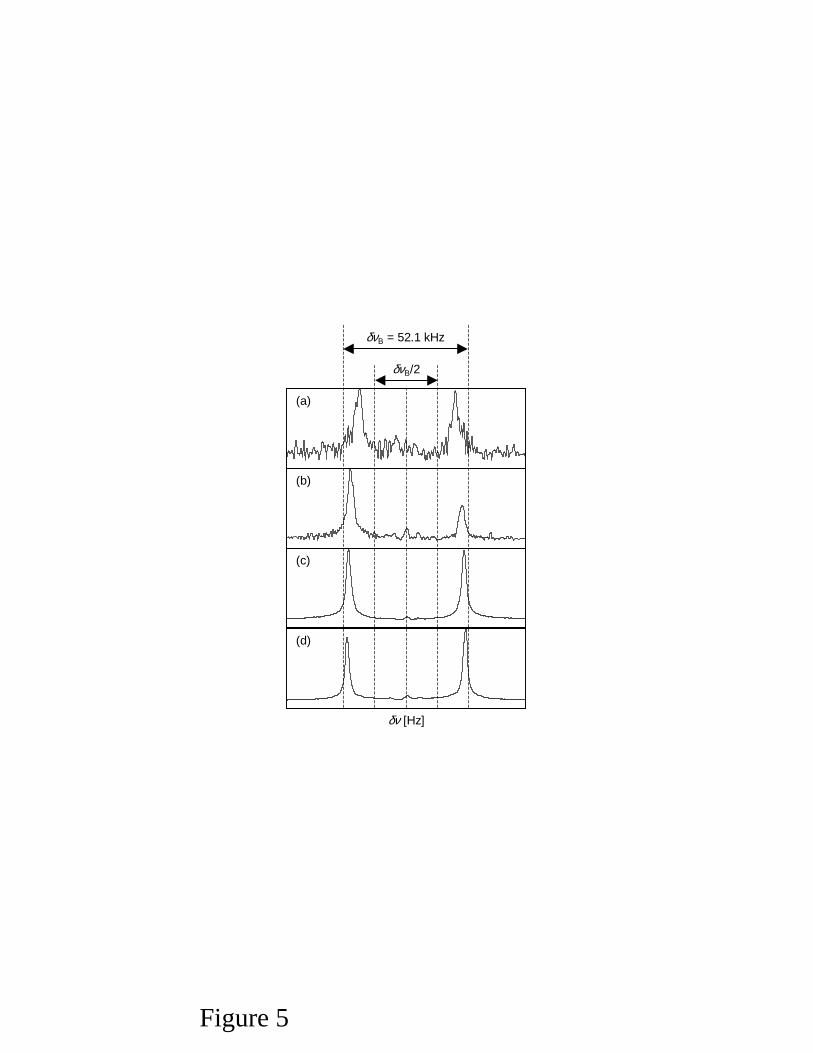
Fig. 4 shows the NMR spectra of 100% stretched PDLC film [Fig. 4(a), (b), and (c)] and the resulting liquid crystalalignment [Fig. 4(d)]. When the magnetic field is directed along the Y (or Z) axis, the quadrupole splitting frequencyapproaches one-half of the bulk value, while for the magnetic field along the X-axis the splitting is the almost thesame as that of the bulk. Consequently, liquid crystal molecules in PDLC are mostly aligned along the X-axis. Wehave also investigated 5%, 20%, 100%, and 400% stretched PDLC films and compared them to the aligned bulksample, as shown in Fig. 5. We found that liquid crystal molecules are aligned in all samples, even for the 5% sample.These highly aligned systems enable us to extend our NMR study also to the isotropic phase, since the sample canbe aligned such that the director is parallel to the magnetic field providing a maximum splitting.
V. SURFACE-INDUCED ORDER IN ISOTROPIC PHASE
Up to this part we have confirmed molecular alignment inside droplets in the nematic phase. This was essential toobtain reliable information on the effective aligning tendency of the polymer matrix that was shown to be of great
4
importance in stretched PDLC systems [26, 29]. In this Section we study stretched PDLC films in the isotropicphase and show how to detect changes in the local aligning power of the confining matrix that determines thedegree of surface-induced order. The same approach has already been successfully applied to nematics in cylindricalconfinement [10] and will be adapted here to elliptical geometry characterizing our PDLC systems. Note that bothversions of the approach share the underlying basic physical phenomena.
First consider a one-dimensional case where the x-axis represents the normal of a confining wall located at x = 0. Inthe isotropic phase the degree of nematic order decays when moving away from the wall. This can be formally describedby the Landau-de Gennes formalism for the nematic-isotropic transition giving a phenomenological expression for thefree energy density f [36, 37]. In such a case f can be expanded in terms of a single order parameter, S(x), and isexpressed as
f = f0 + f1[S(x)] +L
2[∇S(x)]2 + g[S(x) − Ss]
2δ(x), (3)
where Ss is the surface-imposed degree of order, while g > 0 and L > 0 are phenomenological constants. Moreover,f0 is the S-independent part of the free energy density and f1[S(x)] is given by
f1[S(x)] =a
2(T − T ∗)S2(x) − B
3S3(x) +
C
4S4(x). (4)
Here T denotes temperature, T ∗ the limit of supercooling, and a > 0, B > 0, and C > 0 are phenomenologicalconstants. The final term in Eq. (3) is the surface contribution where g reflects the magnitude of the liquid crystal-solid substrate interaction [3]. The total free energy is obtained by integrating Eq. (3) over the volume of the cavity
F =
∫
V
(
f0 + f1[S(x)] +L
2[∇S(x)]2
)
dV +1
2gA(S0 − Ss)
2. (5)
Here S0 is the actual order parameter at the surface and A the surface area.Assuming the degree of surface-induced order in the isotropic phase to be low, in Eq. (4) higher-order terms S3(x)
and S4(x) can be neglected. Minimizing the total free energy, the order parameter as a function of x exhibits anexponential decay
S(x) = S0e−x/ξ, (6)
with ξ standing for the correlation length associated with nematic ordering. It is given by
ξ = ξ0
√
T ∗
T − T ∗, (7)
where ξ0 ∼ 0.65 nm [38], and ξ diverges at T ∗ [36]. For 5CB, TNI − T ∗ = 2B2/9aC ∼ 1.1 K.The actual degree of nematic order at the surface, S0, can in principle exhibit a temperature dependence. Calculating
the total free energy in a semi-infinite sample and minimizing it with respect to S0 gives
S0 =Ss
1 +√
a(T − T ∗)L/2g. (8)
For 2g √
a(T − T ∗)L (e.g., close to the nematic-isotropic transition) S0 approaches Ss and is essentially
temperature-independent. On the contrary, if 2g √
a(T − T ∗)L, one has [10]
S0 ≈ S00
2√
T/T ∗ − 1, (9)
where S00 = 4gSs/√
aT ∗L has been introduced. The two limits will be referred to as the “temperature-independentmodel” and the “temperature-dependent model” in this paper.
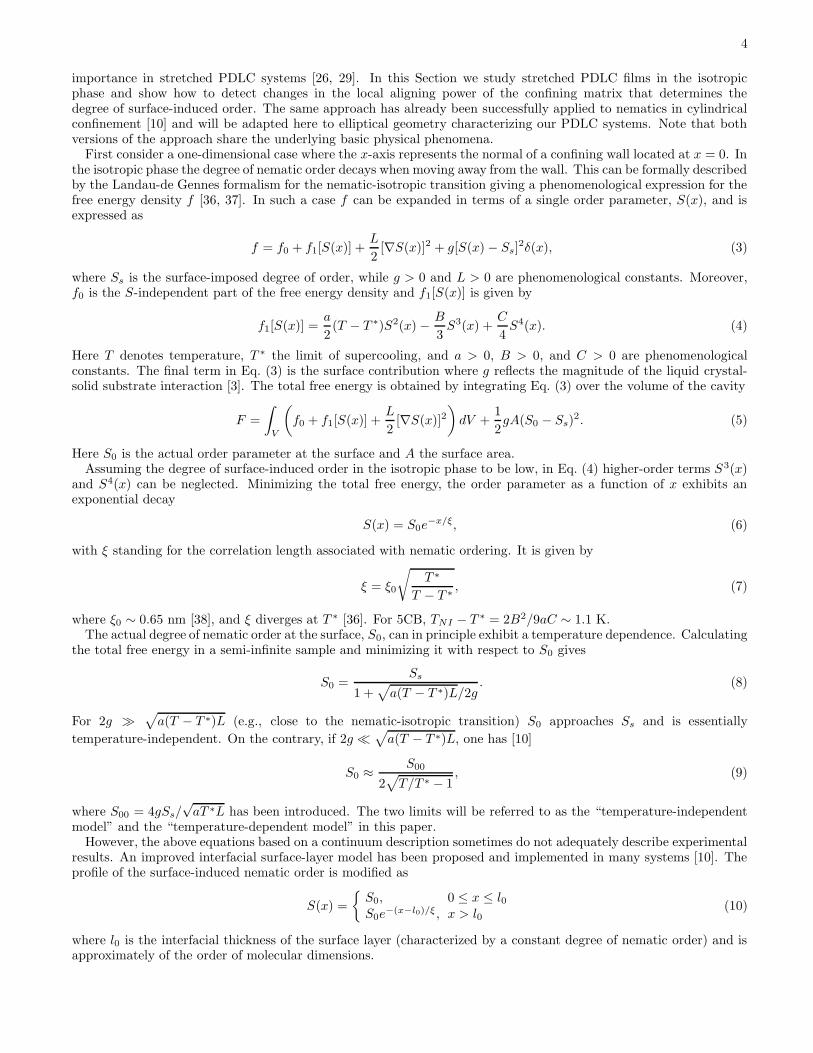
However, the above equations based on a continuum description sometimes do not adequately describe experimentalresults. An improved interfacial surface-layer model has been proposed and implemented in many systems [10]. Theprofile of the surface-induced nematic order is modified as
S(x) =
S0, 0 ≤ x ≤ l0S0e
−(x−l0)/ξ , x > l0(10)
where l0 is the interfacial thickness of the surface layer (characterized by a constant degree of nematic order) and isapproximately of the order of molecular dimensions.
5
A. Ellipsoidal droplet
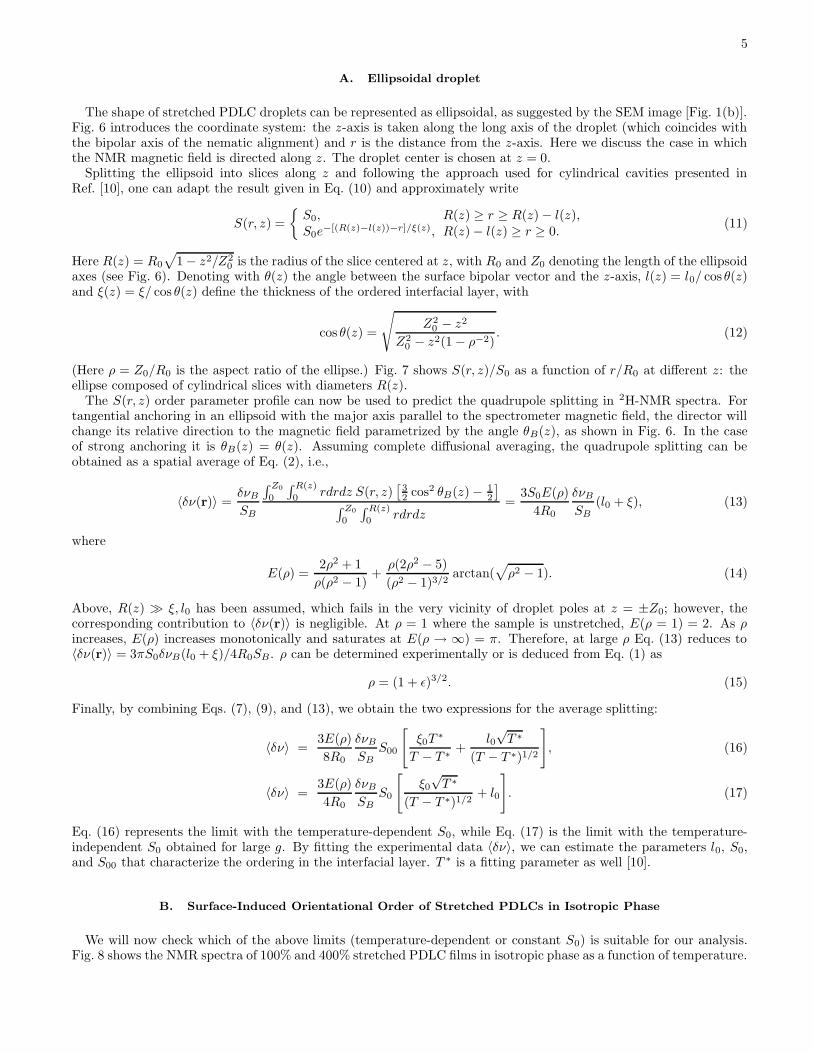
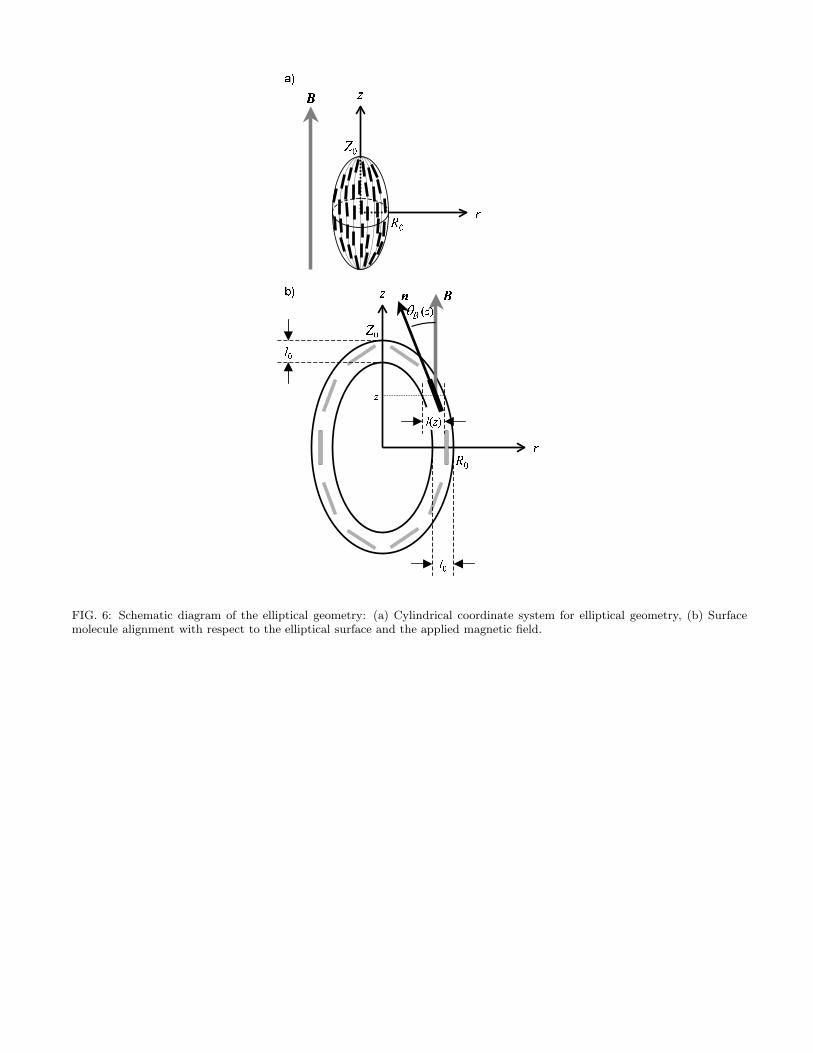
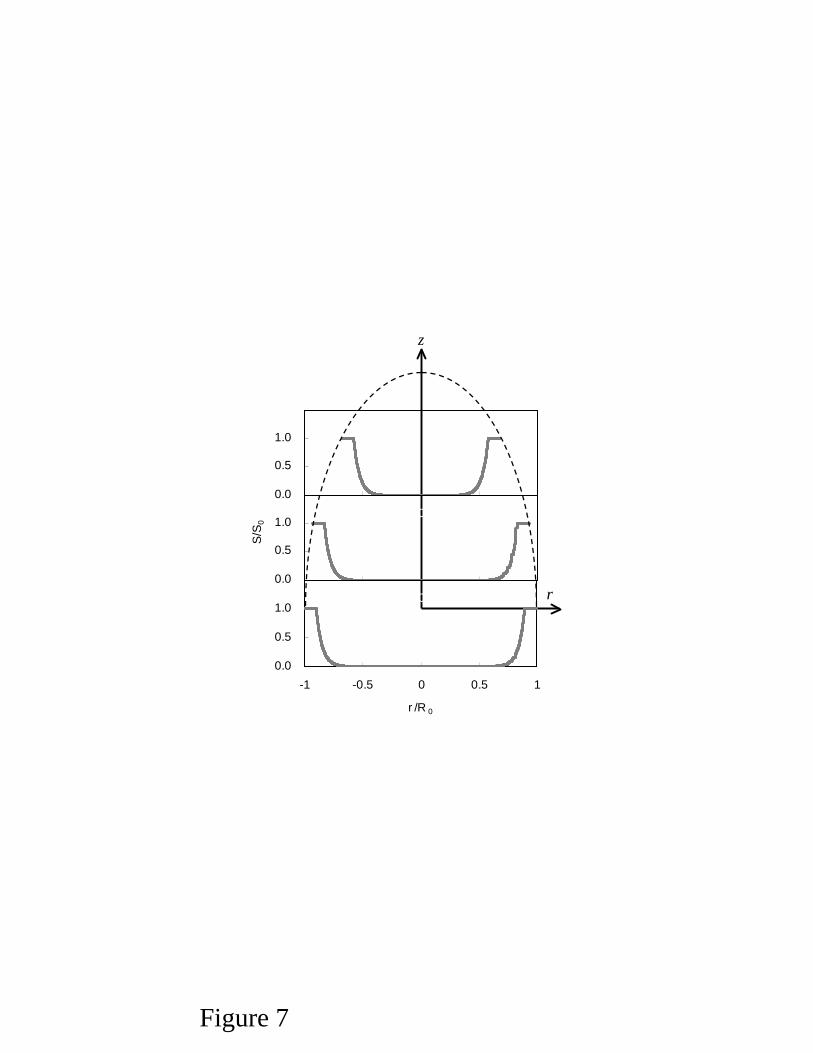
The shape of stretched PDLC droplets can be represented as ellipsoidal, as suggested by the SEM image [Fig. 1(b)].Fig. 6 introduces the coordinate system: the z-axis is taken along the long axis of the droplet (which coincides withthe bipolar axis of the nematic alignment) and r is the distance from the z-axis. Here we discuss the case in whichthe NMR magnetic field is directed along z. The droplet center is chosen at z = 0.
Splitting the ellipsoid into slices along z and following the approach used for cylindrical cavities presented inRef. [10], one can adapt the result given in Eq. (10) and approximately write
S(r, z) =
S0, R(z) ≥ r ≥ R(z) − l(z),S0e
−[(R(z)−l(z))−r]/ξ(z), R(z) − l(z) ≥ r ≥ 0.(11)
Here R(z) = R0
√
1 − z2/Z20 is the radius of the slice centered at z, with R0 and Z0 denoting the length of the ellipsoid
axes (see Fig. 6). Denoting with θ(z) the angle between the surface bipolar vector and the z-axis, l(z) = l0/ cos θ(z)and ξ(z) = ξ/ cos θ(z) define the thickness of the ordered interfacial layer, with
cos θ(z) =
√
Z20 − z2
Z20 − z2(1 − ρ−2)
. (12)
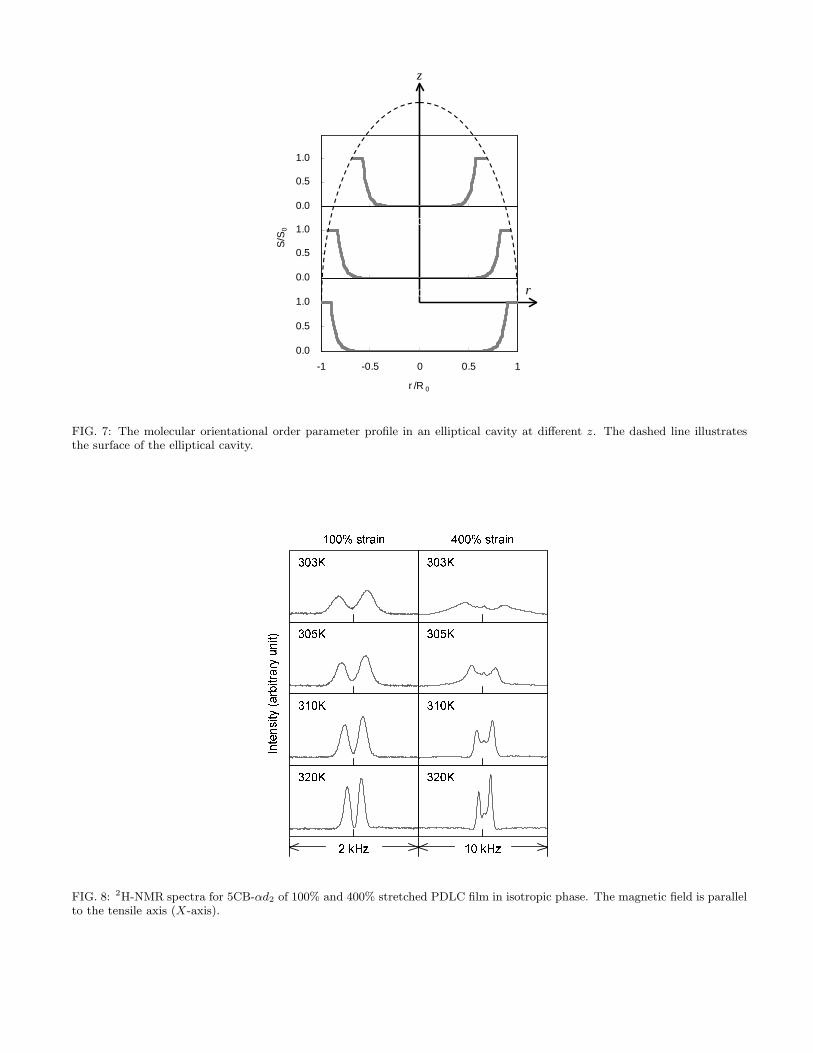
(Here ρ = Z0/R0 is the aspect ratio of the ellipse.) Fig. 7 shows S(r, z)/S0 as a function of r/R0 at different z: theellipse composed of cylindrical slices with diameters R(z).
The S(r, z) order parameter profile can now be used to predict the quadrupole splitting in 2H-NMR spectra. Fortangential anchoring in an ellipsoid with the major axis parallel to the spectrometer magnetic field, the director willchange its relative direction to the magnetic field parametrized by the angle θB(z), as shown in Fig. 6. In the caseof strong anchoring it is θB(z) = θ(z). Assuming complete diffusional averaging, the quadrupole splitting can beobtained as a spatial average of Eq. (2), i.e.,
〈δν(r)〉 =δνB
SB
∫ Z0
0
∫ R(z)
0 rdrdz S(r, z)[
32 cos2 θB(z) − 1
2
]
∫ Z0
0
∫ R(z)
0rdrdz
=3S0E(ρ)
4R0
δνB
SB(l0 + ξ), (13)
where
E(ρ) =2ρ2 + 1
ρ(ρ2 − 1)+
ρ(2ρ2 − 5)
(ρ2 − 1)3/2arctan(
√
ρ2 − 1). (14)
Above, R(z) ξ, l0 has been assumed, which fails in the very vicinity of droplet poles at z = ±Z0; however, thecorresponding contribution to 〈δν(r)〉 is negligible. At ρ = 1 where the sample is unstretched, E(ρ = 1) = 2. As ρincreases, E(ρ) increases monotonically and saturates at E(ρ → ∞) = π. Therefore, at large ρ Eq. (13) reduces to〈δν(r)〉 = 3πS0δνB(l0 + ξ)/4R0SB . ρ can be determined experimentally or is deduced from Eq. (1) as
ρ = (1 + ε)3/2. (15)
Finally, by combining Eqs. (7), (9), and (13), we obtain the two expressions for the average splitting:
〈δν〉 =3E(ρ)
8R0
δνB
SBS00
[
ξ0T∗
T − T ∗+
l0√
T ∗
(T − T ∗)1/2
]
, (16)
〈δν〉 =3E(ρ)
4R0
δνB
SBS0
[
ξ0
√T ∗
(T − T ∗)1/2+ l0
]
. (17)
Eq. (16) represents the limit with the temperature-dependent S0, while Eq. (17) is the limit with the temperature-independent S0 obtained for large g. By fitting the experimental data 〈δν〉, we can estimate the parameters l0, S0,and S00 that characterize the ordering in the interfacial layer. T ∗ is a fitting parameter as well [10].
B. Surface-Induced Orientational Order of Stretched PDLCs in Isotropic Phase
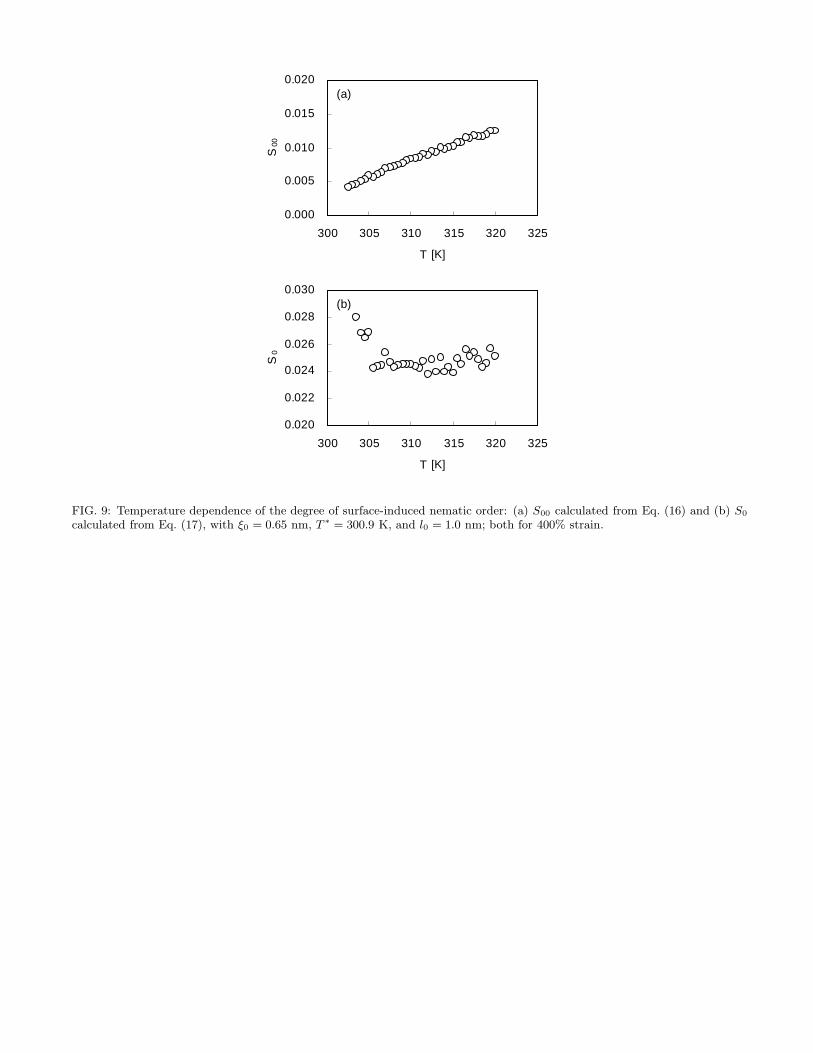
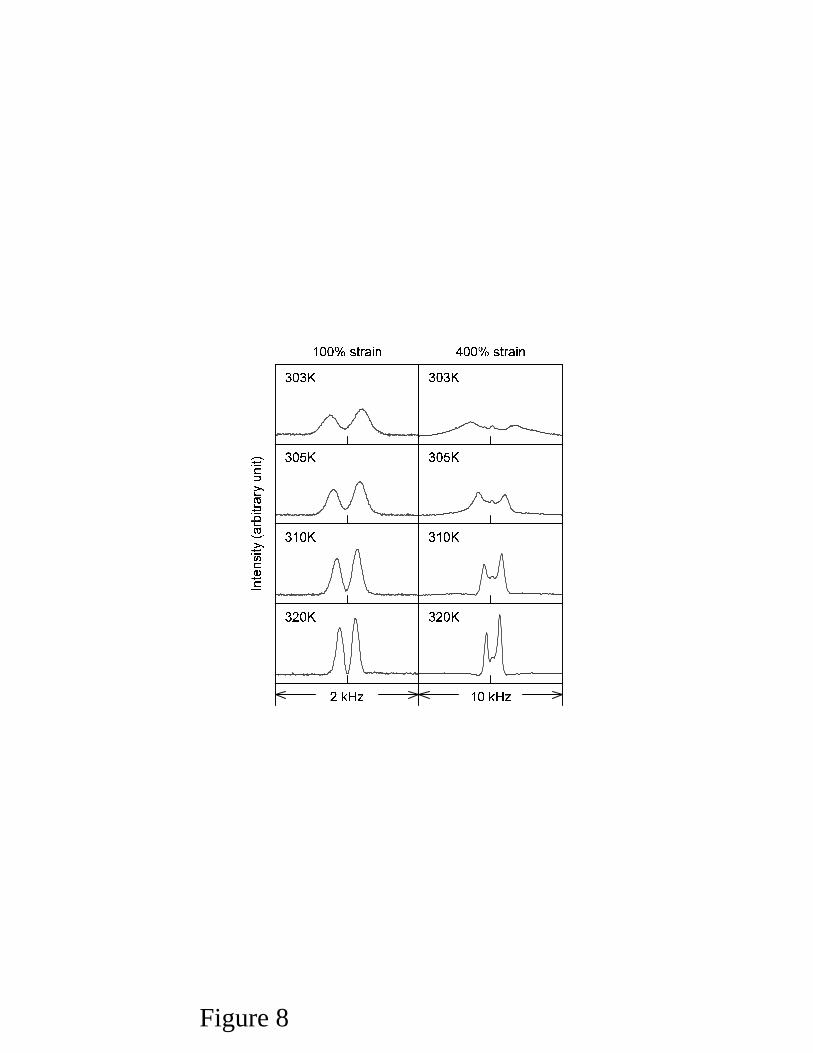
We will now check which of the above limits (temperature-dependent or constant S0) is suitable for our analysis.Fig. 8 shows the NMR spectra of 100% and 400% stretched PDLC films in isotropic phase as a function of temperature.
6
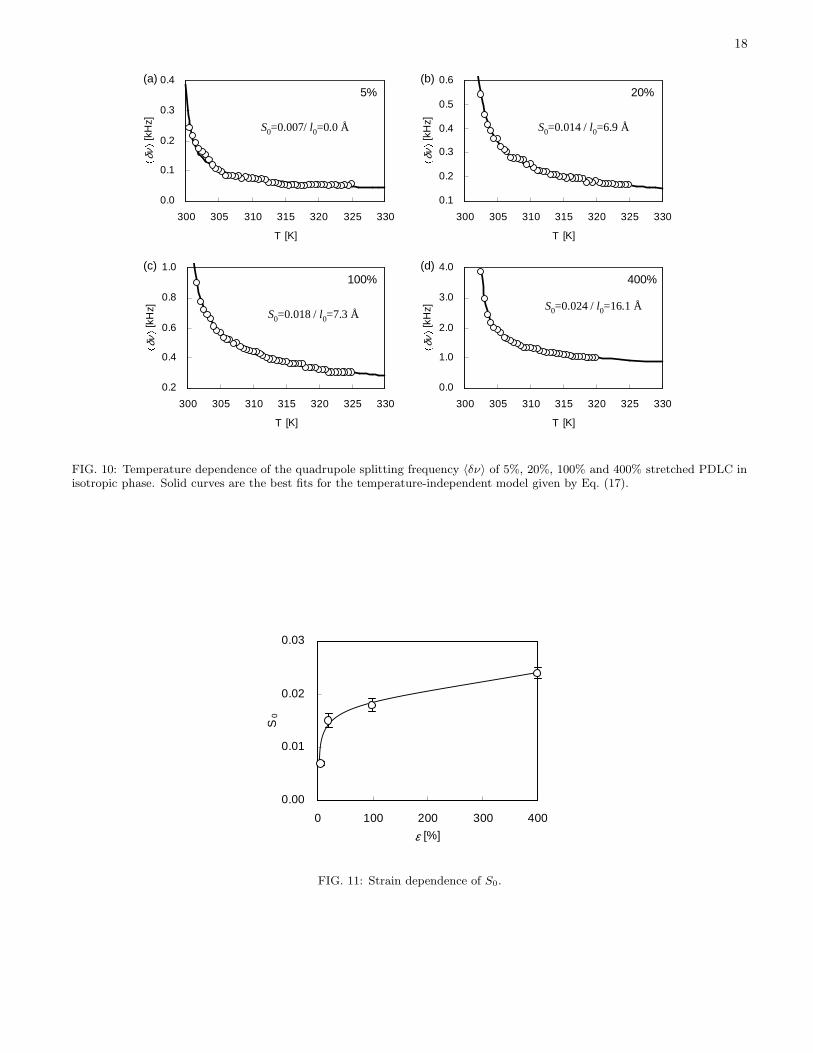
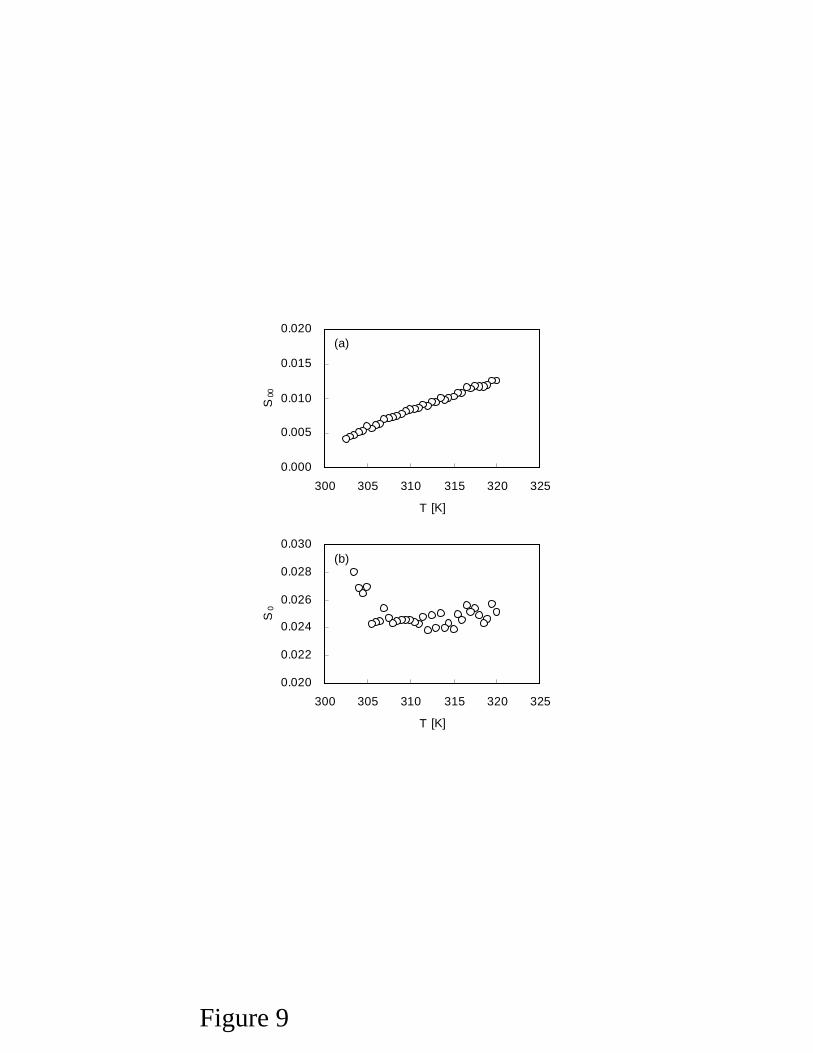
The quadrupolar line-splitting decreases as temperature increases in all samples. In terms of strain, the quadrupoleline-splitting increases as strain increases. From Eq. (15), a 400% stretched sample gives ρ ∼ 11, which is largeenough to put E(ρ) = π. Fig. 9 shows the temperature dependence of S00 calculated from Eq. (16), as well as S0
calculated from Eq. (17), where ξ0 = 0.65 nm, l0 = 1.0 nm, and T ∗ = 300.9 K (obtained from bulk TNI = 302 K)to roughly estimate the temperature dependence of S00 and S0 [10]. According to the assumption, both S00 and S0
should be constant, but S00 increases with temperature. Since this result indicates that the temperature-dependentmodel is not valid for the stretched PDLC, we employed the temperature-independent model to analyze the surfaceorder parameter in our particular system.
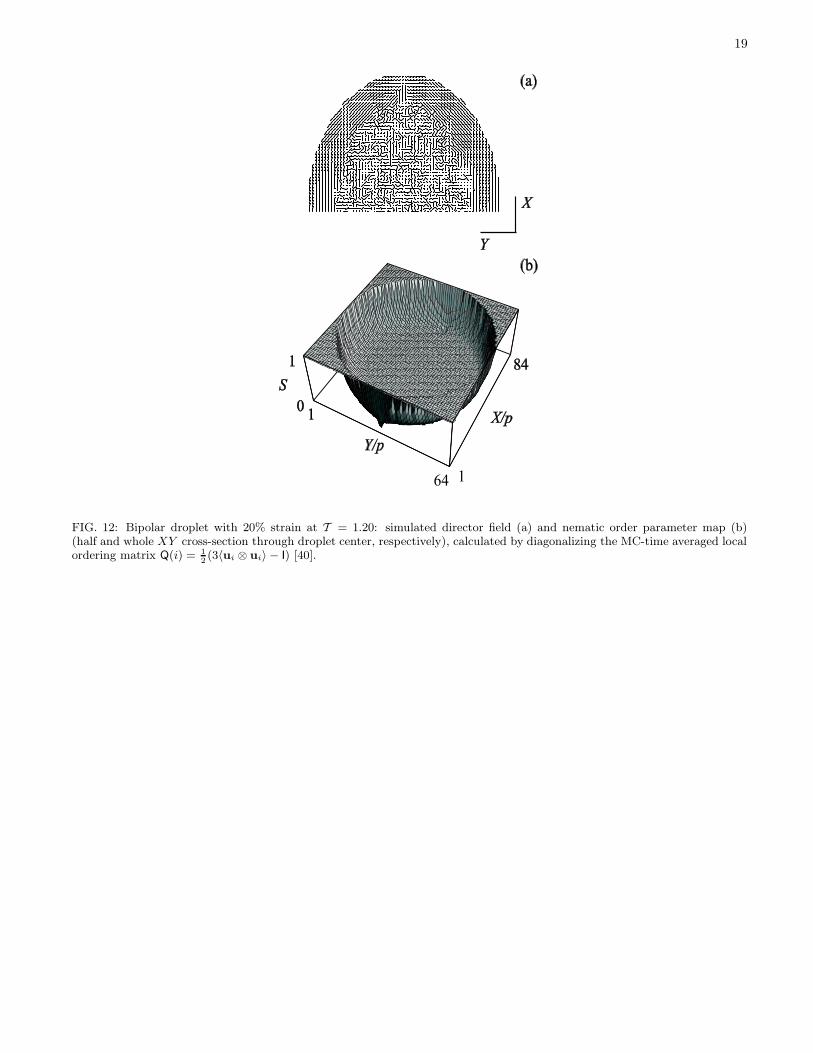
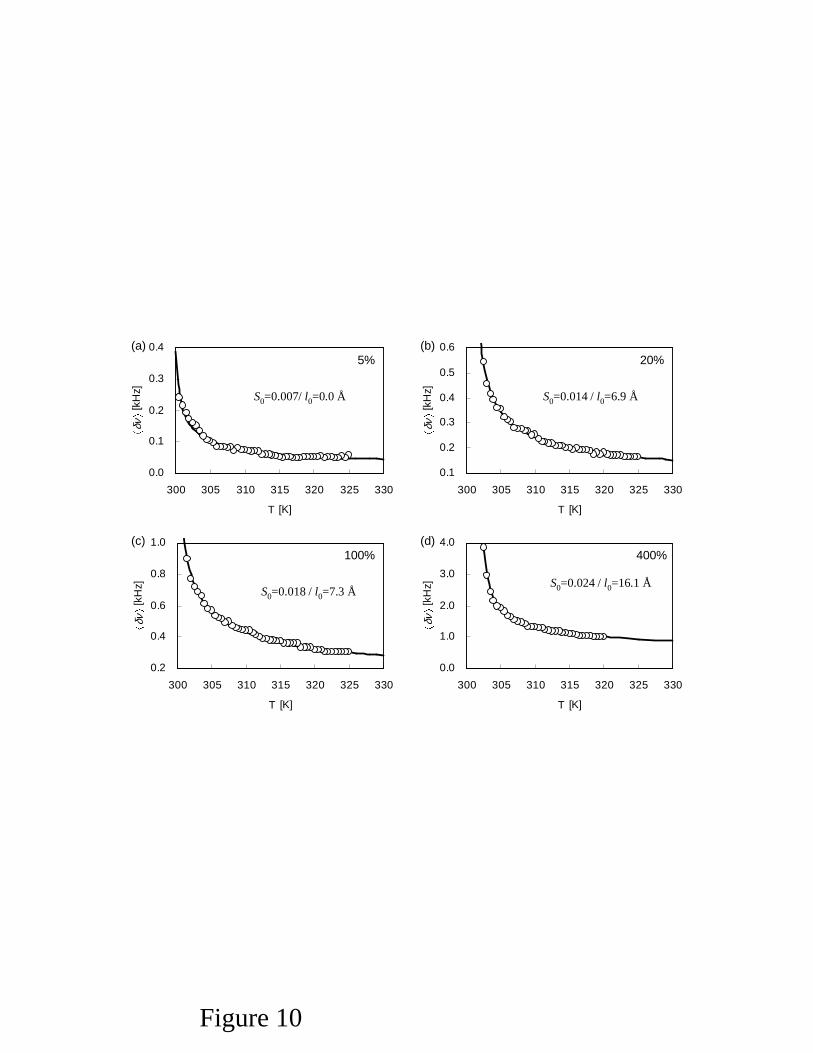
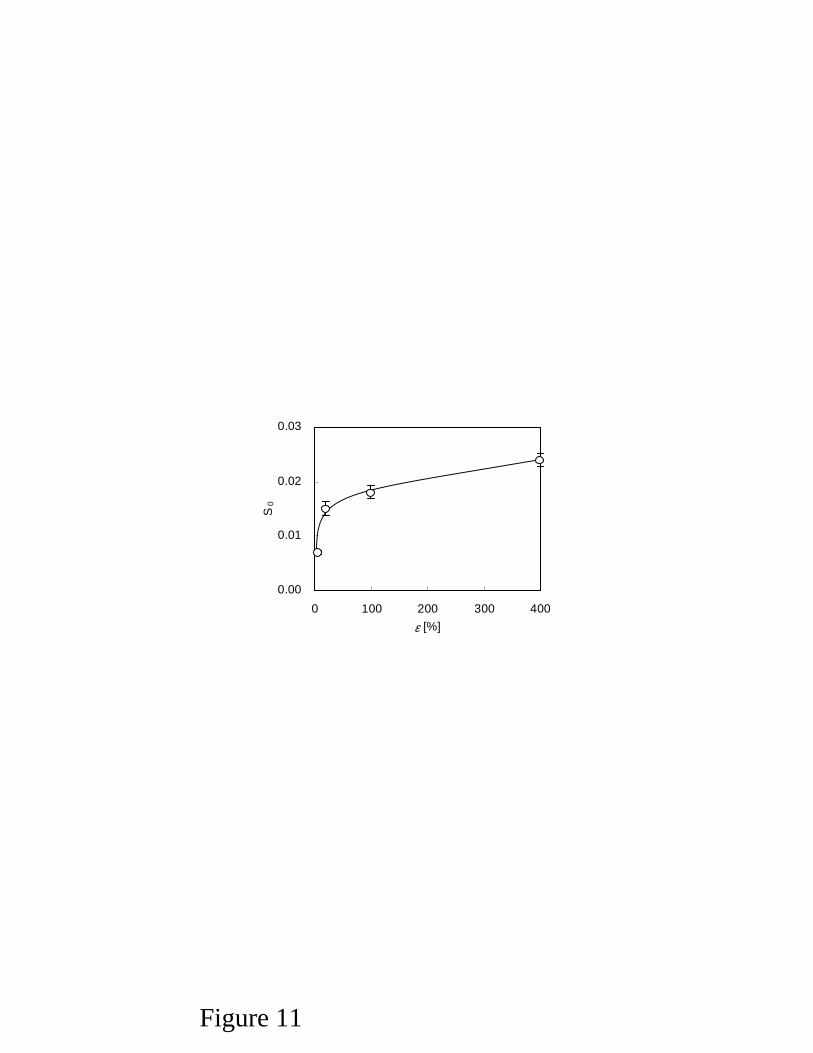
Fig. 10 shows the temperature dependence of the quadrupole splitting frequency for 5CB-αd2 in 5%, 20%, 100%,and 400% stretched PDLC films. The solid line in Fig. 10 is the best fit result for Eq. (17), and values of S0 and l0calculated from the best fit are shown as well. ρ is obtained from Eq. (15) and then E(ρ) is calculated from Eq. (14).R0 is estimated from Eq. (1) with Rini = 46 nm based on our SEM observation. ξ0 used is 0.65 nm. The resultingvalues of S0 = 0.007 − 0.024 are close to the reported value of S0 = 0.021 for 5CB in Anopore membranes withuntreated surface, and the value of l0 = (0.00 − 1.61) nm is also close to the reported value of l0 = (1.04 − 1.93) nmfor 5CB in Anopore membranes with various surface treatments [10]. Fig. 11 shows the strain dependence of S0.S0 increases quickly from 0% to 50% strain and then saturates during stretching. This behavior suggests that thealignment of liquid crystal molecules within droplets confined in PVA polymer matrix is influenced by polymer chainalignment induced by uniaxial stretching [29]. According to the optomechanical analysis of the PDLC film, the elasticregion where polymer chains have not disentangled appears between 0% and 7% strain, the disentanglement regionwhere polymer chains are disentangling appears from 7% to 35% strain, and the sliding regime where polymer chainsare fully disentangled appears above 35% strain. NMR results indicate that the polymer chain orientation doesinfluence liquid crystal molecules on the polymer surface.
From the validity condition for the temperature-independent model one can estimate the two parameters thatcharacterize the nematic coupling with the polymer substrate, g and Ss. For the coupling strength g one can derivethe lower limit, i.e., g 1
2
√
a(T − T ∗)L >∼ 12
√
a(TNI − T ∗)L, while for the surface-imposed degree of order Ss
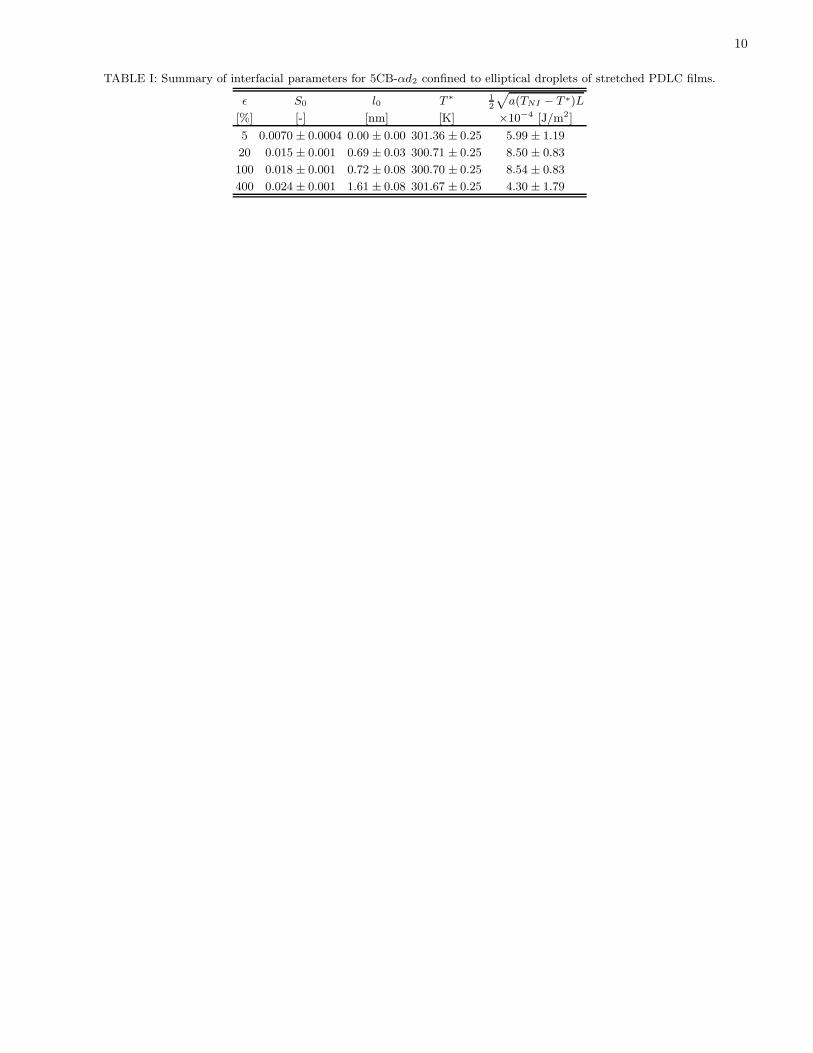
one has Ss ≈ S0. S0, l0, T ∗, and the limiting g are summarized in Table I, assuming TNI = 302 K (bulk value),
L = 1.7×10⁻¹¹ J/m, and a = 0.1319×10⁶ J/m3K [38]. The fact that the fitted T ∗ values vary from sample to sample
is believed to largely originate in the presence of impurities left over from the polymerization process. This and othereffects (especially confinement) result in a suppression of the NI transition in comparison with a bulk system [27].
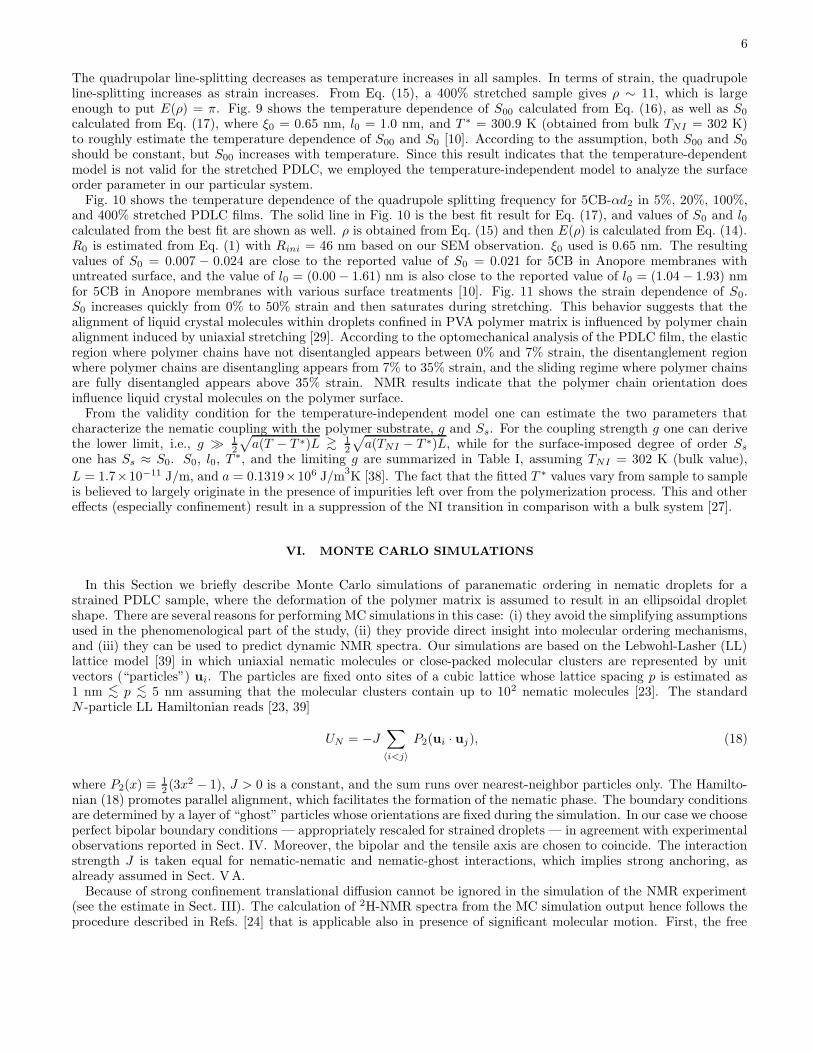
VI. MONTE CARLO SIMULATIONS
In this Section we briefly describe Monte Carlo simulations of paranematic ordering in nematic droplets for astrained PDLC sample, where the deformation of the polymer matrix is assumed to result in an ellipsoidal dropletshape. There are several reasons for performing MC simulations in this case: (i) they avoid the simplifying assumptionsused in the phenomenological part of the study, (ii) they provide direct insight into molecular ordering mechanisms,and (iii) they can be used to predict dynamic NMR spectra. Our simulations are based on the Lebwohl-Lasher (LL)lattice model [39] in which uniaxial nematic molecules or close-packed molecular clusters are represented by unitvectors (“particles”) ui. The particles are fixed onto sites of a cubic lattice whose lattice spacing p is estimated as1 nm <∼ p <∼ 5 nm assuming that the molecular clusters contain up to 102 nematic molecules [23]. The standardN -particle LL Hamiltonian reads [23, 39]
UN = −J∑
〈i<j〉
P2(ui · uj), (18)
where P2(x) ≡ 12 (3x2 − 1), J > 0 is a constant, and the sum runs over nearest-neighbor particles only. The Hamilto-
nian (18) promotes parallel alignment, which facilitates the formation of the nematic phase. The boundary conditionsare determined by a layer of “ghost” particles whose orientations are fixed during the simulation. In our case we chooseperfect bipolar boundary conditions — appropriately rescaled for strained droplets — in agreement with experimentalobservations reported in Sect. IV. Moreover, the bipolar and the tensile axis are chosen to coincide. The interactionstrength J is taken equal for nematic-nematic and nematic-ghost interactions, which implies strong anchoring, asalready assumed in Sect. V A.
Because of strong confinement translational diffusion cannot be ignored in the simulation of the NMR experiment(see the estimate in Sect. III). The calculation of 2H-NMR spectra from the MC simulation output hence follows theprocedure described in Refs. [24] that is applicable also in presence of significant molecular motion. First, the free
7
induction decay (FID) signal is generated in a reference frame rotating with Larmor frequency, i.e.,
G(t) =⟨
exp[
i
∫ t
0
ΩjQ(t′) dt′
]
⟩
j, (19)
and is then Fourier-transformed to yield the spectrum I(δν) =∫
exp(i 2πδνt)G(t)dt. In Eq. (19) one has ΩjQ(t) =
±πδνBS−1B
[
3(uj · b)2 − 1]
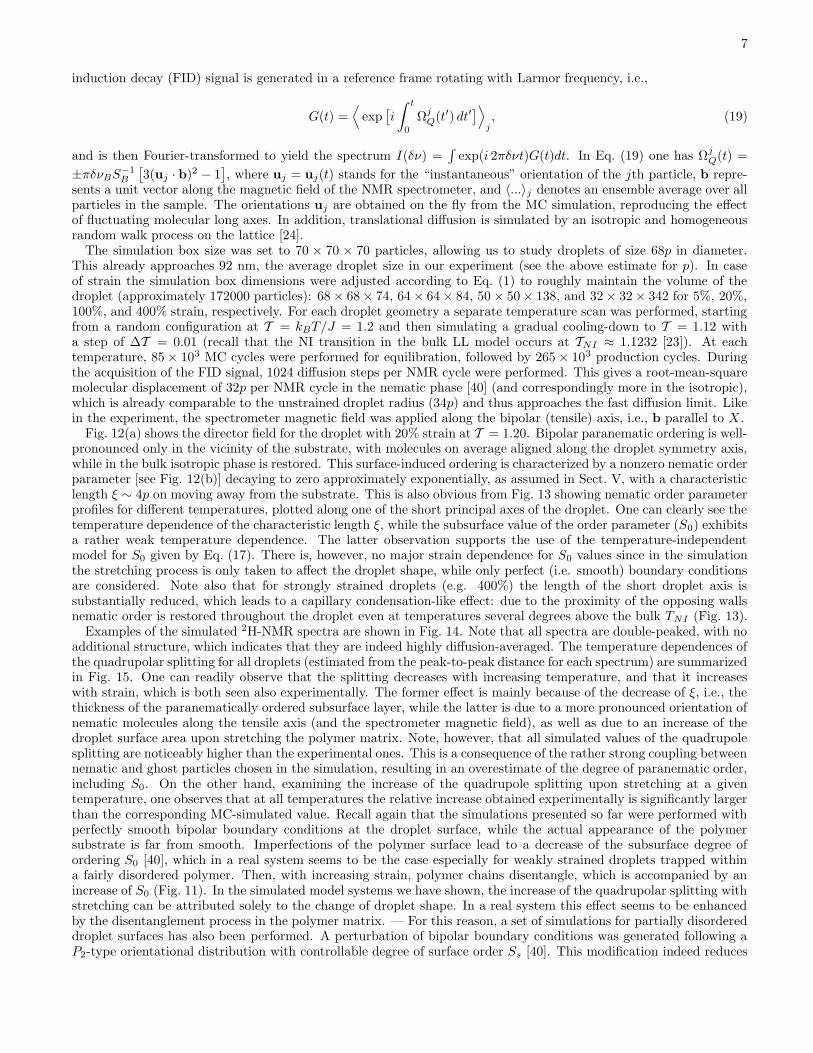
, where uj = uj(t) stands for the “instantaneous” orientation of the jth particle, b repre-sents a unit vector along the magnetic field of the NMR spectrometer, and 〈...〉j denotes an ensemble average over allparticles in the sample. The orientations uj are obtained on the fly from the MC simulation, reproducing the effectof fluctuating molecular long axes. In addition, translational diffusion is simulated by an isotropic and homogeneousrandom walk process on the lattice [24].
The simulation box size was set to 70 × 70 × 70 particles, allowing us to study droplets of size 68p in diameter.This already approaches 92 nm, the average droplet size in our experiment (see the above estimate for p). In caseof strain the simulation box dimensions were adjusted according to Eq. (1) to roughly maintain the volume of thedroplet (approximately 172000 particles): 68 × 68 × 74, 64 × 64 × 84, 50 × 50 × 138, and 32 × 32 × 342 for 5%, 20%,100%, and 400% strain, respectively. For each droplet geometry a separate temperature scan was performed, startingfrom a random configuration at T = kBT/J = 1.2 and then simulating a gradual cooling-down to T = 1.12 witha step of ∆T = 0.01 (recall that the NI transition in the bulk LL model occurs at TNI ≈ 1.1232 [23]). At eachtemperature, 85 × 103 MC cycles were performed for equilibration, followed by 265 × 103 production cycles. Duringthe acquisition of the FID signal, 1024 diffusion steps per NMR cycle were performed. This gives a root-mean-squaremolecular displacement of 32p per NMR cycle in the nematic phase [40] (and correspondingly more in the isotropic),which is already comparable to the unstrained droplet radius (34p) and thus approaches the fast diffusion limit. Likein the experiment, the spectrometer magnetic field was applied along the bipolar (tensile) axis, i.e., b parallel to X .
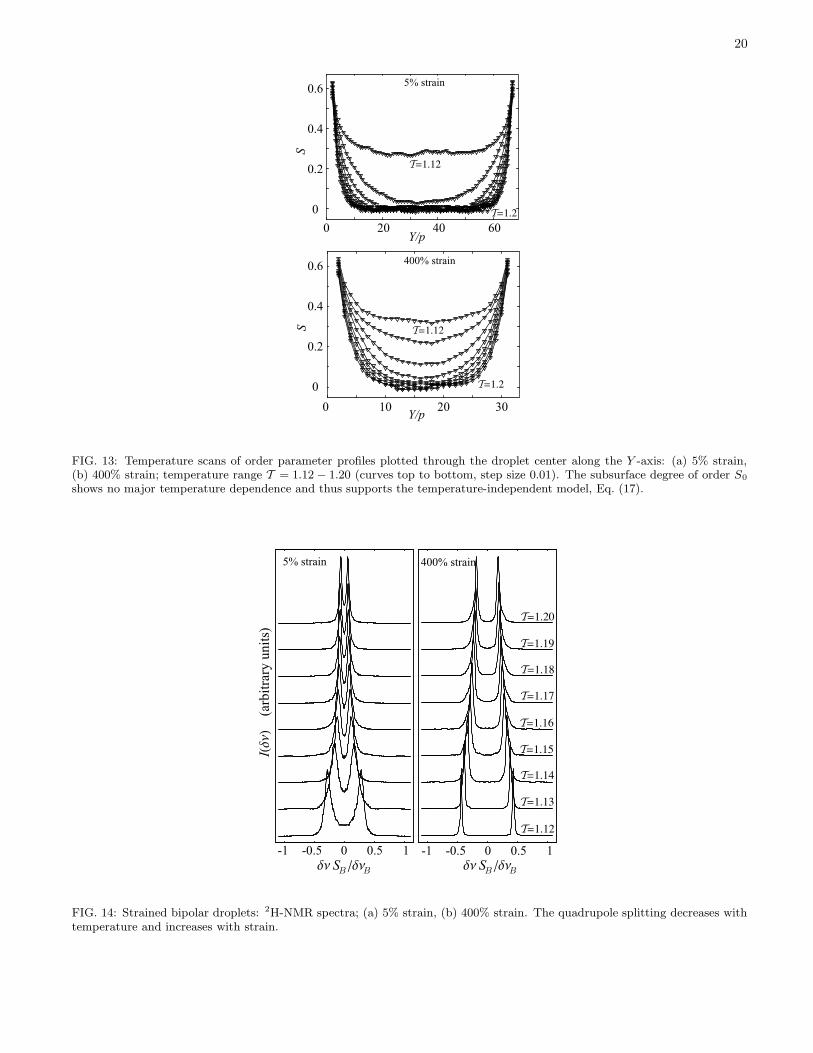
Fig. 12(a) shows the director field for the droplet with 20% strain at T = 1.20. Bipolar paranematic ordering is well-pronounced only in the vicinity of the substrate, with molecules on average aligned along the droplet symmetry axis,while in the bulk isotropic phase is restored. This surface-induced ordering is characterized by a nonzero nematic orderparameter [see Fig. 12(b)] decaying to zero approximately exponentially, as assumed in Sect. V, with a characteristiclength ξ ∼ 4p on moving away from the substrate. This is also obvious from Fig. 13 showing nematic order parameterprofiles for different temperatures, plotted along one of the short principal axes of the droplet. One can clearly see thetemperature dependence of the characteristic length ξ, while the subsurface value of the order parameter (S0) exhibitsa rather weak temperature dependence. The latter observation supports the use of the temperature-independentmodel for S0 given by Eq. (17). There is, however, no major strain dependence for S0 values since in the simulationthe stretching process is only taken to affect the droplet shape, while only perfect (i.e. smooth) boundary conditionsare considered. Note also that for strongly strained droplets (e.g. 400%) the length of the short droplet axis issubstantially reduced, which leads to a capillary condensation-like effect: due to the proximity of the opposing wallsnematic order is restored throughout the droplet even at temperatures several degrees above the bulk TNI (Fig. 13).
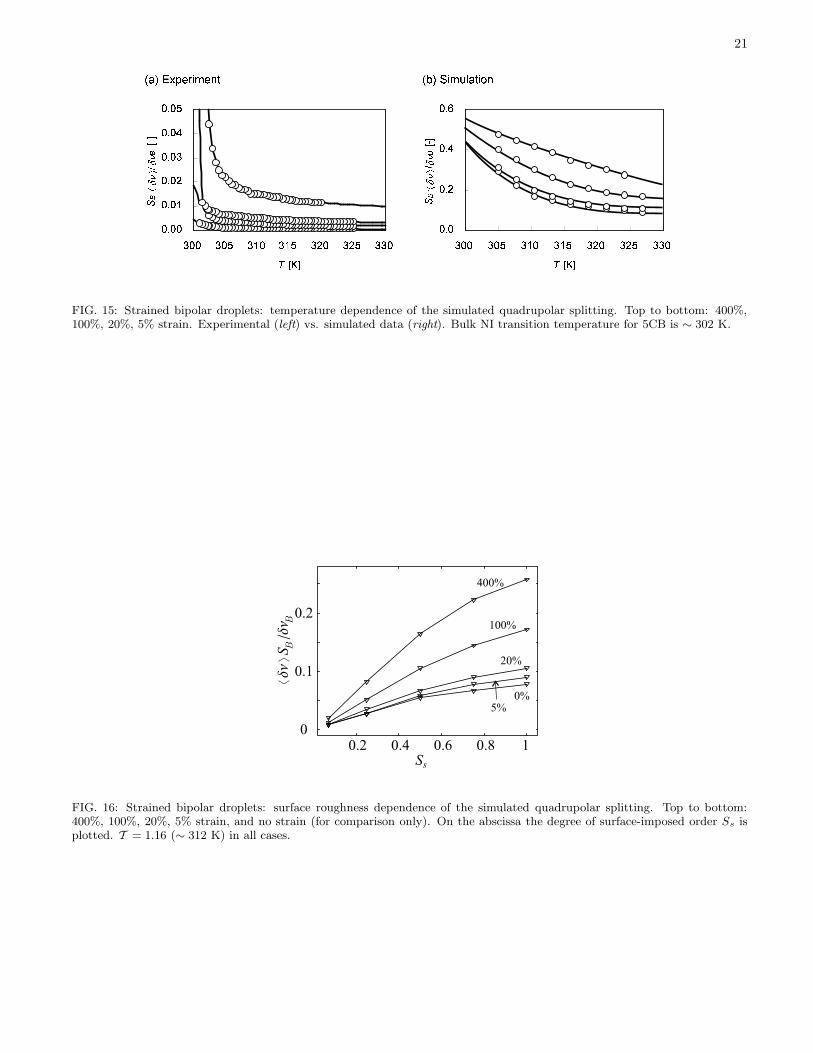
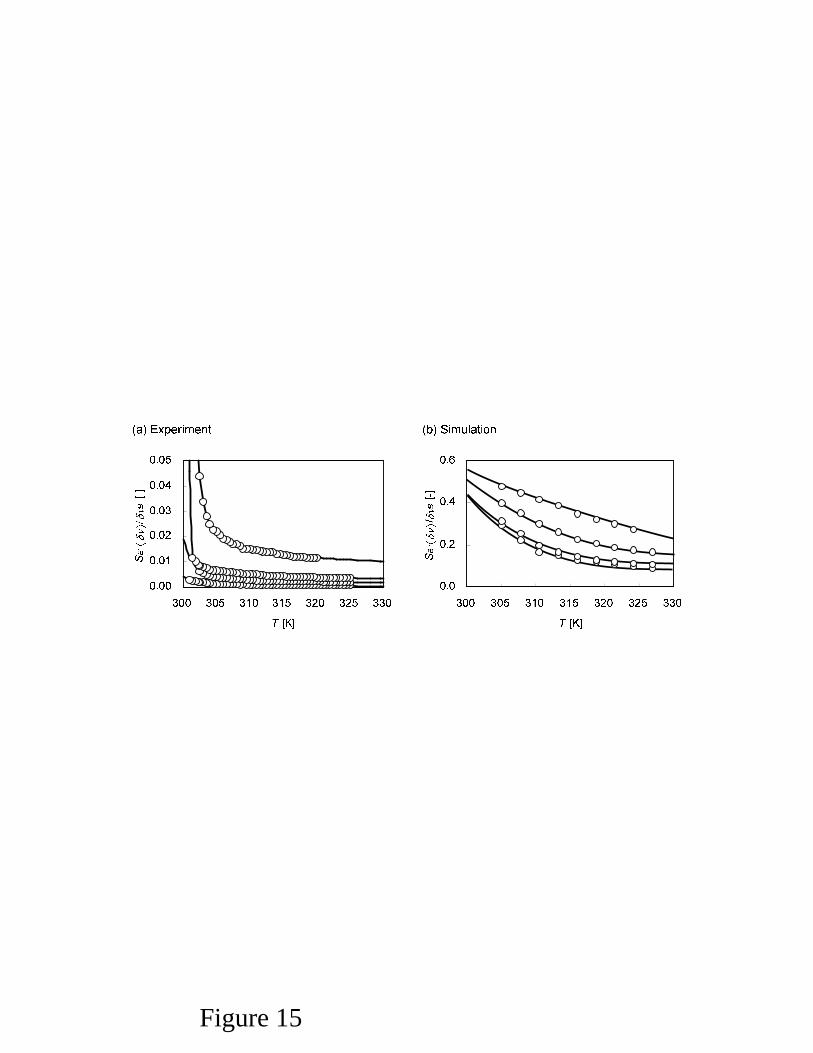
Examples of the simulated 2H-NMR spectra are shown in Fig. 14. Note that all spectra are double-peaked, with noadditional structure, which indicates that they are indeed highly diffusion-averaged. The temperature dependences ofthe quadrupolar splitting for all droplets (estimated from the peak-to-peak distance for each spectrum) are summarizedin Fig. 15. One can readily observe that the splitting decreases with increasing temperature, and that it increaseswith strain, which is both seen also experimentally. The former effect is mainly because of the decrease of ξ, i.e., thethickness of the paranematically ordered subsurface layer, while the latter is due to a more pronounced orientation ofnematic molecules along the tensile axis (and the spectrometer magnetic field), as well as due to an increase of thedroplet surface area upon stretching the polymer matrix. Note, however, that all simulated values of the quadrupolesplitting are noticeably higher than the experimental ones. This is a consequence of the rather strong coupling betweennematic and ghost particles chosen in the simulation, resulting in an overestimate of the degree of paranematic order,including S0. On the other hand, examining the increase of the quadrupole splitting upon stretching at a giventemperature, one observes that at all temperatures the relative increase obtained experimentally is significantly largerthan the corresponding MC-simulated value. Recall again that the simulations presented so far were performed withperfectly smooth bipolar boundary conditions at the droplet surface, while the actual appearance of the polymersubstrate is far from smooth. Imperfections of the polymer surface lead to a decrease of the subsurface degree ofordering S0 [40], which in a real system seems to be the case especially for weakly strained droplets trapped withina fairly disordered polymer. Then, with increasing strain, polymer chains disentangle, which is accompanied by anincrease of S0 (Fig. 11). In the simulated model systems we have shown, the increase of the quadrupolar splitting withstretching can be attributed solely to the change of droplet shape. In a real system this effect seems to be enhancedby the disentanglement process in the polymer matrix. — For this reason, a set of simulations for partially disordereddroplet surfaces has also been performed. A perturbation of bipolar boundary conditions was generated following aP2-type orientational distribution with controllable degree of surface order Ss [40]. This modification indeed reduces
8
the quadrupole splitting, as can be easily concluded from Fig. 16. Extrapolating Ss → 0 towards experimentallyrelevant values and using the experimental splitting data on stretching from 5% to 400% at T = 1.16 (≈ 312 K), thesimulation predicts an increase of Ss by a factor of ∼ 9. The experimental S0 data from the fit, on the other hand,merely give a factor of ∼ 3.4. Note that in the low Ss range the accuracy of curves plotted in Fig. 16 is limited as themagnitude of the resulting splitting already approaches the resolution of our spectra.
VII. CONCLUSION
In this paper, we have studied the alignment of 5CB-αd2 in stretched PDLCs using 2H-NMR. We have directlyobserved liquid crystal alignment along the tensile axis in the nematic phase. Moreover, we have investigated parane-matic surface-induced ordering and analyzed it using Landau-de Gennes theory. The elliptical model we propose isshown to well describe surface ordering of liquid crystal molecules confined to elliptical cavities. The measured surfacevalue of the order parameter turns out to be largely temperature-independent and is seen to increase with increasingstrain. The latter observation is in agreement with the results obtained from optomechanical measurements [29]: onstretching, polymer chains of the PDLC matrix disentagle and thereby modify surface anchoring conditions for liquidcrystal molecules. Our experimental results are well correlated with qualitative trends obtained from Monte Carlosimulations of paranematic ordering in elliptical droplets.
VIII. ACKNOWLEDGEMENT
Financial support was provided by Fuji Photo Film Co. Ltd., the National Science Foundation (Grants DMR-0079964, DMR-9875427, and 0306851), and the Slovenian Office of Science (Programme No. P1-0099 and Slovene-USproject SLO-US/04-05/32).
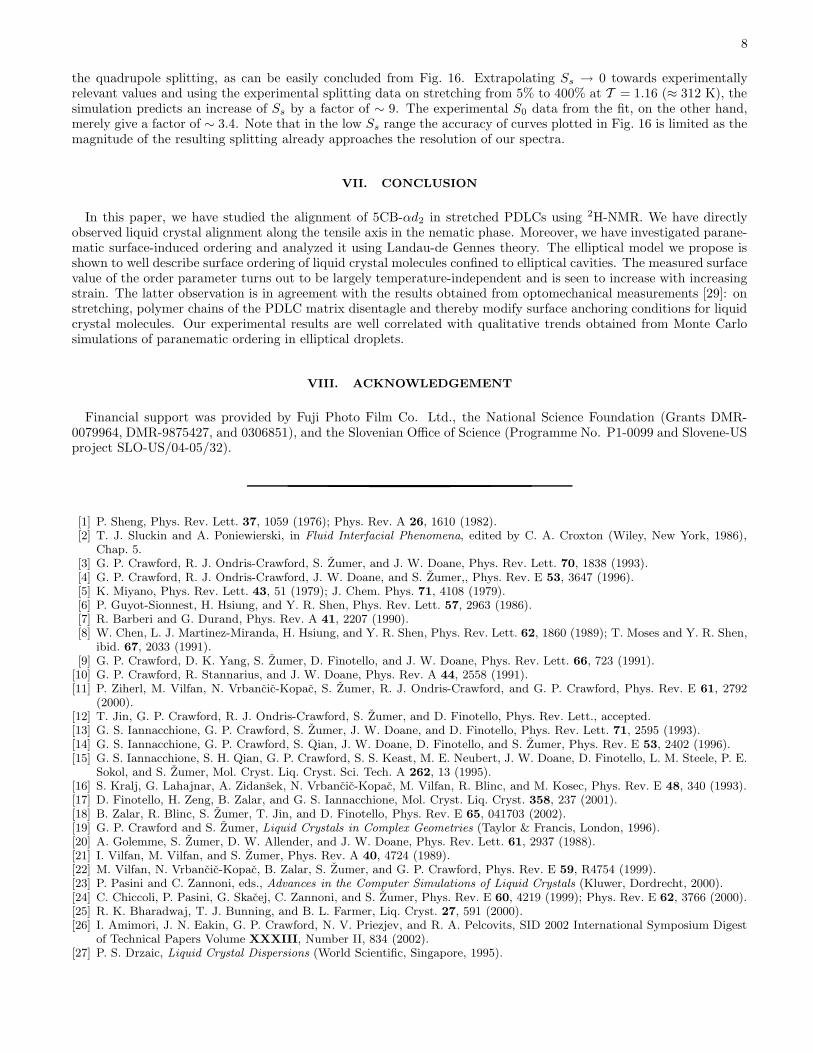
[1] P. Sheng, Phys. Rev. Lett. 37, 1059 (1976); Phys. Rev. A 26, 1610 (1982).[2] T. J. Sluckin and A. Poniewierski, in Fluid Interfacial Phenomena, edited by C. A. Croxton (Wiley, New York, 1986),
Chap. 5.[3] G. P. Crawford, R. J. Ondris-Crawford, S. Zumer, and J. W. Doane, Phys. Rev. Lett. 70, 1838 (1993).[4] G. P. Crawford, R. J. Ondris-Crawford, J. W. Doane, and S. Zumer,, Phys. Rev. E 53, 3647 (1996).[5] K. Miyano, Phys. Rev. Lett. 43, 51 (1979); J. Chem. Phys. 71, 4108 (1979).[6] P. Guyot-Sionnest, H. Hsiung, and Y. R. Shen, Phys. Rev. Lett. 57, 2963 (1986).[7] R. Barberi and G. Durand, Phys. Rev. A 41, 2207 (1990).[8] W. Chen, L. J. Martinez-Miranda, H. Hsiung, and Y. R. Shen, Phys. Rev. Lett. 62, 1860 (1989); T. Moses and Y. R. Shen,
ibid. 67, 2033 (1991).[9] G. P. Crawford, D. K. Yang, S. Zumer, D. Finotello, and J. W. Doane, Phys. Rev. Lett. 66, 723 (1991).
[10] G. P. Crawford, R. Stannarius, and J. W. Doane, Phys. Rev. A 44, 2558 (1991).[11] P. Ziherl, M. Vilfan, N. Vrbancic-Kopac, S. Zumer, R. J. Ondris-Crawford, and G. P. Crawford, Phys. Rev. E 61, 2792
(2000).[12] T. Jin, G. P. Crawford, R. J. Ondris-Crawford, S. Zumer, and D. Finotello, Phys. Rev. Lett., accepted.[13] G. S. Iannacchione, G. P. Crawford, S. Zumer, J. W. Doane, and D. Finotello, Phys. Rev. Lett. 71, 2595 (1993).[14] G. S. Iannacchione, G. P. Crawford, S. Qian, J. W. Doane, D. Finotello, and S. Zumer, Phys. Rev. E 53, 2402 (1996).[15] G. S. Iannacchione, S. H. Qian, G. P. Crawford, S. S. Keast, M. E. Neubert, J. W. Doane, D. Finotello, L. M. Steele, P. E.
Sokol, and S. Zumer, Mol. Cryst. Liq. Cryst. Sci. Tech. A 262, 13 (1995).[16] S. Kralj, G. Lahajnar, A. Zidansek, N. Vrbancic-Kopac, M. Vilfan, R. Blinc, and M. Kosec, Phys. Rev. E 48, 340 (1993).[17] D. Finotello, H. Zeng, B. Zalar, and G. S. Iannacchione, Mol. Cryst. Liq. Cryst. 358, 237 (2001).[18] B. Zalar, R. Blinc, S. Zumer, T. Jin, and D. Finotello, Phys. Rev. E 65, 041703 (2002).[19] G. P. Crawford and S. Zumer, Liquid Crystals in Complex Geometries (Taylor & Francis, London, 1996).[20] A. Golemme, S. Zumer, D. W. Allender, and J. W. Doane, Phys. Rev. Lett. 61, 2937 (1988).[21] I. Vilfan, M. Vilfan, and S. Zumer, Phys. Rev. A 40, 4724 (1989).[22] M. Vilfan, N. Vrbancic-Kopac, B. Zalar, S. Zumer, and G. P. Crawford, Phys. Rev. E 59, R4754 (1999).[23] P. Pasini and C. Zannoni, eds., Advances in the Computer Simulations of Liquid Crystals (Kluwer, Dordrecht, 2000).[24] C. Chiccoli, P. Pasini, G. Skacej, C. Zannoni, and S. Zumer, Phys. Rev. E 60, 4219 (1999); Phys. Rev. E 62, 3766 (2000).[25] R. K. Bharadwaj, T. J. Bunning, and B. L. Farmer, Liq. Cryst. 27, 591 (2000).[26] I. Amimori, J. N. Eakin, G. P. Crawford, N. V. Priezjev, and R. A. Pelcovits, SID 2002 International Symposium Digest
of Technical Papers Volume XXXIII, Number II, 834 (2002).[27] P. S. Drzaic, Liquid Crystal Dispersions (World Scientific, Singapore, 1995).
9
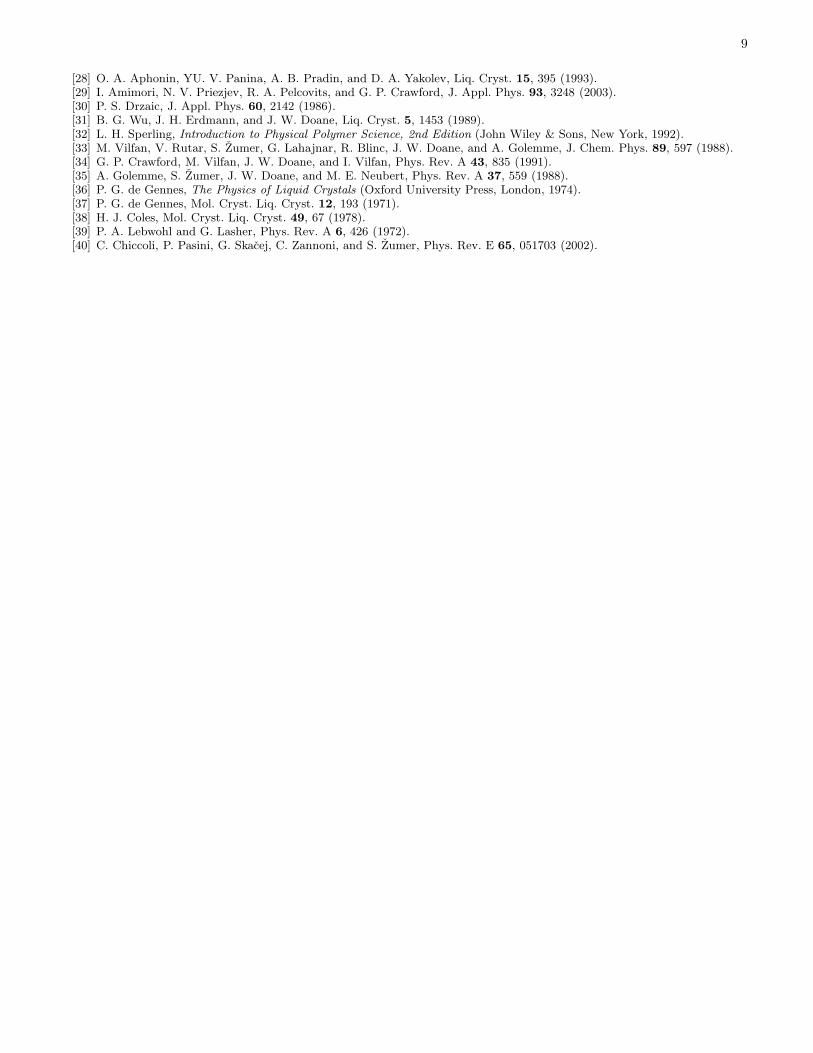
[28] O. A. Aphonin, YU. V. Panina, A. B. Pradin, and D. A. Yakolev, Liq. Cryst. 15, 395 (1993).[29] I. Amimori, N. V. Priezjev, R. A. Pelcovits, and G. P. Crawford, J. Appl. Phys. 93, 3248 (2003).[30] P. S. Drzaic, J. Appl. Phys. 60, 2142 (1986).[31] B. G. Wu, J. H. Erdmann, and J. W. Doane, Liq. Cryst. 5, 1453 (1989).[32] L. H. Sperling, Introduction to Physical Polymer Science, 2nd Edition (John Wiley & Sons, New York, 1992).[33] M. Vilfan, V. Rutar, S. Zumer, G. Lahajnar, R. Blinc, J. W. Doane, and A. Golemme, J. Chem. Phys. 89, 597 (1988).[34] G. P. Crawford, M. Vilfan, J. W. Doane, and I. Vilfan, Phys. Rev. A 43, 835 (1991).[35] A. Golemme, S. Zumer, J. W. Doane, and M. E. Neubert, Phys. Rev. A 37, 559 (1988).[36] P. G. de Gennes, The Physics of Liquid Crystals (Oxford University Press, London, 1974).[37] P. G. de Gennes, Mol. Cryst. Liq. Cryst. 12, 193 (1971).[38] H. J. Coles, Mol. Cryst. Liq. Cryst. 49, 67 (1978).[39] P. A. Lebwohl and G. Lasher, Phys. Rev. A 6, 426 (1972).[40] C. Chiccoli, P. Pasini, G. Skacej, C. Zannoni, and S. Zumer, Phys. Rev. E 65, 051703 (2002).
10
TABLE I: Summary of interfacial parameters for 5CB-αd2 confined to elliptical droplets of stretched PDLC films.
ε S0 l0 T ∗ 1
2
√
a(TNI − T ∗)L
[%] [-] [nm] [K] ×10−4 [J/m2]
5 0.0070 ± 0.0004 0.00 ± 0.00 301.36 ± 0.25 5.99 ± 1.19
20 0.015 ± 0.001 0.69 ± 0.03 300.71 ± 0.25 8.50 ± 0.83
100 0.018 ± 0.001 0.72 ± 0.08 300.70 ± 0.25 8.54 ± 0.83
400 0.024 ± 0.001 1.61 ± 0.08 301.67 ± 0.25 4.30 ± 1.79
11
a) Unstretched b) 400% strain (Aspect ratio ~ 11 ± 2)
FIG. 1: SEM photographs of PDLC films: (a) before stretching, (b) 400% strain. The average initial diameter of undeformeddroplets is (92 ± 16) nm. Arrows indicate the major and minor axes for one of the stretched droplets. The average axis lengthsin the sample with 400% strain are estimated as (460 ± 80) nm and (41 ± 7) nm for the major and minor axes, respectively.The corresponding aspect ratio (measured from more than 100 droplets in several pictures) is 11 ± 2.
X
YZ
Tensile axis
FIG. 2: The schematic diagram of the coordinate system of NMR measurement.
12
(a)
(b)
(c)
δν [Hz]
X
Y
(d)
δνB = 52.1 kHz
δνB/2
FIG. 3: The NMR spectra of 5CB-αd2 in an unstretched PDLC film with (a) the magnetic field applied along the Z-axis and(b) Y -axis, and (c) in a bulk sample aligned parallel to the magnetic field. (d) Schematic depiction of droplet organization:bipolar axes not aligned.
13
Tensile axis
X
Y
(d)
(a)
(b)
(c)
δν [Hz]
δνB/2
δνB = 52.1 kHz
FIG. 4: The NMR spectra of 5CB-αd2 in a 100% stretched PDLC film: (a) magnetic field along Z-axis, (b) magnetic fieldalong Y -axis, (c) magnetic field along X-axis. (d) Schematic depiction of droplet organization: bipolar axes aligned.
14
(a)
(b)
(c)
δνB/2
(d)
δν [Hz]
δνB = 52.1 kHz
FIG. 5: The NMR spectra of 5CB-αd2 in (a) 5%, (b) 20%, (c) 100%, and (d) 400% stretched PDLC films. The magnetic fieldis applied along the X-axis.
15
FIG. 6: Schematic diagram of the elliptical geometry: (a) Cylindrical coordinate system for elliptical geometry, (b) Surfacemolecule alignment with respect to the elliptical surface and the applied magnetic field.
16
S/S
0r
z
0.0
0.5
1.0
-1 -0.5 0 0.5 1
0.0
0.5
1.0
-1 -0.5 0 0.5 1
0.0
0.5
1.0
-1 -0.5 0 0.5 1
r /R 0
FIG. 7: The molecular orientational order parameter profile in an elliptical cavity at different z. The dashed line illustratesthe surface of the elliptical cavity.
! !"$# %
& '
(
)*+,
$
($
- $
)$$
'.'/ 0"$# %
+)1
FIG. 8: 2H-NMR spectra for 5CB-αd2 of 100% and 400% stretched PDLC film in isotropic phase. The magnetic field is parallelto the tensile axis (X-axis).
17
0.000
0.005
0.010
0.015
0.020
300 305 310 315 320 325
T [K]
S00
0.020
0.022
0.024
0.026
0.028
0.030
300 305 310 315 320 325
T [K]
S0
(a)
(b)
FIG. 9: Temperature dependence of the degree of surface-induced nematic order: (a) S00 calculated from Eq. (16) and (b) S0
calculated from Eq. (17), with ξ0 = 0.65 nm, T ∗ = 300.9 K, and l0 = 1.0 nm; both for 400% strain.
18
0.0
1.0
2.0
3.0
4.0
300 305 310 315 320 325 330
T [K]
δν
[kH
z]
0.2
0.4
0.6
0.8
1.0
300 305 310 315 320 325 330
T [K]
δν
[kH
z]
0.1
0.2
0.3
0.4
0.5
0.6
300 305 310 315 320 325 330
T [K]
δν
[kH
z]
0.0
0.1
0.2
0.3
0.4
300 305 310 315 320 325 330
T [K]
δν [k
Hz] S0=0.007/ l0=0.0 Å
(a)5%
S0=0.024 / l0=16.1 Å
(d)400%
S0=0.018 / l0=7.3 Å
(c)100%
(b)
S0=0.014 / l0=6.9 Å
20%
FIG. 10: Temperature dependence of the quadrupole splitting frequency 〈δν〉 of 5%, 20%, 100% and 400% stretched PDLC inisotropic phase. Solid curves are the best fits for the temperature-independent model given by Eq. (17).
0.00
0.01
0.02
0.03
0 100 200 300 400
ε [%]
S0
FIG. 11: Strain dependence of S0.
19
FIG. 12: Bipolar droplet with 20% strain at T = 1.20: simulated director field (a) and nematic order parameter map (b)(half and whole XY cross-section through droplet center, respectively), calculated by diagonalizing the MC-time averaged localordering matrix Q(i) = 1
2(3〈ui ⊗ ui〉 − I) [40].
20
FIG. 13: Temperature scans of order parameter profiles plotted through the droplet center along the Y -axis: (a) 5% strain,(b) 400% strain; temperature range T = 1.12 − 1.20 (curves top to bottom, step size 0.01). The subsurface degree of order S0
shows no major temperature dependence and thus supports the temperature-independent model, Eq. (17).
FIG. 14: Strained bipolar droplets: 2H-NMR spectra; (a) 5% strain, (b) 400% strain. The quadrupole splitting decreases withtemperature and increases with strain.
21
!
"$#&%('*)&+,-/. 01,23 "54%768. 09: #3;. <2
=&> =
=&> ?
=&> @
=&> A
B== B=C BDE= BD C B?= B?C BB=FG HI
J K LM N OPQ N OKR ST
FIG. 15: Strained bipolar droplets: temperature dependence of the simulated quadrupolar splitting. Top to bottom: 400%,100%, 20%, 5% strain. Experimental (left) vs. simulated data (right). Bulk NI transition temperature for 5CB is ∼ 302 K.
FIG. 16: Strained bipolar droplets: surface roughness dependence of the simulated quadrupolar splitting. Top to bottom:400%, 100%, 20%, 5% strain, and no strain (for comparison only). On the abscissa the degree of surface-imposed order Ss isplotted. T = 1.16 (∼ 312 K) in all cases.
a) Unstretched b) 400% strain (Aspect ratio ~ 11 ± 2)
Figure 1
X
YZ
Tensile axis
Figure 2
(a)
(b)
(c)
δν [Hz]
X
Y
(d)
δνB = 52.1 kHz
δνB/2
Figure 3
Tensile axis
X
Y
(d)
(a)
(b)
(c)
δν [Hz]
δνB/2
δνB = 52.1 kHz
Figure 4
(a)
(b)
(c)
δνB/2
(d)
δν [Hz]
δνB = 52.1 kHz
Figure 5
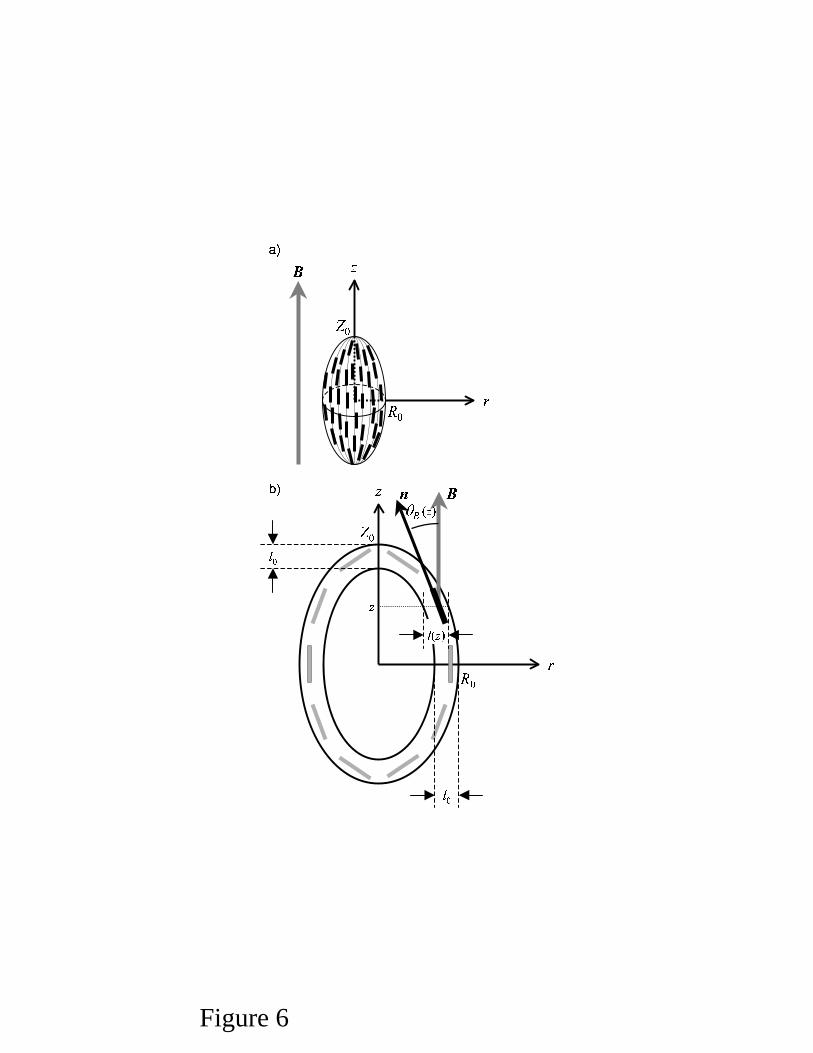
Figure 6
S/S
0
r
z
0.0
0.5
1.0
-1 -0.5 0 0.5 1
0.0
0.5
1.0
-1 -0.5 0 0.5 1
0.0
0.5
1.0
-1 -0.5 0 0.5 1
r /R 0
Figure 7
! #"$ %
&
'
()*
'
&
+(,
! #"$ %
+(,
Figure 8
0.000
0.005
0.010
0.015
0.020
300 305 310 315 320 325
T [K]
S00
0.020
0.022
0.024
0.026
0.028
0.030
300 305 310 315 320 325
T [K]
S0
(a)
(b)
Figure 9
0.0
1.0
2.0
3.0
4.0
300 305 310 315 320 325 330
T [K]
δν
[kH
z]
0.2
0.4
0.6
0.8
1.0
300 305 310 315 320 325 330
T [K]
δν
[kH
z]
0.1
0.2
0.3
0.4
0.5
0.6
300 305 310 315 320 325 330
T [K]
δν [k
Hz]
0.0
0.1
0.2
0.3
0.4
300 305 310 315 320 325 330
T [K]
δν
[kH
z] S0=0.007/ l0=0.0 Å
(a)5%
S0=0.024 / l0=16.1 Å
(d)400%
S0=0.018 / l0=7.3 Å
(c)100%
(b)
S0=0.014 / l0=6.9 Å
20%
Figure 10
0.00
0.01
0.02
0.03
0 100 200 300 400
ε [%]
S0
Figure 11
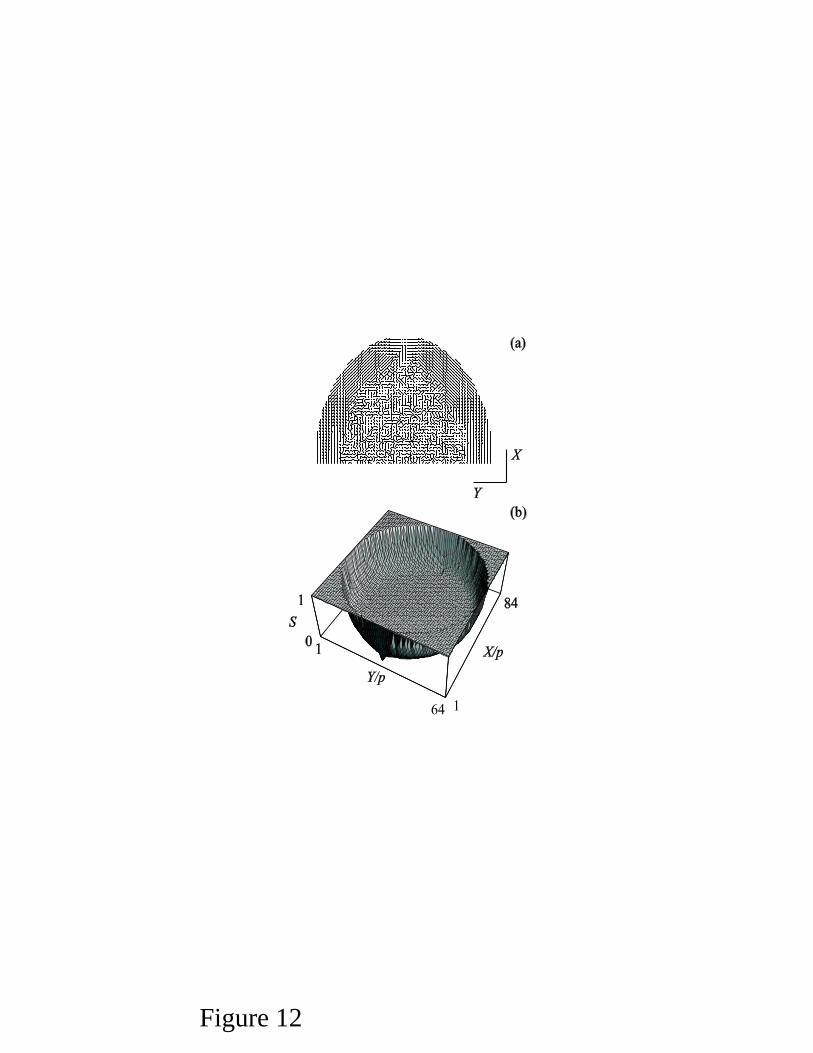
Figure 12
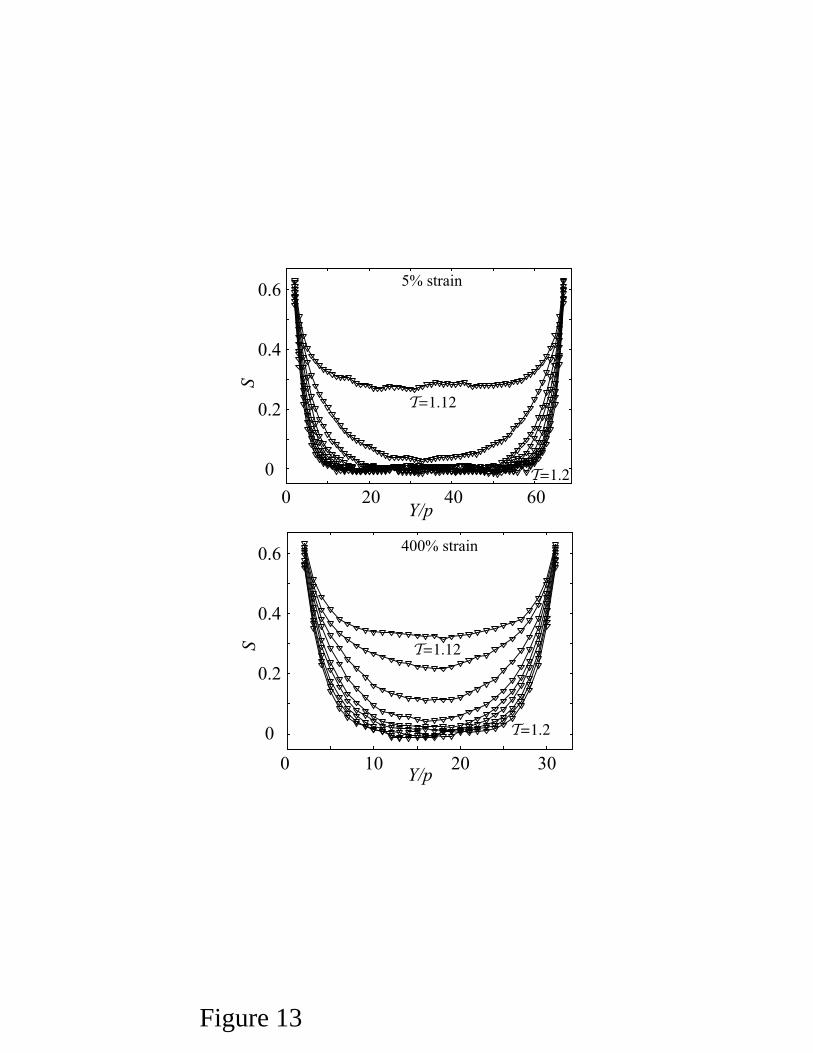
Figure 13
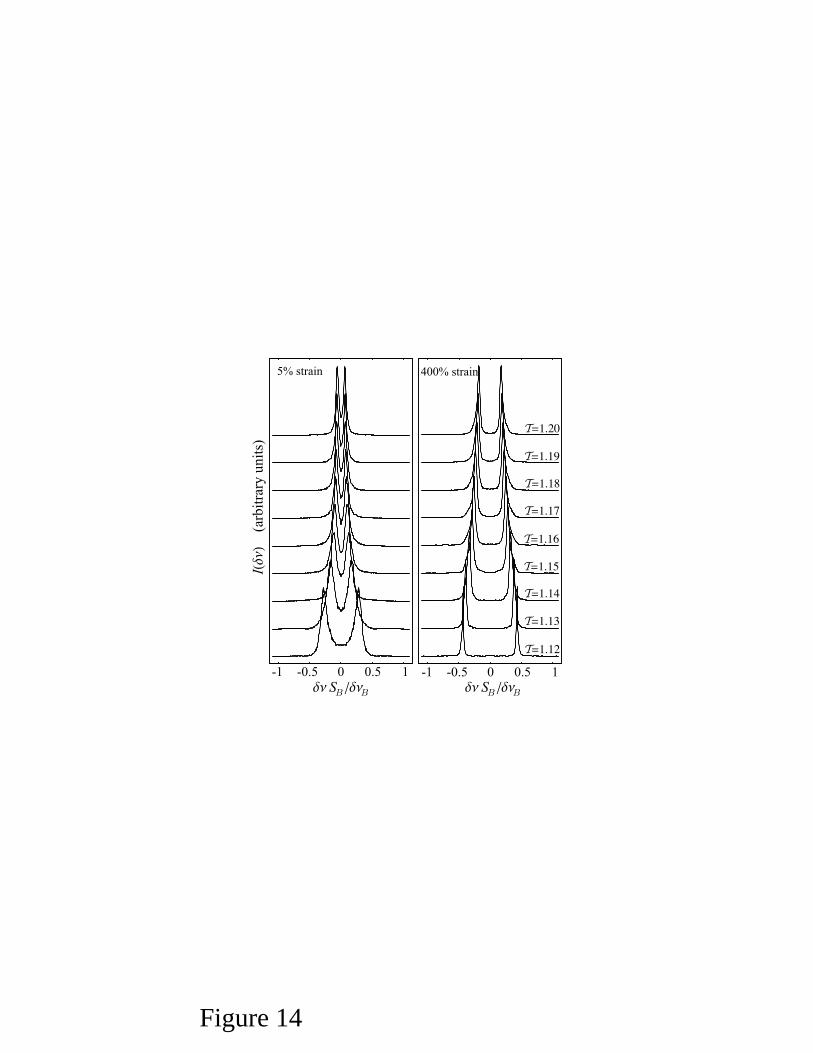
Figure 14
"!$#&%('$)*(+-, ./*01 32#546, .87$9 !1", :0
;< ;
;< =
;< >
;< ?
@;; @;A @BC; @BA @=; @=A @@;DE FG
H I JK L MNO L MIPQR
Figure 15
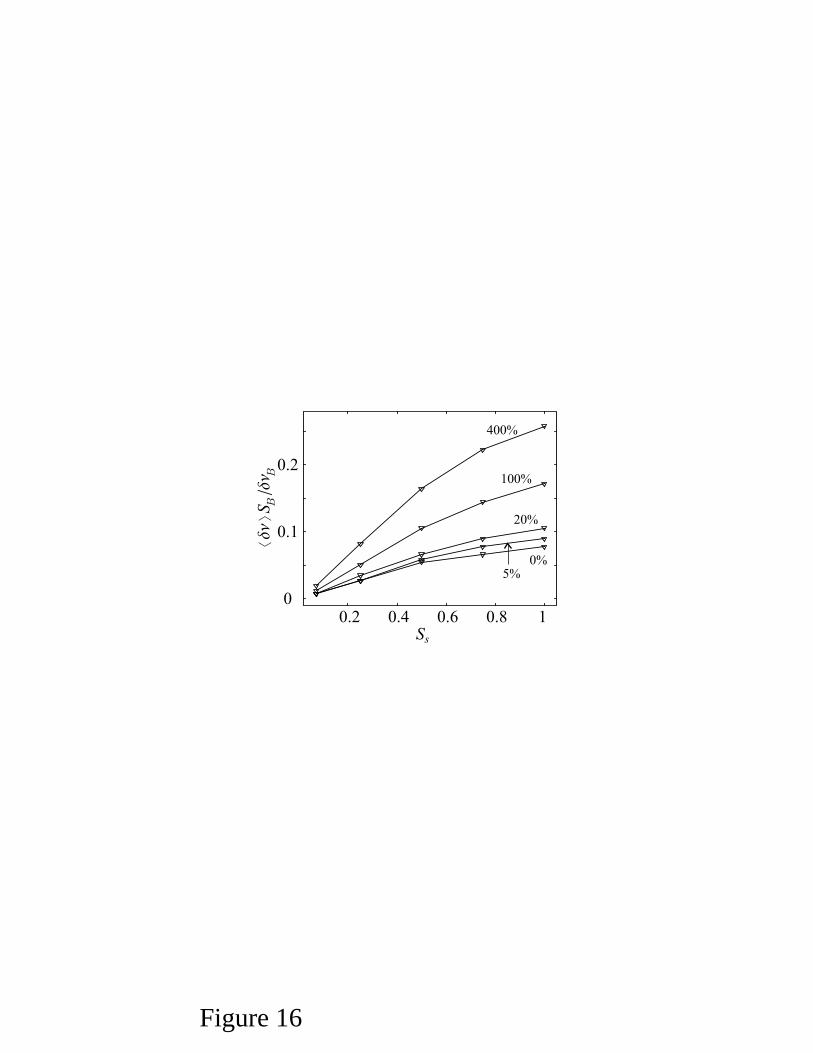
Figure 16