Suppression of Radiation in Unwanted Mimowave...
36
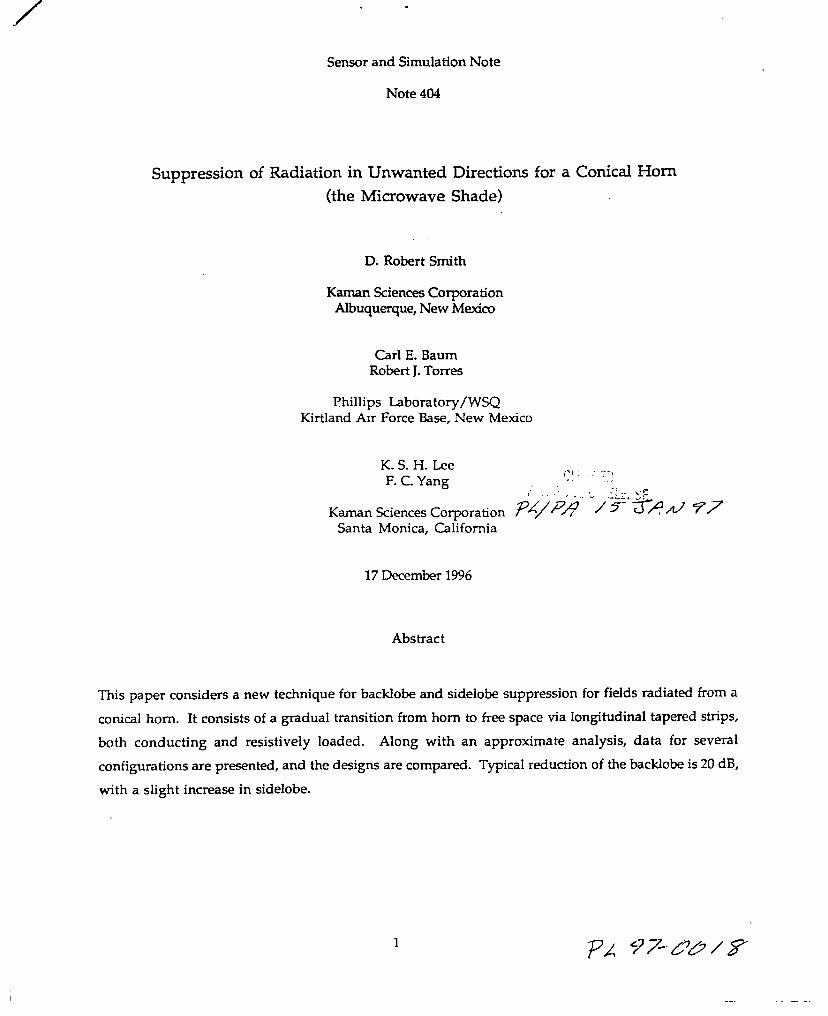
/ Sensor and Simulation Note Note 404 Suppression of Radiation in Unwanted Directions for a Conical Horn (the Mimowave Shade) D. Robert Smith Kaman Sciences Corporation Albuquerque, New Mexico Carl E. Baum Robert J. Torres Phillips Laboratory/WSQ Kirtland Alr Force Base, New Mexico K. S. H. Lee F. C. Yanz i>j ‘.-?: ,., . Kaman Sciences Corporation +Ay>>”” “’/’5?d?d 77 Santa Monica, California 17 December 1996 Abstract This paper considers a new technique for bacldobe and sidelobe suppression for fields radiated from a conical horn. It consists of a gradual transition from horn to free space via longitudinal tapered strips, both conducting and resistively loaded. Along with an approximate analysis, data for several configurations are presented, and the designs are compared. Typical reduction of the bacldobe is 20 dB, with a slight increase in sidelobe. 1
Transcript of Suppression of Radiation in Unwanted Mimowave...
/
Sensor and Simulation Note
Note 404
Suppression of Radiation in Unwanted Directions for a Conical Horn
(the Mimowave Shade)
D. Robert Smith
Kaman Sciences CorporationAlbuquerque, New Mexico
Carl E. BaumRobert J. Torres
Phillips Laboratory/WSQKirtland Alr Force Base, New Mexico
K. S. H. LeeF. C. Yanz
i>j ‘.-?:,., .
Kaman Sciences Corporation +Ay>>”” “’/’5?d?d 77
Santa Monica, California
17 December 1996
Abstract
This paper considers a new technique for bacldobe and sidelobe suppression for fields radiated from a
conical horn. It consists of a gradual transition from horn to free space via longitudinal tapered strips,
both conducting and resistively loaded. Along with an approximate analysis, data for several
configurations are presented, and the designs are compared. Typical reduction of the bacldobe is 20 dB,
with a slight increase in sidelobe.
1

1.0 INTRODUCTION
8
●
Recently there has been increasing interest in deploying high pwer (>1 kW) RF sources, both narrow- 0
band and wideband, in modem military aircraft for radar, EW, and other applications. Whenever
high pwer RF emitters are installed on an aircraft there is the concern of possible electromagnetic
interference (EMI) with other on-board electronic equipment. Modem military aircraft use sophisti-
cated and complex electronic equipment for computers, flight control, navigation, communications, etc.
While interference with on-board receivers operating within the same or nearby frequency bands is of
particular concern, “backdoor” coupling via unintentional paths onto low-level signal lines inside inte-
rior compartments can also be a problem. This paper addresses several ways to minimize the sidelobe
and backlobe radiation from a horn antenna on an aircraft and thereby minimize the undesired coupling
to other aircraft electronic systems.
Horns are often the antenna of choice for high pwer narrowband sources because of their power han-
dling capability, simplicity, and relatively compact size. TEM horns are frequently used for wideband
antennas. Diffraction from the edges of a horn antenna scatters RF energy into side- and back-lobes,
where it may couple onto the aircraft skin and into receiving antennas and interior compartments
housing electronic equipment. Although hardening of specific equipment on the aircraft on a case-by-
case basis may still be necessary, a practical, generic “first step” is to try to reduce the RF energy radi-
ated in the side and backlobes of the horn. There are at least three partially effective approaches a
which may be implemented individual y or in combination:
1.)
2.)
3.)
Modify the horn edges to minimize the diffraction into the side- and back-lobes.
Redirect diffracted waves away from the side- and back-lobes and into the forwarddirection instead.
Use RF absorber material around the sides of the horn to absorb side- and back-lobeemissions.
Each of these techniques has advantages and limitations which will be addressed in a qualitative way
in the next section. We will consider each technique in the context of reduction of side- and back-lobe
emission from a linearly- or circularly- polarized conical horn antenna driven in the TEI 1 circular
waveguide mode. In Section 3 we will present a detailed analysis of a backlobe redirecting device
which utilizes an array of rectangular notches parallel to the horn axis. Finally, in Section 4 we pre-
sent conclusions and recommendations for other backlobe/ sidelobe suppressor designs utilizing some of
the results of this study.
. . . ,.
2
,,,
R1.
+,.:
.2.0 APPROACHES
●In this section we examine in a qualitative way the three general design approaches listed in Section 1
for reducing side and back- lobes from a horn antenna:
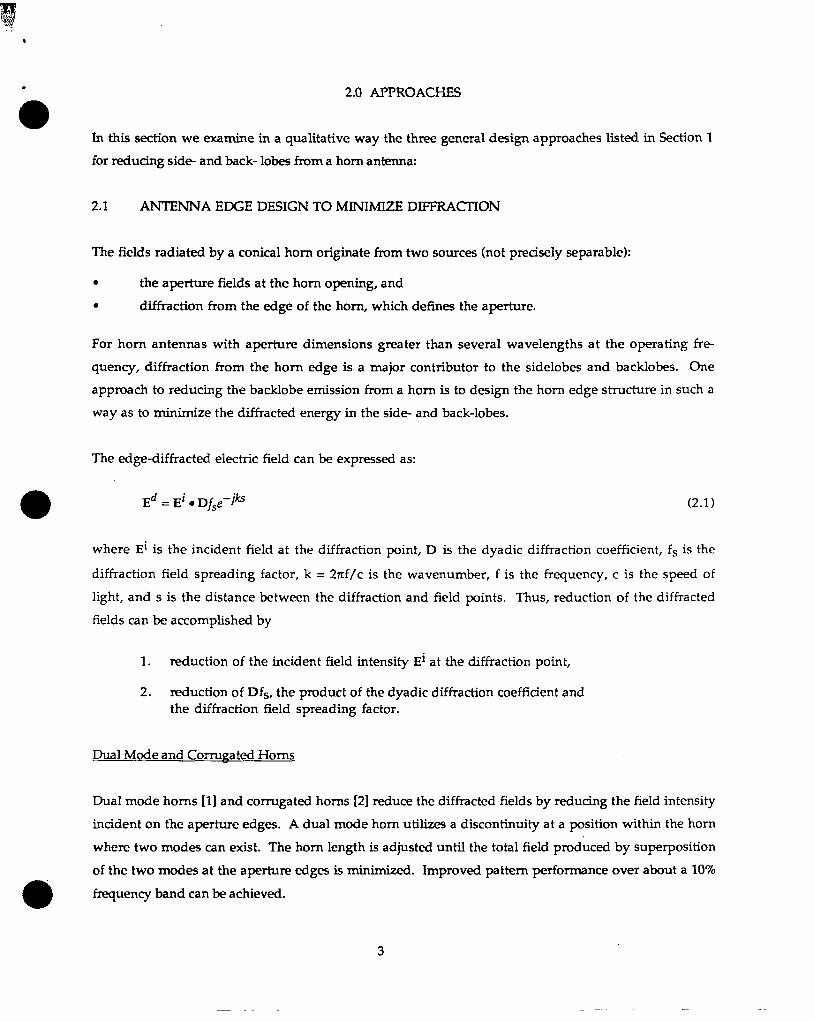
2.1 ANTENNA EDGE DESIGN TO MINIMIZE DIFFRACTION
The fields radiated by a conical horn originate from two sources (not precisely separable):
● the aperture fields at the horn opening, and
● diffraction from the edge of the horn, which defines the aperture.
For horn antennas with aperture dimensions greater than several wavelengths at the operating fre-
quency, diffraction from the horn edge is a major contributor to the sidelobes and backlobes. One
approach to reducing the backlobe emission horn a horn is to design the horn edge structure in such a
way as to minimize the diffracted energy in the side and back-lobes.
The edge-diffracted electric field can be expressed as:
Ed = Ei . D~~e-jk (2.1)
where Ei is the incident field at the diffraction point, D is the dyadic diffraction coefficient, fs is the
diffraction field spreading factor, k = 2nf/c is the wavenumber, f is the frequency, c is the speed of
light, and s is the distance between the diffraction and field points. Thus, reduction of the diffracted
fields can be accomplished by
1. reduction of the incident field intensity Ei at the diffraction point,
2. reduction of Dfs, the product of the dyadic diffraction coefficient andthe diffraction field spreading factor.
Dual Mode and Corrugated Horns
Dual mode horns [1] and corrugated horns [2] reduce the diffracted fields by reduang the field intensity
inadent on the aperture edges. A dual mode horn utilizes a discontinuity at a position within the horn
where two modes can exist. The horn length is adjusted until the total field produced by superposition
of the two modes at the aperture edges is minimized. Improved pattern performance over about a 10?%
o frequency band can be achieved.
3
* *
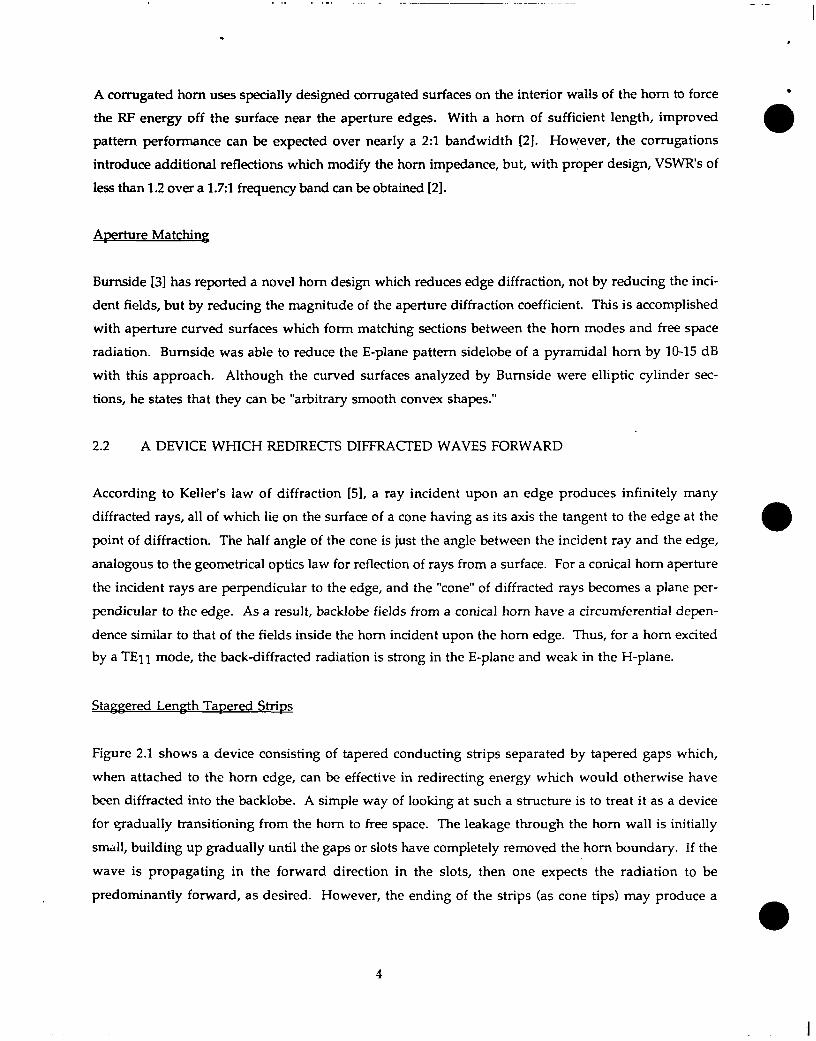
A corrugated horn uses specially designed corrugated surfaces on the intenor walls of the horn to force ●
the RF energy off the surface near the aperture edges. With a horn of sufficient length, improvede
pattern performance can be expected over nearly a 2:1 bandwidth [2]. However, the corrugations
introduce additional reflections which modify the horn impedance, but, with proper design, VSWR’S of
less than 1.2 over a 1.71 frequency band can be obtained [2].
A~rture Matching
Burnside [3] has reported a novel horn design which reduces edge diffraction, not by reducing the inci-
dent fields, but by reducing the magnitude of the aperture diffraction coefficient. This is accomplished
with aperture crowed surfaces which form matching sections between the horn modes and free space
radiation. Bumside was able to reduce the E-plane pattern sidelobe of a pyramidal horn by 10-15 dB
with this approach. Although the cumed surfaces analyzed by Bumside were elliptic cylinder sec-
tions, he states that they can be “arbitrary smooth convex shapes.”
2.2 A DEVICE WHICH REDIRECTS DIFFRACTED WAVES FORWARD
According to Keller’s law of diffraction [5], a ray incident upon an edge produces infinitely many
diffracted rays, all of which lie on the surface of a cone having as its axis the tangent to the edge at them
point of diffraction. The half angle of the cone is just the angle between the incident ray and the edge,
analogous to the geometrical optics law for reflection of rays from a surface. For a conical horn aperture
the incident rays are perpendicular to the edge, and the “cone” of diffracted rays becomes a plane per-
pendicular to the edge. As a result, backlobe fields from a conical horn have a circumferential depen-
dence similar to that of the fields inside the horn incident upon the horn edge. Thus, for a horn excited
by a TEl 1 mode, the back-diffracted radiation is strong in the E-plane and weak in the H-plane.
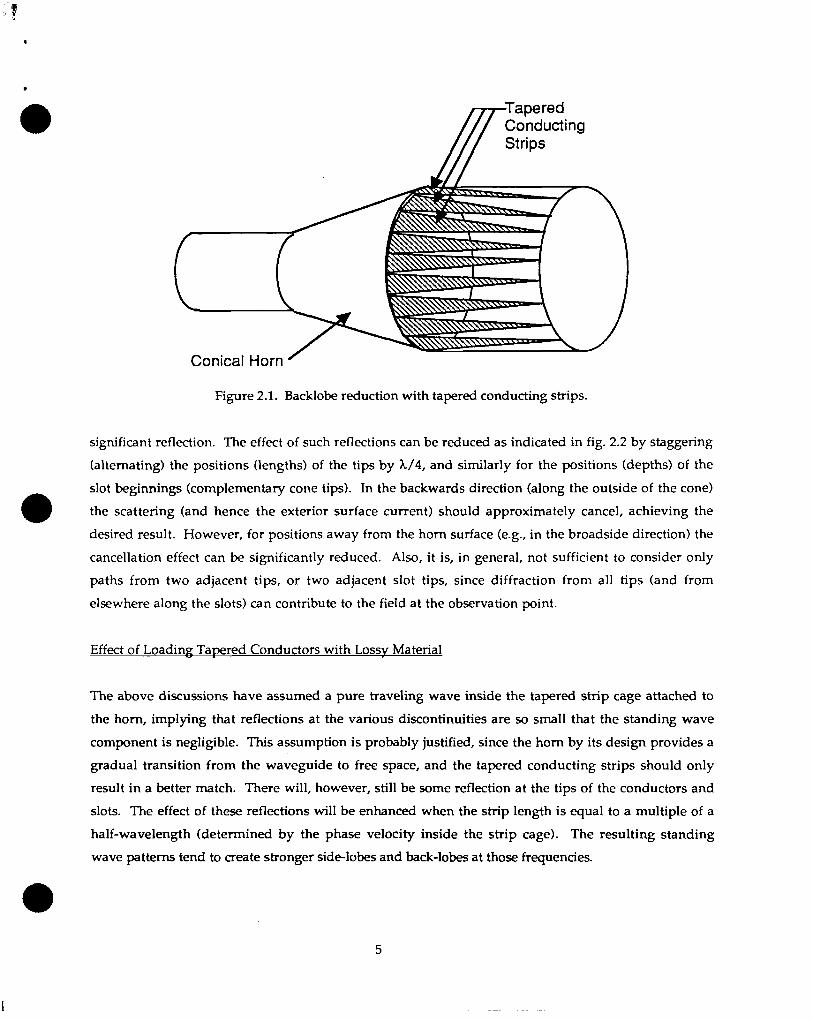
Figure 2.1 shows a device consisting of tapered conducting strips separated by tapered gaps which,
when attached to the horn edge, can be effective in redirecting energy which would otherwise have
been diffracted into the backlobe. A simple way of looking at such a structure is to treat it as a device
for qradually transitioning from the horn to free space. The leakage through the horn wall is initially
srmdl, building up gradually until the gaps or slots have completely removed the horn boundary. If the
wave is propagating in the forward direction in the slots, then one expects the radiation to be
predominantly forward, as desired. However, the ending of the strips (as cone tips) may produce a
●
4
.
e Tapered
r
ConductingStrips
Figure 2.1. Backlobe reduction with tapered conducting strips.
significant reflection. The effect of such reflections can be reduced as indicated in fig. 2.2 by staggering
(alternating) the positions (lengths) of the tips by X/4, and similarly for the positions (depths) of the
slot beginnings (complementary cone tips). In the backwards direction (along the outside of the cone)
the scattering (and hence the exterior surface current) should approximately cancel, achieving the
desired result. However, for positions away from the horn surface (e.g., in the broadside direction) the
cancellation effect can be significantly reduced. Also, it is, in general, not sufficient to consider only
paths from two adjacent tips, or two adjacent slot tips, since diffraction from all tips (and from
elsewhere along the slots) can contribute to the field at the observation point.
Eff@_ of Loadin~ Tapered Conductors with Lossv Material
The above discussions have assumed a pure traveling wave inside the tapered strip cage attached to
the horn, implying that reflections at the various discontinuities are so small that the standing wave
component is negligible. This assumption is probably justified, since the horn by its design provides a
gradual transition from the waveguide to free space, and the tapered conducting strips should only
result in a better match. There will, however, still be some reflection at the tips of the conductors and
slots. The effect of these reflections will be enhanced when the strip length is equal to a multiple of a
half-wavelength (determined by the phase velocity inside the strip cage). The resulting standing
wave patterns tend to create stronger sid~lobes and back-lobes at those frequencies.
5

*.
Figure 2.2. Staggered length array of tapered conductors and slots.
Loading the conductors and/or the slots in a manner similar to that used for wire antennas [7] is one
means of reducing the standing wave fields inside the tapered conductor cage. One can write down a
general equation for the electric current on the conductor (or the magnetic cument in the slot) with an
unspecified loading function, which can then be determined given the desired electric or magnetic
traveling wave current. However, this usually results in a loading function which is difficult if not
impossible to synthesize in practice. Figure 2.3 shows a possible implementation of such a loading. The
tapered conductor strips overlay strips of lossy material such as carbon impregnated foam or graphite
●
epoxy as shown.
aFigure 2.4 shows experimental results obtained with a cylindrical cage of strip pattern similar to that
shown in Fig. 23 attached with aluminum tape to a 50 cm diameter conical horn antenna. The horn was
radiating in a linearly polarized TEl I mode. The graph plots the scattering parameter S21 measured
with a vector network analyzer, where port 1 of the network analyzer was connected to the horn, and
port 2 was connected to a surface B-dot sensor attached to the outer surface of a conducting tube. The
horn was positioned inside the tube with the horn aperture extending 20 cm beyond the edge of the tube.
While this was not intended to be a far-field measurement, it does provide a comparison of the
backlobe radiation with and without the cage. The cage consisted of “long” and “short”, 2.5cm wide
tapered aluminum strips. The long strips were 46cm in length and were separated by short strips of
varying lengths selected to be 1/4 wavelength shorter than the long strips for frequencies ranging from
900 to 1200 MHz in 50 MHz inmements. The aluminum strips overlaid tapered strips of carbon paper of
surface resistance 5000 ohms per square, similar to that shown in Figure 2.3. The reader will observe
that in the range around 1 GHz, the “bacldobd’ is significantly reduced, as expected.
Subsequent tests with a similar cage constructed without the carbon paper strips yielded identical
results, indicating that the 5000 ohms/square carbon paper was not a major contributor to the reduction
6

“
●
Conductor-Absorber
Figure 2.3. Tapered conductors and slots loaded with absorbe
-50
-55
-60
s~
-65
#-70
-75
-80
!r material.
1 1 1 [ I1 i 1 1 1“’’’’’’’’’’” 1 I 1 I 8 1 I 1 1 1 11/10/95 \
r /
without cage 1 1 1
Data : , with cage \ u-
IY’//’(’/...........................
i :HWK’-F;;”M........~................~...*m.b.. j.... . . . . . . i - -, X., S, . . . . . . . . .
:.-a -.
; /?-.,.+’” ‘ j j ; : i ]“/. )““-”””””’”&””””””--””””’’
EJ=Y7--l------&.....j.i.ar ~o,arizer
0.8 0.9 1 1.3 1.4 1.5 1.6F’r;que;~y (GHz)
Figure 2.4. Tube surface currents measured with and without cageconsisting of tapered conducting and absorbing strips.
7

.. . ..... ... . .... ..--...—---- -.-—
in backlobe emission, probably because the sheet resistance was too large and should be reduced to the● .
order of the wave impedance of free space (~77 Q). Figure 2-.5 shows a similar plot with and without aa
cage consisting of 30 cm long by 2.5 cm wide tapered strips of graphite epoxy. A graphite epoxy paste
was mixed from epoxy and hardener materials, applied to the tapered strip pattern with a spatula to a
thickness of approximately 2 mm, and allowed to dry. The surface resistivity of the hardened
material was not measured. The horn was excited in a arcularly polarized TEI I mode. Note the 10-15
dB reduction in signal across the band with ocasioml dips of 25 dB.
-50
-60
-70
Ei- -80~
COG -90
-100
-110
-120yww Cg 0.8 0.9 1.2 1.3
Fre&ency (~~z)
Figure 25. Tube surface currents measured with and without cageconsisting of 30 cm long, tapered graphite epoxy strips.
%atterimz Sources
The fields from the modified horn configuration shown in figs. 2.1, 2.2, and 2.3 have the following
sources
● the aperture fieIds at the new front openina
● the diffracted fields from the edges of the strips,
w the diffracted fields from the tips of the strips and slots,
● the fields leaking through the tapered slots.
8

● Since the angles between the incident rays and the tapered strip edges are very small, the Keller’s
● cones of rays diffracted from the tapered strip edges are predomimntly in the forward direction. Thus
the tapered strip device, which is electrically in contact with the horn edge, effectively changes the
shape of the horn edge from one in which the inadent rays encounter it at normal incidence (resulting in
back - diffraction) to one in which the rays are incident at almost grazing incidence, with no diffracted
rays in the backlobe direction.
However, there is still diffraction from the tips of the tapered strips. Unlike edge diffraction, rays
diffracted from tips occupy a solid angle of 47t steradians about the tip. Since the wavefronts are essen-
tially spherical, the tip diffracted fields decay as r-l compared to r-l/2 for edge diffracted fields.
The net effect of tip and edge diffraction is a reduction in backlobes resulting from substitution of the
weaker tip diffraction for diffraction from the horn edge.
Field Leaka~e Throuzh Tavered Slots
There is also some field leakage through the tapered slots which can be analyzed assuming traveling
wave magnetic currents in the slot apertures. The traveling wave assumption is valid since the reflec-
tion at the ends of the slot are small, because the horn is designed to be an efficient radiator; reflection
from the horn edge is already very small even without the tapered conducting strips attached. The
● addition of the tapered elements should provide an even more gradual transition to free space, resulting
in a better match than with the horn alone.
For TEll excitation the phase velocity of the traveling wave is
(2.2)
where X = 2z/k is the wavelength, and Xc = 3.412a is the cutoff wavelength for the cylindrical
waveguide of radius a. The fields leaking out of the slot are proportioml to
The z-dependence of A(z) arises from the non-uniform gap width along the tapered slot apertures. The
integral has its maximum value when p = cos 6. For X << kc, which occurs when the radius of the
cylindrical opening is much greater than the wavelength, e is approximately 0°, and the radiation is
primarily in the forward direction.
9
I
b.
Amlvsis of Diffraction from TaDered Conductor Tim ● 1
We have already stated that fields diffracted from tips or comers fall off with distance r as Y-l, while●
edge diffraction decays only as r-l/2. Thus, particularly in the far field, one would expect edge
diffracted fields to be stronger than those diffracted from tips. However, this is only strictly correct for
wavelengths small compared to strip spaang. Using expressions from [6] for electric field intensities
from comer and edge diffraction and applying them to our particular problem, we can form the ratio of
the field diffracted from the tapered conductor tip to the field diffracted from the edge of the conical
horn. The resulting expression is very complicated, involving the sum of two Fresnel integrals. For our
conical horn of radius a = 25 cm and half angle $0 = 20°, the ratio is much less than unity. Thus the
diffraction from the horn edge at the high limit, is much greater than diffraction from the tip.
Note that a particular incident ray originating at the apex of the horn is incident upon the horn edge at
an angle of 90°. The “cone” of edgediffracted rays is, in this case, a plane containing the incident ray
and the axis of the horn. One of the diffracted rays in that plane will pass through an observation
point located in the same plane. other incident rays also impinge upon the horn edge at 90°, but their
planes of diffracted rays do not pass through the same obsemation point. Tips, however, diffract rays
into 4n steradians. Thus, diffraction from many different tips can contribute to the tip-diffracted
component of the field at the observation point, some interfering constructive y, others destructive] y. ●Diffraction from Tius of TaDered Slots
The tips of the tapered slots also diffract the incident wave. Slot tip diffraction can be quantified by
applying a duality prinaple to its complementary structure. The two Fresnel integrals, in this case, are
subtracted rather than summed and are, in fact, equal for the backlobe direction, resulting in zero slot
tip diffraction in that direction. The only contributions to the resultant field at an observation point in
the bacldobe direction from slot tip diffraction result from diffraction from slot tips not in the incident
plane containing the horn axis and obsewation point. As with the conductor tips, diffracted rays from
some ray pairs interfere constructively, and others interfere destructively at the observation point.
2.3 USE OF ABSORBER MATERIAIS AROUND ANTENNA
The use of absorber materials around the antenna, as illustrated in Fig. 2.6, is an alternative technique
to reduce backlobe and sidelobe emission. The objective is to reduce the sidelobe and backlobe fields
with minimal impact upon the forward pattern.
10

.-,..
*
JAbsorber Tube
\ . . . . . . ~;.y ------------- ;, \
* “\88 I@8
tI
ConicalHorn ----- . . . . . ------ ----
\,--
,,>’
\\
h
Figure 2.6. Absorber tube over antenna to reduce sidelobs and backlobes.
Peters and Rudduck [4] d~cuss measurements and theoretical analyses of the use of radar absorbing
materials to reduce far sidelobe or backlobe radiation from three basic antenna types: the pyramidal
●horn, the parabolic reflector, and the Luneberg lens antenna. The authors measured reduction of 10 dB
over 100 degrees in the E-plane backlobe radiation for a 14 inch reflector operating at X-band. For a
pyramidal horn operating in the TEl 0 waveguide mode the two edges perpendicular to the E-plane
produce the diffracted field; the edges perpendicular to the H-plane produce no diffraction because
their diffraction coefficients vanish. Experiments with application of absorber to the edges perpendic-
ular to the E-plane of an X-band hom 13.5 in in length with a 9 in x !3 in aperture resulted in approxi-
mately 10 dB reduction in the E-plane backlotE. Shielding the edges perpendicular to the H-plane had
no effect.
11

3.0 CALCULATION OF FIELDS FROM TEll HORN
3.1 INTRODUCTION
●
In this section we will calculate the bacldobe fields and gain pattern from a conical horn and compare it
with laboratory measurements. Then, in Section 4 we will consider the modifications to the gain
pattern with several different cylindrical absorbing hoods placed over the horn.
The radiated fields from an aperture can be calculated accurately by the aperture field method if the
linear dimensions of the aperture are at least threequarte~ of a wavelength [9, 101. In the method, the
aperture fields are taken to be the incident fields of a feeding waveguide and the radiated fields are
calculated by the (vector) Huygens prinaple, namely,
(3.1)
where R = Ir - r’1, r is an observation point, r’ a pointin the aperture A, (Ea, Ha) are the aperture
fields, and 6’ is the unit normal pointing into the region containing the observation point.
The fields of the TEll mode of a cylindrical geometry (see fig. 3.1) are given by [9]
(3.2)
where ~ = ~, k = free - space propagation constant, m= 1.841, J~(m)=O, a = radius of the
aperture. Substituting (3.2) for Ea and Ha in (3.1) and evaluating the integral in the far zone (i.e., r >
21#/A D = 2a), one obtains [9]
12

&Y
e
a I
IIIIIIII
Figure 3.1.
E Field
------- H Field
Geometry of the problem and the E & H field distributionsof the TEll mode over a cross section.
Ee =–~ (’+fcose)’’(m)’’(w)sin”=(3.3)
‘($+’Os’)“:;::;j)-~E+=– ~
K
Note that this expression is a very good approximation for all values of O and @ , including O = 180°
since the surface currents on the exterior of the waveguide and higher order mode fields in the aperture
can be neglected, provided that the aperture diameter is a wavelength or greater [9].
3.2 DIRIKTIVITY AND GAIN
The directivity gain function G is defined as
G=4zr2x + Re(Ex~”)/~ (3.4)
13

r’
where Pt is the total power radiated from the aperture, which can be calculated by integrating the
Poynting vector over the aperture, yielding the result [9]
Using (3.3) and (3.5) in (3.4), one has
(3.5)
(3.6)
[( )2
+ p+coso J;(ksine)k
1}COS2@
l–(kzsine/m)2
where
Figure 3.2 is a plot of E-plane and H-plane radiation patterns computed from (3.6) for frequency= 1 GHz
and a = 0.26 m.
The main beam is along the z-axis (6= O, @ = O) and the ratio of the backlobe to the main beam is, from a
(3.6), given by
G(e=7t)
[1
721- l-(~/k)
G(O=O, @=O) = ~+~~(3.7)
which is plotted in fig. 3.3 for frequencies from 0.8 to 1.6 GHz. The ratio varies from – 26 dB to – 39 dB;
the main lobe gain is about 14 dB at 1 GHz.
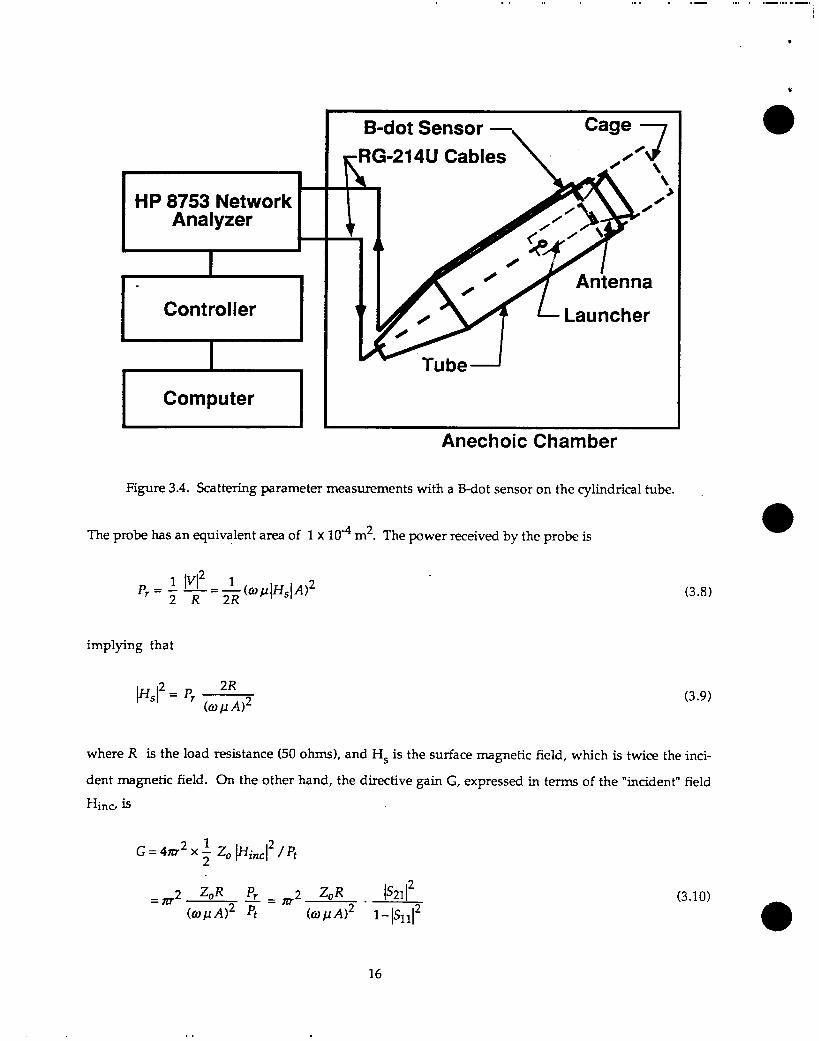
3.3 RELATION TO MEASURED SCA’ITERING PARAMETERS SII AND S21
The results of this analysis will be compared to scattering parameter (S11 and S21 ) data obtained with
a vector network analyzer using a MGL-7 surface B-dot sensor mounted on the cylindrical tube containing
the horn (see fig. 3.4). The sensor was oriented to measure the azimuthal B-field or longitudinal current
density on the cylinder. Thus, it is necessaxy to relate the scattering parameter S21 to the horn gain.
14

E-Plane and H-Plane Patterns20
10
0 —
-lo \
y’ ‘,.
●
. . ..- . .. .“
-20——:
. ..
.. . . .. , I
./
. .. -
-30. .
T. ~-.
I, *.
1 , ‘. 1 .. . ,. . .. ,’ , .s . . .1 . . , . ,-40
. . , ,r , .
0 20 40 60 80 100 120 140 160 180
e
— E-plane. . . . . . . . H-plane
Figure 3.2. E-plane and H-plane radiation patterns calculat~ from (3.6) for f = 1 GHz and a = 0.26 m.
-26
-28 \m-u530 ,~- X
ii-32
j #3f%z -~2 \2-38
-400.8 0.9 1.0 1.1 12 13 1.4 1.5 1.6
f (GHz)
Figure 3.3. Ratio of bacldobe to main beam gains for horn antenna as a function of frequency.
15
., ,, ,. , . .,— ,., , ,,—,,,,.--,
HP 8753 NetworkAnalyzer
/I
1-Controller
I Computer
B-dot Sensor —
4k
1?
..— .Anechoic Chamber
Figure 3.4. Scattering parameter measurements with a B-dot sensor on the cylindrical tube.
4 2 The power received by the probe isThe probe has an equivalent area of 1 x 10 m .
P,=+
implying that
Id=
(3.8)
(3.9)
where R is the load
dent magnetic field.
Hinc, k
resistance (50 ohms), and H~ is the surface magnetic field, which is twice the inci-
On the other hand, the directive gain G, expressed in terms of the “incident” field
G = 4m2 x ~ ZO ~inc12 /Pt
(3.10)
●
16
.,
,:
a
#
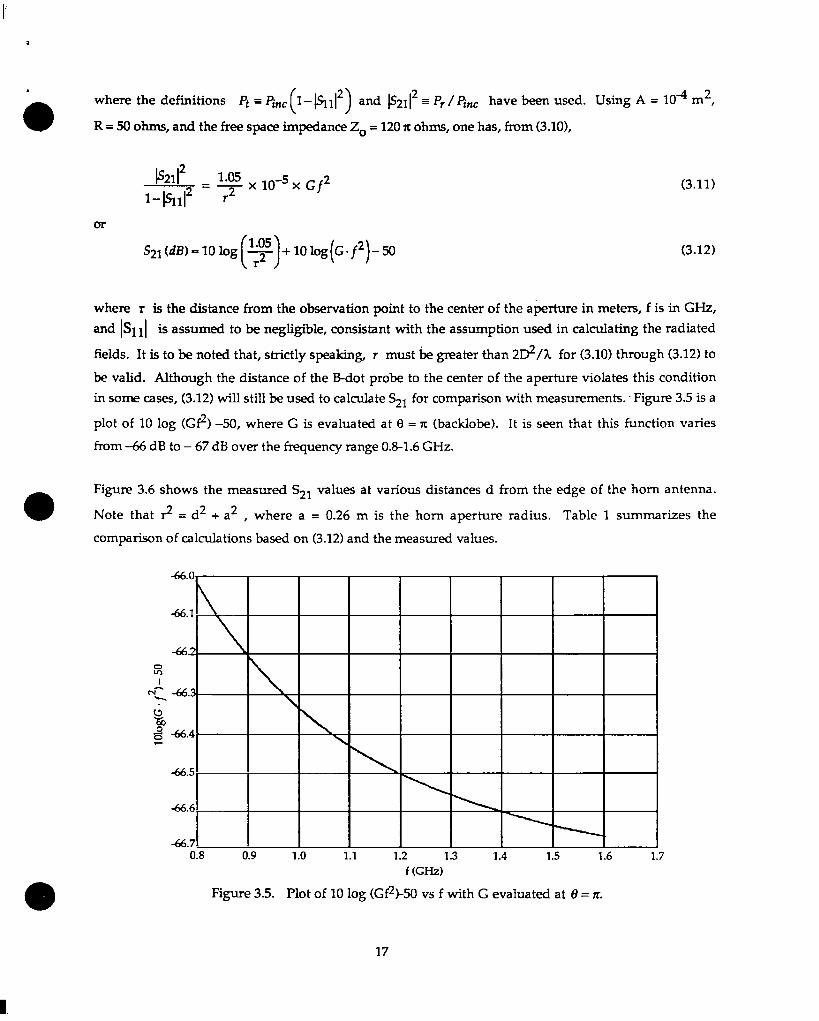
● (where the definitions Pt = ~nc 1 – ~112) and ~2112 = Pr / &c have been used. Using A = 104 m2,
R =50 ohms, and the free space impedance Z. = 120 z ohms, one has, from (3.10),
or
S21(m)=10 log(*)+l@Gf2)-~
(3.11)
(3.12)
where r is the distance from the observation point to the center of the a@-ture in meters, f is in GHz,
and lS11 I is assumed to be negligible, consistent with the assumption used in calculating the radiated
fields. It is to be noted that, strictly speakin& r must k greater than 2d/L for (3.10) through (3.12) to
be valid. Although the distance of the Edot probe to the center of the aperture violates this condition
in some cases, (3.12) will still be used to calculate S21 for comparison with measurements. ”Figure 3.5 is a
plot of 10 log (G?) –50, where G is evaluated at (3 = n (backlobe). It is seen that this function varies
from -66 dB to – 67 dB over the frequency range 0.8-1.6 GHz.
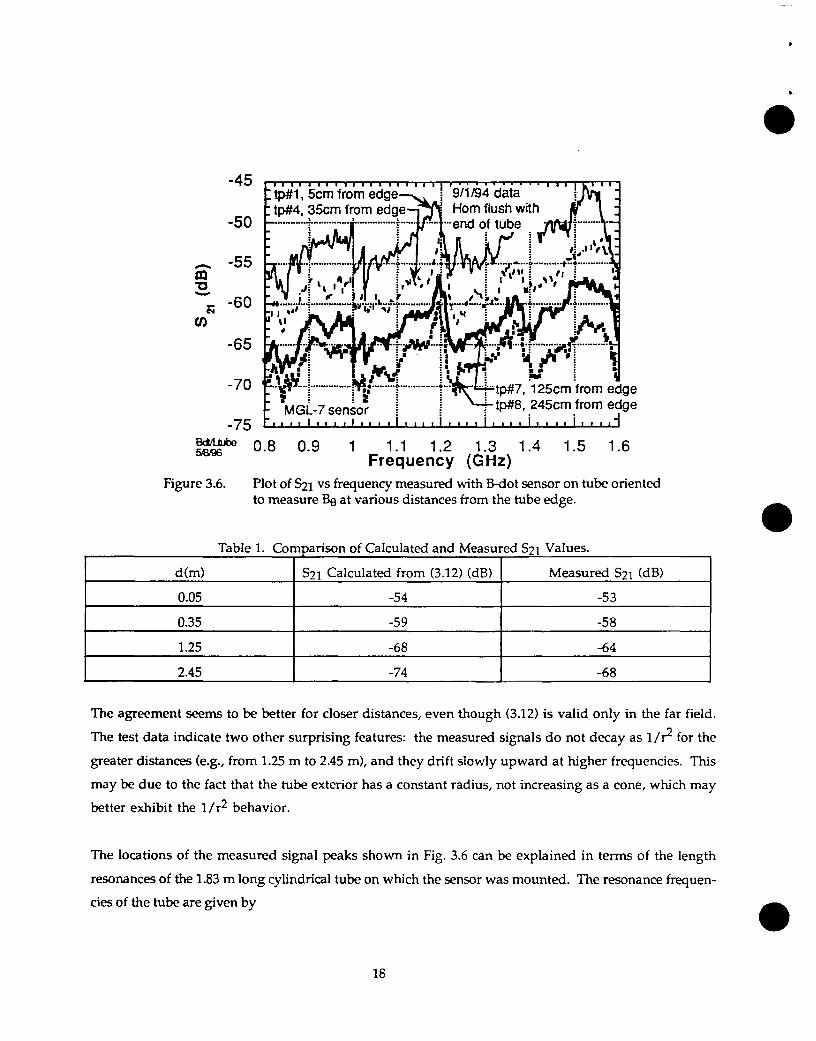
●Figure 3.6 shows the measured S21 values at various distances d from the edge of the horn antenna.
Note that # = d2 + a2 , where a = 0.26 m is the horn aperture radius. Table 1 summarizes the
comparison of calculations based on (3.12) and the measured values.
46.0
-66.1 --
-662 i0InI I
I
H-46.6[
46.7.0.8 0.9 1.0 1.1 1.2 1.3 1.4 1.5 1.6 1.7
f (GHz)
Figure 3.5. Plot of 10 log (Gf2)-50 vs f with G evaluated at O= z.
17
●
8.
●
-45
-50
-55gw
-60as
-65
-70
-75
gege
W 0.8 0.9 1 1.2 1.3 1.4 1.5 1.6Fr~~uency (GHz)
Figure 3.6. Plot of S21 vs frequency measured with B-dot sensor on tube orientedto measure ~ at various distances from the tube edge.
, Table 1. Comparison of Calculated and Measured S21 Values.
d(m) S21 Calculated from (3.12) (dB) Measured S21 (dB)
0.05 -54 -53
0.35 -59 -58
1.25 -68 -64
2.45 -74 -68 A
The agreement seems to be better for closer distances, even though (3.12) is valid only in the far field.
The test data indicate two other surprising features: the measured signals do not decay as 1/# for the
greater distances (e.g., from 1.25 m to 2.45 m), and they drift slowly upward at higher frequencies. This
may be due to the fact that the tube exterior has a constant radius, not increasing as a cone, which may
better exhibit the 1 /r2 behavior.
The locations of the measured signal peaks shown in Fig. 3.6 can be explained in terms of the length
resomnces of the 1.83 m long cylindrical tube on which the sensor was mounted. The resonance frequen-
cies of the tube are given by
18

a
2rz+l cf.= y “ ~, 72=0,1,2 . . . (3.13)
where L = length of the tube and c = speed of light in free space. The spacing between two succesive
resonance frequencies is calculated to be
3 x 10⁸~n+I -fn = : = *83 = 0.164 GHz
which is in fairly good agreement with fig. 3.6.
19
I —
(3.14)
b
4.0 CALCULATION OF FIELDS WITH BACKLOBE SUPPRESSION DEVICE
I
4.1 INTRODUCTION
This section examines ways of employing absorber materials to reduce side- and back-lobe emissions
from a conical horn. We begin by considering a cylindrical hood of absorbing material wrapped around
the radiating horn. Then we consider the same hood with periodic, rectangular, longitudinal notches.
4.2 CYLINDRICAL ABSORBING HOOD
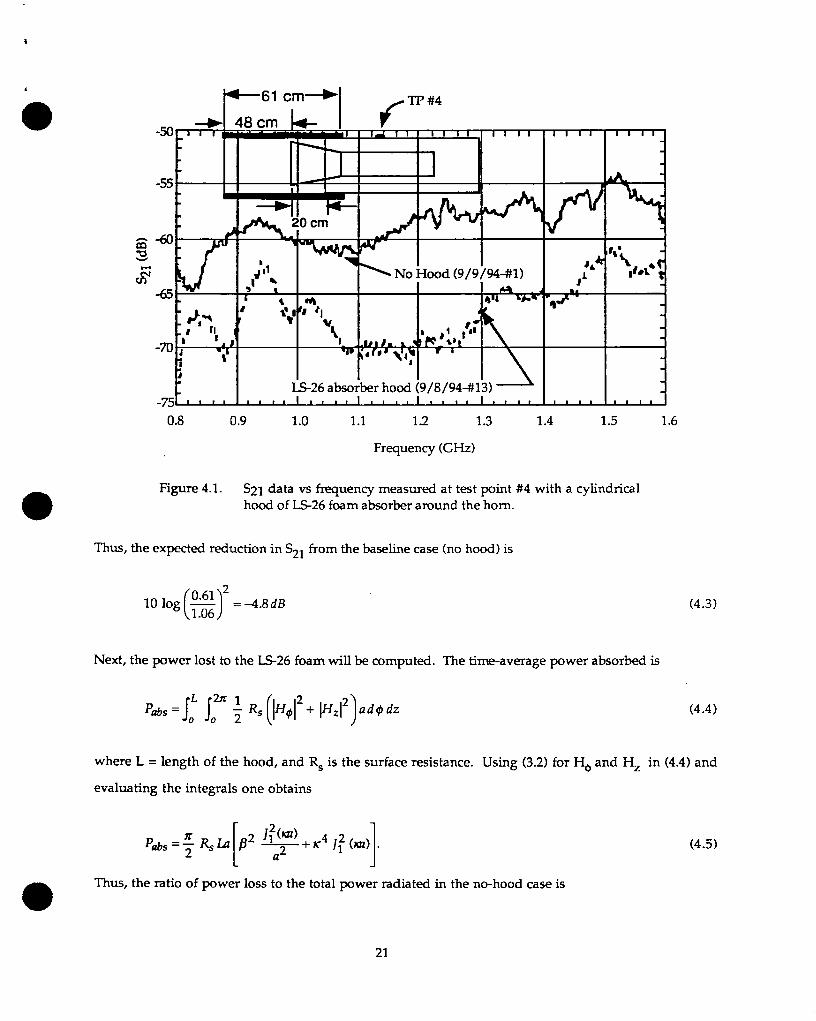
Figure 4.1 shows S21 data acquired with an MGL-7 B-dot sensor located at 0.35m from the edge of a
cylindrical tube of Emerson Curnings IS-26 absorber foam material, approximately 1/2 in thick. The
radiating horn extends about 0.2 m (8”) outside the tube, as illustrated in the inset. Thus, the distance
To from the center of the horn aperture to the location of the sensor (referred to as ‘TP #4”) is
ro =~(0.26)2 +(0.55)2 =0.61rn. (4.1)
The S21 values predicted by (3.12) with no hood, with O= z and r = r. = 0.61 m, are between -62.5 dB
and 41.5 dB @r 0.8 < ~(GHz) < 1.6, while the average measured values are about -60 dB for the no- ●hood case.
With the cylindrical hood of absorbing material attached
point (i.e., TP #4) is expected to be lower for two reasons:
as illustrated in fig. 4.1, S21 at the same test
● the radiating aperture is farther away from TP#4, and
● the power available for radiation is less because somepower is lost to the absorbing material.
IS-26 absorber foam material has a surface resistance about 47 ohms per square and a corresponding skin
depth at 1 GHz of about 1.2 cm, which is approximately the thickness of the absorber material used to
construct the hood.
Since the length of the hood beyond the edge of the tube is about 0.48m (or 19“), the distance of the
Bdot sensor from the center of the radiating aperture is now
~r = (0.26) + (1.03) = 1.06m (4.2) o20
,.. = .411 1A I I I I 1 I I I I I 1 I I I I I I I I 1 I I I
-55 ‘“ I I I 1~ I *
20 cm
f Ah ..— u“
-70
lm,n,lmtm*lm#m,ln#,tl, t,,l, snnln*mml@26 absorber hood (9/8/94-# 13) ~-75 1 1 , 1
0.8 0.9 1.0 1.1 1.2 1.3 1.4 1.5 1.6
Frequency (GHz)
Figure 4.1. S21 data vs frequency measured at test point #4 with a cylindricalhood of LS26 foam absorber around the horn.
Thus, the expected reduction in S21 from the baseline case (no hood) is
()0.61 210 log — = 4.8dB
1.06
Next, the power lost to the IS26 foam will be computed. The time-average power absorbed is
L2rlP&~ =
M 7 (1‘s 1%2+ lf-fz12)ad@dz00
(4.3)
(4.4)
where L = length of the hood, and R~ is the surface resistance. Using (3.2) for Ho and Hz in (4.4) and
evaluating the integrals one obtains
(4.5)
Thus, the ratio of power loss to the total power radiated in the no-hood case is
21

t.
z&=2. &s. L* 1 . (@)2+(KZZ)4P~ Z. a (/%)(k)(Ii#-1
where (3 -5) has been used for Pt.
Let us detlne an efficiency q as
~=l-y
Using R~ = 47~ f2 (j in GHz), L = 0.48rn, a = 0.26m one finds that
u
(4.6)
●
(4.7)
for 0.8
–1.4 dB
–1.3 > q (~) >–1.4 (4.8)
S ~(GHz) s 1.6. Thus the loss due to absorption by the 0.48 m long hood of LS-26 foam is only
for the frequency range of interest.
Adding the losses computed in (4.3) and (4.8), one obtains about -6.2 dB reduction from the no-hood case,
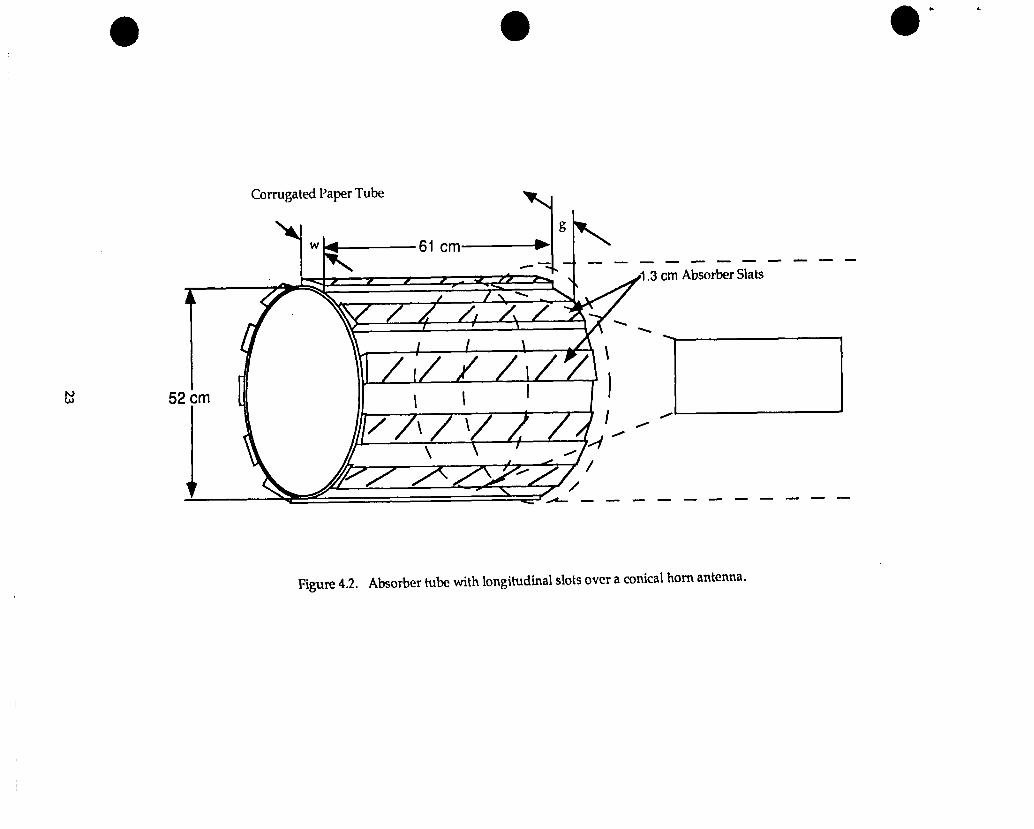
which ag-mes well with measurements (about –7 dB average), as shown in fig. 4.1. ●4.3 CYLINDRICAL ABSORBING HOOD WITH NOTCHES
In the preceding subsection it was seen that absorption in a cylindrical absorbing hood would reduce
backlobe radiation by only about 1.4dB. (The other 4.8dB reduction results from moving the radiating
aperture farther away from the MGL-7 sensor.) To have further reduction one has to think of using
other schemes. One such scheme is shown in fig. 4.2 where longitudinal slots are cut in the absorbing
hood, resulting in a cage of rectangular slats of absorber material separated by rectangular gaps which
function like an array of notch antennas.
Figure 4.3 shows a notch antenna in a half-plane sheet and its complementary strip monopole sitting on
the edge of a ha~-plane sheet. When the length h of the notch is an odd multiple of a quarter wave-
length, the notch antenna radiates efficiently into the forward direction. When the length is an even
multiple of a quarter wavelength, it will hardly radiate at all.
It is known [9, 11] that the radiation conductance G and susceptance B of a notch antenna are given by
22
. ... . .,..,,. . ,, . . .-. ... ,,,—.. .. ., .. . ..—
Corrugated Paper Tube
52
‘YIg
4‘e” ‘“=- - ——— ——— ——— —
1U...:(Y//\/\ /\ ,A”/ /
/A——
.3 cm
\
Absorber Slats
—— —— .— —— —
Fi~re 4.2. Absorber tube with longitudinal slots over a conical horn antenna.

(a) Notch and I@ivalcnt Circuit
z
x)’
I
(b) SIrip and Equivalent Circuit
z4
(c) Radiation I)attcrn
r-w=L+
V.
tY
Figure 4.3. Notch antenna, its cornplemcntaymonopolcona half-p]ane Shmt, and radiation pattern onthe z = O plane of a quarter-wavelength notch.
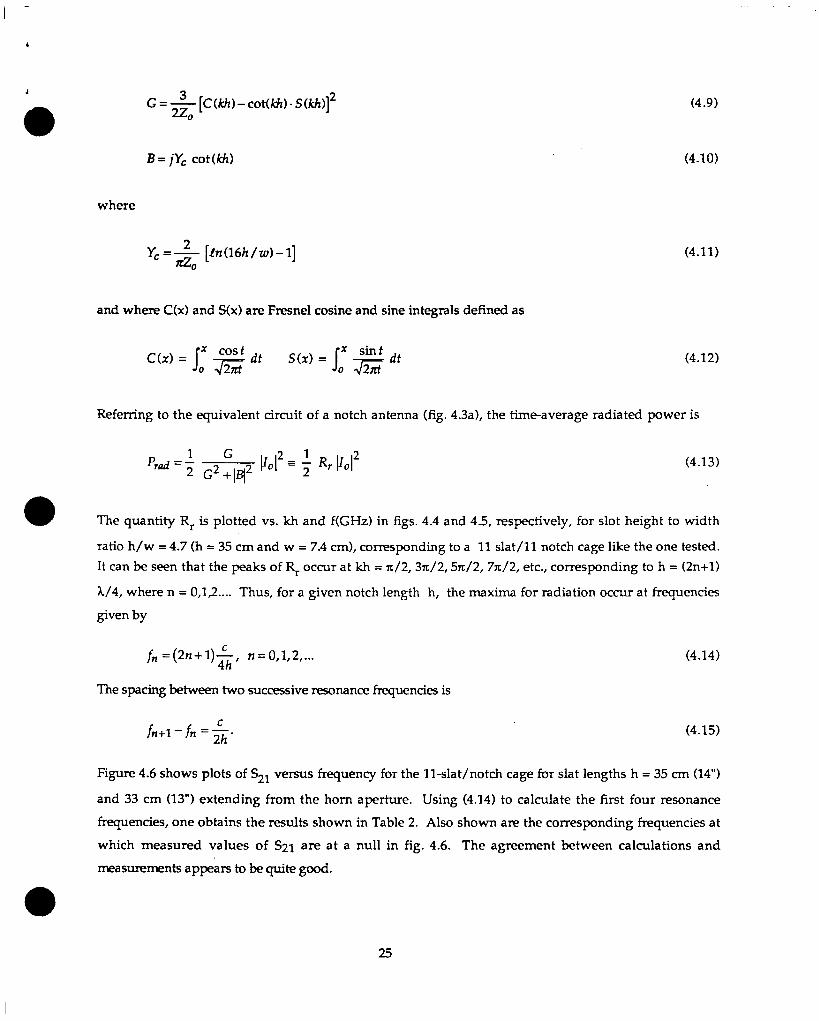
G=+ [C(kh)-cot(ti). S(kh)]2o
B= jYc cot(kh)
where
Yc = + [AI(16h/zu)-1]o
and where C(x) and S(x) are Fmsnel cosine and sine integrals defined as
c(x) = Jo~xCosf fit s(x)= Jo-J--Jx ‘tit dt
(4.9)
(4.10)
(4.11)
(4.12)
Referring to the equivalent circuit of a notch antenna (fig. 4.3a), the t-irn~average radiated power is
(4.13)
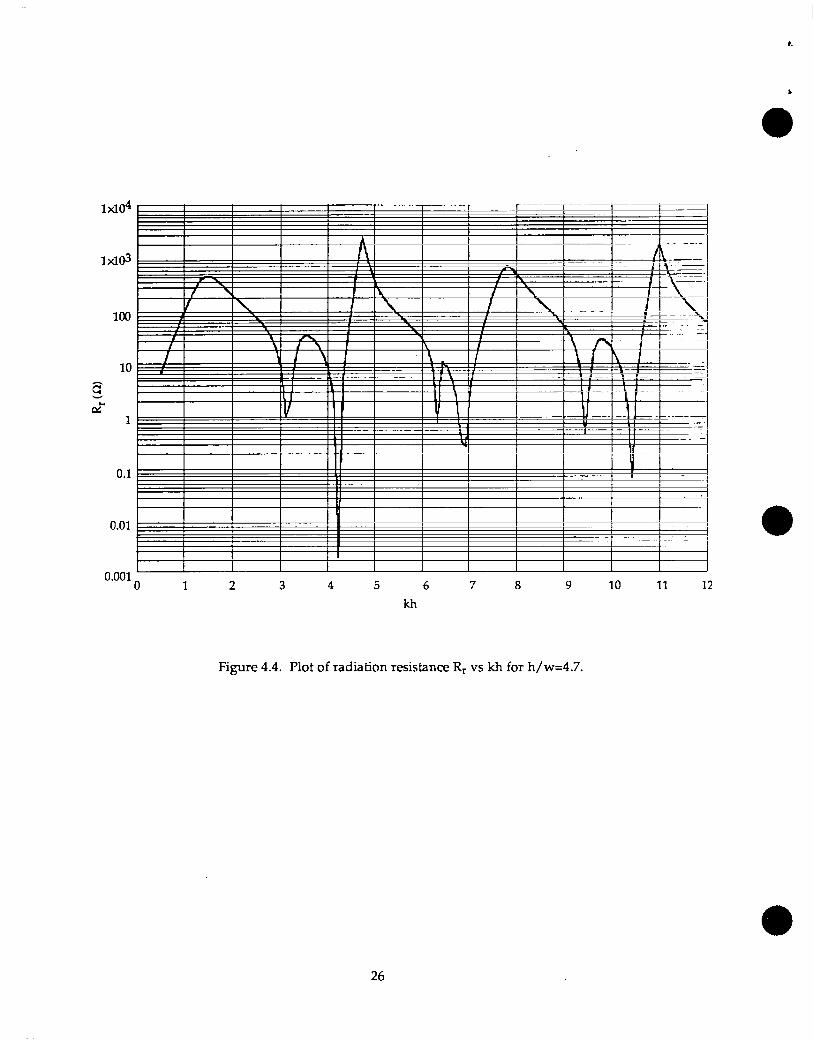
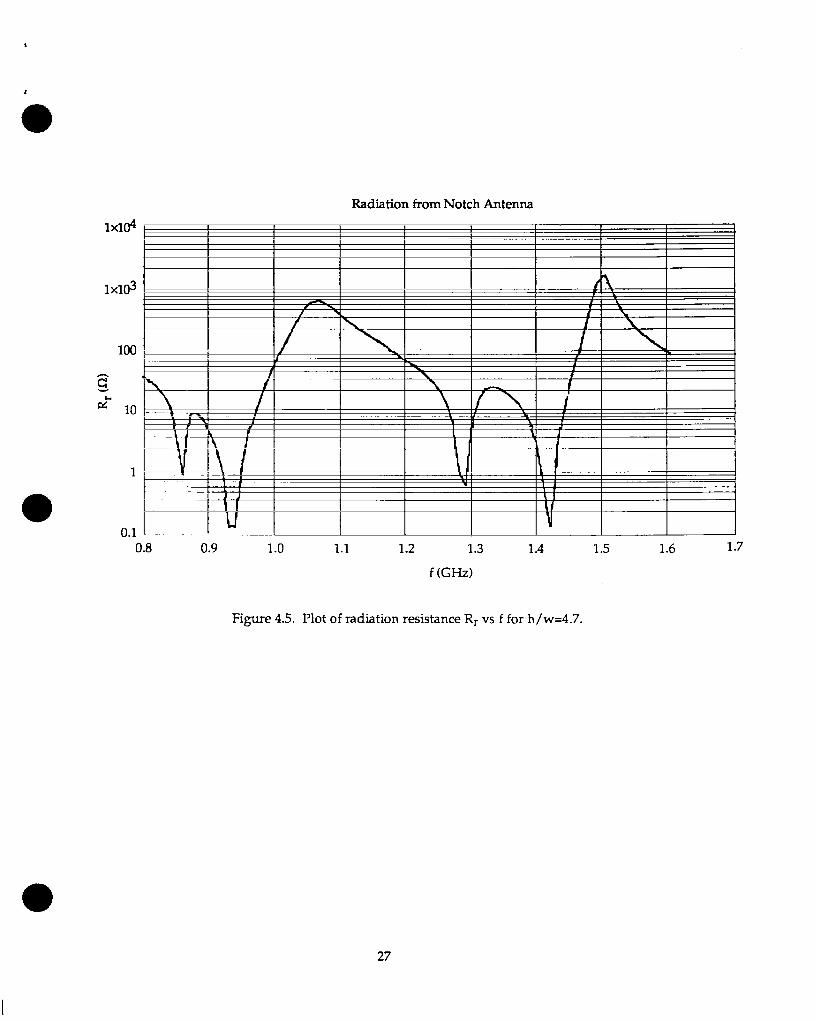
● The quantity Rr is plotted VS. kh and f(GHz) in figs. 4.4 and 4.5, respectively, for slot height to width
ratio h/w = 4.7 (h = 35 cm and w = 7.4 cm), corresponding to a 11 slat/11 notch cage like the one tested.
It can be seen that the peaks of F$ occur at kh = 7t/2, 3z/2, 5n/2, 7x/2, etc., corresponding to h = (2n+l)
~/4, where n = 0,1~.... Thus, for a given notch length h, the maxima for radiation occur at frequencies
given by
fn ‘(zn+l)~, n=0,1,2,... (4.14)
The spacing between two successive resonance frequencies is
fn+l-fn=$. (4.15)
Figure 4.6 shows plots of S21 versus frequency for the n-slat/notch cage for slat lengths h =35 cm (14”)
and 33 cm (13”) extending from the horn aperture. Using (4.14) to calculate the first four resonance
frequencies, one obtains the results shown in Table 2. Also shown are the corresponding frequencies at
which measured values of S21 are at a null in fig. 4.6. The agreement btween calculations and
measurements appears to be quite good.
25
1M04
lxl@
lal
10
1
0.1
0.01
0.001
1 la ,, , Iu-. I‘~r
1I —1!
I I I 11 I I I I J 1 I I
I I I If I I I I I
r[ r o
,[ J ! 1
1I I I I
I
o 1 2 3 4 5
kh
6 7 8 9 10 11 12
Figure 4.4. Plot of radiation resistance Rr vs kh for h/w=4.7.
26
1X10⁴
1X10³
100
g
‘k 10
1
0.1
Radiation from Notch Antenna
I 1 I I 1 1 1
I I I I I I I
0.8 0.9 1.0 1.1 1.2 1.3 1.4 1.5 1.6 1.7
f (GHz)
Figure 4.5. Plot of radiation resistance Rr vs f for h/w=4.7.
27

-50
-60
-70
-80
-90
-100
-110
1 I [ 1 !,lll! ,1,,,11111111111 11111 1 n # l“”-
. ............. ............ ...*W.. ...+...........”.. -1
;3:1;~l:~;aM~*13,14 0.8 0.9 1 1.1 1.2 1.3 1.4 1.5 1.6
Figure 4.6.
We now calculate the S21
/.
Frequency (GHz)
Test point #4 S21 signal vs frequency with n-slat cageextending 33 cm and 36 cm beyond the edge of the horn.
parameter. (3.12) can be r~written as follows:
[y]+ ’”’0g(Gf2)-’”+’”’0g(:)+’”’og~S21M3)=lo log z
Table 2. Comparison of Notch Resomnces and Measurement Nulls.
(4.16)
I h =35 cm (14in) 1 h =33 cm (13in) INotch Notch
n Rewnance S21 Measurement Resonance S21 MeasurementFrequency (GHz) Null (GHz) Frequency (GHz) Null (GHz)
o 0.21 0.23
1 0.64 0.68
2 1.07 1.04 1.14 1.1
3 1.50 1.46 1.59 1.56
28

a where the distance r. from the sensor location to the center of the horn aperture was calculated in (4.1)
● to be 0.61 m. The first three terms of (4.16) give the value of S21 for the baseline configuration, and the
last two terms represent, respectively, the reduction due to increased distance r from the aperture and
to a combimtion of absorption loss and radiation 10SS from the notchm (accounted for in the efficiency
factor q).
For the case where the slats are 0.35 m (or 14”) long, r = 0.94 m, one has
2010g(:)=2010g(%)= -376dBJ(4.17)
Thus, the reduction in S21 from the baseline configuration due to the increased distance is 3.76 dB.
To calculate q one first calculates the radiation loss from the notches and then the absorption by the
L926 slats. Since G and B for the notch were already determined in (4.9) and (4.10), one only needs to
calculate 10 for (4.13). As shown in fig. 4.3, 10 is the current at the “mouth” of the notch driving the
notch antenm and is thus related to the product of the notch width w and Hz at the mouth (i.e.,
10 = 2W Hz). If Hz is taken to be the z-component of the H-field of the TEl ~ mode (see (3.2)), one then
●has
(4.18)
where Pt is the total radiated power in the baseline case and is given by (3.5). Since there are as many
notches as slats, the integral of COS2$ over all notches will be z/2. Hence (4.18) becomes
@d+z128 u) 2 (m)4()P* ‘~ ; (m)2_l
2.808 X 104
= f2J-
1
/!k.kx
(fin GHz)
(4.19)
Assuming each of the 11 notches radiates incoherently, the total power loss, Prad, due to radiation from
the notches with respect to the total power F’t available for radiation in the baseline case is (see (4.13))
29
1
1.544 x io-3Rr
= fq-
*
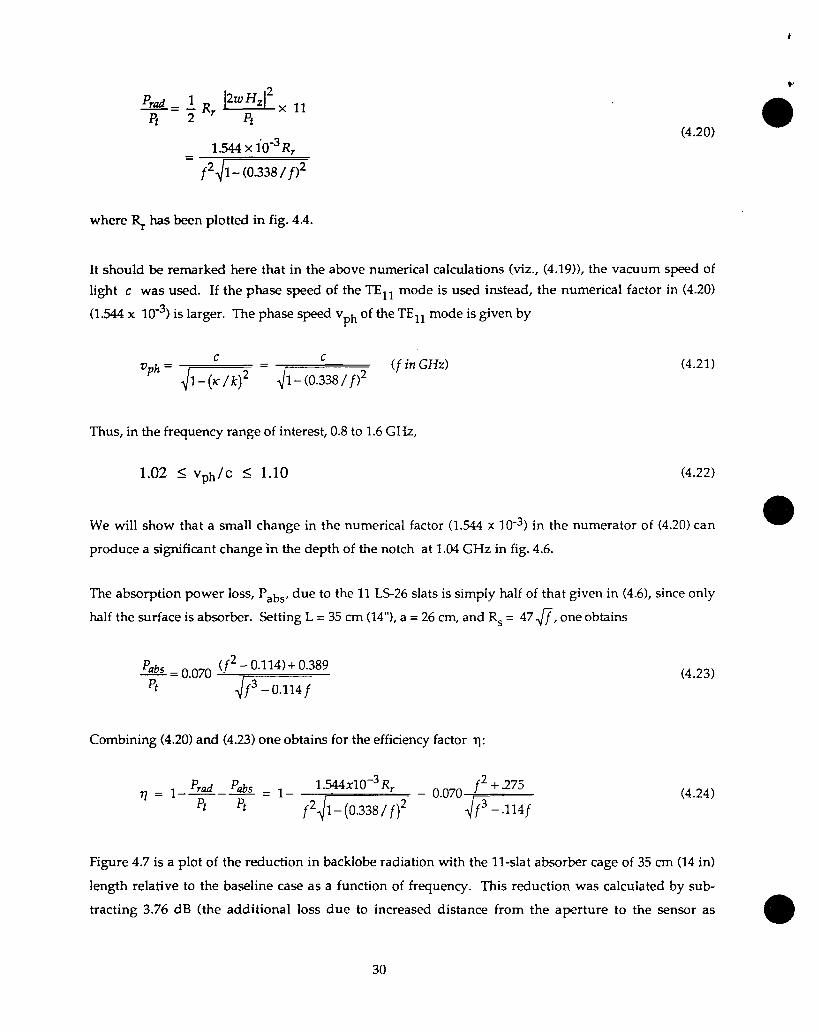
(4.20)a
where ~ has been plotted in fig. 4.4.
It should be remarked here that in the above numerical calculations (viz., (4.19)), the vacuum speed of
light c was used. If the phase speed of the TEII mode is used instead, the numerical factor in (4.20)
(1.544 x 10⁻³) is larger. The pha= speed vPh of the TEll mode is given by
(4.21)
Thus, in the frequency range of interest, 0.8 to 1.6 GHz,
1.02 < vPh/c < 1.10 (4.22)
We will show that a small change in the numerical factor (1.544 x 10⁻³) in the numerator of (4.20) can a
produce a significant change in the depth of the notch at 1.04 GHz in fig. 4.6.
The absorption power loss, Pab~, due to the 11 LS-26 slats is simply half of that given in (4.6), since only
half the surface is absorber. Setting L = 35 cm (14”), a = 26 cm, and R~ = 47 ~, one obtains
Combining (4.20) and (4.23) one obtains for the efficiency factor q:
1.544 X1O-3 l?, 2 + .275~ = l–~–% = 1– _ — 0.070 ,f.
Pi r
(4.23)
(4.24)q
f2+ -(0.338/f)z Jfj-.ll4f
the reduction in backlobe radiation with the Ii-slat absorber cage of 35 cm (14 in)
baseline case as a function of frequency. This reduction was calculated by sub-
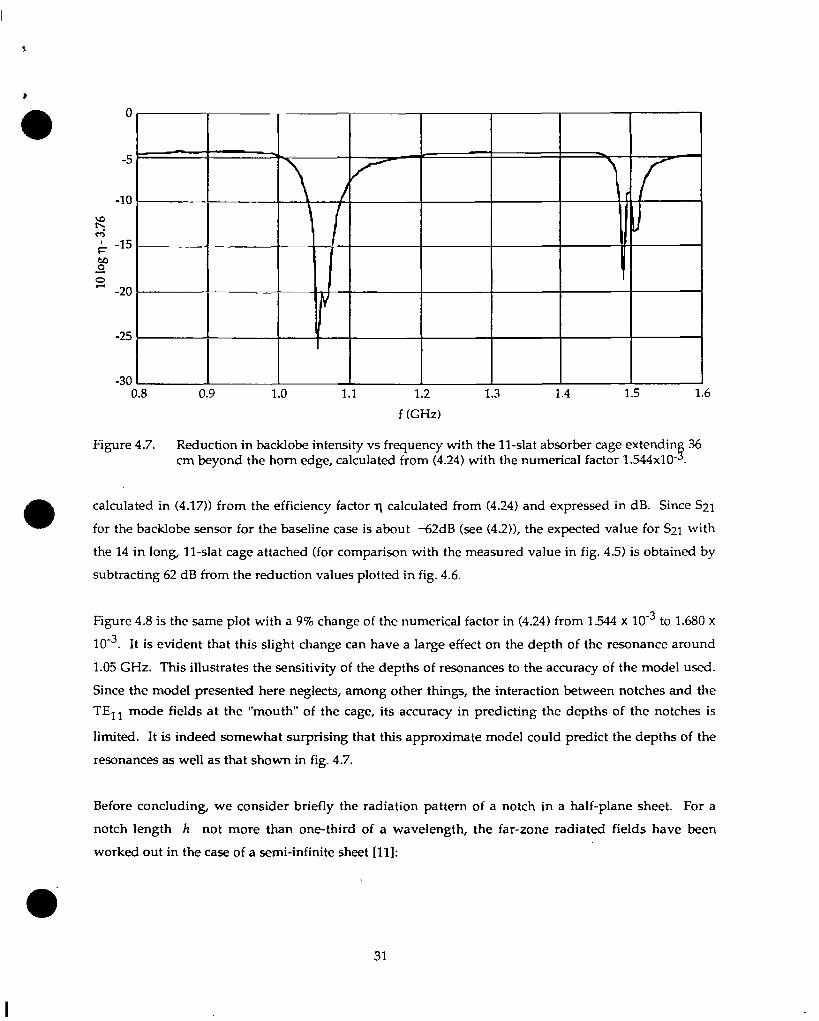
Figure 4.7 is a plot of
length relative to the
tracting 3.76 dB (the additional loss due to increased distance from the aperture to the sensor asm
30
o
+ ,.-
-10—— ——a \ht+; -15 - — .
_?o- -20 —
-25I
-300.8 0.9- 1.0 1.1 1.2 1.3 1.4 1.5 1.6
f (GHz)
Figure 4.7. Reduction in backlobe intensity vs frequency with the 1l-slat abwrber cage extendin 365cm beyond the horn edge, calculated from (4.24) with the numerical factor 1.W4X10- .
●calculated in (4.17)) from the efficiency factor q calculated from (4.24) and expressed in dB. Since S21
for the backlobe sensor for the baseline case is about -62dB (see (4.2)), the expected value for S21 with
the 14 in Ion& 1l-slat cage attached (for comparison with the measured value in fig. 4.5) is obtained by
subtracting 62 dB from the reduction values plotted in fig. 4.6.
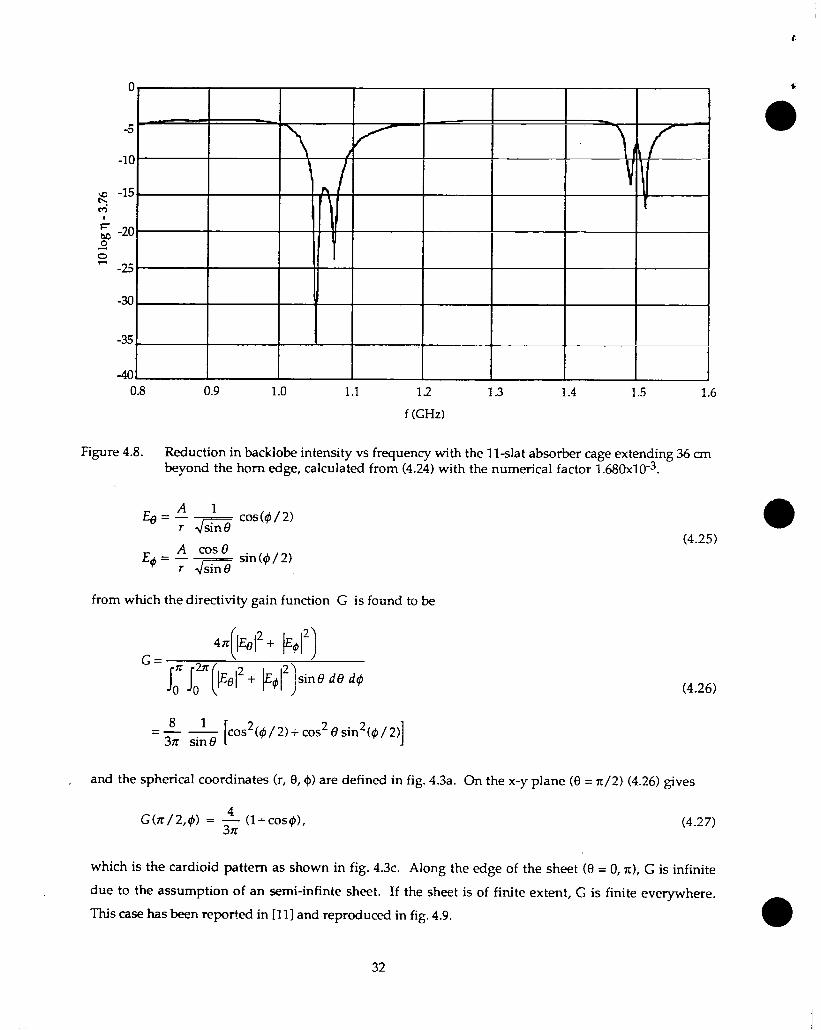
Figure 4.8 is the same plot with a 9% change of the numerical factor in (4.24) from 1.544 x 10⁻³ to 1.680 x
10-3. It is evident that this slight change can have a large effect on the depth of the resonance around
1.05 GHz. This illustrates the sensitivity of the depths of resonances to the accuracy of the model used.
Since the model presented here neglects, among other things, the interaction between notches and the
TEI ~ mode fields at the “mouth” of the cage, its accuracy in predicting the depths of the notches is
limited. It is indeed somewhat surprising that this approximate model could predict the depths of the
resonances as well as that shown in fig. 4.7.
Before concluding, we consider briefly the radiation pattern of a notch in a half-plane sheet. For a
notch length h not more than one-third of a wavelength, the far-zone radiated fields have been
worked out in the case of a semi-infinite sheet [11]:
31
0.8 0.9 1.0 1.1 1.2 1.3 1.4 1.5 1.6
f (GHz)
Figure 4.8. Reduction in backlobe intensity vs frequency with the 1l-slat absorber cage extending 36 cmbeyond the horn edge, calculated from (4.24) with the numerical factor 1.680x10³.
from which the directivity gain function G is found to be
(4.25)
(4.26)
81.——3X sin 9
[cos2(@/2)+cos26 sin2(@ / 2)]
and the spherical coordinates (r, (3,$) are defined in fig. 4.3a. On the x-y plane ((3 = 7c/2) (4.26) gives
G(n/2,@) = ~ (1+ cos~), (4.27)
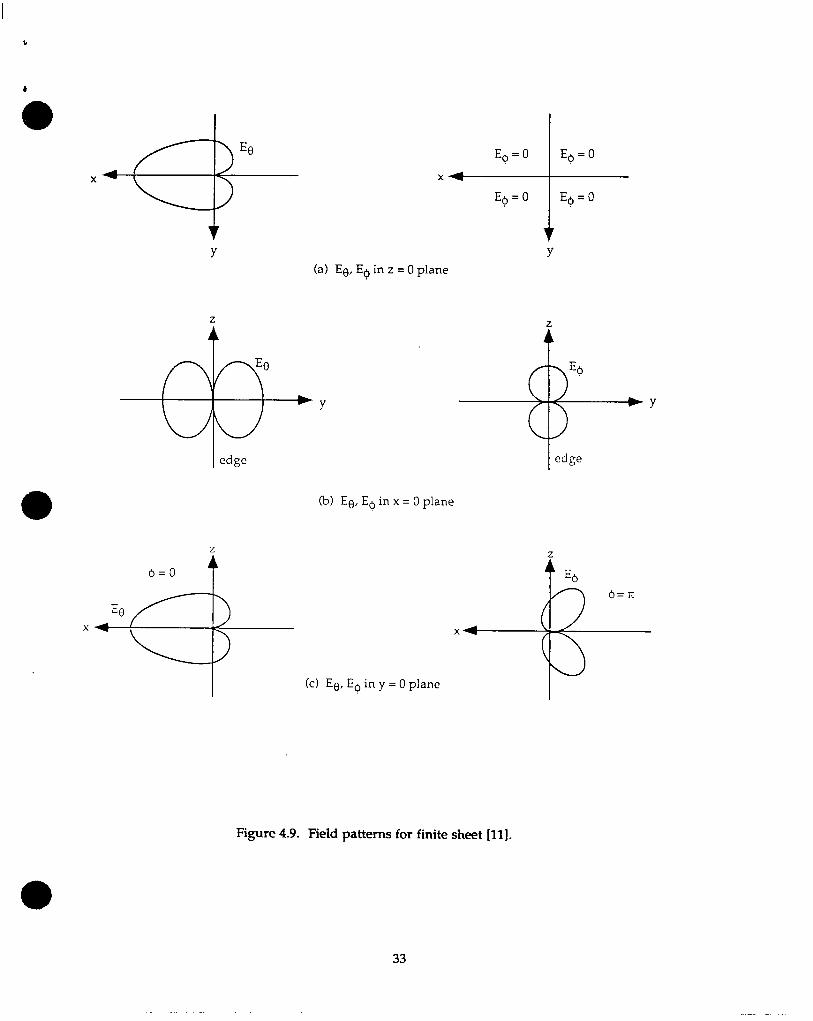
which is the cardioid pattern as shown in fig. 4.3c. Along the edge of the sheet ((l = O, z), G is infinite
due to the assumption of an semi-infinte sheet. If the sheet is of finite extent, G is finite everywhere.
This case has been reported in [11] and reproduced in fig. 4.9.
32
L
E6=0 E6=0
X4
E6=0 E6=0
(a) Ee, EO in z = Oplane
z z
Eb
WY
edge
(b) Ee,Ebin x = Oplane
z
6=0t
(c) Ee, Edin y = Oplane
L
+ E6
Figure 4.9. Field patterns for finite sheet [11 ].
33
5.0 SUMMARY AND CONCLUSIONS
This paper has considered techniques for reducing backlobe and sidelobe emissions from a coNcal horn
antenna. We discussed three general techniques which either absorb or re-direct back- and side- lobe
emissions
1.) modification of horn design, particularly the edges, to minimize diffraction,
2.) the use of a cylinder of RF absorber material over the horn.
3.) attachment of a device to re-direct diffracted rays
3.1 conducting strips
3.2 tapered conducting strips
3.3 resistively loaded tapered conducting strips
Dual mode horns, cormgated horns, and aperture matched horns were considered as examples of
approach (l). Since the diffracted fields depend on both the edge diffraction coefficient and the mag-
nitude of the field at the edge of the horn, reduction in either can be effective in reducing backlobe
emission. Dual mode horns and corrugated horns are designed to reduce the magnitude of the fields at
the horn edge, while the aperture matched horn is designed to reduce the magnitude of the edge
diffraction coefficient.e
In Section 2 we discussed the general implementation of approach (2) using a device consisting of long,
tapered strips of conducting material attached to the edge of the horn. By replacing the horn edges,
which are normal to the incident rays, by edges nearly parallel to the incident rays, the diffracted
rays are re-directed to the forward direction, as can be seen by considering the Keller’s cones of edge-
diffracted rays. We also discussed the use of tapered strips of absorbing materials either in place of or
in addition to the tapered conducting strips to provide a more gradual transition from the horn aperture
to free space and thus reduce the standing waves inside the cage of tapered strips. However, the sheet
resistance needs to be lowered and experimentally optimized (including shape).
Surrounding the horn with radar absorbing material has been shown in the literature to bean effective
way to achieve up to 10 dB reduction in sidelobes and back-lobes from an aperture antenm by simply
absorbing RF energy radiated in these directions. Applying radar absorber materials to the aperture
edges has also been shown to be as effective.
In Sections 3 and 4 we discussed at some length the implementation of a slotted absorber
redirecting side- and back-iobe emissions, i.e. approach (2). The device consists of an
2
hood for
array of 9

L
& rectangular notches around the horn, parallel to the horn axis.
●Its effectiveness in reducing backlobe
emission, compared to that of the horn alone, was demonstrated both amlytically and experimentally.
We showed that, at a particular frequency, notches with lengths equal to an odd multiple of a quarter
wavelength will radiate mainly into the forward direction, augmenting the main lobe radiated by the
horn and reducing the radiation into the back lobe but with little effect on the side lobes.. Because it is
a resomnt structure, it is useful mainly for narrowband applications. The device considered in Section 2
with tapered conducting strips and tapered notches, however, does not depend upon resonance effects
and therefore has broadband applicability.
This technique for reducing radiation in unwanted direction is similar in function to an opaque lamp
shade. At microwave wavelengths (as compared to optical wavelengths), however, the diffraction at
the edge of the shade is much more significant. A microwave shade is greatly improved by treatment
of the shade edge as discussed in this paper, with perhaps even further future refinements.
The discussions in this paper were limited to a conical horn antenna, but the concepts presented should
apply generally to any aperture antema, including other horns (pyramidal, TEM, etc. ) and reflectors.
35
L
REFERENCES 4
●1. P. D. Potter, “A new antenna with suppressed sidelobes and equal beamwidths,” Microwave
Journal, June, 1965.
2. R. E. Lawrie and L. Peters, Jr., “Modifications for horn antennas for low sidelobe levels,”EEE Trans. Antennas Propagat., vol. M-14, no. 5, pp. 605-610, Sept., 1966.
3. W. D. Burnside and C. W. Chuang, “An Aperture-Matched Horn Design;’
4. L. Peters, Jr. and R. C. Rudduck, “RFI Reduction by Control of Antenna Sidelobes,” RADC-TDR-63-133, May, 1963.
5. J. B. Keller, “Diffraction by an Aperture,” Journal of Applied Physics, Vol 28, No. 4, pp 426-444,April, 1957.
6. Y. T. Lo and S. W. Lee, Antenna Handbook: Theory, Applications, and Design, Van NostrandREinhold Company, New York, NY, 1988.
7. T. T. Wu and R.W.P. King, “The Cylindrical Antenna with Non-Reflecting Resistive Loadin&”IEEE Trans. on Antennas and Propagation, AP-13, Nov., 1965.
8. S. Ramo and J. R. Whinnery, Fields and Waves in Modem Radio, Second Edition, John Wiley andSons, New York, 1953, page 322.
9. S. Silver, Microwave Antenna T’heorv and Desire, MIT Radiation Laboratory Series,vol. 12, McGraw-Hill, New York, 1949.
10. Henry Jasik (editor), Antenna Entineeerin~ Handbook, McGraw-Hill, New York, 1961.
11. W. A. Johnson, ‘The Notch Aeriel and Some Applications to Aircraft Radio Installations,” Proc.IEE (London), pt. B, vol. 102, pp. 211-218, March 1955.
36
— -—.-...—. ... . . . , .—. .,,— ,,..—. -. .,———. ., --.,. . ,,, ,,..,,, . . . ... .,,..,,--,.,,,,, ,,,--, - ,, .. -..,,,, , ,---,., . , .-., , , . .,,. , ,,,, —