Supporting Online Material Materials and Methods · Supporting Online Material Materials and...
26
1 Supporting Online Material Materials and Methods Sources of data on VMAD specifically for the US and Canada, Europe and former Soviet Union are presented in S1. Data on VMAD for the 153 LRSs unassessed in S1 were compiled from: • F. van der Leeden, Water resources of the world (Geraghty & Miller, Inc., New York, 1975). • Global Hydrology Research Group, Univ. of New Hampshire, USA (http://eos- webster.sr.unh.edu/data_guides/ghaas_usa_dg.jsp). • J. D. Milliman, C. M. Rutkowski and M. Meybeck. "River Discharge to the Sea, A Global River Index (GLORI)" (LOICZ Reports & Studies No. 2., 1995). • State Hydrological Institute, Russia and UNESCO, World Water Resources and Their Use, St. Petersburg, Russia, 1999 (http://espejo.unesco.org.uy/index.html ). • Swedish Meteorological and Hydrological Institute. • The Global Runoff Data Centre, D - 56002 Koblenz, Germany (http://www.rivdis.sr.unh.edu/maps ). • United Nations Environment Programme, GEMS/WATER, Global Environment Monitoring System. • World Wildlife Federation (http://www.worldwildlife.org ). Additional data on VMD for Mexico and Central America were compiled from: • Association de Biologos y Ecologos de Nicaragua. • Comision Nacional del Agua, Mexico. Additional data on VMD for South America were compiled from: • Agencia Nacional de Energia Electrica, Brazil. • Centre d’ecologie des ressources renouvables, French National Centre for Scientific Research (CNRS). • Comite Argentino de Grandes Presas, Argentina. • ComitØ Venezolano de Grande Presas, Venezuela. • Corporacion Nacional Forestal, Chile. • Instituto de la Patagonia, Univ. de Magallanes, Chile. • Instituto de Zoologia, Univ. Austral de Chile, Chile. • Instituto Nacional de Meteorologica e Hidrologica, INAMHI, Ecuador. • Meteorologia y Adecuacion de Tierras, Himat, Colombia. Additional data on VMD for Asia (excluding Russia) and Australasia were compiled from: • A. W. Jayawardena, K. Takeuchi, B. Machbub, Eds., Catalogue of Rivers for Southeast Asia and the Pacific Volume II (The UNESCO-IHP Regional Steering Committee for Southeast Asia and the Pacific, December 1997).
Transcript of Supporting Online Material Materials and Methods · Supporting Online Material Materials and...

1
Supporting Online Material
Materials and Methods Sources of data on VMAD specifically for the US and Canada, Europe and former Soviet Union are presented in S1. Data on VMAD for the 153 LRSs unassessed in S1 were compiled from:
• F. van der Leeden, Water resources of the world (Geraghty & Miller, Inc., New York, 1975).
• Global Hydrology Research Group, Univ. of New Hampshire, USA (http://eos-webster.sr.unh.edu/data_guides/ghaas_usa_dg.jsp).
• J. D. Milliman, C. M. Rutkowski and M. Meybeck. "River Discharge to the Sea, A Global River Index (GLORI)" (LOICZ Reports & Studies No. 2., 1995).
• State Hydrological Institute, Russia and UNESCO, World Water Resources and Their Use, St. Petersburg, Russia, 1999 (http://espejo.unesco.org.uy/index.html).
• Swedish Meteorological and Hydrological Institute. • The Global Runoff Data Centre, D - 56002 Koblenz, Germany
(http://www.rivdis.sr.unh.edu/maps). • United Nations Environment Programme, GEMS/WATER, Global Environment
Monitoring System. • World Wildlife Federation (http://www.worldwildlife.org).
Additional data on VMD for Mexico and Central America were compiled from:
• Association de Biologos y Ecologos de Nicaragua. • Comision Nacional del Agua, Mexico.
Additional data on VMD for South America were compiled from: • Agencia Nacional de Energia Electrica, Brazil. • Centre d'ecologie des ressources renouvables, French National Centre for Scientific
Research (CNRS). • Comite Argentino de Grandes Presas, Argentina. • Comité Venezolano de Grande Presas, Venezuela. • Corporacion Nacional Forestal, Chile. • Instituto de la Patagonia, Univ. de Magallanes, Chile. • Instituto de Zoologia, Univ. Austral de Chile, Chile. • Instituto Nacional de Meteorologica e Hidrologica, INAMHI, Ecuador. • Meteorologia y Adecuacion de Tierras, Himat, Colombia.
Additional data on VMD for Asia (excluding Russia) and Australasia were compiled from:
• A. W. Jayawardena, K. Takeuchi, B. Machbub, Eds., Catalogue of Rivers for Southeast Asia and the Pacific � Volume II (The UNESCO-IHP Regional Steering Committee for Southeast Asia and the Pacific, December 1997).

2
• Agency for the Assessment and Application of Technology, Republic of Indonesia. • B. C. Jiao, Ed., A Collection of Physical Geographic Maps of China, Version II
(China Cartographic Publishing House, 1997). • Bangladesh Water Development Board. • Chinese Bureau of Hydrology. • Department of Environment and Conservation, Bureau of Water Resources, Papua
New Guinea. • Department of Irrigation and Drainage, Malaysia. • Department of Meteorology and Hydrology, Government of the Union of Myanmar. • Encyclopaedia of Chinese Agriculture, Water Resource and Conservancy I (Chinese
Agriculture Press, China, 1998). • Institute of Water Modeling, Dhaka, Bangladesh • K. Takeuchi, A. W. Jayawardena, Y. Takahasi, Eds., Catalogue of Rivers for
Southeast Asia and the Pacific � Volume I (The UNESCO-IHP Regional Steering Committee for Southeast Asia and the Pacific, October 1995).
• Korea Water Resources Corporation. • L. A. J. Al-Hassan, Shad Journal 4,1 (1999). • Land-Ocean Interactions in the Coastal Zone (LOICZ) Typology Dataset
(http://wwwold.nioz.nl/loicz/data.htm). • Loyola College of Social Sciences, Kerala, India. • M. Murakami. Managing Water for Peace in the Middle East: Alternative
Strategies (UNU Press, Tokyo - New York - Paris, 1995). • Mekong River Commission (www.mrcmekong.org). • Murray-Darling Basin Commission, Australia (http://www.mdbc.gov.au). • National Water Resources Board, Republic of the Philippines. • New Zealand Hydrological Society. • New Zealand Society on Large Dams. • Public Works Research Institute, Ministry of Construction, Government of Japan. • S. Swales, paper presented at Blue Millennium: Managing Global Fisheries for
Biodiversity. Victoria, BC, Canada, June 2001. (http://www.worldfish.org). • United Nations Environment Programme, Regional Resource Centre for Asia and
the Pacific, State of the Environment Report � Vietnam 2001 (http://www.rrcap.unep.org/reports/soe/vietnam/index.html).
• V. Udomchoke and P. Angsurattana, paper presented at the Tsukuba Asian Seminar on Agricultural Education (TASAE), Japan, October 2002 (http://www.nourin.tsukuba.ac.jp/~tasae/2002/Thai_2002.pdf).
• Z. Y. Qian, Ed., China�s Water Resource and Conservancy (China Water Power Press, 1991).
Additional data on VMD for Africa were compiled from:
• Direction Generale de l'Energie. Brazzaville, Congo. • Direction Generale de l'Hydraulique. Bangui, Central African Republic. • Direction Nationale de la Gestion Des Ressources en Eau. Conakry, Guinea.

3
• Discharge of selected rivers of Africa (UNESCO, Paris, 1995). • Hydrological Research Centre. Yaoundé, Cameroon. • Nile Basin Initiative, Uganda; formerly known as the Technical Co-operation for
the Promotion of the Development and Environmental Protection of the Nile Basin (http://www.nilebasin.org).
• Water Research Institute, Accra, Ghana. • Zimbabwe Committee on Large Dams. Causeway, Zimbabwe.
Data on channel fragmentation and flow regulation specifically for the US and Canada, Europe and former Soviet Union are presented in S1. Data on channel fragmentation and flow regulation for the 153 LRSs unasessed in S1 were compiled from:
• World Register of Dams (electronic versions, International Commission on Large Dams, Paris, 1998, 2003).
• International Journal on Hydropower and Dams (World Atlas 1998, 1999, 2000, 2001, 2002, 2003. Aqua-Media International, Sutton, Surrey, UK).
• International Rivers Network (www.irn.org). • Operational Navigation Charts, edition 5 (Defense Mapping Agency, Aerospace
center, St Louis AFS, Missouri, USA). • F. van der Leeden, Water resources of the world (Geraghty & Miller, Inc., New
York, 1975). • The Times Atlas of the World - Comprehensive ed. (Times Books, London, 1997).
Additional data on channel fragmentation and flow regulation for Mexico and Central America were compiled from:
• Instituto Nicaraguense de Estudios Territoriales. • Instituto Geografico Nacional, Guatemala. • Comision Ejecutiva Hidroelectrica del Rio Lempa, El Salvador. • Energia de Honduras. • Instituto Costarricense de Electricidad.
Additional data on channel fragmentation and flow regulation for South America were compiled from:
• Comitê Brasileiro de Grandes Barragens, Brazil (http://www.cbgb.org.br/). • Comité Venezolano de Grande Presas. • Eletronorte, Brazil (http://www.eln.gov.br/home28.htm#). • Furnas, Brazil (http://www.furnas.com.br). • Instituto Nacional de Meteorologica e Hidrologica, INAMHI, Ecuador. • International Commission on Irrigation and Drainage, ICID Colombia. • Itaipu Binacional, Brazil and Paraguay, (http://www.itaipu.gov.br/homeing.htm). • Ministry of economy and public works and services, Argentina
(http://www.mecon.ar).

4
• Subgerencia de Ingeniería de Presas y Embalse, UTE, Uruguay. Data on dams for Asia (excluding Russia) and Australasia were compiled from:
• �China�s dams� (China Ministry of Water Resource, internal reference, 1980). • Annals of Haihe I (China Water Power Press, 1998). • Annals of Hanzhong Water Resource and Conservancy (Shaanxi People�s Press,
1994). • Annals of Water Conservancy in Deqing County (Hangzhou Univ. Press, 1995). • Annals of Water Conservancy in Eryuan County (Yunnan Univ. Press; 1995). • Annals of Water Conservancy in Fushun City (Liaoning People�s Press, 1994). • Annals of Water Resource and Conservancy in Guangzhou (Guangong Science
Publishing, 1991). • Annals of Water Resource and Conservancy in Hongdong County (Shanxi People�s
Press, 1993). • Annals of Water Resource and Conservancy in Huanggang (China Water Power
Press, 1997). • Annals of Water Resource and Conservancy in Huzhou (China Encyclopaedia
Press, 1995). • Annals of Water Resource and Conservancy in Jieyang County (Guangdong
Science Press, 1992). • Annals of Water Resource and Conservancy in Luquan Miaozu and Yizu
Autonomous County (Yunnan Nationality Press, 1993). • Annals of Water Resource and Conservancy in Ninglang Yizu Autonomous County
(Yunnan Univ. Press, 1995). • Annals of Water Resource and Conservancy in Ningxia (Ningxia People�s Press,
1992). • Annals of Water Resource and Conservancy in Shandong (Hehai Univ. Press,
1995). • Annals of Water Resource and Conservancy in Shangyu City (China Water Power
Press, 1997). • Annals of Water Resource and Conservancy in Simao Region (Yunnan Nationality
Press, 1997). • Annals of Water Resource and Conservancy in Yizheng (Jiangsu Science Press,
1995). • Annals of Water Resource and Conservancy in Yueqing (Hehai Univ. Press, 1998). • Annals of Water Resource and Conservancy in Zhejiang Province (China Book
House, 1998). • Annals of Zhujiang (Guandong Science Press, 1995). • Atlas of Chongqing City (Chengdu Cartographic Publishing House, 1998). • Atlas of Guandong Province (Guandong Cartographic Publishing House, 1997). • Atlas of Hubei Province (Hunan Cartographic Publishing House, 1996). • Atlas of Hunan Province Version V (Hunan Cartographic Publishing House, 1998). • Atlas of Jiangsu Province (Guangdong Cartographic Publishing House, 1998).

5
• Atlas of Jiangxi Province (China Cartographic Association, 1993). • Atlas of Shganxi Province (Shandong Cartographic Publishing House, 1994). • Atlas of Sichuan Province (Chengdu Cartographic Publishing House, 1997). • Atlas of Xingjiang Uygur Autonomous Region Version II (Xian Cartographic
Publishing House, 1999). • Atlas of Yunnan Province (China Cartographic Publishing House,1999). • Atlas of Zhejiang Province (China Cartography Association, 1998). • B. C. Jiao, Ed., A Collection of Physical Geographic Maps of China Version II
(China Cartographic Publishing House, 1997). • Chinese River Flood Control Series: Huaihe (China Water Power Press, 1995). • Contemporary Constructions of Water Resource and Conservancy in Guangxi
(1959�1993) (Contemporary China Press, 1997). • Electricité de Laos. • Electricity Generating Authority of Thailand. • Encyclopaedia of Chinese Agriculture (Water Resource and Conservancy I)
(Chinese Agriculture Press 1998). • History of Water Resource and Conservancy Development in Luliang County
(Yunnan Nationality Press, 1997). • J. F. Xue, Ed., Flood Controls in Chinese Rivers Series: Zhu Jiang (China Water
Power Press, 1995). • Kerala State Electricity Board, India (www.kseboard.org). • Map of Guangxi Province Version III (China Cartographic Publishing House,
1997). • Map of Guizhou Province Version I (China Cartographic Publishing House, 1997). • Practical Atlas of Liaoning Province (Harbin Cartographic Publishing House,
1998). • S. T. Wu, Annals of Oujiang (China Water Power Press, 1992). • X. G. Chen, Ed., Technology of Huanghe Hydropower Engineering (Huanghe
Resource and Conservancy Publishing, 1997). • Z. Y. Qian, Ed., China�s Water Resource and Conservancy (China Water Power
Press, 1991). • Z. Y. Qian, Ed., Illustrated Encyclopaedia of Water Resource and Conservancy in
China (China Water Power Press, 1991). • Z. Y. Qian, Ed., Illustrated Encyclopaedia of Water Resource and Conservancy in
China (China Water Power Press, 1991). • Z. H. Wang, Ed., Annals of Water Resource and Conservancy in Jinhua City (China
Water Power Press 1996). • Z. Y. Wang, X. R.Gao, X. L. Liu and L. Tian, �Instructions for flood control in
Henan Province� (Headquarter of flood control Hennan Province, internal reference, 1994).

6
Additional data on channel fragmentation and flow regulation for Africa were compiled from:
• Department of Water Affairs and Forestry, Pretoria, South Africa. • Direccao Nacional de Aguas, Maputo, Mozambique. • Direction de l'Electricite et des Energies Nouveles et Renouvelables, Niamey,
Niger. • Direction Generale de l'Energie et des Ressources Hydraliques, Libreville, Gabon. • Direction Generale de l'Energie, Brazzaville, Congo. • Direction Nationale de l'Hydraulique et de l'Energie, Bamako, Mali. • Electicity Supply Commission of Malawi, Blantyre, Malawi. • Empresa Nacional de Electricidade, Luanda, Angola. • Environmental Defense Fund, New York, USA. • Environmental Monitoring Group, Wynberg, South Africa. • Food and Agriculture Organisation of the United Nations, Geo-referenced database
on African dams, Rome, 1996. • Jiro sy Rano Malagasy, Antananarivo, Madagascar. • Lesotho Committee on Large Dams, Maseru, Lesotho. • Long-Distance Water Transfer, Water Resources Series, Volume 3. United Nations
Univ., 1983, Series director: Asit K. Biswas. • Ministry of Water Development, Lilongwe, Malawi. • Ministry of Water, Dar es Salaam, Tanzania. • Namibia Water Coorporation, Windhoek, Namibia. • Societe Nationale d'Electricite du Cameroun, Douala, Cameroon. • Southern African Research and Documentation Centre, Harare, Zimbabwe. • The Kenya Electricity Generating Company Ltd., Nairobi, Kenya. • Water Utilities Coorporation, Gaborone, Botswana.

7
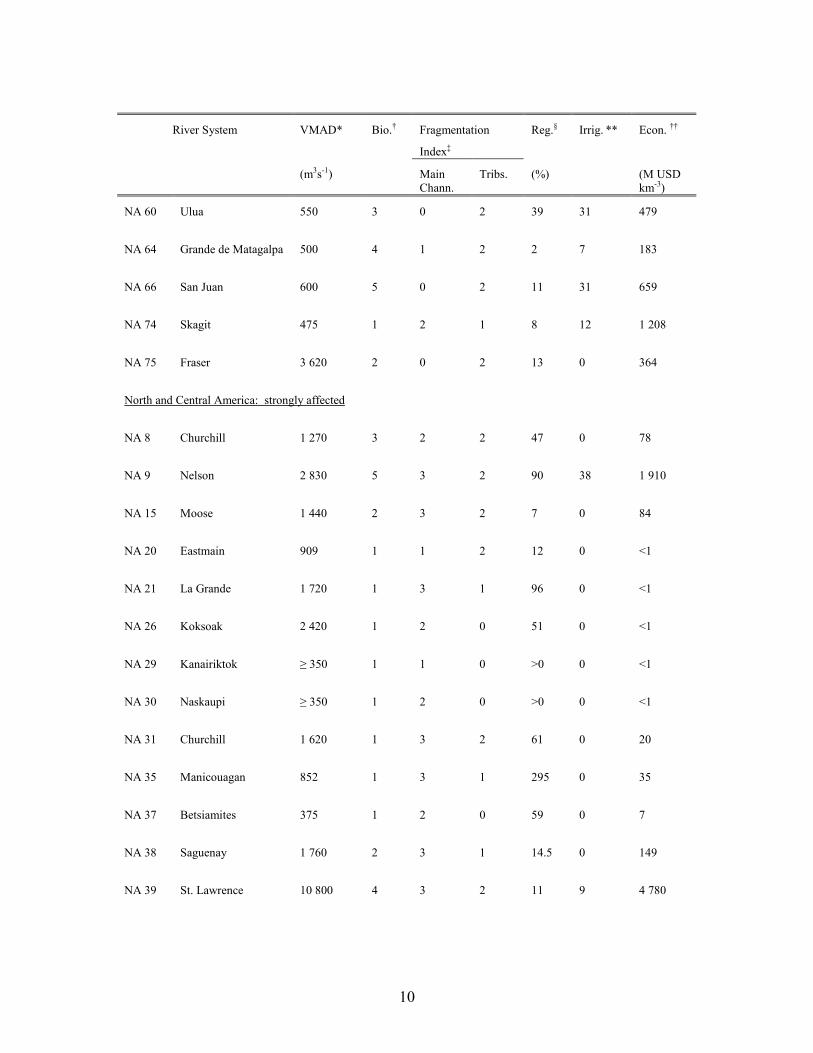
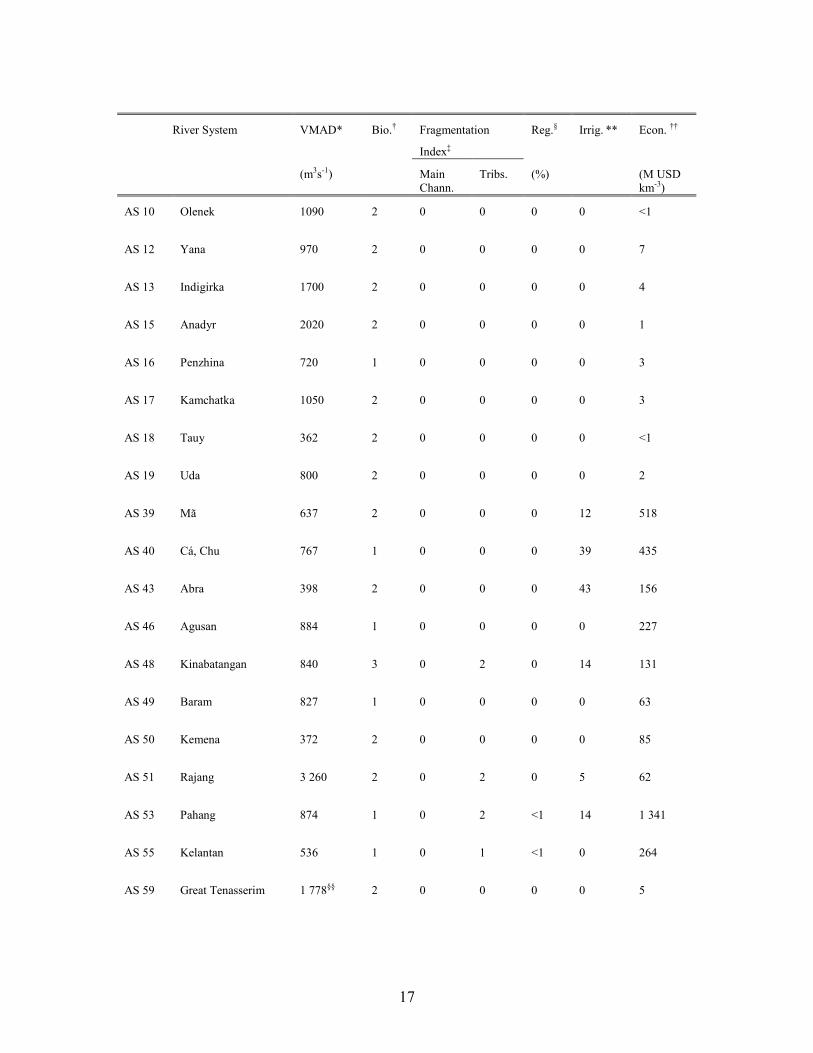
Table S1. Discharge, biogeographic diversity, fragmentation and regulation by dams, irrigation and economics of the world�s largest river systems (LRSs). LRSs are grouped according to impact class within each continent (S2, S3). The alpha-numeric labels before each river system refer to Fig. 1, beginning with a two-letter abbreviation for the continent of the river system�s mouth followed by a number unique to the continent.
River System VMAD* Bio.� Fragmentation
Index�
Reg.§ Irrig. ** Econ. ��
(m3s-1) Main Chann.
Tribs. (%) (M USD km-3)
North and Central America � not affected
NA 1 Colville 600 1 0 0 0 0 <1
NA 3 Coppermine 357 2 0 0 0 0 <1
NA 4 Back 612 2 0 0 0 0 <1
NA 5 Thelon, Kazan 1 370 2 0 0 0 0 5
NA 6 Thaanne, Thlewaitza 507 2 0 0 0 0 <1
NA 7 Seal 365 2 0 0 0 0 <1
NA 10 Hayes 694 1 0 0 0 0 2
NA 11 Severn 722 1 0 0 0 0 <1
NA 12 Winisk 694 1 0 0 0 0 <1
NA 13 Attawapiskat 626 1 0 0 0 0 <1
NA 16 Harricana 473 1 0 0 0 0 92
NA 18 Broadback 383 1 0 0 0 0 <1
NA 19 Rupert 878 1 0 0 0 0 <1
NA 23 Povungnituk ≥ 350 1 0 0 0 0 <1
NA 24 Arnaud 654 1 0 0 0 0 <1

8
River System VMAD* Bio.� Fragmentation
Index�
Reg.§ Irrig. ** Econ. ��
(m3s-1) Main Chann.
Tribs. (%) (M USD km-3)
NA 25 R. Aux Feuilles 575 2 0 0 0 0 <1
NA 27 R. A La Baleíne 581 1 0 0 0 0 <1
NA 28 George 881 2 0 0 0 0 <1
NA 32 Petit Mécatina 524 1 0 0 0 0 <1
NA 33 Natashquan 422 1 0 0 0 0 <1
NA 34 Moisie 490 1 0 0 0 0 10
NA 54 Pascagoula 430 2 0 2 0.8 0 857
NA 58 Coatzacoalcos, Uspanapa
400 4 0 1 <1 1 211
NA 61 Patuca 800 4 0 0 0 1 82
NA 62 Coco (Segovia) 500 4 0 0 0 0 30
NA 63 Prinzapolca 700 3 0 0 0 0 19
NA 65 Escondido 800 4 0 0 0 2 19
NA 76 Skeena 1 760 2 0 2 0.1 0 18
NA 77 Nass 892 4 0 0 0 0 8
NA 78 Stikine 1 600 4 0 0 0 0 4
NA 79 Taku 600 4 0 0 0 0 13
NA 80 Alsek 800 4 0 1 2 0 1
NA 81 Copper 1 700 4 0 0 0 0 4
NA 82 Susitna 1 400 3 0 0 0 0 37

9
River System VMAD* Bio.� Fragmentation
Index�
Reg.§ Irrig. ** Econ. ��
(m3s-1) Main Chann.
Tribs. (%) (M USD km-3)
NA 83 Kvichak 590 2 0 0 0 0 1
NA 84 Nushagak 1 000 3 0 0 0 0 <1
NA 85 Kuskokwim 1 900 2 0 0 0 0 6
NA 86 Yukon 6 370 3 0 2 0.05 0 25
NA 87 Kobuk 510 2 0 0 0 0 6
NA 88 Noatak ≥ 350 2 0 0 0 0 <1
North and Central America: moderately affected
NA 2 MacKenzie 9 910 5 1 1 12 0 39
NA 14 Albany 1 420 1 1 2 1.5 0 5
NA 17 Nottaway 1 130 2 0 2 >0 0 58
NA 22 Gr. R. Baleíne 665 1 0 1 >0 0 <1
NA 36 R. aux Outardes 399 1 1 0 10.5 0 12
NA 45 Delaware 550 2 1 2 5 9 12 356
NA 46 Susquehenna 1 198 2 2 2 2 2 4 738
NA 47 Potomac ≥ 350 1 3 1 1.5 3 11 945
NA 48 Pee Dee 552 2 3 1 4 4 4 077
NA 51 Altamaha 406 2 1 2 4 54 6 114
NA 56 Panuco 500 5 1 2 10 214 6 715
NA 59 Usumacinta, Grijalva 3 000 4 1 2 12 8 556
10
River System VMAD* Bio.� Fragmentation
Index�
Reg.§ Irrig. ** Econ. ��
(m3s-1) Main Chann.
Tribs. (%) (M USD km-3)
NA 60 Ulua 550 3 0 2 39 31 479
NA 64 Grande de Matagalpa 500 4 1 2 2 7 183
NA 66 San Juan 600 5 0 2 11 31 659
NA 74 Skagit 475 1 2 1 8 12 1 208
NA 75 Fraser 3 620 2 0 2 13 0 364
North and Central America: strongly affected
NA 8 Churchill 1 270 3 2 2 47 0 78
NA 9 Nelson 2 830 5 3 2 90 38 1 910
NA 15 Moose 1 440 2 3 2 7 0 84
NA 20 Eastmain 909 1 1 2 12 0 <1
NA 21 La Grande 1 720 1 3 1 96 0 <1
NA 26 Koksoak 2 420 1 2 0 51 0 <1
NA 29 Kanairiktok ≥ 350 1 1 0 >0 0 <1
NA 30 Naskaupi ≥ 350 1 2 0 >0 0 <1
NA 31 Churchill 1 620 1 3 2 61 0 20
NA 35 Manicouagan 852 1 3 1 295 0 35
NA 37 Betsiamites 375 1 2 0 59 0 7
NA 38 Saguenay 1 760 2 3 1 14.5 0 149
NA 39 St. Lawrence 10 800 4 3 2 11 9 4 780

11
River System VMAD* Bio.� Fragmentation
Index�
Reg.§ Irrig. ** Econ. ��
(m3s-1) Main Chann.
Tribs. (%) (M USD km-3)
NA 40 St. John 1 100 2 3 2 2.5 1 380
NA 41 Penobscot 450 1 3 2 8 1 417
NA 42 Kennebec, Androscoggin
488 1 3 2 7.5 0 756
NA 43 Conneticut 540 1 4 2 9 6 4 673
NA 44 Hudson 620 1 2 2 10 3 13 591
NA 49 Santee 560 2 3 2 30 5 6 530
NA 50 Savannah 369 2 3 2 48 17 4 913
NA 52 Apalachicola 750 2 3 1 11 74 6 665
NA 53 Alabama, Mobile 1 900 2 4 2 6.5 2 2 423
NA 55 Mississippi 18 400 5 3 2 15.5 185 4 698
NA 57 Papaloapan, San Juan 650 4 3 2 34 29 630
NA 67 Lempa 400 4 3 0 15 14 574
NA 68 Balsas 500 5 1 2 41 381 14 559
NA 69 Río Grande de Santiago
390 6 3 2 49 906 12 622
NA 70 Colorado 550 4 3 2 280 990 20 728
NA 71 Sacramento, San Joaquín
1 140 4 2 2 49 828 11 281
NA 72 Klamath 515 1 3 2 15.5 70 592
NA 73 Columbia 7 500 4 4 2 24 118 1 034

12
River System VMAD* Bio.� Fragmentation
Index�
Reg.§ Irrig. ** Econ. ��
(m3s-1) Main Chann.
Tribs. (%) (M USD km-3)
South America: not affected
SA 1 Atrato 2 274 3 0 0 0 0 93
SA 4 Catatumbo 470 5 0 0 0 62 1 405
SA 5 Essequibo 2 213 2 0 0 0 1 8
SA 6 Courantyne 1 500 2 0 0 0 6 8
SA 7 Coppename 500 2 0 0 0 23 13
SA 8 Maroni (Suriname) 2 500 2 0 2 ≤1 0 16
SA 9 Oyapock 900 1 0 0 0 0 6
SA 12 Gurupi 470 3 0 0 0 1 177
SA 16 Jequitinhonha 425 4 0 2 0.6 8 1 094
SA 24 Santa Cruz 666 3 0 0 0 0 2
SA 25 Pascua 574 3 0 0 0 0 1 357
SA 26 Baker 950 3 0 0 0 0 4
SA 27 Palena ≥ 350 2 0 0 0 0 4
SA 29 Puelo 670 1 0 0 0 0 4
SA 30 Bueno ≥ 350 2 0 0 0 4 515
SA 31 Valdivia 450 2 0 0 0 1 150
SA 35 Esmeraldas 700 3 0 0 0 26 205
SA 36 Santiago, Cayapas 403 2 0 0 0 24 139

13
River System VMAD* Bio.� Fragmentation
Index�
Reg.§ Irrig. ** Econ. ��
(m3s-1) Main Chann.
Tribs. (%) (M USD km-3)
SA 37 Patia ≥ 350 3 0 1 <1 17 854
SA 38 San Juan 1 991 3 0 ≥1 0 7 19
South America: moderately affected
SA 2 Sinú 385 4 2 0 10 35 579
SA 3 Magdalena 7 500 5 1 2 1 22 540
SA 10 Araguari 967 2 2 0 1 0 18
SA 11 Amazonas, Orinoco 200 000 8 0 2 3 1 41
SA 13 Mearim, Grajaú, Pindaré
429 3 0 1 4 8 553
SA 14 Parnaiba 1 000 4 2 1 10 11 1 179
SA 17 Doce 1 000 3 1 1 0.4 10 620
SA 19 Juquiá, Ribeira ≥ 350 3 0 2 2 3 177
SA 20 Itajai 370 1 1 2 3 20 768
SA 28 Futaleufu 550 1 2 0 16 0 2
SA 32 Bío-Bío�� 900 4 2 2 7 92 140
SA 34 Guayas 835 5 0 2 11 135 530
South America: strongly affected
SA 15 Sao Francisco 2 800 5 2 ≥1 37 41 1 561
SA 18 Paraiba do Sul 876 3 3 2 20 50 1 587

14
River System VMAD* Bio.� Fragmentation
Index�
Reg.§ Irrig. ** Econ. ��
(m3s-1) Main Chann.
Tribs. (%) (M USD km-3)
SA 21 Jacuí, Camaquã, Jagarão
2 000 2 3 2 4 29 645
SA 22 Río de la Plata 21 000 6 3 2 28 25 947
SA 23 Río Negro 900 3 2 2 140 45 290
SA 33 Itata, Maule 500 3 3 2 10 271 418
Europe: not affected
EU 10 Kalixälven, Torneälven
373 2 0 ≤1 1 0 241
EU 12 Onega 500 1 0 0 0 0 138
EU 14 Mezen 880 2 0 0 0 0 11
EU 15 Pechora 4 100 2 0 0 0 0 45
EU 29 Adour�� 360 1 0 2 0.7 82 1960
Europe: moderately affected
EU 1 Ölfusá 440 2 0 2 1.2 0 12
EU 13 Severn, Dvina 3 330 1 1 0 1 0 183
EU 17 Rioni 420 1 2 1 <1 251 303
EU 18 Kuban�� 430 2 ≥1 ≥1 23 809 2612
EU 31 Loire 900 2 1 2 1.5 150 7 463
EU 32 Seine 500 1 1 2 2.5 168 25 489
EU 33 Rhein, Maas 2 200 2 ≤2 2 5 48 20 714

15
River System VMAD* Bio.� Fragmentation
Index�
Reg.§ Irrig. ** Econ. ��
(m3s-1) Main Chann.
Tribs. (%) (M USD km-3)
EU 36 Oder 580 2 2 2 5 27 8 567
EU 37 Wisla 1 080 2 2 2 4 15 6 465
EU 40 Narva 450 2 1 0 <1 2 638
Europe: strongly affected
EU 2 Thjórsá 390 2 3 2 13 0 8
EU 3 Glommavassdr. 728 3 4 2 16 23 1 985
EU 4 Göta Älv 554 4 3 2 27 14 1 887
EU 5 Dalälven 353 3 3 2 26 0 926
EU 6 Indalsälven 448 2 4 2 40 0 189
EU 7 Ångermanälven 481 2 4 2 43 0 138
EU 8 Umeälven 435 2 4 1 27 0 283
EU 9 Luleälven 500 2 3 2 72 0 57
EU 11 Kemijoki 553 1 2 1 23 0 193
EU 16 Volga 8 050 4 4 2 34 56 2 166
EU 19 Don 890 2 ≥1 ≥1 51 309 5 672
EU 20 Dnepr 1 700 2 ≥3 1 35 669 3 349
EU 21 Danube 6 450 4 3 2 4.6 3 4 965
EU 22 Drin ≥350 2 ≥3 2 19.5 0 603
EU 23 Neretva 378 2 3 2 7 1225 164

16
River System VMAD* Bio.� Fragmentation
Index�
Reg.§ Irrig. ** Econ. ��
(m3s-1) Main Chann.
Tribs. (%) (M USD km-3)
EU 24 Po 1 460 3 3 2 4 72 11 443
EU 25 Rhone 1 900 3 4 2 5.5 117 4 470
EU 26 Ebro 577 2 4 2 23 252 3 302
EU 27 Tajo (Tejo) 500 2 4 2 25 418 9 209
EU 28 Duero (Douro) 650 2 3 2 31 43 4 815
EU 30 Garonne, Dordogne 1 045 2 3 2 6.45 106 2 973
EU 34 Weser 360 1 4 2 2.5 148 23 916
EU 35 Elbe 750 1 2 2 12.5 88 19 529
EU 38 Nemunas 620 1 3 2 1 8 2 329
EU 39 Daugava 640 1 3 2 1 4 1 166
EU 41 Neva 2 490 3 3 2 17 4 1 066
Asia: not affected
AS 2 Nadym 610 1 0 0 0 0 29
AS 3 Pur 1050 2 0 0 0 0 97
AS 4 Taz 1540 2 0 0 0 0 3
AS 6 Pyasina 2260 2 0 0 0 0 22
AS 7 Taymyra 990 1 0 0 0 0 <1
AS 8 Khatanga, Popigay 3200 2 0 0 0 0 <1
AS 9 Anabar 432 2 0 0 0 0 2
17
River System VMAD* Bio.� Fragmentation
Index�
Reg.§ Irrig. ** Econ. ��
(m3s-1) Main Chann.
Tribs. (%) (M USD km-3)
AS 10 Olenek 1090 2 0 0 0 0 <1
AS 12 Yana 970 2 0 0 0 0 7
AS 13 Indigirka 1700 2 0 0 0 0 4
AS 15 Anadyr 2020 2 0 0 0 0 1
AS 16 Penzhina 720 1 0 0 0 0 3
AS 17 Kamchatka 1050 2 0 0 0 0 3
AS 18 Tauy 362 2 0 0 0 0 <1
AS 19 Uda 800 2 0 0 0 0 2
AS 39 Mã 637 2 0 0 0 12 518
AS 40 Cá, Chu 767 1 0 0 0 39 435
AS 43 Abra 398 2 0 0 0 43 156
AS 46 Agusan 884 1 0 0 0 0 227
AS 48 Kinabatangan 840 3 0 2 0 14 131
AS 49 Baram 827 1 0 0 0 0 63
AS 50 Kemena 372 2 0 0 0 0 85
AS 51 Rajang 3 260 2 0 2 0 5 62
AS 53 Pahang 874 1 0 2 <1 14 1 341
AS 55 Kelantan 536 1 0 1 <1 0 264
AS 59 Great Tenasserim 1 778§§ 2 0 0 0 0 5

18
River System VMAD* Bio.� Fragmentation
Index�
Reg.§ Irrig. ** Econ. ��
(m3s-1) Main Chann.
Tribs. (%) (M USD km-3)
AS 60 Tavoy 484§§ 1 0 0 0 0 48
AS 61 Salween (Thanlwin) 5 250 6 0 2 0.3 6 95
AS 63 Kaladan 3 476§§ 1 0 0 0 0 10
Asia: moderately affected
AS 1 Ob 12800 7 2 2 9 30 580
AS 11 Lena 16900 4 0 1 3 0 23
AS 14 Kolyma 4060 2 1 0 5 0 2
AS 20 Amur 10900 8 0 2 9 62 967
AS 21 Ishikari Gawa 468 2 1 2 6 0 4 888
AS 22 Mogami Gawa 392 2 2 2 2 27 2 463
AS 23 Shinano Gawa 514 2 2 2 1 78 4 122
AS 24 Agano Gawa�� 417 2 2 2 9 104 2 483
AS 35 Min Jiang�� 1 870 1 ≥2 2 4 73 834
AS 36 Han Jiang�� 828 1 ≥1 2 10 67 1 277
AS 38 Hong Ha (Red River) 3 900 2 0 2 3 63 2 375
AS 41 Boung, Thu Bon, Cái 611 2 1 2 <1 26 164
AS 42 Mekong 15 900 5 2 2 3 39 457
AS 44 Cagayan 1 710 2 0 2 1.5 35 254
AS 47 Mindanao 852 1 2 0 0.2 18 436

19
River System VMAD* Bio.� Fragmentation
Index�
Reg.§ Irrig. ** Econ. ��
(m3s-1) Main Chann.
Tribs. (%) (M USD km-3)
AS 52 Bengwan Solo 463 1 0 2 5 192 2 897
AS 56 Mae Nam Ta Pi 397 2 0 1 38 27 570
AS 62 Irrawaddi (Ayeyarwadi)
11 953 7 0 2 1.1 42 176
AS 64 Karnafuli 4 751 2 2 0 3 0 111
AS 65 Ganges, Brahmaputra 22 102 10 1 1 8 357 2 024
Asia: strongly affected
AS 5 Yenisey 20000 8 ≥2 2 18 0 101
AS 25 Kiso, Ibi, Nagara Gawa
350 2 3 2 8 174 21 070
AS 26 Nakton Gang 442 1 3 2 21 263 10 087
AS 27 Han Gang 615 1 3 2 29 81 10 497
AS 28 Yalu Jiang 1 200 1 2 2 39 68 588
AS 29 Liao He 400 3 1 2 26 1033 13 407
AS 30 Hai He 723 3 3 2 68 2194 19 008
AS 31 Huang He (Yellow) 1990 6 3 2 51 911 9 897
AS 32 Chang Jiang (Yangtze)
29460 4 2 2 12 148 2 023
AS 33 Qiantan Jiang 1160 2 3 2 37 265 3 086
AS 34 Ou Jiang 599 1 2 2 12 62 1 199
AS 37 Zhu Jiang (Pearl) 10 700 1 3 2 31 68 1 107

20
River System VMAD* Bio.� Fragmentation
Index�
Reg.§ Irrig. ** Econ. ��
(m3s-1) Main Chann.
Tribs. (%) (M USD km-3)
AS 45 Pampanga ≥ 350 1 1 2 24 162 4 785
AS 54 Perak 480 1 3 2 11 16 994
AS 57 Chao Phraya 961 3 2 2 76 581 4 208
AS 58 Mae Khlong 425 3 3 2 130 193 525
AS 66 Mahanadi, Brahmani 2 125 3 3 2 17 389 1 828
AS 67 Krishna, Godavari 3 053 3 2 2 37 730 3 968
AS 68 Cauvery 666 3 3 2 19 772 3 806
AS 69 Periyar 390 2 3 1 46 122 1 335
AS 70 Tapi 444 4 3 2 54 621 2 388
AS 71 Narmada 1 490 4 2 2 26 392 1 072
AS 72 Mahi 383 1 3 2 15 371 1 367
AS 73 Indus 6 564 8 3 2 13 1173 1 974
AS 74 Shatt Al Arab (Euphrates-Tigris)
1750 6 2 2 124 1138 3 327
AS 75 Kura 850 5 ≥3 2 44 734 2 294
AS 76 Amu-Dar'Ya 2200 5 ≥1 2 14 610 676
AS 77 Syr-Dar'Ya 1170 5 ≥3 2 55 1187 2 100
AS 78 Ili 570 5 ≥2 ≥1 37 321 1 307
Africa: not affected
AF 2 Rufiji 820 5 0 ≤2 0 14 115

21
River System VMAD* Bio.� Fragmentation
Index�
Reg.§ Irrig. ** Econ. ��
(m3s-1) Main Chann.
Tribs. (%) (M USD km-3)
AF 4 Tsiribihina 1 000 4 0 0 0 40 35
AF 5 Mangoky 460 5 0 0 0 105 43
AF 12 Kouilou 930 2 0 0 0 0 20
AF 13 Nyanga ≥ 350 2 0 0 0 0 24
AF 15 Ntem 400 1 0 0 0 0 59
AF 17 Cross 550 3 0 2 0 1 429
AF 21 Cavally ≥ 350 1 0 0 0 0 57
AF 24 Chari 1 200 5 0 0 0 7 418
Africa: moderately affected
AF 3 Betsiboka 440 2 1 1 2 85 161
AF 7 Save 750 5 0 2 10 11 278
AF 10 Cuanza 830 2 2 1 10 3 167
AF 11 Congo (Zaire) 41 000 6 1 2 0 0 34
AF 14 Ogooué 4 700 3 1 1 ≤25 0 20
AF 16 Sanaga 2 070 2 2 ≥1 10 0 139
AF 22 Konkouré 1 170 3 0 ≤2 4 4 61
Africa: strongly affected
AF 1 Nile 3 000 6 3 2 95 393 3 319
AF 6 Zambezi 7 070 8 2 2 30 8 186

22
River System VMAD* Bio.� Fragmentation
Index�
Reg.§ Irrig. ** Econ. ��
(m3s-1) Main Chann.
Tribs. (%) (M USD km-3)
AF 8 Limpopo 2 000 5 3 2 5 45 2 196
AF 9 Orange 2 900 4 3 2 14 45 1 235
AF 18 Niger 6 100 6 3 2 15 21 372
AF 19 Volta 1 120 3 3 2 428 5 812
AF 20 Sassandra 425 2 2 0 31 14 372
AF 23 Sénégal 770 3 2 0 24 52 321
Australasia: not affected
AU 1 Timoforo, Kamoendan
≥ 350 2 0 0 0 0 20
AU 2 Derewo, Owa ≥ 350 3 0 0 0 0 5
AU 3 Mamberamo 4 500 3 0 0 0 0 6
AU 4 Sepik 3 804 2 0 0 0 0 16
AU 6 Markham 546 2 0 0 0 0 33
AU 7 Purari 2 571 3 0 0 0 0 20
AU 8 Kikori 3 274 3 0 0 0 0 8
AU 9 Turama 988 2 0 0 0 0 1
AU 10 Fly 6 000 3 0 0 0 0 1
AU 11 Merauke ≥ 350 3 0 0 0 0 29
AU 12 Bian ≥ 350 3 0 0 0 0 10
AU 13 Digul ≥ 350 3 0 0 0 0 36

23
River System VMAD* Bio.� Fragmentation
Index�
Reg.§ Irrig. ** Econ. ��
(m3s-1) Main Chann.
Tribs. (%) (M USD km-3)
AU 14 Eilanden, Lorentz, Kampong, Nordwest
≥ 350 3 0 0 0 0 18
AU 15 Omba ≥ 350 2 0 0 0 0 2
AU 16 Laluai 1 612 1 0 0 0 0 <1
AU 19 Grey 353 2 0 0 0 3 5
AU 20 Buller 488 2 0 0 0 1 21
Australasia: moderately affected
AU 5 Ramu 1 500 3 1 ≤2 0.4 0 22
AU 23 Waiau 512 2 2 0 5 0 4
Australasia: strongly affected
AU 17 Murray 775 6 1 2 67 644 4 345
AU 18 Waikato 417 1 3 2 1 4 509
AU 21 Waitaki 367 3 2 2 32 30 20
AU 22 Clutha 563 3 3 2 7 61 37

24
* Virgin mean annual discharge (VMAD) refers to the most water-rich river channel section, in most cases close to the estuary, before any significant direct human manipulation. � The number of non-marine biomes (S4) represented within the river system�s catchment area. � For the main channel, fragmentation is ranked into five classes describing the longest portion of the main-channel left without dams (but frequently including reservoir water tables) in relation to the entire main channel (0 = 100%; 1 = 75�99%; 2 = 50�74%; 3 = 25�49%; and 4 = 0�24%). The main channel is the channel having the highest VMAD. For the tributaries, fragmentation is described by three classes (0 = no dams; 1 = dams only in the catchment of minor tributaries; 2 = dams in the catchment of the largest tributary). § Readers are advised that all values are estimates and sometimes minimums, especially for systems in the strongly affected class. Specific live and gross storage capacities were reported for the 139 northern systems (S1) and those values were used in derivation of the values reported here (S5). Classifications dependent on previous interbasin diversion data (S1) are reported unchanged here, although reservoir storage data alone do not meet the criteria for the assigned impact classes for five systems (NA-17, 20, 22, 29, 30). Classifications dependent on previous irrigation data (S1) were reclassified according to reservoir storage data alone � this applies to the Kuban (EU-18) and Adour (EU-29) systems which each dropped one impact class. Flow regulation presented for the Hudson (NA-44) reflects a correction of previous data (S1) which resulted in higher impact classification. Values presented for the Ebro (EU-26), Tajo (EU-27) and Duero (EU-28) also reflect corrections (S1), although impact classification did not change as a result. ** The irrigation index was calculated as the ratio of km2 equipped for or under irrigation (S6) to VMAD (in km3), presented as a unitless index. This index suggests that the higher the value, the greater the pressure that irrigation could exert on the system. Values of zero describe systems with negligible land equipped for or under irrigation. �� Economic activity is described as �Per Discharge Gross LRS Product� (GLP) (S7). This index implies that the higher the value, the greater the economic activity per unit of water in the system. �� These six systems may actually have a flow that is more impacted than is suggested by the impact class, because the fragmentation and flow regulation data nearly meet criteria for the next highest impact class and additional irrigation pressure is high. §§ These VMAD values were estimated using an environmental model (S8).

25
Table S2. Principles for constructing three classes of river system exploitation (not affected, moderately affected, and strongly affected) from the combination of fragmentation and flow regulation assessments (S1). The fragmentation classes are defined in Table S1. Summed values of reservoir live storages are given as the percentage of VMAD and shown as flow regulation (Table S1). Where data on live storage were lacking, half the gross capacity was used as a substitute.
Flow regulation (%) Fragmentation
(Main channel + tributaries) Not affected Moderately affected Strongly affected
0 + 0 0
0 + 1 ≤ 2 > 2
0 + 2 ≤ 1 > 1
1 + 0 ≤ 30 > 30
1 + 1 ≤ 25 > 25
1 + 2, 2 + 0 ≤ 20 > 20
2 + 1 ≤ 15 > 15
2 + 2, 3 + 0 ≤ 10 > 10
3 + 1 ≤ 5 > 5
3 + 2, 4 + 0, 1, 2 ≥ 0

26
References S1. M. Dynesius, C. Nilsson, Science 266, 753 (1994). S2. T. Simkin, J.D. Unger, R.I. Tilling, P.R. Vogt, H. Spall, �This Dynamic Planet � World Map of Volcanoes, Earthquakes, Impact Craters, and Plate Tectonics� (Smithsonian Institution and U.S. Geological Survey, 1994). [http://pubs.usgs.gov/pdf/planet.html]. S3. The Times Atlas of the World - Comprehensive ed. (Times Books, London, 1997). S4. D. M. Olson et al. BioScience 51, 933 (2001). S5. We calculated flow regulation as the sum of reservoir capacity within a river system (see Materials and Methods for data sources) and expressed this measure as the percentage of the LRS�s volumetric annual discharge that can be contained and released by the reservoirs (live storage). One half of the gross capacity was used as a substitute for live storage for reservoirs which lacked live storage data. The gross capacity is the total water volume that can be retained by a dam, including the bottom water that cannot be released through the lowest outlet. Live storage is the gross capacity excluding this bottom water. S6. S. Siebert, P. Döll, J. Hoogeveen, �Global map of irrigated areas version 2.0� (Center for Environmental Systems Research, Univ. of Kassel, Germany and Food and Agriculture Organization of the United Nations, Rome, Italy, 2001). S7. GLP was calculated in a first step as the basin sum of US dollars assigned to each river system inhabitant according to his/her nationality (S9) and corresponding 2003 per capita gross domestic product (S10). We then divided this sum by VMAD (expressed in annual km3), resulting in a �per discharge� GLP, referred to simply as GLP. S8. P. Schreiber, Meteorol. Zeitschr. 21, 441 (1904). S9. �Population LandScan 2000 global population database� (Oakridge, TN: Oak Ridge National Laboratory) [http://sedac.ciesin.columbia.edu/plue/gpw/landscan]. S10. The World Factbook (United States Central Intelligence Agency, 2003) [http://www.cia.gov/cia/publications/factbook/index.html].