Supporting Information supercapacitors Fast assembly of ...
17
Supporting Information Fast assembly of MXene hydrogel by interfacial electrostatic interaction for supercapacitors Mengke Peng, a,# Weizu Yang, a,# Longbin Li, a Kaiyang Zhang, a Li Wang, a Ting Hu, b Kai Yuan, a, * and Yiwang Chen a,c, * a Institute of Polymers and Energy Chemistry (IPEC), College of Chemistry, Nanchang University, Nanchang 330031, China. Email: [email protected] (K. Yuan); [email protected] (Y. Chen) b School of Materials Science and Engineering, Nanchang University, Nanchang 330031, China c Institute of Advanced Scientific Research (iASR), Key Laboratory of Functional Small Molecule Ministry of Education, Jiangxi Normal University, 99 Ziyang Avenue, Nanchang 330022, China # These authors contributed equally to this work. Characterizations: UV-vis absorption spectra were obtained by Agilent Cary100. Fluorescence spectrophotometer was performed on a F-7000, Hitachi High- Technologies Corporation. Fourier transform infrared (FTIR) spectroscopy studies were conducted on a SHIMADZU FT-IR Prestige-21. XRD patterns studies were conducted on a Bruker D8 Advance X-ray diffractometer. X-ray photoelectron spectroscopy (XPS) was performed by ESCALAB 250Xi (THERMO SCIENTIFIC Co.), conducting Al Kα source as an internal standard. The SEM and TEM were carried out at a Quanta 200F environmental scanning electron microscopy and transmission electron microscopy (TEM, JEOL, JEM-2100F), respectively. The nitrogen adsorption-desorption measurements were performed on a Brunauer- Emmett-Teller (Quantachrome, Autosorb-iQ). The performance of samples was Electronic Supplementary Material (ESI) for ChemComm. This journal is © The Royal Society of Chemistry 2021
Transcript of Supporting Information supercapacitors Fast assembly of ...

Supporting Information
Fast assembly of MXene hydrogel by interfacial electrostatic interaction for
supercapacitors
Mengke Peng,a,# Weizu Yang,a,# Longbin Li,a Kaiyang Zhang,a Li Wang,a Ting Hu,b
Kai Yuan,a,* and Yiwang Chena,c,*
aInstitute of Polymers and Energy Chemistry (IPEC), College of Chemistry,
Nanchang University, Nanchang 330031, China. Email: [email protected] (K.
Yuan); [email protected] (Y. Chen)bSchool of Materials Science and Engineering, Nanchang University, Nanchang
330031, ChinacInstitute of Advanced Scientific Research (iASR), Key Laboratory of Functional
Small Molecule Ministry of Education, Jiangxi Normal University, 99 Ziyang Avenue,
Nanchang 330022, China# These authors contributed equally to this work.
Characterizations: UV-vis absorption spectra were obtained by Agilent Cary100.
Fluorescence spectrophotometer was performed on a F-7000, Hitachi High-
Technologies Corporation. Fourier transform infrared (FTIR) spectroscopy studies
were conducted on a SHIMADZU FT-IR Prestige-21. XRD patterns studies were
conducted on a Bruker D8 Advance X-ray diffractometer. X-ray photoelectron
spectroscopy (XPS) was performed by ESCALAB 250Xi (THERMO SCIENTIFIC
Co.), conducting Al Kα source as an internal standard. The SEM and TEM were
carried out at a Quanta 200F environmental scanning electron microscopy and
transmission electron microscopy (TEM, JEOL, JEM-2100F), respectively. The
nitrogen adsorption-desorption measurements were performed on a Brunauer-
Emmett-Teller (Quantachrome, Autosorb-iQ). The performance of samples was
Electronic Supplementary Material (ESI) for ChemComm.This journal is © The Royal Society of Chemistry 2021

evaluated by Autolab electrochemical workstation (AutoLab, PGSTAT302Nl).
Preparation of Ti3C2Tx flakes. MAX phase (Ti3AlC2) was purchased from 11
Technology Co., Ltd. Generally, 2 g LiF and 40 mL of 9 M HCl was mixed in a
Teflon beaker to form HF solution. Then, 2 g Ti3AlC2 power was slowly and carefully
added into above solution and constantly stirred at 35℃ for 24 hours. After the
etching was completed, the resulting suspension was repeatedly washed by
centrifugation at 3500 rpm with deionized water until the pH of suspension turned to
about 6. The single- or fewer-layer MXene flakes was collected by sonicate the above
mixture with a certain amount of water under N2 atmosphere for 1 hour and followed
by centrifuged at 3500 rpm for 1 hour.
Preparation of MXene hydrogel. Typically, MXene hydrogels were assembled by
add 1 mL of MXene suspension into 200 μL protonated thionine solutions (2 mg mL-1,
3 mg mL-1, 5 mg mL-1) with 10 μL hydrochloric acid. The hydrogel was shaped
within a few seconds. Then, the MXene hydrogels were immersed into deionized
water for several hours to remove excess thionine molecules. The obtained MXene
hydrogels were labeled as MH/Th-1, MH/Th-2, MH/Th-3 with 2 mg mL-1, 3 mg mL-1,
5 mg mL-1protonated thionine crosslinking, respectively. MH/Th-2 was used as a
representative in UV-vis absorption spectra, Fluorescence spectra, FTIR, XRD, XPS,
BET and TEM studies and recorded as MH/Th.
Electrochemical measurements. A certain volume of washed MH/Th hydrogel was
gently clamped on the working electrode without further processing. The counter
electrode was platinum plate and the reference electrode was Ag/AgCl. The potential
range was set from -0.2 to 0.4 V and 1 M H2SO4 solution was used as electrolyte. The
electrochemical impedance spectroscopy (EIS) was measured from 0.01 Hz to 100
kHz. The specific capacitance of the materials was evaluated from GCD profiles
according to the formula: C = (∫ i dt) / (m ΔV). Where C (F g-1) is the specific
capacitance, i (A) is the discharge current, t (s) is the discharge time, m (g) is the mass
of the active materials and ΔV (V) is potential window.

Figure S1. a) UV-vis absorption spectra and b) the corresponding enlarged UV-vis spectra of Th, MXene and MH/Th aqueous solutions. c) Fluorescence spectra of Th, MXene and MH/Th aqueous solutions.

Figure S2. Optical image of freeze-drying MH/Th.

Figure S3. FTIR spectra of thionine, MXene, and the MH/Th nanocomposite.

Figure S4. a) XPS spectra of MXene and corresponding high-resolution XPS spectra of b) C 1s and c) Ti 2p.

Figure S5. a) XPS spectra of MH/Th and corresponding high-resolution XPS spectra of b) C 1s, c) Ti 2p.

Figure S6. SEM images of a) Ti3AlC2 and b) MXene. c) TEM image of MXene.
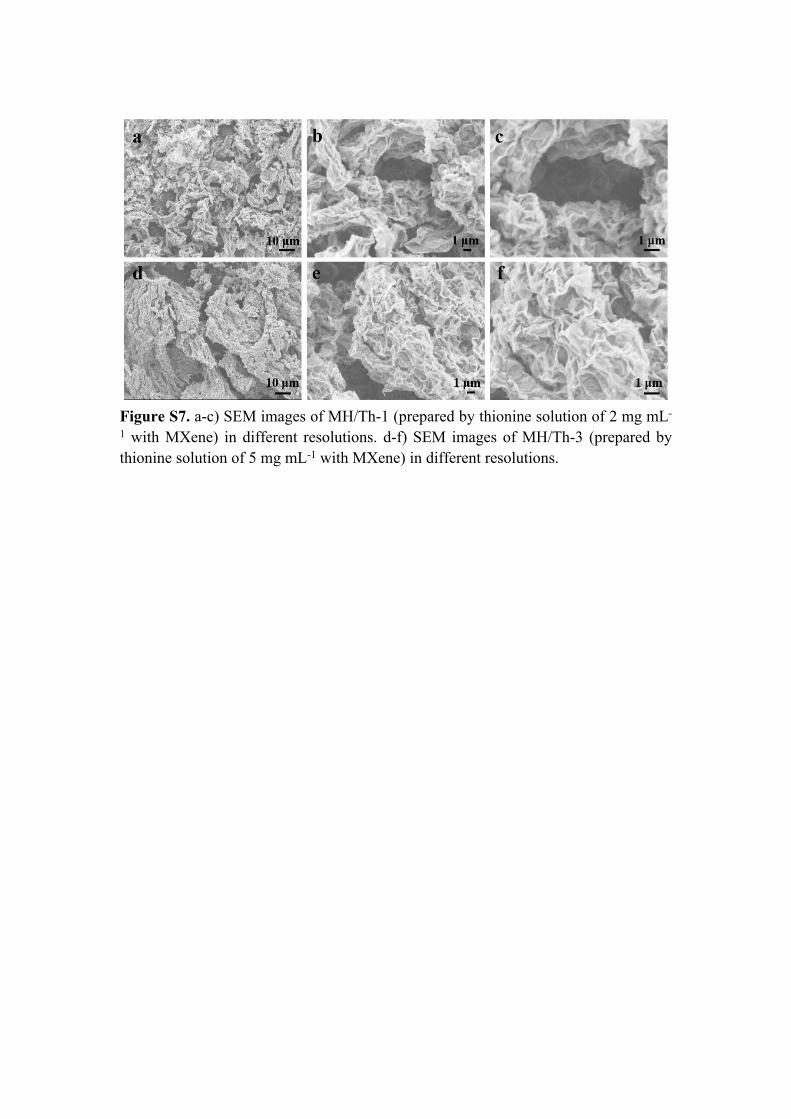
Figure S7. a-c) SEM images of MH/Th-1 (prepared by thionine solution of 2 mg mL-
1 with MXene) in different resolutions. d-f) SEM images of MH/Th-3 (prepared by thionine solution of 5 mg mL-1 with MXene) in different resolutions.

Figure S8. Element distribution mapping of MH/Th.
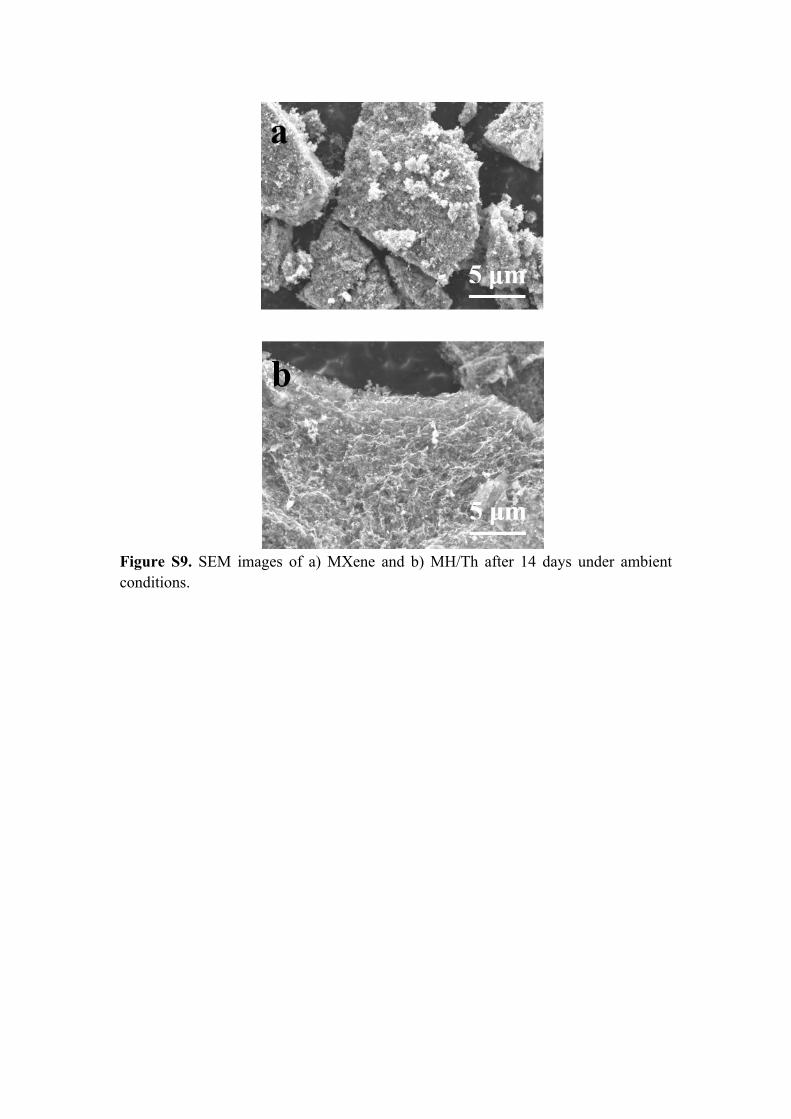
Figure S9. SEM images of a) MXene and b) MH/Th after 14 days under ambient conditions.
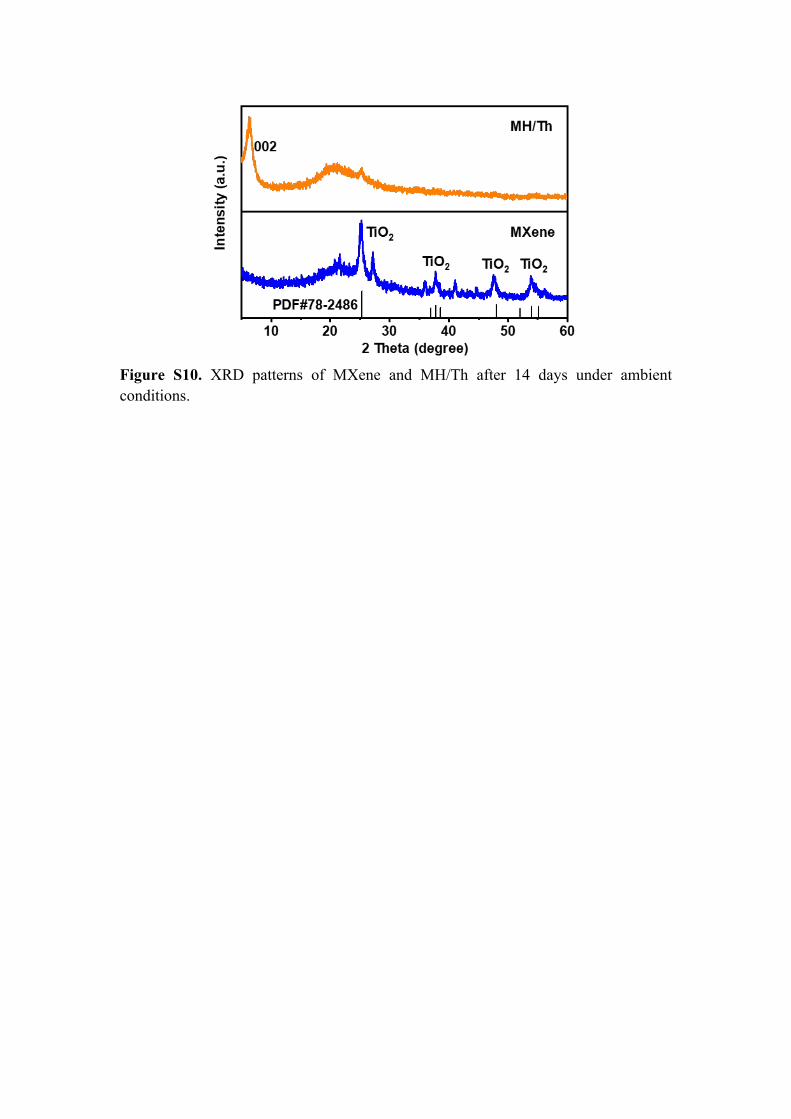
Figure S10. XRD patterns of MXene and MH/Th after 14 days under ambient conditions.

Figure S11. a) CV curves at various scan rates, b) GCD curves at different current
densities of MXene.

Figure S12. a) CV curves at various scan rates, b) GCD curves at different current
densities of MH/Th-1 (prepared by thionine solution of 2 mg mL-1 with MXene).

Figure S13. a) CV curves at various scan rates, b) GCD curves at different current
densities of MH/Th-2 (prepared by thionine solution of 3 mg mL-1 with MXene).

Figure S14. a) CV curves at various scan rates, b) GCD curves at different current
densities of MH/Th-3 (prepared by thionine solution of 5 mg mL-1 with MXene).

Figure S15. Nyquist plots of the symmetric supercapacitor fabricated by coupling two
identical MH/Th-2.