Supporting Information A mechanistic model of fast pyrolysis … · Supporting Information A...
30
Supporting Information A mechanistic model of fast pyrolysis of hemicellulose Xiaowei Zhou, † Wenjun Li, ‡ Ross Mabon, ‡ and Linda J. Broadbelt *, † † Department of Chemical and Biological Engineering, Northwestern University, 2145 Sheridan Road, Evanston, IL 60208 United States. ‡ Corporate Strategic Research, ExxonMobil Research and Engineering Company, 1545 US Route 22 East, Annandale, NJ 08801, USA *Correspondence concerning this article should be addressed to L. J. Broadbelt at [email protected]; fax: +1-847-491-3728; tel: +1-847-491-5351. S1 Electronic Supplementary Material (ESI) for Energy & Environmental Science. This journal is © The Royal Society of Chemistry 2018
Transcript of Supporting Information A mechanistic model of fast pyrolysis … · Supporting Information A...
Supporting Information
A mechanistic model of fast pyrolysis of hemicellulose
Xiaowei Zhou,† Wenjun Li,‡ Ross Mabon,‡ and Linda J. Broadbelt*, †
† Department of Chemical and Biological Engineering, Northwestern University, 2145 Sheridan
Road, Evanston, IL 60208 United States.
‡ Corporate Strategic Research, ExxonMobil Research and Engineering Company, 1545 US Route
22 East, Annandale, NJ 08801, USA
*Correspondence concerning this article should be addressed to L. J. Broadbelt at
[email protected]; fax: +1-847-491-3728; tel: +1-847-491-5351.
S1
Electronic Supplementary Material (ESI) for Energy & Environmental Science.This journal is © The Royal Society of Chemistry 2018

Table S1. Comparison of model yields with experimental results of fast pyrolysis of extracted
cornstover hemicellulose at 500 °C
Model yields, wt%Products detected from
hemicellulose pyrolysis
Expt. Yields,1 wt% DP=15 DP=30 DP=45 DP=75 DP=135
Formaldehyde 0.25 ± 0.02 1.71 1.65 1.65 1.69 1.58
Acetaldehyde 1.15 ± 0.07 0.94 0.89 0.88 0.88 0.83
Furan 0.10 ± 0.00
— — — — —
Acetone 0.13 ± 0.02 — — — — —
Methyl glyoxal 3.31 ± 0.31 6.02 5.28 5.22 5.05 5.01
2-Methyl furan 0.09 ± 0.00 — — — — —
Glycolaldehyde 12.85 ± 1.09
14.85 13.96 13.97 14.10 13.42
Acetic acid 0.18 ± 0.02 — — — — —
Acetol 1.2 ± 0.04 2.39 2.20 2.39 2.28 2.29
2-Furaldehyde (C5H4O2) 2.2 ± 0.12 2.13 2.01 2.00 2.01 1.88
2-Furan methanol (C5H6O2) 0.31 ± 0.02 — — — — —
3-Furan methanol (C5H6O2) 0.17 ± 0.01 — — — — —
Other DAXP 1 0.49 ± 0.02 0.54 0.50 0.50 0.49 0.46
5-Methyl furfural (C6H6O2) 0.64 ± 0.04 — — — — —
1,2;4,5-Dianhydroxylopyranose (DAXP 1)
2.83 ± 0.23 2.93 2.62 2.63 2.60 2.64
2(5H)-Furanone 0.49 ± 0.04 — — — — —
1,2;3,4-Dianhydroxylopyranose (DAXP 2)
13.34 ± 0.20 12.40 15.28 14.51 14.55 13.93
S2

5-Hydroxymethylfurfural 0.20 ± 0.00 — — — — —
Other DAXP 2 0.88 ± 0.07 2.69 2.24 2.23 2.13 2.11
1,2-Anhydroxylopyranose (AXP) 7.14 ± 0.62 8.68 7.54 7.58 7.50 7.89
Levoglucosan-pyranose 0.81 ± 0.03 — — — — —
Levoglucosan-furanose 0.13 ± 0.00 — — — — —
Char 9.44 ± 1.19 9.11 8.81 9.15 8.93 8.87
CO 1.72 ± 0.29 2.18 2.11 2.19 2.14 2.11
CO2 6.02 ± 0.59 5.99 5.79 6.02 5.88 5.82
Water (calculated) 14.98 ± 1.00 15.57 15.30 14.99 14.33 14.30
Total 81.25 ± 2.75 88.27 86.42 86.20 84.97 82.55
Note that experimental yields of pyrolysis products and corresponding standard deviation for
triplicate pyrolysis runs are from experimental study of Zhang et al.1 In their experiments, only
carbohydrate derived products are analyzed, and the experimental yields of products were
normalized based on carbohydrate content.
S3
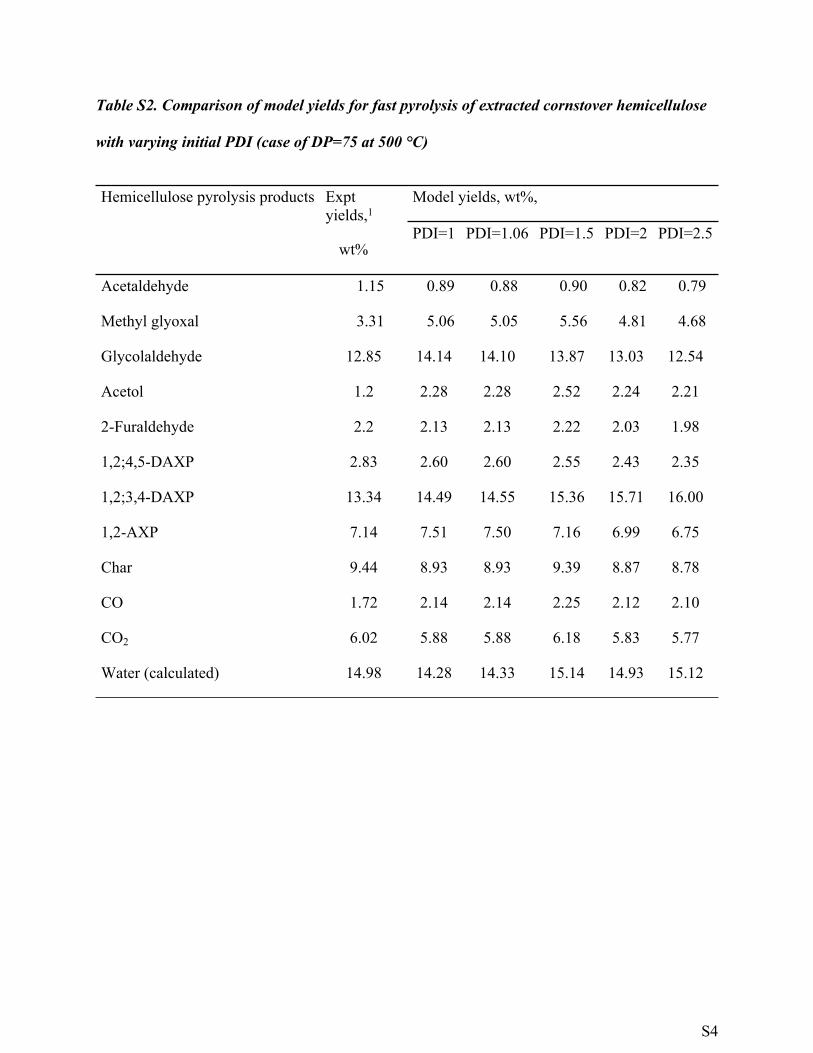
Table S2. Comparison of model yields for fast pyrolysis of extracted cornstover hemicellulose
with varying initial PDI (case of DP=75 at 500 °C)
Model yields, wt%,Hemicellulose pyrolysis products Expt yields,1
wt% PDI=1 PDI=1.06 PDI=1.5 PDI=2 PDI=2.5
Acetaldehyde 1.15 0.89 0.88 0.90 0.82 0.79
Methyl glyoxal 3.31 5.06 5.05 5.56 4.81 4.68
Glycolaldehyde 12.85 14.14 14.10 13.87 13.03 12.54
Acetol 1.2 2.28 2.28 2.52 2.24 2.21
2-Furaldehyde 2.2 2.13 2.13 2.22 2.03 1.98
1,2;4,5-DAXP 2.83 2.60 2.60 2.55 2.43 2.35
1,2;3,4-DAXP 13.34 14.49 14.55 15.36 15.71 16.00
1,2-AXP 7.14 7.51 7.50 7.16 6.99 6.75
Char 9.44 8.93 8.93 9.39 8.87 8.78
CO 1.72 2.14 2.14 2.25 2.12 2.10
CO2 6.02 5.88 5.88 6.18 5.83 5.77
Water (calculated) 14.98 14.28 14.33 15.14 14.93 15.12
S4
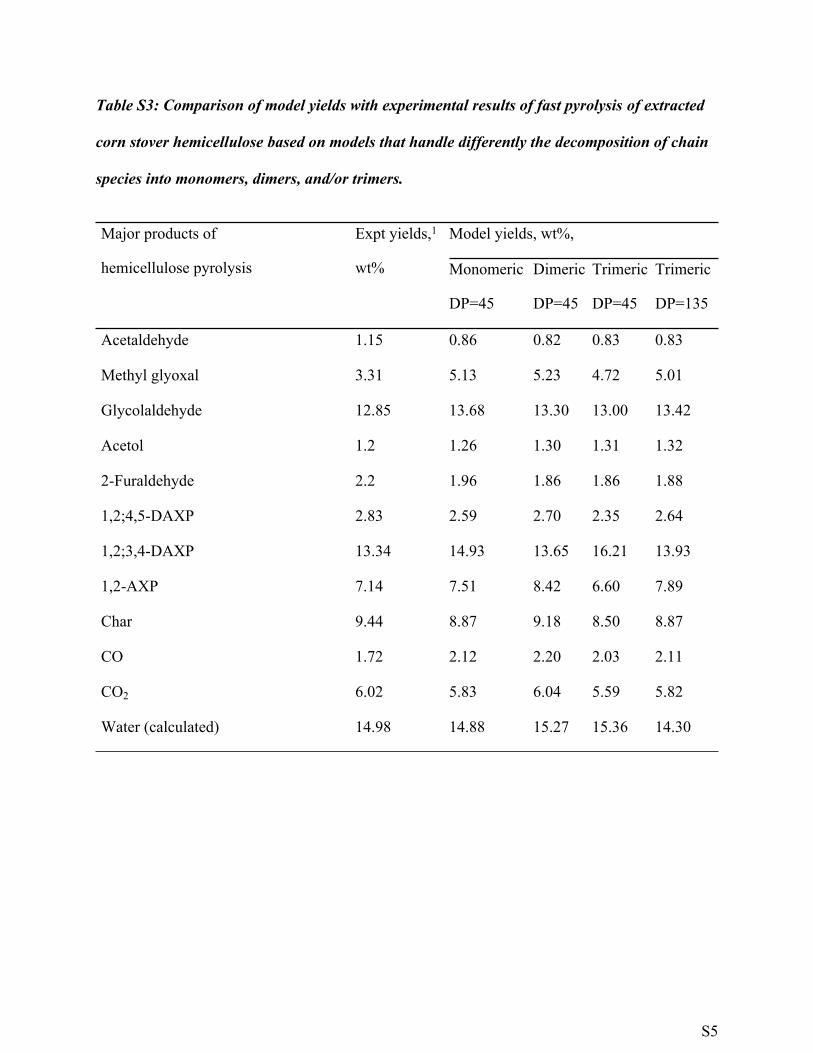
Table S3: Comparison of model yields with experimental results of fast pyrolysis of extracted
corn stover hemicellulose based on models that handle differently the decomposition of chain
species into monomers, dimers, and/or trimers.
Model yields, wt%,Major products of
hemicellulose pyrolysis
Expt yields,1
wt% Monomeric
DP=45
Dimeric
DP=45
Trimeric
DP=45
Trimeric
DP=135
Acetaldehyde 1.15 0.86 0.82 0.83 0.83
Methyl glyoxal 3.31 5.13 5.23 4.72 5.01
Glycolaldehyde 12.85 13.68 13.30 13.00 13.42
Acetol 1.2 1.26 1.30 1.31 1.32
2-Furaldehyde 2.2 1.96 1.86 1.86 1.88
1,2;4,5-DAXP 2.83 2.59 2.70 2.35 2.64
1,2;3,4-DAXP 13.34 14.93 13.65 16.21 13.93
1,2-AXP 7.14 7.51 8.42 6.60 7.89
Char 9.44 8.87 9.18 8.50 8.87
CO 1.72 2.12 2.20 2.03 2.11
CO2 6.02 5.83 6.04 5.59 5.82
Water (calculated) 14.98 14.88 15.27 15.36 14.30
S5

Table S4: Chemical composition of hemicelluloses derived from different biomass sources.
Hemicellulose
/composition Xylan
Extracted hemicellulose
from
corn stover
Minimally
damaged hemicellulose
of corn stalk
Mw, Da 10, 000 37, 345
PDI 1.03 1.58
Arabinose 0.5 5.95 8.3
Fucose — —
Galactose 1.3 7.5
4-O-methyl-glucuronic acid — 13.1
Galcuronic acid — —
Glucose 1.6 0.32 5
Mannose — 5.1
Rhamnose 0.8 —
Xylose 95.9 91.96 61
Ferulic acid — —
Acetyl — 6.2
Others 1.77
Ref. 2 1 3
S6
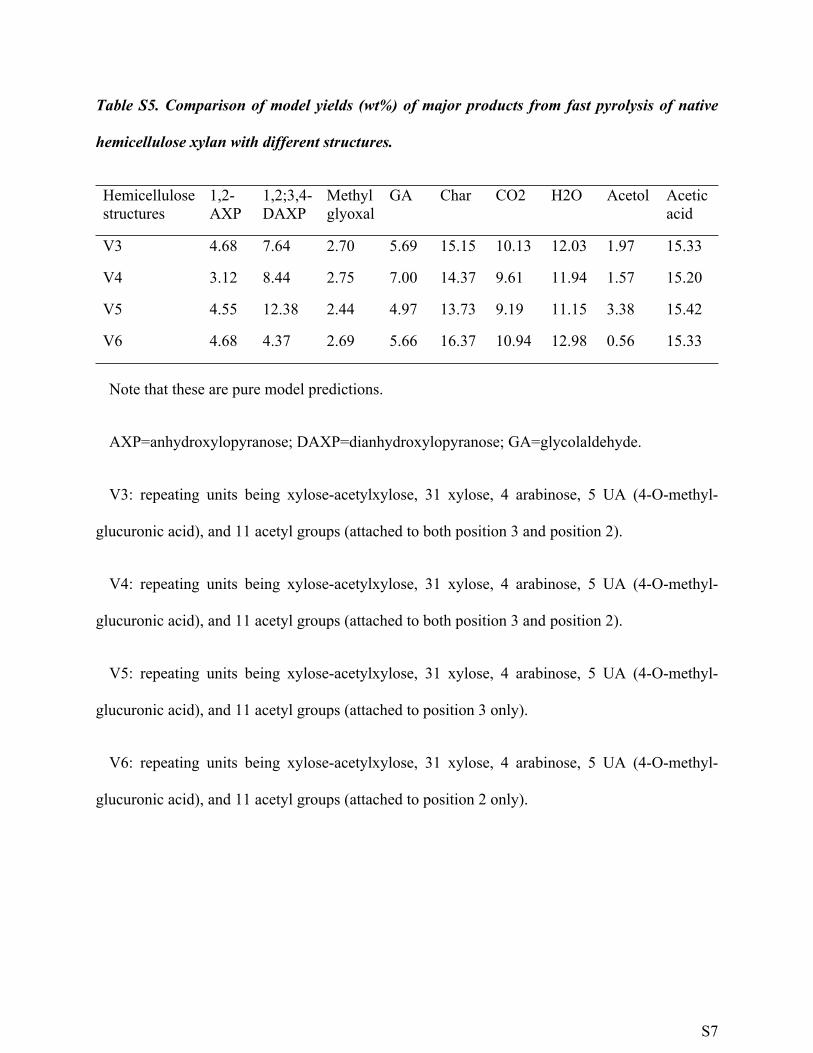
Table S5. Comparison of model yields (wt%) of major products from fast pyrolysis of native
hemicellulose xylan with different structures.
Hemicellulose structures
1,2-AXP
1,2;3,4-DAXP
Methyl glyoxal
GA Char CO2 H2O Acetol Acetic acid
V3 4.68 7.64 2.70 5.69 15.15 10.13 12.03 1.97 15.33
V4 3.12 8.44 2.75 7.00 14.37 9.61 11.94 1.57 15.20
V5 4.55 12.38 2.44 4.97 13.73 9.19 11.15 3.38 15.42
V6 4.68 4.37 2.69 5.66 16.37 10.94 12.98 0.56 15.33
Note that these are pure model predictions.
AXP=anhydroxylopyranose; DAXP=dianhydroxylopyranose; GA=glycolaldehyde.
V3: repeating units being xylose-acetylxylose, 31 xylose, 4 arabinose, 5 UA (4-O-methyl-
glucuronic acid), and 11 acetyl groups (attached to both position 3 and position 2).
V4: repeating units being xylose-acetylxylose, 31 xylose, 4 arabinose, 5 UA (4-O-methyl-
glucuronic acid), and 11 acetyl groups (attached to both position 3 and position 2).
V5: repeating units being xylose-acetylxylose, 31 xylose, 4 arabinose, 5 UA (4-O-methyl-
glucuronic acid), and 11 acetyl groups (attached to position 3 only).
V6: repeating units being xylose-acetylxylose, 31 xylose, 4 arabinose, 5 UA (4-O-methyl-
glucuronic acid), and 11 acetyl groups (attached to position 2 only).
S7

Scheme S1. Proposed structures of hemicellulose extracted from cornstover with varying
initial DP (degree of polymerization).
S8

Scheme S2: Proposed structures of extracted hemicellulose for decomposition into
monomeric, dimeric, or trimeric intermediates.
S9

Scheme S3. Decomposition mechanisms of native hemicellulose chains involving end-groups.
S10
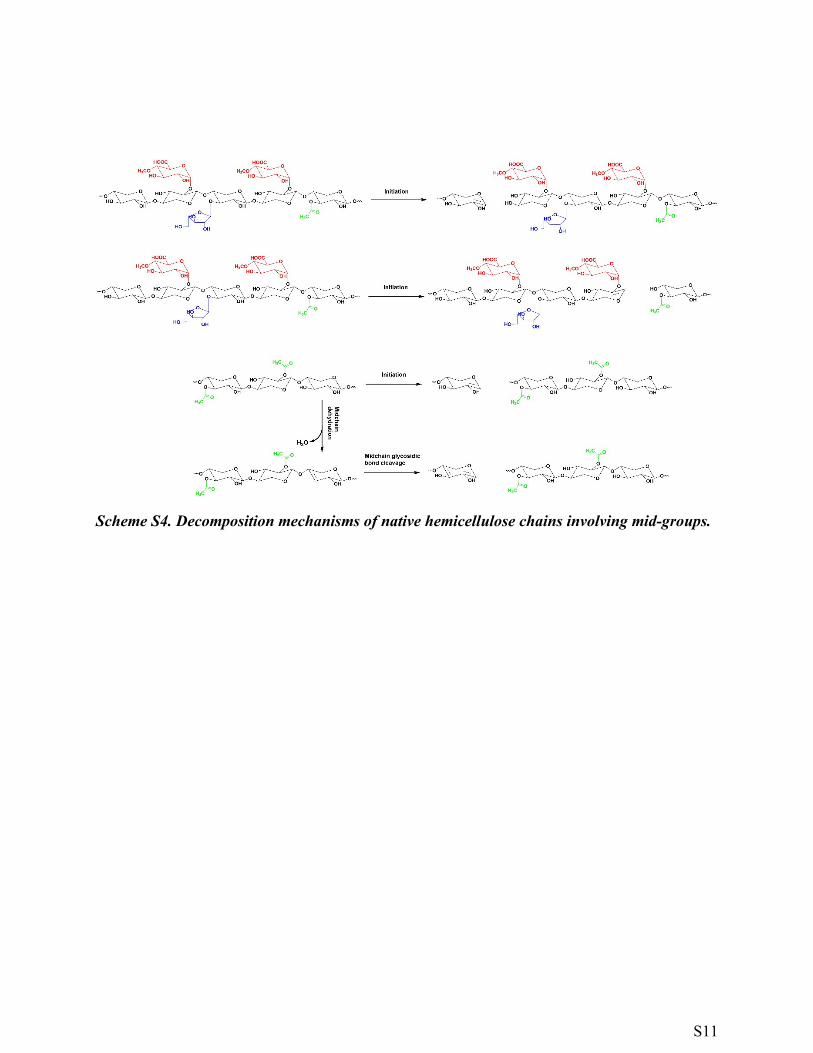
Scheme S4. Decomposition mechanisms of native hemicellulose chains involving mid-groups.
S11

Scheme S5. Decomposition mechanisms of trimeric and dimeric species.
S12

Scheme S5 (continued). Decomposition mechanisms of trimeric and dimeric species.
S13
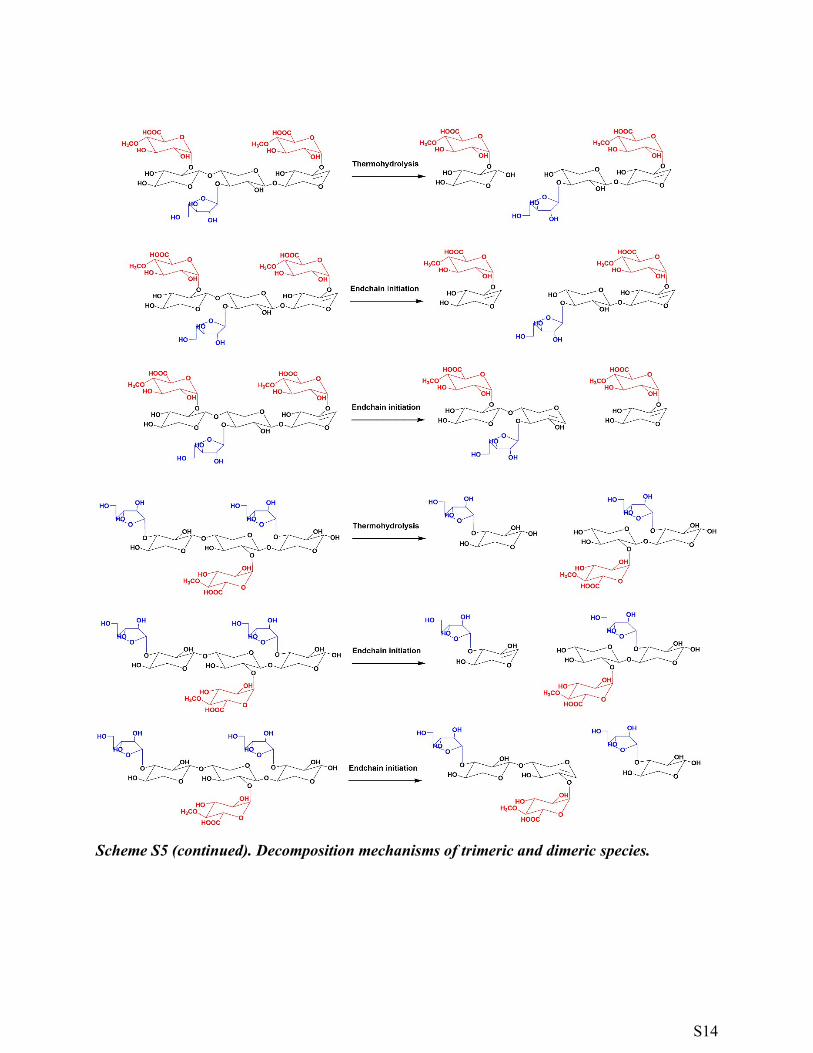
Scheme S5 (continued). Decomposition mechanisms of trimeric and dimeric species.
S14
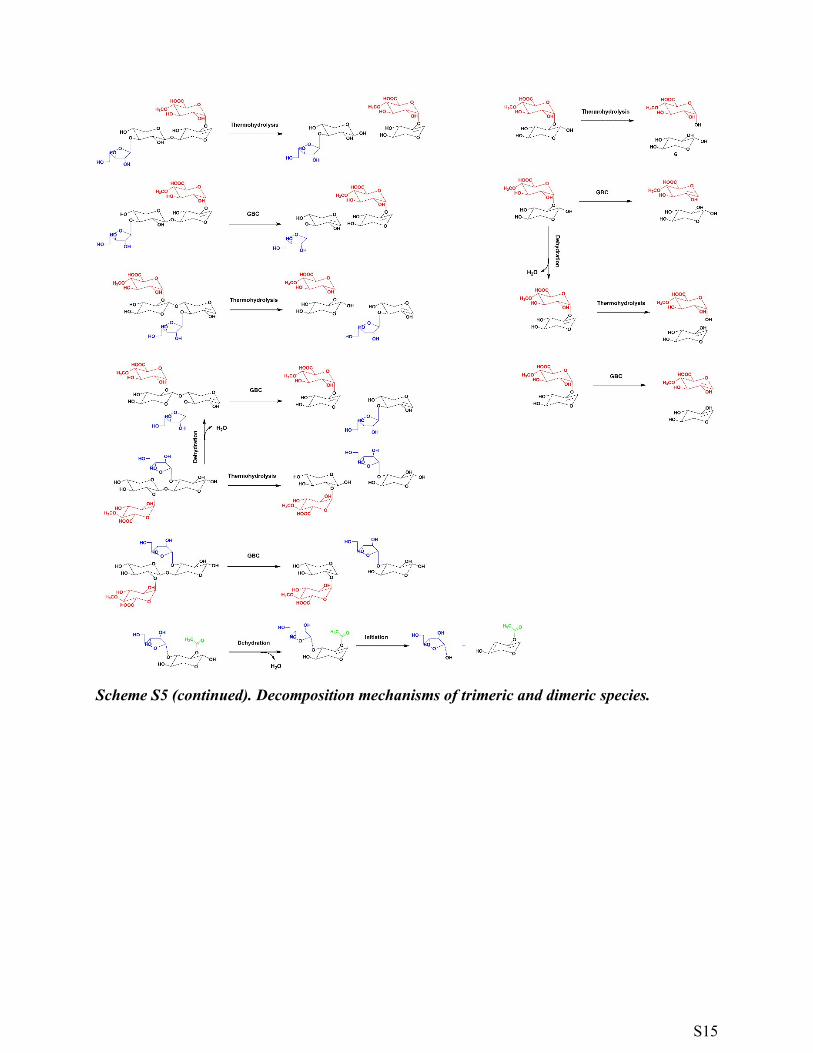
Scheme S5 (continued). Decomposition mechanisms of trimeric and dimeric species.
S15
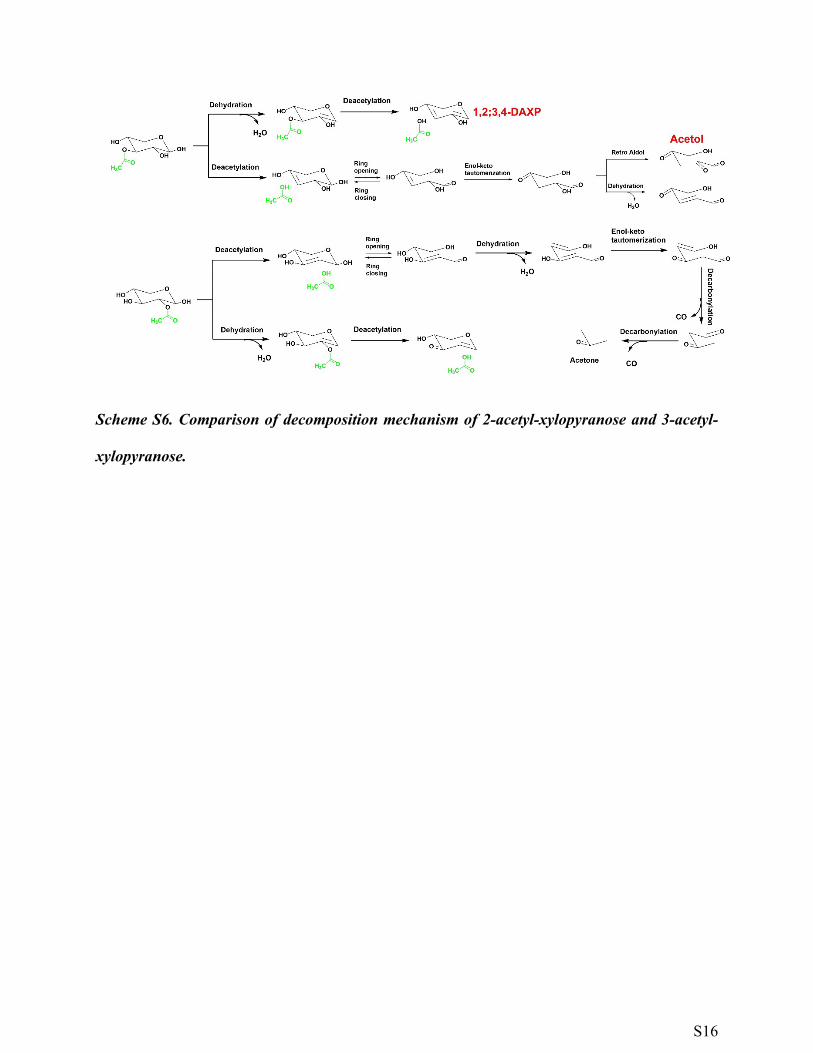
Scheme S6. Comparison of decomposition mechanism of 2-acetyl-xylopyranose and 3-acetyl-
xylopyranose.
S16

Scheme S7. Decomposition mechanisms of low molecular weight species.
S17

Scheme S8. Char formation of various dehydrated species.
S18

Scheme S9. Modified structures of native hemicellulose with varying amount of acetyl groups.
V1: 7 acetyl to 30 xylose; V2: 14 acetyl to 30 xylose; and V3: 11 acetyl to 31 xylose.
S19

Scheme S10. Modified structures of native hemicellulose with different repeating units. V3:
repeating units being xylose-acetylxylose, and V4: repeating units being xylose-acetylxylose.
S20
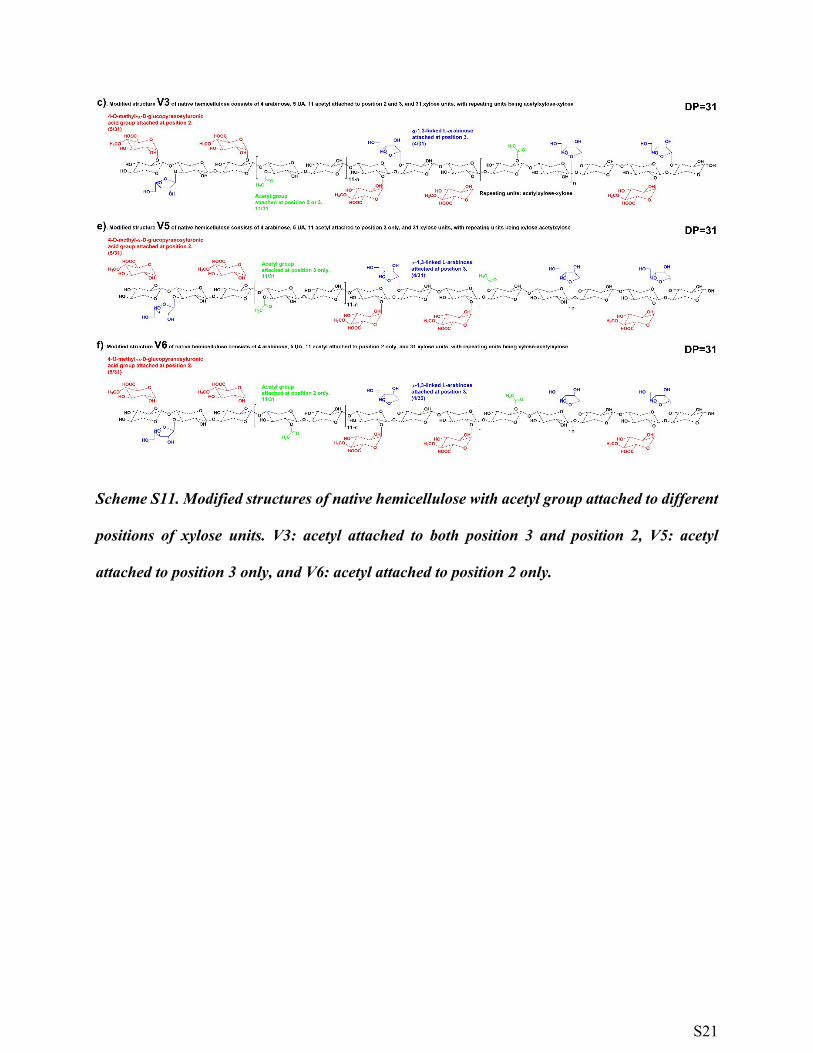
Scheme S11. Modified structures of native hemicellulose with acetyl group attached to different
positions of xylose units. V3: acetyl attached to both position 3 and position 2, V5: acetyl
attached to position 3 only, and V6: acetyl attached to position 2 only.
S21
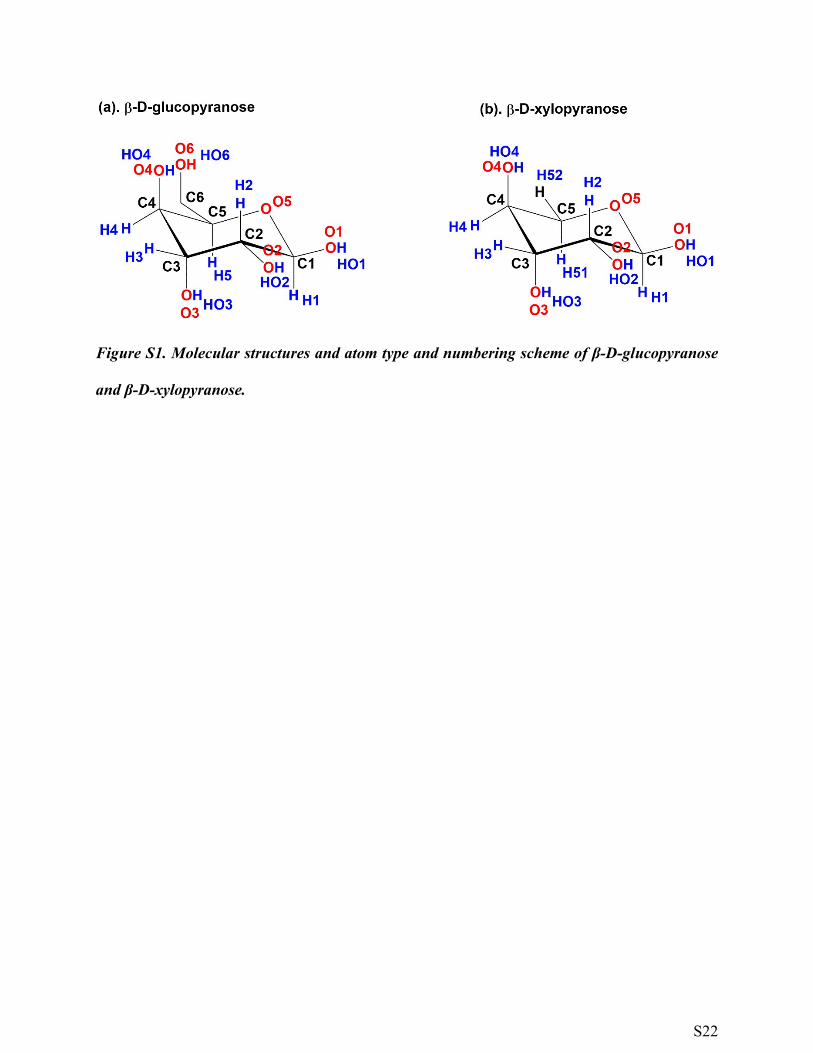
Figure S1. Molecular structures and atom type and numbering scheme of β-D-glucopyranose
and β-D-xylopyranose.
S22

Experiments of fast pyrolysis of extracted hemicellulose by Zhang et al.1
(Adapted with permission from Jing Zhang, Yong S. Choi, Chang G. Yoo, Tae H. Kim, Robert C.
Brown, and Brent H. Shanks, Cellulose–Hemicellulose and Cellulose–Lignin Interactions during
Fast Pyrolysis, ACS Sustainable Chem. Eng., 2015, 3, 293–301. Copyright 2015 American
Chemical Society)
Materials and Methods. Hemicellulose was isolated from cornstover using the method
described below. Hemicellulose was extracted from cornstover by an aqueous ammonia treatment
followed by a hot water treatment.4 Cornstover, which was procured from the Agronomy Farm at
Iowa State University, was ground and screened to a nominal size of 9−35 mesh. Mineral
impurities are known to influence the product distribution during fast pyrolysis of the biomass.
The sieved cornstover was first acid washed to remove inorganic salts. Prior to using this
cornstover sample for pyrolysis studies, it was purified by washing with dilute acid. The cornstover
sample (≈10 g) was washed with 0.1 N HCl (100 mL) for 15 min, followed by two subsequent
washes with deionized water. The purified cornstover sample, containing <0.1 wt % ash, was used
throughout this study. The ash content of biomass samples was determined by subjecting the
sample (1 g) to combustion in a furnace at 575 °C for approximately 6 h. The carbon, hydrogen,
and nitrogen contents of the sample were analyzed by using a TruSpec CHN (Leco) instrument.
The oxygen content was determined by difference. Induced-coupled plasma mass spectrometry
(ICP-MS) was used to analyze the metal ion concentration in the cornstover sample.
Approximately 100 mg of cornstover sample was added into a 25 ml digestion tube with 10 ml of
concentrated nitric acid. The digestion tube was sealed and placed in a microwave for a pressurized
heating program: 1) 40 psi for 6 min; 2) 85 psi for 6 min; 3) 140 psi for 10 min. After digestion, 1
g of solution was taken out and diluted into 30 ml of 1 wt% nitric acid. The metal ions were then
S23

identified and quantified by ICP-MS after the equipment had been calibrated using standard
solutions. The metal ion content in cornstover was calculated by incorporating the dilution factor.
After acid washing to remove the mineral impurities, the cornstover was exposed to a 15 wt %
aqueous ammonia solution in a flow-through column reactor pressurized to 2.3 MPa. The reactor
was placed overnight in an oven set to a temperature of 170 °C to selectively cleave the ether bonds
in lignin for delignification. Exhaustive washing with DI water was performed after the aqueous
ammonia treatment. Then, the treated cornstover was firmly packed into a flow-through column
reactor, which had temperature and pressure control. A 0.07 wt % sulfuric acid aqueous solution
was passed through the reactor with flow rate of 5 mL min-1 at 180 °C under a pressure of 2.5
MPa. During the hot water treatment, the hydronium cation could initiate hemicellulose
depolymerization and cleave acetyl groups with the latter acting as a catalyst for further
depolymerization of hemicellulose. The depolymerized hemicellulose would enter the aqueous
phase thus being separated from the treated cornstover. The passed through solution was collected
and dried in vacuum at 50 °C to obtain solid particles. The solid was then acid washed with the
same condition as previously and ground into a fine powder.
Sample Characterization. Carbohydrate and lignin content in the biomass samples was
analyzed following the protocol from the NREL Chemical Analysis and Testing Stardard
Procedures: NREL LAP, TP-510-42618. Before quantification, biomass samples underwent two-
stage acid hydrolysis: (1) 72 wt % sulfuric acid for 1 h at 30 °C and (2) 4 wt % sulfuric acid for 1
h inside of an autoclave with the temperature held at 120 °C. Solid residues after the two-stage
hydrolysis were deemed acid insoluble lignin (AIL). Saccharides, which were in the liquid phase
after hydrolysis, were quantified using a HPLC with a Bio-Rad Aminex HPX-87P column (Bio-
Rad Laboratories, Hercules, CA) equipped with a refractive index detector. The acid soluble lignin
S24

(ASL) was quantified by measuring its absorbance at 320 nm in a UV−visible spectrophotometer.
Ash content in biomass was determined by oxidizing sample at 575 °C for 6 h inside of a
thermogravimetric analyzer (Mettler-Toledo Analytical).
Pyrolyzer-GC-MS/FID Experiments. The pyrolysis experiments were performed in a single-
shot micopyrolyzer (Model 2020 iS, Frontier Laboratories, Japan). Before pyrolysis,
approximately 500 μg of biomass was added to a deactivated stainless steel sample cup. The loaded
sample cup was then dropped gravitationally into a quartz pyrolysis tube. The pyrolysis
temperature of 500 °C was maintained by a tubular furnace surrounding the quartz reaction tube.
During the experiment, the generated volatile products were swept by the helium gas into a Bruker
430-GC through a deactivated needle. A capillary GC column, ZB-1701 (Phenomenex) was used
for separation of the volatile products. The column was either connected to a mass spectrometer
(MS, Saturn 2000) for product identification or to a flame ionization detector (FID) for product
quantification.
Product Identification and Quantification: The quartz pyrolysis tube inside of the single-shot
micopyrolyzer had an inner diameter of 4.7 mm and a length of 114 mm. Helium gas, which served
as the pyrolysis atmosphere and GC carrier gas, flowed through the pyrolysis system at a rate of
9.9 cm s-1. Before pyrolysis, the loaded cup was purged with helium for 30 seconds to remove
oxygen inside the cup then dropped into the heated furnace. As demonstrated previously,
maintaining a sample weight between 200-800 μg and particle size less than 75 μm ensured
negligible heat transfer and mass transfer limitation.5 The GC column contained a polar stationary
phase consisting of 14% cyanopropylphenyl and 86% dimethylpolysiloxane, with a length of 60
m, inner diameter of 0.250 mm and film thickness of 0.250 μm. The GC method consisted of an
injection temperature of 300 °C, split ratio of 100:1 and a constant carrier gas flow of 1 ml min-1
S25
through the column. The GC ramping program started with a 3 min hold at 35 °C, then increased
to 300 °C at a rate of 5 °C min-1 and finally was held at 300 °C for 4 min. To identify products,
the GC was connected to a mass spectrometer (MS) (Saturn 2000), using the electron ionization
mode with a 10 μamp emission current in the m/z ranging from 10 to 300. The mass spectra peaks
were compared with standard spectra of chemical compounds within the NIST library database.
Then the chemical identities were verified by running standards of the matching chemicals in the
same GC-MS system. As the column used had a similar stationary phase composition to previous
reports, the elution order of the chemical compounds in chromatogram was expected to match.6, 7
All the pure compounds used for peak confirmation were purchased from Sigma–Aldrich (US)
except 4-vinyl phenol, which was purchased from Alfa Aesar (US).
After product identification, a flame ionization detector (FID) was substituted for the MS for
product quantification. The FID was held at 300 °C with an air flow rate of 300 ml min-1 and
hydrogen flow rate of 30 ml min-1. The pure compounds used in product identification were also
used in calibration of the FID results. Standard solutions of the identified chemicals (except for
those discussed subsequently) were prepared by dissolving them in acetone, which eliminated
solute-solvent interaction for the chemicals.5 The levoglucosan calibration was performed by
pyrolyzing a known amount of levoglucosan in the micopyrolyzer-GC-FID system, which gave a
single peak corresponding to levoglucosan as verified by MS. For the glycolaldehyde calibration,
glycolaldehyde dimer was pyrolyzed at about 300 °C resulting in a single sharp peak in its
chromatogram, which was proven to be glycolaldehyde by MS. For dianhydro-xylose (DAXP 1,
DAXP 2, other DAXP 1 and other DAXP 2), which have a molecular weight of 114, a calibration
curve of a similar compound - 4-hydroxy-5-methyl-3-furanone (molecular weight 114) - was used
to determine their yields. For anhydro-xylanpyranose (AXP, other AXP), dianhydro-
S26
glucopyranose and levoglucosan-furanose, the calibration curve of levoglucosan was applied as
the proxy to estimate their yields.8 Eight-point straight line calibration curves (with R2≥0.95)
obtained by running duplicate standards at four different concentration levels (or sample weight)
were established for the pure compounds relating the peak area in the GC-FID chromatogram to
their respective standard concentration (or sample weight). As a result, forty eight compounds
(excluding char and gaseous compounds) were identified based on their mass spectrum (see Table
S1) and quantified.
To measure the CO and CO2 generated during pyrolysis, a De-Jaye gas analyzer equipped with
an infrared detector was connected to the split line of GC. The CO and CO2 concentrations were
recorded every second so the yield of CO and CO2 could be calculated by summing the amount of
gas generated over time using the known overall gas flow rate. The char yield was obtained by
weighing the sample cup before and after pyrolysis using a Mettler Toledo microbalance with a
sensitivity of 1 μg.
S27
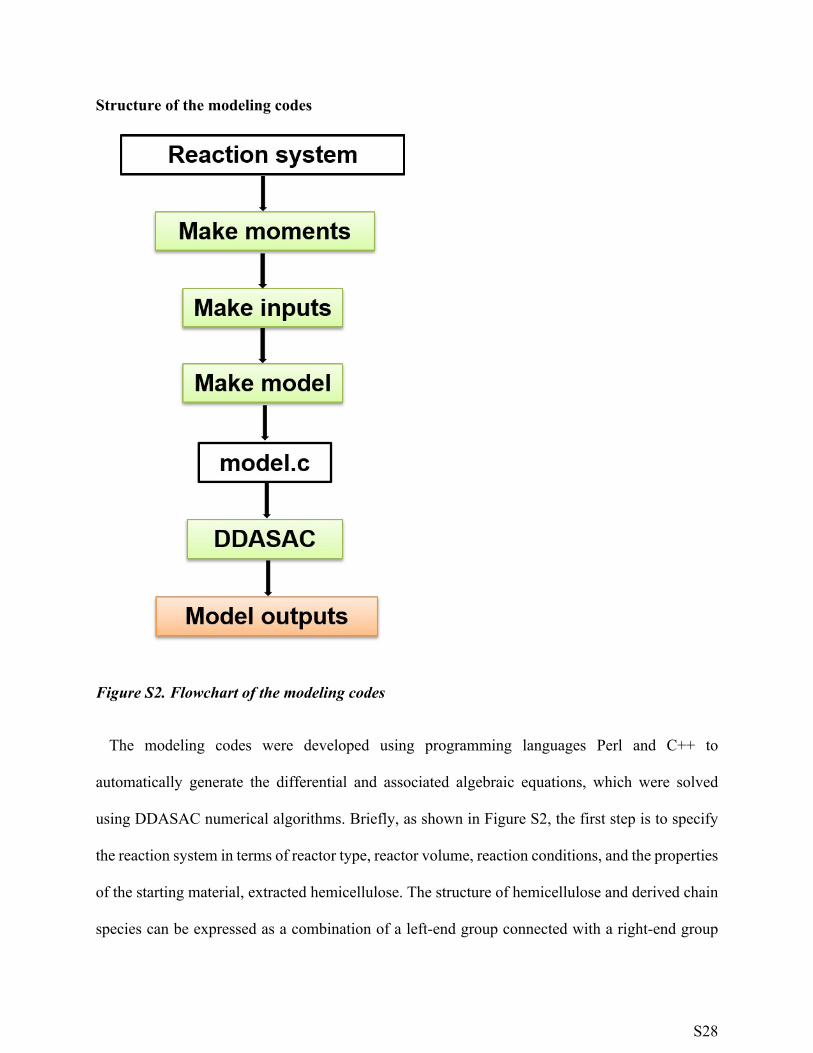
Structure of the modeling codes
Figure S2. Flowchart of the modeling codes
The modeling codes were developed using programming languages Perl and C++ to
automatically generate the differential and associated algebraic equations, which were solved
using DDASAC numerical algorithms. Briefly, as shown in Figure S2, the first step is to specify
the reaction system in terms of reactor type, reactor volume, reaction conditions, and the properties
of the starting material, extracted hemicellulose. The structure of hemicellulose and derived chain
species can be expressed as a combination of a left-end group connected with a right-end group
S28
and/or a midgroup (Figure 2). Then the detailed reaction network of the decomposition of
hemicellulose and derived chain species and the reactions of low molecular weight (LMW) species
were specified. The rate equations and mass balance equations were generated using programming
languages Perl. The approach of continuous distribution kinetics was adopted here to describe and
simplify the decomposition dynamics of polymer chain species. The concentration of polymer
chains is modeled as a function of chain length and pyrolysis time, resulting in integral-differential
rate equations. Moment operations were employed to simplify and transform them into ordinary
differential equations (ODEs), implemented by the “Make moments” module. Then the “Make
inputs” module specifies the initials values of all the variables and parameters and collects all the
differential and associated algebraic equations for chain species and LMW species. Then the
“Make model” module translates all these into a “model.c” in C++ using Perl. Lastly, DDASAC,
a commercial software that solves nonlinear initial-value problems involving stiff implicit systems
of ordinary differential and algebraic equations, was used to solve the model and to provide species
profiles and other information.
S29

References
1. J. Zhang, Y. Choi, C. Yoo, T. H. Kim, R. Brown and B. H. Shanks, ACS Sustainable
Chemistry & Engineering, 2015, 3, 293–301.
2. J. Gu and J. M. Catchmark, Cellulose, 2013, 20, 1613-1627.
3. S. R. Wang, B. Ru, G. X. Dai, W. X. Sun, K. Z. Qiu and J. S. Zhou, Bioresour. Technol.,
2015, 190, 211-218.
4. T. H. Kim and Y. Y. Lee, Bioresour. Technol., 2006, 97, 224-232.
5. P. R. Patwardhan, J. A. Satrio, R. C. Brown and B. H. Shanks, J. Anal. Appl. Pyrolysis,
2009, 86, 323-330.
6. M. Garcia-Perez, S. Wang, J. Shen, M. Rhodes, W. J. Lee and C.-Z. Li, Energy Fuels, 2008,
22, 2022-2032.
7. G. Jiang, D. J. Nowakowski and A. V. Bridgwater, Energy Fuels, 2010, 24, 4470-4475.
8. P. R. Patwardhan, R. C. Brown and B. H. Shanks, Chemsuschem, 2011, 4, 636-643.
S30


![mechanistic study Supporting Information via iodocyclization … · 2018. 8. 10. · 1 Supporting Information Synthesis of thieno[2,3-c]acridine and furo[2,3-c]acridine derivatives](https://static.fdocuments.in/doc/165x107/5fe8ecb6345297152769f391/mechanistic-study-supporting-information-via-iodocyclization-2018-8-10-1-supporting.jpg)