Support and Resistance Trading Is Not For Me
32
Not In My Playbook http://www.netpicks.com/support-and-resistance-trading/
-
Upload
netpickstrading -
Category
Education
-
view
105 -
download
2
Transcript of Support and Resistance Trading Is Not For Me

Not In My Playbook http://www.netpicks.com/support-and-resistance-trading/

When you write trading tips for a blog, you often wonder if people read them
and act of the information that is presented. Receiving emails is a great way to know you are contributing to the trading world in some small way.

I received an email from a reader named Devon and it was in regards to
support and resistance trading.

Shane - I've seen many of your trading blog post and I think they are terrific. My question
however is that I see trades around support or resistance areas and you never take them. I've
also seen you trade right into a support or resistance level. Since multiple hits of a level
make it strong why do you skip them?

Thanks for the email Devon. Over the years I lost count how often I've heard
that multiple hits on a support or resistance level tends to make it
stronger.

Some trading systems and methods actually use this belief as the
backbone of the method. Stronger is certainly a matter of opinion and what some may consider strong, others will
consider it weak.

So the question is how do you measure how strong a level is? What measurable variable do you use to tell the difference between a strong hold and weak hold? Many traders would
have totally different opinions on which S/R levels are good ones to
trade.

When I look at an area that has held price, what matters to me is how long price hung around at the support or
resistance level. Fast rejections due to buying or selling pressure is something
I would consider strong.

If price tends to hang out at the level or rejects and quickly returns, I think it's safe to suggest lack of buying or
selling interest.

I think it is a dangerous practice to simply assume that multiple hits and rejection is a direct relation to strong levels. What occurs quite often is a confidence booster that in the end,
causes some oversize in the loss department. This graphic should
explain.
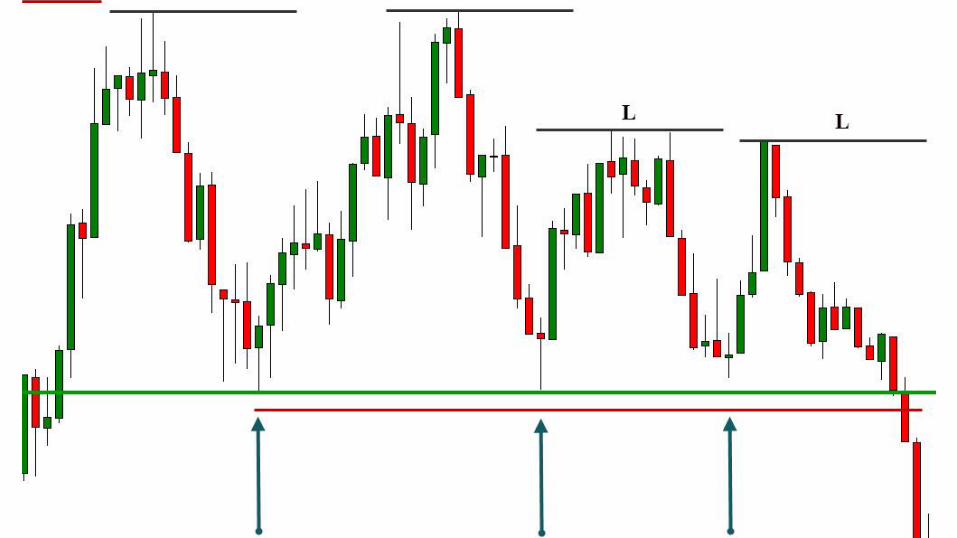

There is obvious buying pressure at the levels marked with the arrows and you can clearly see the buyers stepped
in quite strongly. Keep in mind that those who trade support/resistance bounces usually place their stop just
beyond the level.

These are solid rejections which can often times lull traders into trading too
confidently and increasing their position size.
The more traders that buy at this level, the more stops tend to cluster beyond the level. The red line signifies where all the textbooks tell you to place your stops when utilizing support trading.
It's a disaster waiting to happen when the level breaks, stops are triggered, and slippage is a strong possibility.

Even worse, the losses a trader will take will depend on how aggressively they increased position sizing because
"they knew" the level would hold?
But there is a clue that shows that the conviction of the buyers is beginning to slacken and a heads up for you to adjust position sizing or skip the next trade. Notice the black lines plus the
letter "L". There was strong rejections at the support line but the excursion
away is lessening.


The last push even has an extremely bull candle showing strong upwards
momentum that is stopped right in it's tracks.


Notice the far right of the chart that when price broke the support level
that had multiple direct hits, it broke with strength taking stops with it.

I don't trade support and resistance bounces as seen in that chart. I prefer
bounces and a pullback because my experience for myself (and through
many many trades) playing the bounces as shown don't have an edge.

As well, I will also be interested in flushes in the support and resistance
zones.

This way of trading for me applies to day trading and swing trading. It's
valid on any time frame. These are not trades that are blindly taken and also revolve around trend direction, state of higher time frame (not necessarily trend direction), and
overall context

This chart highlights roughly what I would look for. Price had just
slammed through an area of resistance (now marked Fmr Resistance) and
pulled back and price was supported (marked Current Support) where
priced moved away to the previous high.


The pullback to current support was anything but strong (the candles tell
the story) and we see a test of current support where price breaks it and is
quickly bought back. I marked that as a flush of weak longs given the
preceding price action. That is a sloppy test might be a trade for me.

Imagine for a moment that price did not flush but did continue upwards
after the bounce as seen on the chart. The pullbacks would come into play as
ways to enter this move. There are various ways to enter pullback trades
but those are beyond the scope of this trading tip.


I believe every trader should take what they have read and seek to verify the
validity of the content through their own testing. Reading and being taught is one thing but I have always found the testing phase of any "market truth" much more
valuable than what I read or what taught.

If you have found success trading support and resistance as taught by the book, I applaud you. I just never
found validity in trading it the way it is normally presented.