Technical Analysis/Trading Introduction. Overview Stockcharts.com What is Technical Analysis/Trading...
22
Technical Analysis/Trading Introduction
-
Upload
alberta-bond -
Category
Documents
-
view
242 -
download
4
Transcript of Technical Analysis/Trading Introduction. Overview Stockcharts.com What is Technical Analysis/Trading...
Technical Analysis/TradingIntroduction
Overview
• Stockcharts.com• What is Technical Analysis/Trading• Candlesticks, Bar Charts• Trend Lines, Support, Resistance• Gaps• RSI
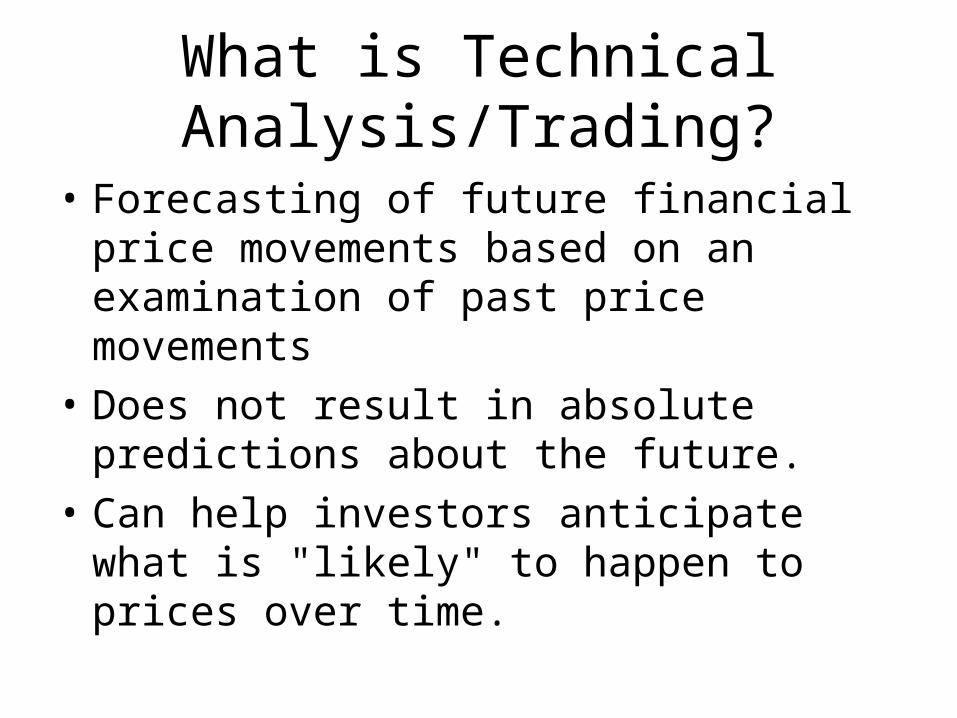
What is Technical Analysis/Trading?
• Forecasting of future financial price movements based on an examination of past price movements
• Does not result in absolute predictions about the future.
• Can help investors anticipate what is "likely" to happen to prices over time.

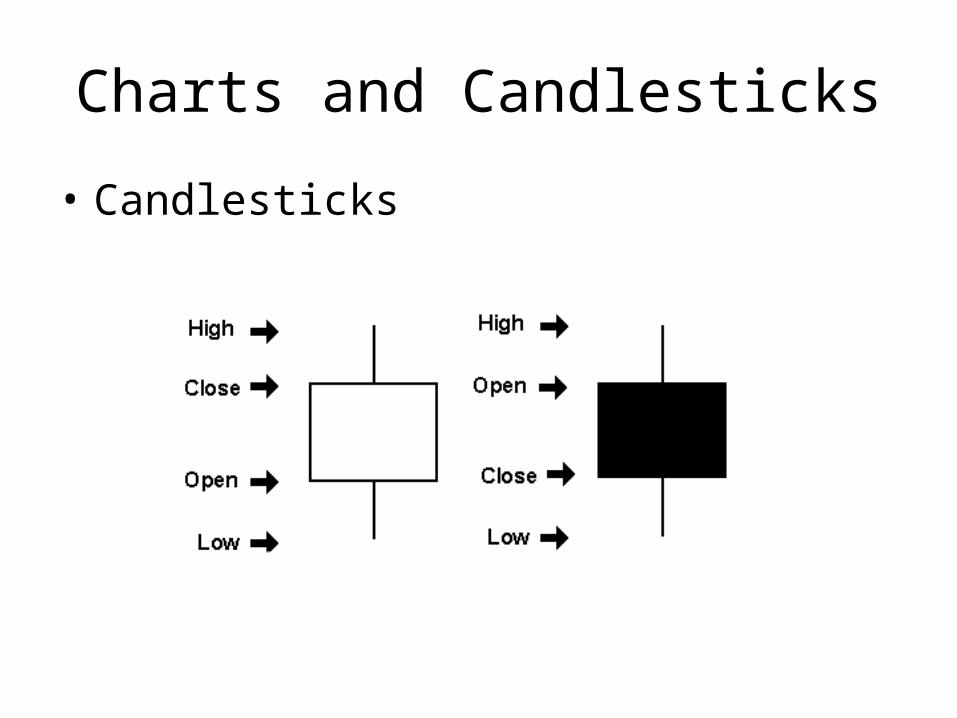
Charts and Candlesticks
• A price chart is a sequence of prices plotted over a specific time frame
• X-axis represents the time scale• Y-axis represents price scale/level
Charts and Candlesticks
• Candlesticks

Charts and Candlesticks
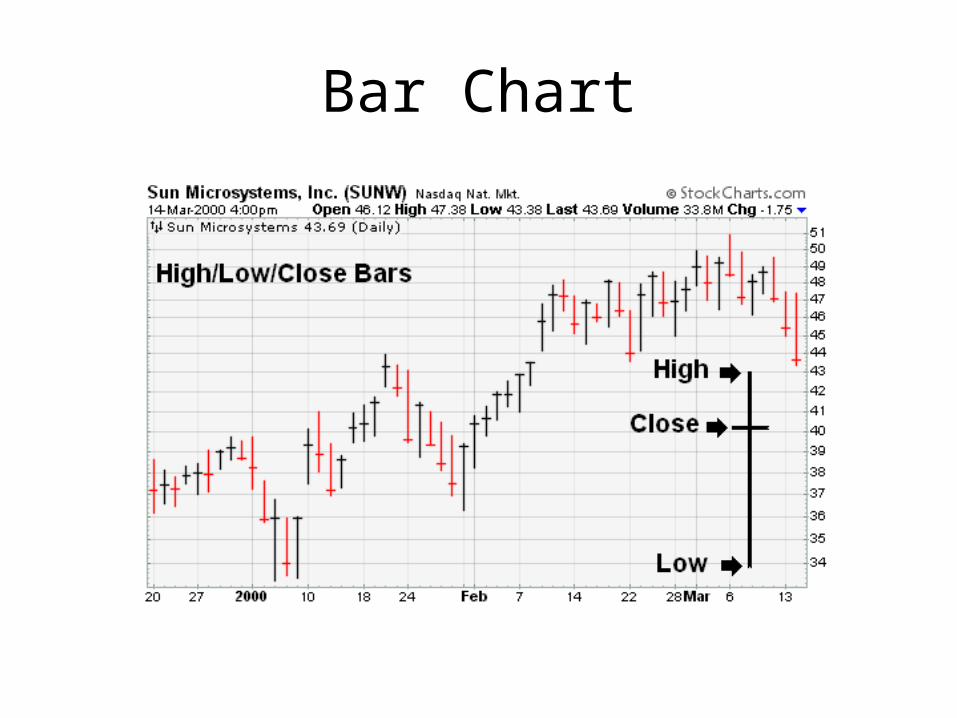
Bar Chart
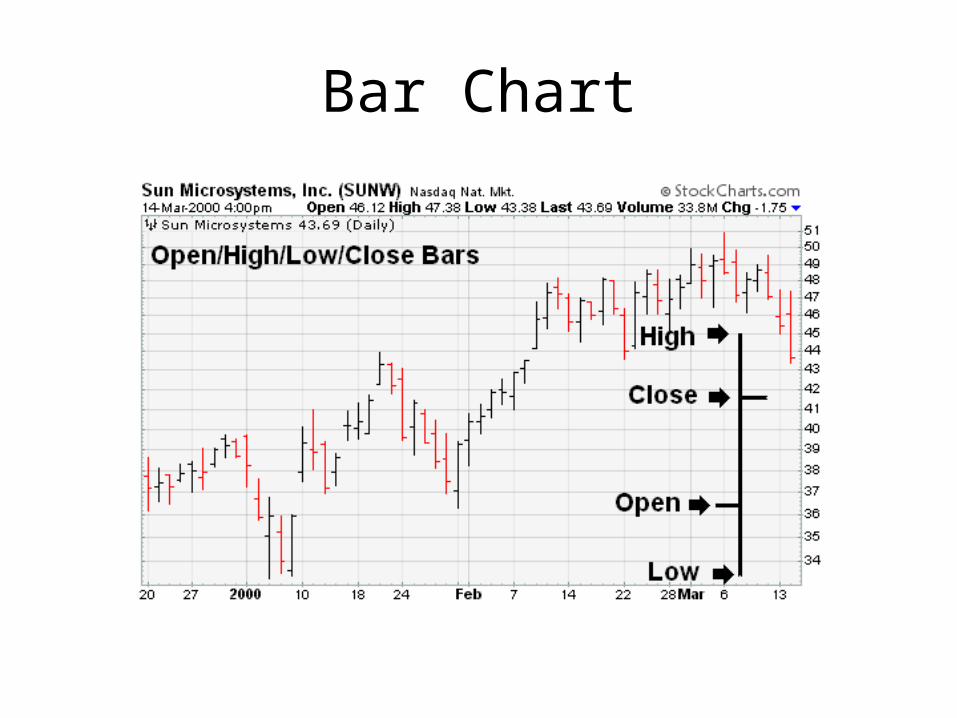
Bar Chart
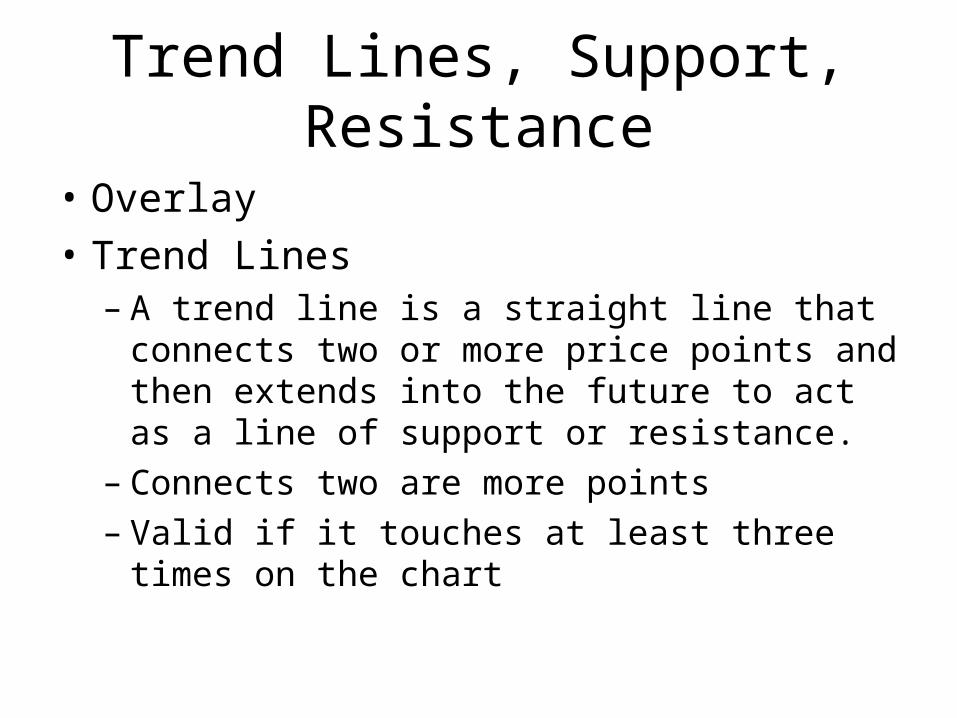
• Overlay• Trend Lines– A trend line is a straight line that connects two or
more price points and then extends into the future to act as a line of support or resistance.
– Connects two are more points– Valid if it touches at least three times on the chart
Trend Lines, Support, Resistance
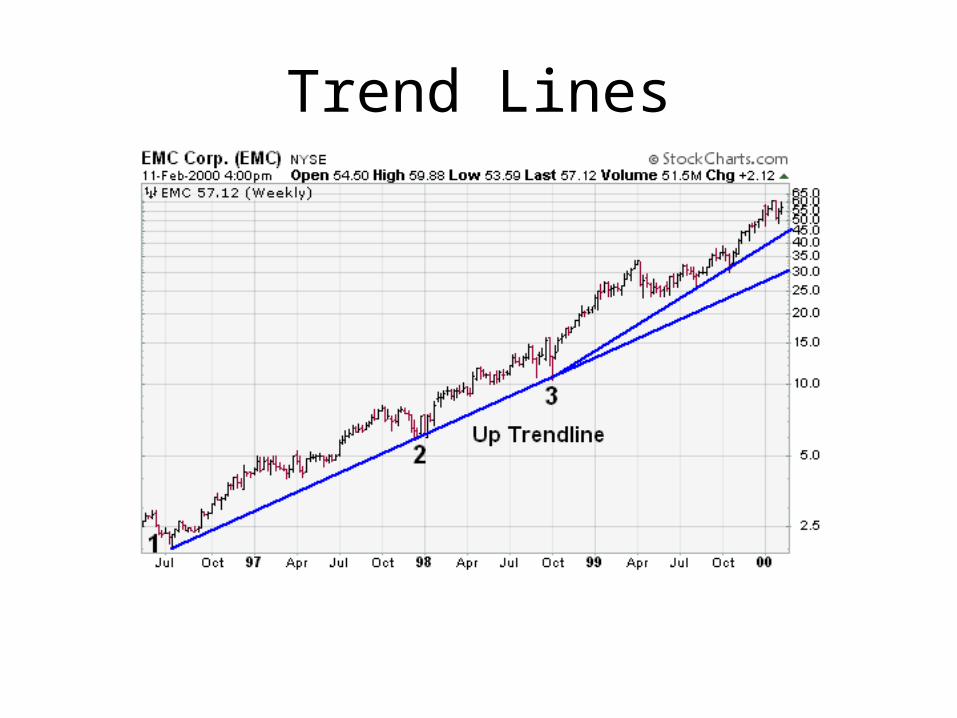
Trend Lines
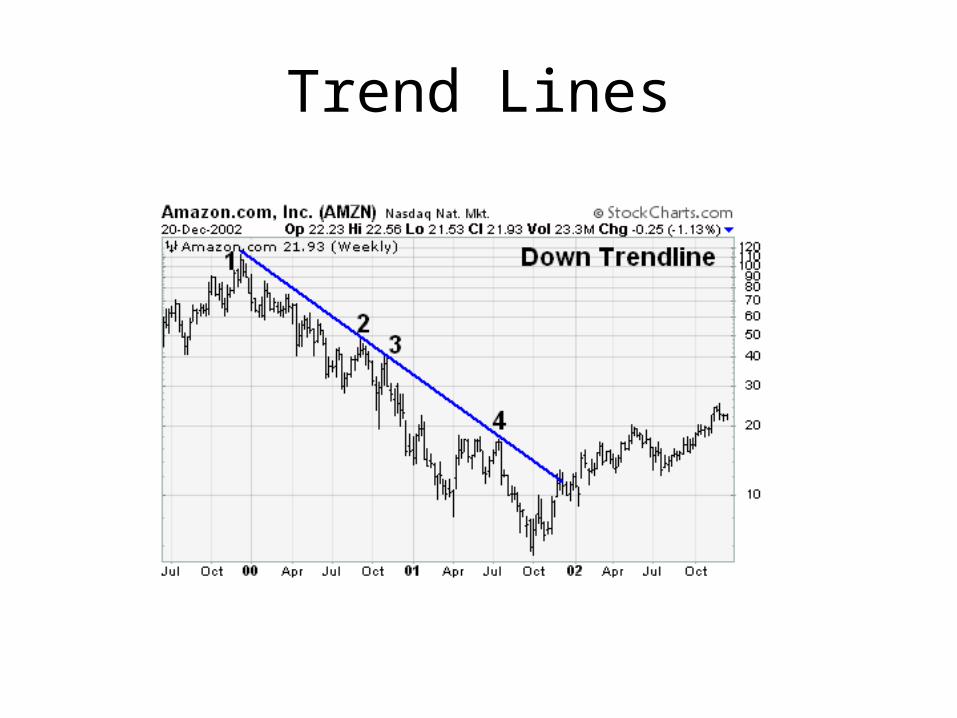
Trend Lines
Support and Resistance
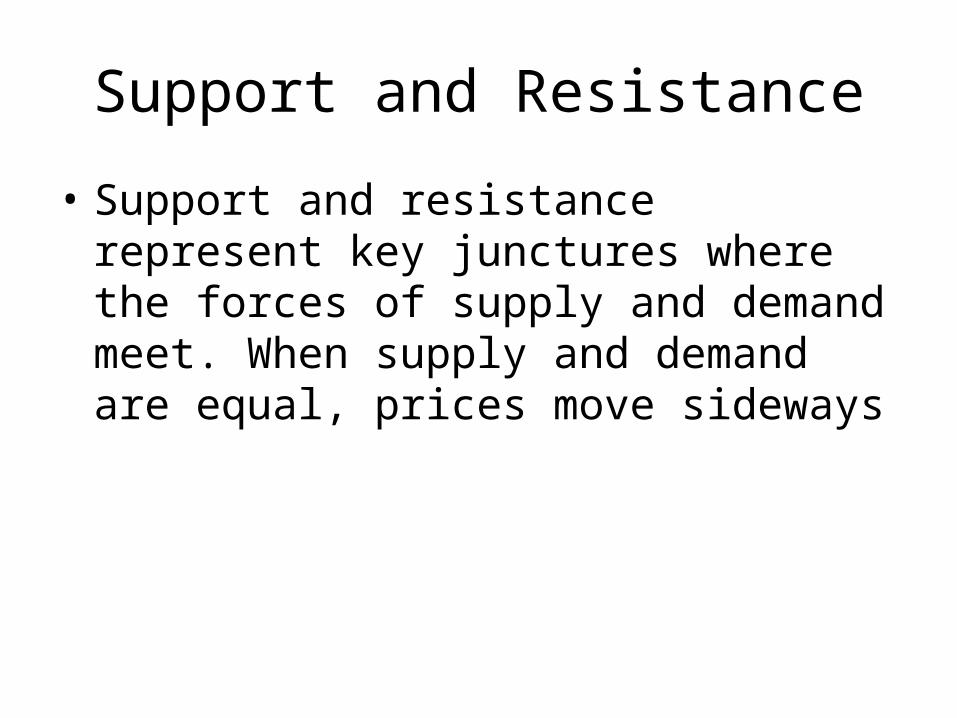
• Support and resistance represent key junctures where the forces of supply and demand meet. When supply and demand are equal, prices move sideways
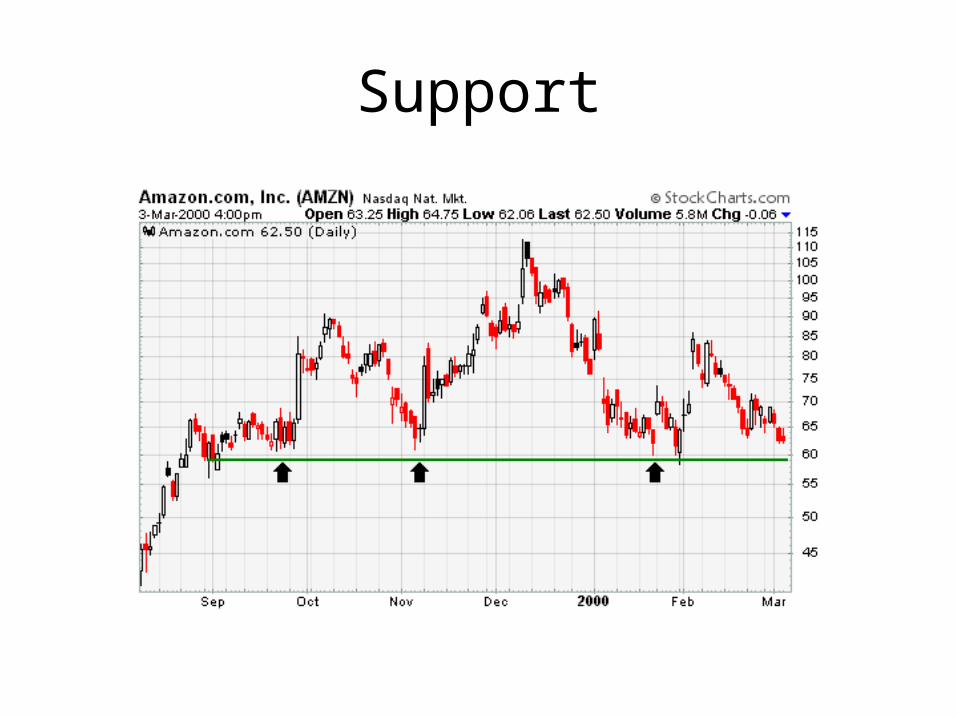
Support• Support is the price level at which demand is
thought to be strong enough to prevent the price from declining further. The logic dictates that as the price declines towards support and gets cheaper, buyers become more inclined to buy and sellers become less inclined to sell. By the time the price reaches the support level, it is believed that demand will overcome supply and prevent the price from falling below support.
• Can have brief dips below and still be considered support level
Support
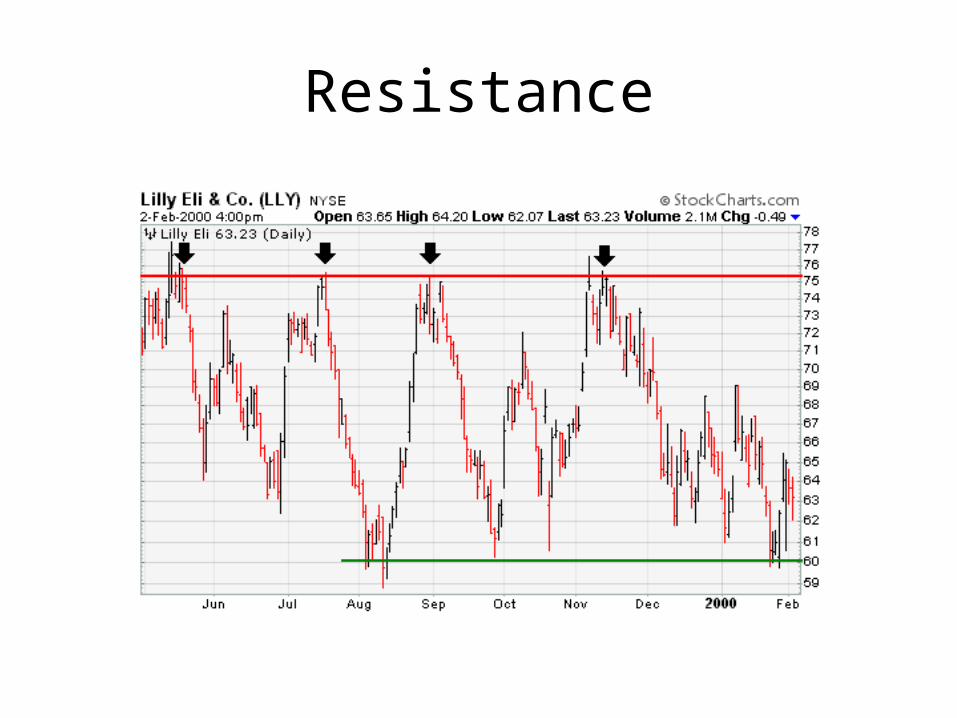
Resistance• Resistance is the price level at which selling is
thought to be strong enough to prevent the price from rising further. The logic dictates that as the price advances towards resistance, sellers become more inclined to sell and buyers become less inclined to buy. By the time the price reaches the resistance level, it is believed that supply will overcome demand and prevent the price from rising above resistance.
• Can have brief dips above and still be considered support level
Resistance
Gaps
• A gap is an area on a price chart in which there were no trades.
• Normally this occurs between the close of the market on one day and the next day's open
• Can show something important has happened (good or bad)
• Can also occur when trading volume is low.
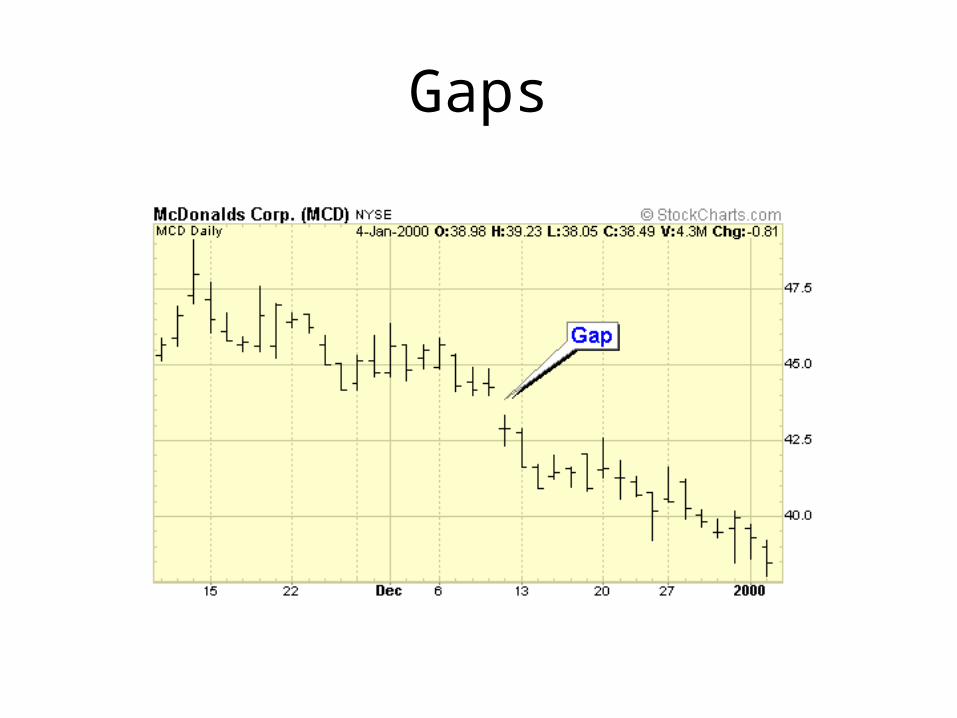
Gaps
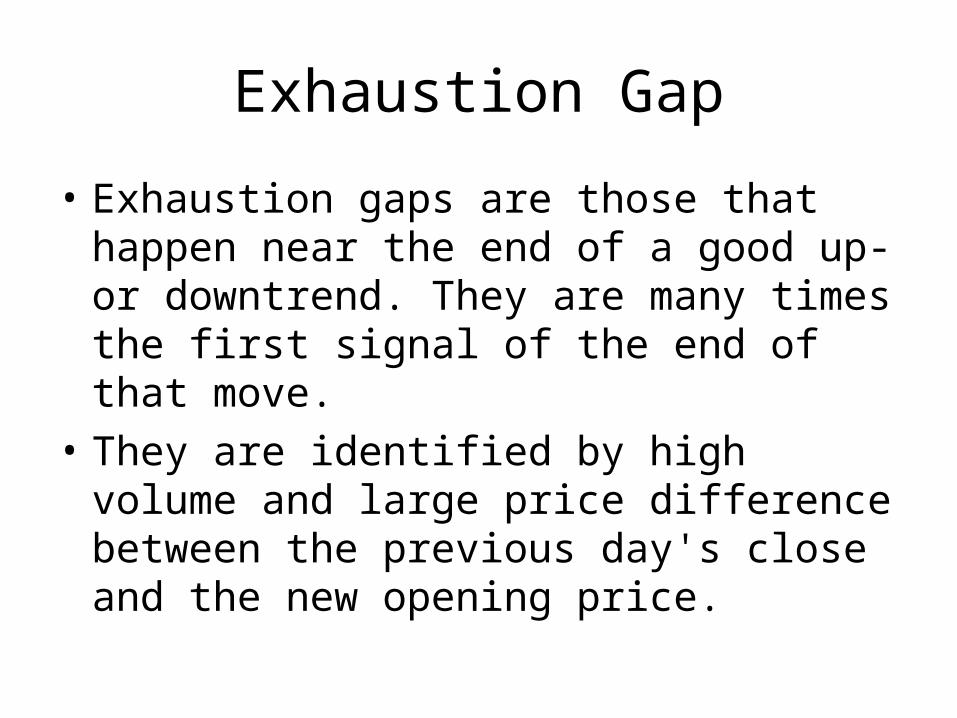
Exhaustion Gap
• Exhaustion gaps are those that happen near the end of a good up- or downtrend. They are many times the first signal of the end of that move.
• They are identified by high volume and large price difference between the previous day's close and the new opening price.
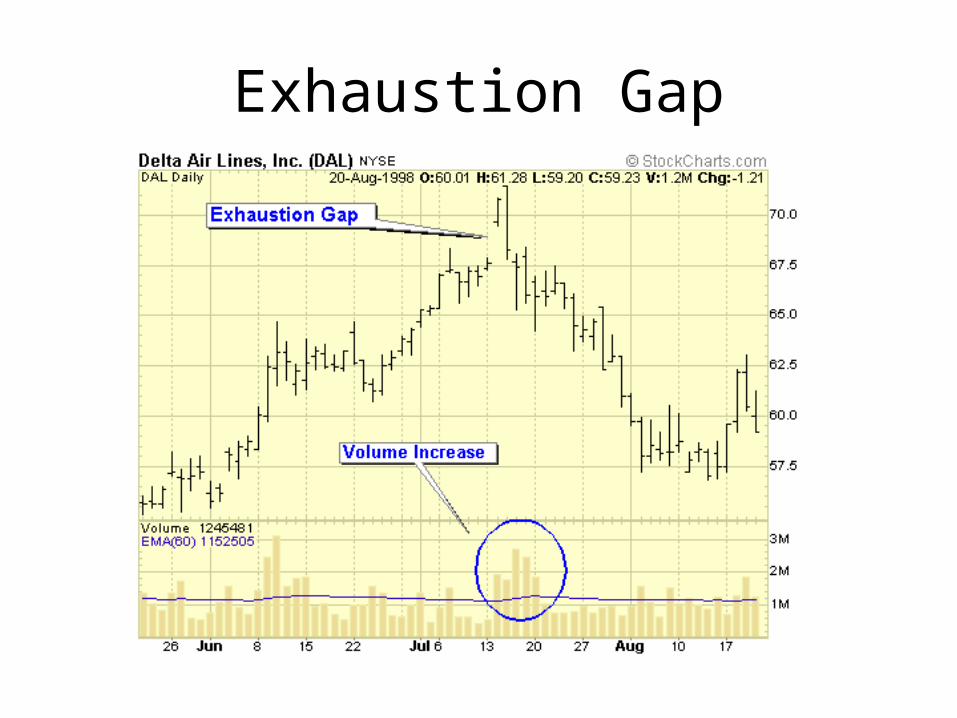
Exhaustion Gap
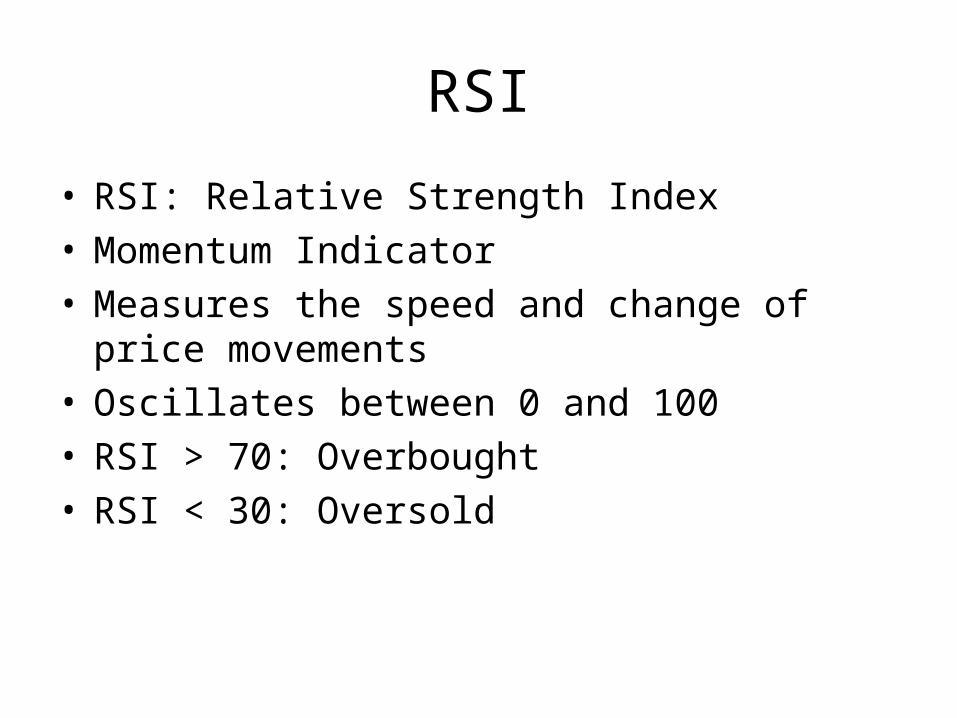
RSI
• RSI: Relative Strength Index• Momentum Indicator• Measures the speed and change of price movements• Oscillates between 0 and 100• RSI > 70: Overbought• RSI < 30: Oversold

RSI