
Supply Chain Performance Measurement with Supply Chain ...
11
Supply Chain Performance Measurement with Supply Chain Operation References Approach (a Case Study in a Batik Company) Novie Susanto, Ratna Purwaningsih, Rani Rumita and Emanuela Septia Industrial Engineering Department, Faculty of Engineering Diponegoro University, Semarang, Indonesia [email protected], [email protected], [email protected], [email protected] Abstract In carrying out the business activities especially in procurement process, CV. PT experienced some problems, such as incompatibility the material specifications and broken stitches on cloth. This problem causes a decrease of company productivity. Therefore, an evaluation of supply chain performance is needed in order to identify problem indicators, and determine improvement strategies for problem indicators. In this study, the measurement of the company supply chain performance is using the Supply Chain Operation Reference (SCOR) approach. The initial hierarchy model of performance measurement is adjusted to the condition of the company to measure supply chain performance using KPI performance indicators. A Snorm De Boer then is utilized to serves and equalize the matrix values derived from company annual data. The final stage in this study is measuring the importance of performance indicators using pairwise comparison weighting. The results obtained in this study are the total supply chain performance of CV. PT is 69.983 included in the average category. There are several performance indicators included in the average and marginal categories, so it needs to be improved. The improvement is given based on the practices in SCOR 12.0. Keywords Supply Chain, Procurement, Batik. 1. Introduction The development of the industrial world which is increasingly fast challenging between companies is also increasingly stringent. In the past few years, excellence in supply optimization and integration has become the focus of several large corporate organizations in the world. The increasingly fierce business competition in this era of globalization requires every effort to rearrange its business strategies and challenges. The essence of competition discusses how companies implement processes in producing products that are better, cheaper and faster than produced (Amit and Zott 2010). The high business competition is one of the reasons companies must fulfil customer orders in the right amount and time. It is intended that the company can control the market share in the community. This condition shows the importance of improving performance, not only within a company but also other parties in the supply chain involved, in order to compete with other companies or supply chains. Performance measurement is very important because it can control the system both directly and indirectly. Performance measurement serves to keep the company on track to achieve supply chain goals. In the context of supply chain management, performance measurement is very important to support the success of a supply chain management. The concept of supply chain management is able to integrate the management of various management functions in a relationship between organizations forming an integrated and mutually supportive system (Mutakin 2011). CV. PT is one of the batik industries that located in Solo, Central Java. In carrying out its business activities, this CV has problems starting from the procurement process to the production process which will affect the quality of batik. In the process of procurement, CV has many problems, which is the incompatibility of the specifications of the material sent, such as the incompatibility of the load of the dye drug, causing the resulting a dull colour. Another Proceedings of the International Conference on Industrial Engineering and Operations Management Sao Paulo, Brazil, April 5 - 8, 2021 © IEOM Society International 1928
Transcript of Supply Chain Performance Measurement with Supply Chain ...

Supply Chain Performance Measurement with Supply Chain Operation References Approach (a Case Study in a
Batik Company)
Novie Susanto, Ratna Purwaningsih, Rani Rumita and Emanuela Septia Industrial Engineering Department, Faculty of Engineering
Diponegoro University, Semarang, Indonesia [email protected], [email protected], [email protected],
Abstract
In carrying out the business activities especially in procurement process, CV. PT experienced some problems, such as incompatibility the material specifications and broken stitches on cloth. This problem causes a decrease of company productivity. Therefore, an evaluation of supply chain performance is needed in order to identify problem indicators, and determine improvement strategies for problem indicators. In this study, the measurement of the company supply chain performance is using the Supply Chain Operation Reference (SCOR) approach. The initial hierarchy model of performance measurement is adjusted to the condition of the company to measure supply chain performance using KPI performance indicators. A Snorm De Boer then is utilized to serves and equalize the matrix values derived from company annual data. The final stage in this study is measuring the importance of performance indicators using pairwise comparison weighting. The results obtained in this study are the total supply chain performance of CV. PT is 69.983 included in the average category. There are several performance indicators included in the average and marginal categories, so it needs to be improved. The improvement is given based on the practices in SCOR 12.0. Keywords Supply Chain, Procurement, Batik. 1. Introduction The development of the industrial world which is increasingly fast challenging between companies is also increasingly stringent. In the past few years, excellence in supply optimization and integration has become the focus of several large corporate organizations in the world. The increasingly fierce business competition in this era of globalization requires every effort to rearrange its business strategies and challenges. The essence of competition discusses how companies implement processes in producing products that are better, cheaper and faster than produced (Amit and Zott 2010). The high business competition is one of the reasons companies must fulfil customer orders in the right amount and time. It is intended that the company can control the market share in the community. This condition shows the importance of improving performance, not only within a company but also other parties in the supply chain involved, in order to compete with other companies or supply chains. Performance measurement is very important because it can control the system both directly and indirectly. Performance measurement serves to keep the company on track to achieve supply chain goals. In the context of supply chain management, performance measurement is very important to support the success of a supply chain management. The concept of supply chain management is able to integrate the management of various management functions in a relationship between organizations forming an integrated and mutually supportive system (Mutakin 2011). CV. PT is one of the batik industries that located in Solo, Central Java. In carrying out its business activities, this CV has problems starting from the procurement process to the production process which will affect the quality of batik. In the process of procurement, CV has many problems, which is the incompatibility of the specifications of the material sent, such as the incompatibility of the load of the dye drug, causing the resulting a dull colour. Another
Proceedings of the International Conference on Industrial Engineering and Operations Management Sao Paulo, Brazil, April 5 - 8, 2021
© IEOM Society International 1928

problem is the breaking of the stitches in the cloth so that if the cloth is processed it will cause holes. This has an effect on increasing production process time and decreasing production quality. CV. PT needs to measure supply chain performance to be able to evaluate the entire supply chain so that it can improve supply chain performance and reduce problems in the supply chain. To find out the performance of a company's supply chain, a measurement of supply chain performance is needed, one of which is the Supply Chain Operation Reference (SCOR) method. The SCOR model is a method that can represent the situation in the company. Recently studies using SCOR are implemented in many fields (Wigaringtyas 2013; Immawan and Pratama 2016; Saleh et al. 2016; Immawan et al. 2015; Immawan et al. 2015; Lee et al. 2012; Erkan and BAC 2011; Golparyar and Seifbarghy 2009; Georgise et al. 2012; Hwang et al. 2014; Wayyum et al. 2010; Zhou et al. 2011; Persson et al. 2010; Lestari et al. 2014; Kasi 2005; Hwang et al. 2014; Giannakis 2011; David et al. 2018). SCOR provides supply chain valuation indicators which are presented in performance metrics. These metrics will be weighted using the Analytical Hierarchy Process (AHP) method to determine the level of importance by comparing the scores contained in each of these indicators, which indicators can be evaluated for improvement. The next step is to propose steps that are useful for recommendations for the company in achieving its performance goals and providing direction for the company for the strategic design process. 2. Methods The questionnaire used in this study consisted of 3 questionnaires, namely the KPI validation questionnaire, the score determination questionnaire, and the weighting questionnaire. The KPI validation questionnaire is used to identify supply chain KPIs that the company needs. The questionnaire respondents consisted of 6 people consisting of the main director, to the production sector, the head of the procurement field, the staff of the production field, the staff of the procurement field and the shipping staff. KPI validation is done by finding the average of each indicator, if the average is more than 4, it means that the indicator is validated, if below 4, the indicator does not pass validation and is eliminated. Questionnaire indicators are derived from the Supply Chain Reference Reference (SCOR) 12.0 reference model which combines three elements, namely business process reengineering, benchmarking and process measurement into a cross-functional framework in the supply chain (Pujawan and Mahendrawathi 2010). The SCOR model divides supply chain processes into 5 core processes namely plan, source, make, deliver and return. This model is able to describe and provide a basis for supply chain improvement for global projects as well as site-specific projects
This model also provides performance attributes and supply chain measurement metrics. Performance Attributes are a grouping of metrics used to express strategies (Paul 2014). In the SCOR model, there are five performance attributes that can be measured, namely reliability, responsiveness, agility, costs, and assets management.
Furthermore, the validated KPIs are calculated using the company's annual data and normalized using Snorm De Boer, which is: Larger is Better: Snorm = (𝑆𝑆𝑆𝑆−𝑆𝑆𝑆𝑆𝑆𝑆𝑆𝑆)
(𝑆𝑆𝑆𝑆𝑆𝑆𝑆𝑆−𝑆𝑆𝑆𝑆𝑆𝑆𝑆𝑆) 𝑥𝑥 100 (1)
Lower is Better: Snorm = (𝑆𝑆𝑆𝑆𝑆𝑆𝑆𝑆−𝑆𝑆𝑆𝑆)
(𝑆𝑆𝑆𝑆𝑆𝑆𝑆𝑆−𝑆𝑆𝑆𝑆𝑆𝑆𝑆𝑆) 𝑥𝑥 100 (2)
Si = The actual indicator value that was successfully achieved Smin = The worst performance achievement value of the performance indicators Smax = The value of achieving the best performance of performance indicators
In this measurement, each indicator weight is converted into certain value intervals, namely 0 to 100, zero (0) is the worst and one hundred (100) is best interpreted (Vanany et al. 2005). Table 1 shows the system monitoring performance indicators. The third questionnaire is a paired comparison questionnaire. This questionnaire was used to determine the weight of each KPI indicator. Respondents to this questionnaire are Top Management who are considered experts, then this weight will be processed using the AHP method (Saaty 2008; Kusrini 2007).
Proceedings of the International Conference on Industrial Engineering and Operations Management Sao Paulo, Brazil, April 5 - 8, 2021
© IEOM Society International 1929
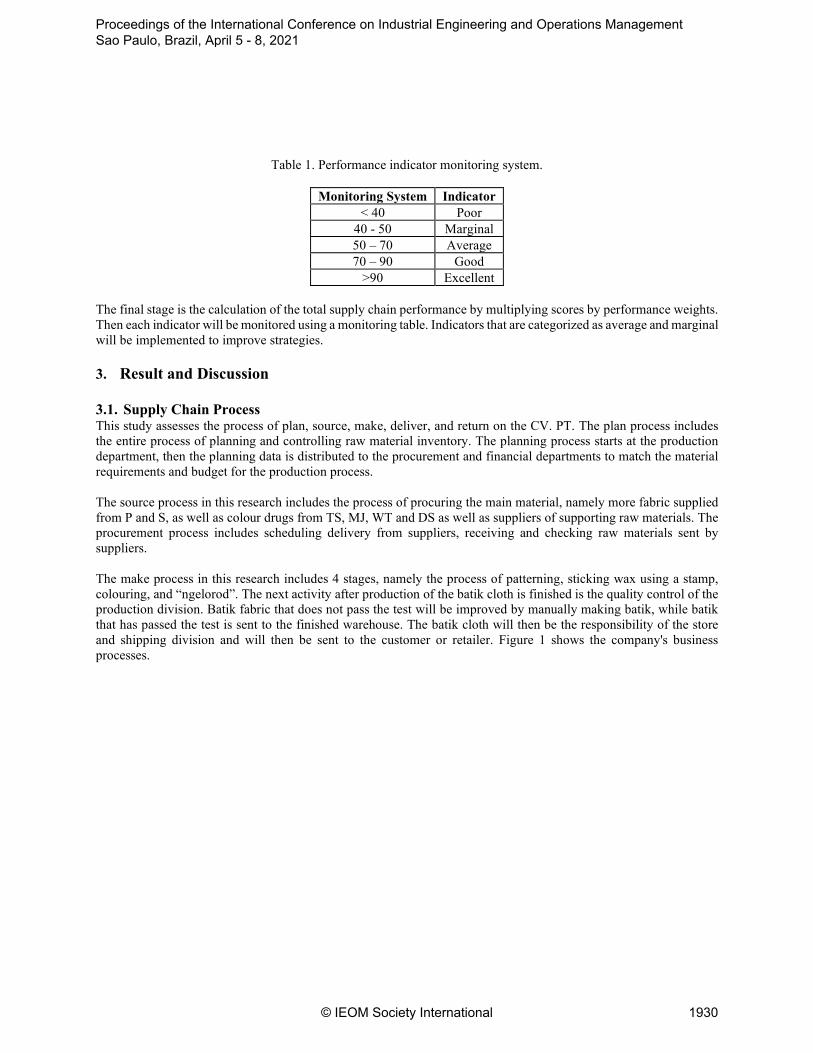
Table 1. Performance indicator monitoring system.
Monitoring System Indicator < 40 Poor
40 - 50 Marginal 50 – 70 Average 70 – 90 Good
>90 Excellent
The final stage is the calculation of the total supply chain performance by multiplying scores by performance weights. Then each indicator will be monitored using a monitoring table. Indicators that are categorized as average and marginal will be implemented to improve strategies. 3. Result and Discussion 3.1. Supply Chain Process This study assesses the process of plan, source, make, deliver, and return on the CV. PT. The plan process includes the entire process of planning and controlling raw material inventory. The planning process starts at the production department, then the planning data is distributed to the procurement and financial departments to match the material requirements and budget for the production process. The source process in this research includes the process of procuring the main material, namely more fabric supplied from P and S, as well as colour drugs from TS, MJ, WT and DS as well as suppliers of supporting raw materials. The procurement process includes scheduling delivery from suppliers, receiving and checking raw materials sent by suppliers. The make process in this research includes 4 stages, namely the process of patterning, sticking wax using a stamp, colouring, and “ngelorod”. The next activity after production of the batik cloth is finished is the quality control of the production division. Batik fabric that does not pass the test will be improved by manually making batik, while batik that has passed the test is sent to the finished warehouse. The batik cloth will then be the responsibility of the store and shipping division and will then be sent to the customer or retailer. Figure 1 shows the company's business processes.
Proceedings of the International Conference on Industrial Engineering and Operations Management Sao Paulo, Brazil, April 5 - 8, 2021
© IEOM Society International 1930

Figure 1. Business process of CV. PT.
3.2. Validated Key Performance Indicator (KPI) Of the 38 KPIs that have been filled by 6 respondents through the KPI validation questionnaire, 25 valid KPIs were obtained and 13 KPIs were not validated and had to be deleted. 3.3. Hierarchy of SCOR Supply chain hierarchy of CV. PT is shown in Figure 2. This hierarchy will affect the weighting of each metric. Weight at each level is part of the weight at the previous level. The validated KPI is then searched for the maximum value, minimum value, and actual value by using a weighting questionnaire. This value is obtained from the annual report of CV. PT. The three values are then normalized using Snorm De Boer to equalize the different unit parameters of each metric and get a score for each metric. The next step is weighting through a pairwise comparison questionnaire. This questionnaire was filled in by the deputy director, head of procurement and head of production. The weighting process is carried out in 3 stages namely process weighting, process attributes and metrics. Each value from the three experts is calculated using the Geometric Mean formula to obtain the weight of each metric, and then the local weight and global weight are calculated. After finding the local weights of each metric, a performance assessment is performed by multiplying each score and the weight of each metric. The results of data processing carried out obtained the total supply chain performance of CV. PT is 69.983 which is included in the average criteria.
Based on the results of data processing, there are several metrics that need improvement. There are 4 metrics that are classified as marginal namely the accuracy of shipping documentation and perfect conditions in the source process as well as the accuracy of shipping documentation, perfect conditions and procurement cycle time. in the delivery process. There are 7 metrics that are classified as average, namely raw material delivery cycle time in the source process, production cycle time, productivity, delivery performance on the specified date, finish goods delivery cycle time and current warehouse PO cycle time. Each of the metrics that are still of marginal and average value is then analysed to find the causes of the problem and provide some suggestions for improvement. In previous studies using SCOR version 10.0 by Wahyuniardi et al. (2017) there were significant differences with SCOR version 12.0. SCOR version 10.0 has no sub-attributes while SCOR version 12.0 has been updated with sub-attributes. This causes difficulties for recommendation formulation based on the results of research using SCOR 10.0 because it is limited and does not relate to the metrics in the performance attributes. Besides, there is no information which metrics can be used to see improvements.
Proceedings of the International Conference on Industrial Engineering and Operations Management Sao Paulo, Brazil, April 5 - 8, 2021
© IEOM Society International 1931

Figure 2. Supply chain hierarchy of CV. PT.
3.4. Monitoring of Performance Indicator The results of performance monitoring of CV. PT are shown in Appendix A (Table A1). 3.5. AHP The AHP method in this study is used to determine the importance weight of each variable and the relevant attributes in evaluating the supply chain performance of CV. PT. The data collected is the result of a paired comparison questionnaire consisting of 3 stages, namely comparison between criteria, comparison of criteria with attributes, and comparison of metrics by metrics.
Based on the data collection and processing stages carried out, there are 5 core process criteria, namely plan, source, make, deliver, and return. These criteria are then compared in pairs using a questionnaire filled out by Top Management. The results of the questionnaire were then calculated for the geometric mean to average the results of the questionnaires from the three experts. The weight calculation results obtained by global criteria weights are plan criteria have a weight of 0.201, source criteria have a weight of 0.247, make criteria have a weight of 0.247, the delivery criteria have a weight of 0.059 and the return criteria have a weight of 0.046. The total weight of the five criteria is 1. Priority level of supply chain criteria of CV. PT is shown in Figure 3.
Proceedings of the International Conference on Industrial Engineering and Operations Management Sao Paulo, Brazil, April 5 - 8, 2021
© IEOM Society International 1932

Figure 3. Priority level criteria.
In the Figure 3, it can be seen clearly the priority weighting of the successive supply chain core process criteria, namely deliver, source, make, plan, and return with the priority of each attribute. Based on priority criteria, the delivery criteria have the highest level of importance and the return criteria have the lowest level of importance in the supply chain process of CV. PT.
3.6. Proposed Improvement of Performance Indicators Based on the results of research that has been conducted, it is obtained 11 performance indicators that require improvement. These performance indicators are shown in Table 2.
Problematic indicators are in the process of source, make, deliver, and return as well as the attributes of reliability, responsiveness, and agility. The biggest problems are with the accuracy of the documentation metrics and cycle times. This causes the low value of the company's performance so it needs to be improved to the metrics that are in the marginal and average categories. In Appendix B (Table B1), a number of recommended strategies for problems are given so that it is expected to improve company performance better. The main raw materials for making batik are fabric, wax, dye, so the main supplier of the batik industry is the provider of these materials. Purwaningsih et al. (2016) has mapped the relationship between the batik industry and suppliers, waste management, and buyers, both individuals and organizations. In addition to discussing supply chain performance, evaluating suppliers is also important to get suppliers that are reliable, responsive and provide good prices and products. SCOR version 11 published by APICS, Likumahwa et al. (2019) explains about metrics, processes, how to practice SCOR and organizational arrangement or people, in the last chapter SCOR accommodates environmental issues by discussing green SCOR. Conceptually, several model tests have proven that Green Supply Chain management has an influence on the Company Performance and Competitiveness (Likumahwa et al. 2019). Further research can be developed to see SCM batik with the Green Supply chain approach considering that batik also has environmental impacts that need to be considered in maintaining the sustainability of the batik industry.
Table 2. Performance indicators that need improvement.
Proceedings of the International Conference on Industrial Engineering and Operations Management Sao Paulo, Brazil, April 5 - 8, 2021
© IEOM Society International 1933
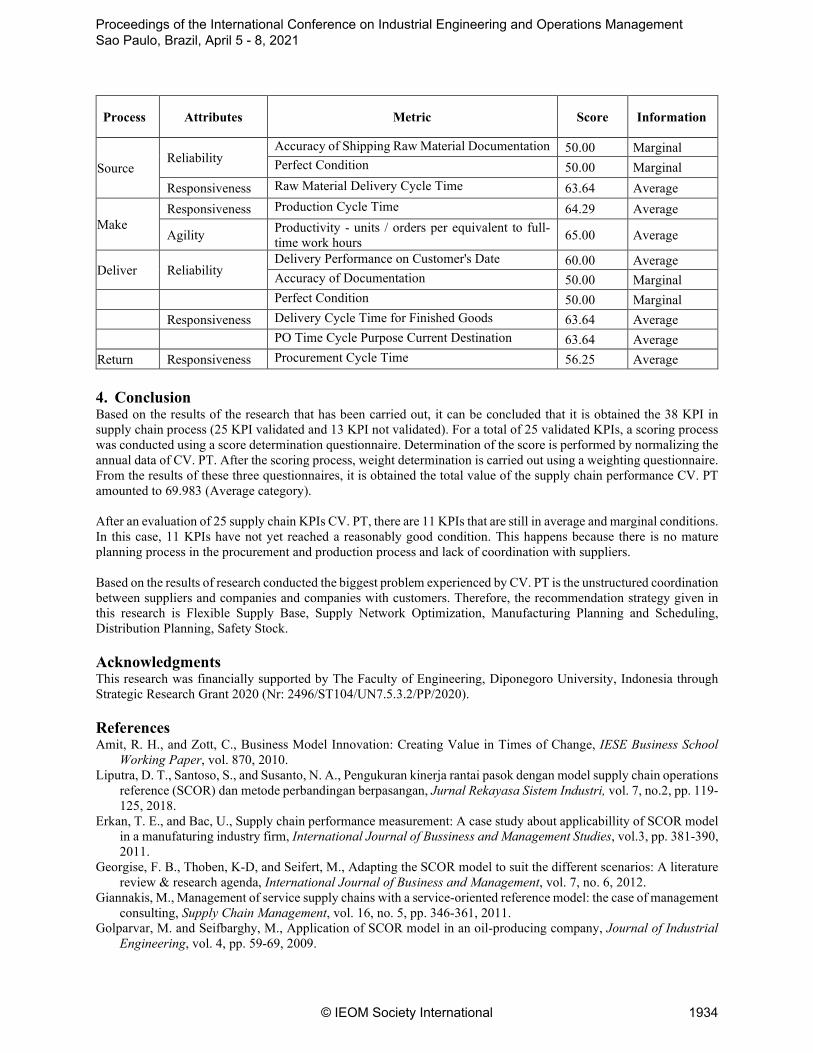
Process Attributes Metric Score Information
Source Reliability
Accuracy of Shipping Raw Material Documentation 50.00 Marginal Perfect Condition 50.00 Marginal
Responsiveness Raw Material Delivery Cycle Time 63.64 Average
Make Responsiveness Production Cycle Time 64.29 Average
Agility Productivity - units / orders per equivalent to full-time work hours 65.00 Average
Deliver Reliability Delivery Performance on Customer's Date 60.00 Average Accuracy of Documentation 50.00 Marginal
Perfect Condition 50.00 Marginal Responsiveness Delivery Cycle Time for Finished Goods 63.64 Average PO Time Cycle Purpose Current Destination 63.64 Average Return Responsiveness Procurement Cycle Time 56.25 Average 4. Conclusion Based on the results of the research that has been carried out, it can be concluded that it is obtained the 38 KPI in supply chain process (25 KPI validated and 13 KPI not validated). For a total of 25 validated KPIs, a scoring process was conducted using a score determination questionnaire. Determination of the score is performed by normalizing the annual data of CV. PT. After the scoring process, weight determination is carried out using a weighting questionnaire. From the results of these three questionnaires, it is obtained the total value of the supply chain performance CV. PT amounted to 69.983 (Average category). After an evaluation of 25 supply chain KPIs CV. PT, there are 11 KPIs that are still in average and marginal conditions. In this case, 11 KPIs have not yet reached a reasonably good condition. This happens because there is no mature planning process in the procurement and production process and lack of coordination with suppliers. Based on the results of research conducted the biggest problem experienced by CV. PT is the unstructured coordination between suppliers and companies and companies with customers. Therefore, the recommendation strategy given in this research is Flexible Supply Base, Supply Network Optimization, Manufacturing Planning and Scheduling, Distribution Planning, Safety Stock.
Acknowledgments This research was financially supported by The Faculty of Engineering, Diponegoro University, Indonesia through Strategic Research Grant 2020 (Nr: 2496/ST104/UN7.5.3.2/PP/2020).
References Amit, R. H., and Zott, C., Business Model Innovation: Creating Value in Times of Change, IESE Business School
Working Paper, vol. 870, 2010. Liputra, D. T., Santoso, S., and Susanto, N. A., Pengukuran kinerja rantai pasok dengan model supply chain operations
reference (SCOR) dan metode perbandingan berpasangan, Jurnal Rekayasa Sistem Industri, vol. 7, no.2, pp. 119-125, 2018.
Erkan, T. E., and Bac, U., Supply chain performance measurement: A case study about applicabillity of SCOR model in a manufaturing industry firm, International Journal of Bussiness and Management Studies, vol.3, pp. 381-390, 2011.
Georgise, F. B., Thoben, K-D, and Seifert, M., Adapting the SCOR model to suit the different scenarios: A literature review & research agenda, International Journal of Business and Management, vol. 7, no. 6, 2012.
Giannakis, M., Management of service supply chains with a service‐oriented reference model: the case of management consulting, Supply Chain Management, vol. 16, no. 5, pp. 346-361, 2011.
Golparvar, M. and Seifbarghy, M., Application of SCOR model in an oil-producing company, Journal of Industrial Engineering, vol. 4, pp. 59-69, 2009.
Proceedings of the International Conference on Industrial Engineering and Operations Management Sao Paulo, Brazil, April 5 - 8, 2021
© IEOM Society International 1934

Huang, T., Chen, Z., Wang, S., and Jiang, D., Efficiency evaluation of key ports along the 21st-century maritime silk road based on the DEA–SCOR model, Maritime Policy & Management, vol. 48, no. 3, pp. 378-390, 2020.
Hwang, G., Han, S., Jun, S., and Park, J., Operational performance metrics in manufacturing process: Based on SCOR model and RFID tecnology, International Journal of Innovation, Management and Technology, vol. 5, no. 1, pp. 50-55, 2014.
Immawan, T., and Pratama, C. Y., Pengukuran performansi rantai pasok pada industri batik tipe produksi make to stock dengan menggunakan model SCOR 11.0 dan pembobotan AHP (Studi kasus batik Gunawan Setiawan, Surakarta), Teknoin, vol. 22, no. 1, pp. 68-79, 2016.
Immawan, T., Marimin, Arkeman, Y., and Maulana, A., Sustainable supply chain management for make to stock-make to order production typology case study: Batik industry in Solo Indonesia, European Journal of Business and Management, vol. 7, no. 11, pp. 94-106, 2015.
Kasi, V., Systemic assessment of SCOR for modeling supply chains, 38th Hawaii International Conference on System Sciences (HICSS-38 2005), 3-6 January 2005, Big Island, HI, USA, 2005.
, 2005. Kusrini, Konsep dan Aplikasi Sistem Pendukung Keputusan, 1st ed., Andi Offset, Yogyakarta, 2007. Lee, Tzong-Ru(Jiun-Shen), Yi-Siang, S., and Sivakumar, P., The applications of SCOR in manufacturing: Two cases
in Taiwan, Procedia Engineering, vol. 38, pp. 2548-2563, 2012. Lestari, F., Ismail, K., Hamid, A.A, Supriyanto, E., Yanti, N., and Sutupo, W., Supply chain configuration using
hybrid SCOR model and discrete event simulation, Proceedings of the World Congress on Engineering, London, vol. 2, pp. 967-972, 2014.
Likumahwa, F. M., Purwaningsih, R., and Handayani, N. U., The Influence of green supply chain management on company’s performance and competitiveness in wood furniture industry: An overview of conceptual model, IOP Conference Series: Materials Science and Engineering, vol. 598, pp. 012076, 2019.
Mutakin, A., and Hubeis, M., Pengukuran Kinerja Manajemen Rantai Pasokan dengan SCOR Model 9.0 (Studi Kasus di PT Indocement Tunggal Prakarsa Tbk), Jurnal of Management and Organization., vol. 2, no.3, pp. 89-103, 2011.
Paul, J., Penerapan Transformasi Rantai Suplai Dengan Model SCOR 15 Tahun Aplikasi Praktis Lintas Industri, PPM Manajemen, Jakarta, Indonesia, 2014.
Persson, F., Bengtsson, J., and Gustad, Ö.,Construction logistics improvements using the SCOR model – tornet case, In: Vallespir B., Alix T. (eds) Advances in Production Management Systems. New Challenges, New Approaches, IFIP Advances in Information and Communication Technology, vol 338, Springer, Berlin, Heidelberg, 2010.
Pujawan, I. and Mahendrawathi, Supply Chain Management, Guna Widya, Surabaya, 2010. Purwaningsih, R., Susanto, N., and Yudha, M. C., Penilaian keberlanjutan UKM batik Kota Semarang dengan metode
Product Service System (PSS), Jurnal Teknik Industri, vol. 18, no, 1, pp. 31-42, 2016. Saaty, T. L., Decision making with the analytic hierarchy process, International Journal of Services Sciences, vol. 1,
no. 1, pp. 83-98, 2008. Saleh, C., Mubiena, G. F., Immawan, T., and Hassan, A., Lean production in improving supply chain performance
through hybrid model SCOR 11.0 - system dynamics, IOP Conference Series: Materials Science and Engineering, vol. 114, pp. 012069, 2016.
Vanany, I., Suwignjo, P., and Yulianto, D., Design of supply chain performance measurement for lamp industry, 1st International Conference on Operations and Supply Chain Management, pp. 78-86, 2005.
Wahyuniardi, R., Syarwani, M., and Anggani, R., Pengukuran kinerja supply chain dengan pendekatan supply chain operation references (SCOR), Jurnal Ilmiah Teknik Industri, vol. 16, no. 2, pp. 123-132, 2017.
Wayyum, R., Ahmad, S., and Usman, M., Effects of SCOR on management of SC, International Journal of Management and Organizational Studies, vol. 2, no. 1, pp. 85-91, 2010.
Wigaringtyas, L. D., Pengukuran Kinerja Supply Chain Management Dengan Pendekatan Supply Chain Operation Reference (SCOR) (Studi Kasus: UKM Batik Sekar Arum, Pajang, Surakarta), Thesis (unpublished), Universitas Muhammadiyah Surakarta, Surakarta, 2013.
Zhou, H., Benton, W.C., Schilling, D.A., and Milligan, G.W., Supply chain integration and the SCOR model, Journal of Business Logistics, vol. 32, no. 4, pp. 332-344, 2011.
Proceedings of the International Conference on Industrial Engineering and Operations Management Sao Paulo, Brazil, April 5 - 8, 2021
© IEOM Society International 1935

Appendix A
Table A1. Performance monitoring.
No Process Attributes Metric
KPI Unit Score Information Level 1 Level 2
Plan Cost Total Supply Chain Management Cost
Core Process Planning Costs 2 IDR 77.78 Lower is Better
Source
Reliability Perfect Order Fulfilment (POF)
Fulfilment of Raw Materials 3 % 80.00 Large is Better
Delivery Performance on a Specified Date 4 % 80.00 Large is Better
Accuracy of Shipping Raw Material Documentation 5 % 50.00 Large is Better
Perfect Condition 6 % 50.00 Large is Better
Responsiveness Order Fulfilment Cycle Time (OFCT)
Raw Material Delivery Cycle Time 7 Day 63.64 Lower is Better
Agility Upside Supply Chain Adaptability
Current Procurement Volume 8 Yard 71.43 Large is Better
Cost Total Supply Chain Management Cost Procurement Costs 11 IDR 76.85 Lower is Better
Asset Cash – to – Cash Cycle Time
Number of Days to Supply Raw Materials 12 Day 71.43 Lower is Better
Make Responsiveness Order Fulfilment
Cycle Time (OFCT) Production Cycle Time 14 Day 64.29 Lower is Better
Agility Upside Supply Chain Adaptability Production Volume 15 Yard 75.00 Large is Better
Proceedings of the International Conference on Industrial Engineering and Operations Management Sao Paulo, Brazil, April 5 - 8, 2021
© IEOM Society International 1936

Table A1. Performance monitoring. (Cont.)
No Process Attributes Metric
KPI Unit Score Information Level 1 Level 2
Productivity - units / orders per equivalent to full-time work hours
16 % 65.00 Large is Better
Cost
Total Supply Chain Management Cost
Production cost 20 IDR 78.84 Lower is Better
Cost of Goods Sold Direct Labour Costs 21 IDR 76.92 Lower is Better Material Costs 22 IDR 76.78 Lower is Better
Asset Return on Working Capital
Cost of goods sold 24 IDR 71.43 Loer is Better
Deliver Reliability Perfect Order
Fulfilment (POF)
% Orders Sent 25 % 80.00 Large is Better Delivery Performance on Customer's Date 26 % 60.00 Large is Better
Accuracy of Finished Good Shipping Documentation 27 % 50.00 Large is Better
Perfect Condition 28 % 50.00 Large is Better
Responsiveness Order Fulfilment Cycle Time (OFCT)
Delivery Cycle Time for Finished Goods 29 Day 63.64 Lower is Better
Agility Upside Supply Chain
Adaptability
Current Volume of Finished Goods Delivery 30 Yard 75.00 Large is Better
PO Time Cycle Purpose Current Destination 31 Day 63.64 Lower is Better
Cost Total Supply Chain Management Cost
Shipping costs 33 IDR 70.59 Lower is Better
Return Responsiveness Order Fulfilment Cycle Time (OFCT)
Return Procurement Cycle Time 36 Day 56.25 Lower is Better
Proceedings of the International Conference on Industrial Engineering and Operations Management Sao Paulo, Brazil, April 5 - 8, 2021
© IEOM Society International 1937
Appendix B
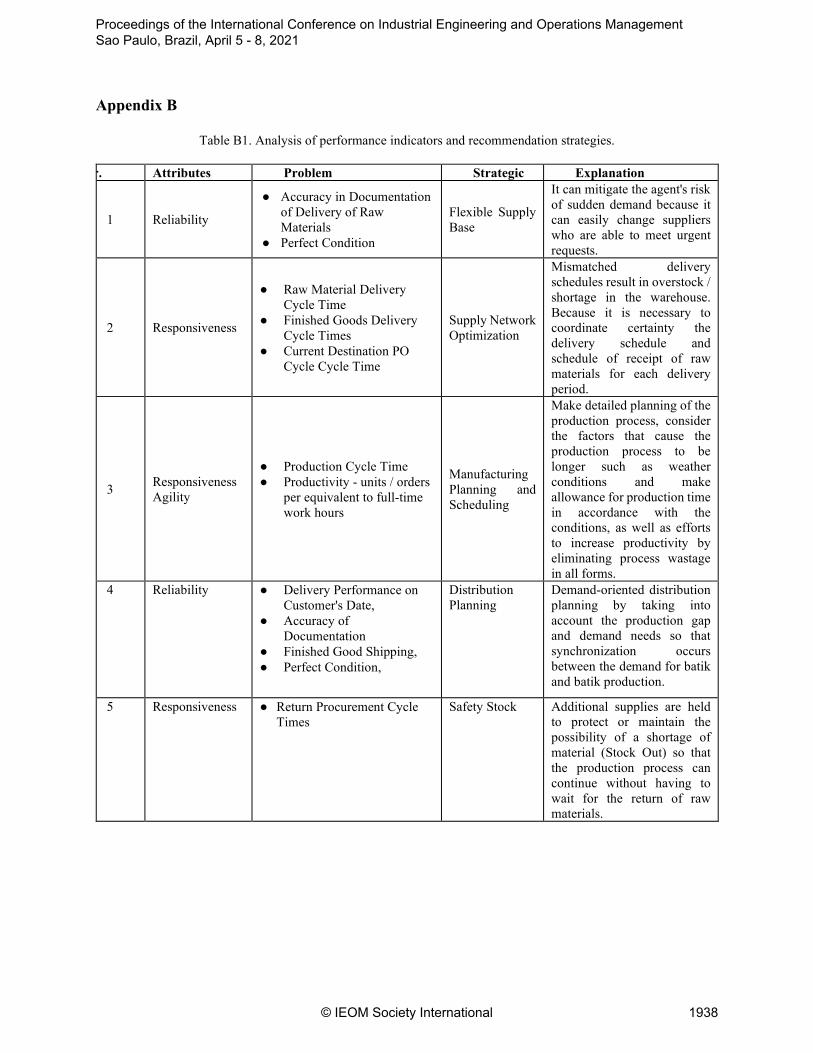
Table B1. Analysis of performance indicators and recommendation strategies.
r. Attributes Problem Strategic Explanation
1 Reliability
● Accuracy in Documentation of Delivery of Raw Materials
● Perfect Condition
Flexible Supply Base
It can mitigate the agent's risk of sudden demand because it can easily change suppliers who are able to meet urgent requests.
2 Responsiveness
● Raw Material Delivery Cycle Time
● Finished Goods Delivery Cycle Times
● Current Destination PO Cycle Cycle Time
Supply Network Optimization
Mismatched delivery schedules result in overstock / shortage in the warehouse. Because it is necessary to coordinate certainty the delivery schedule and schedule of receipt of raw materials for each delivery period.
3 Responsiveness Agility
● Production Cycle Time ● Productivity - units / orders
per equivalent to full-time work hours
Manufacturing Planning and Scheduling
Make detailed planning of the production process, consider the factors that cause the production process to be longer such as weather conditions and make allowance for production time in accordance with the conditions, as well as efforts to increase productivity by eliminating process wastage in all forms.
4 Reliability ● Delivery Performance on Customer's Date,
● Accuracy of Documentation
● Finished Good Shipping, ● Perfect Condition,
Distribution Planning
Demand-oriented distribution planning by taking into account the production gap and demand needs so that synchronization occurs between the demand for batik and batik production.
5 Responsiveness ● Return Procurement Cycle Times
Safety Stock Additional supplies are held to protect or maintain the possibility of a shortage of material (Stock Out) so that the production process can continue without having to wait for the return of raw materials.
Proceedings of the International Conference on Industrial Engineering and Operations Management Sao Paulo, Brazil, April 5 - 8, 2021
© IEOM Society International 1938