Supply chain performance measurement and improvement ... · Supply chain performance measurement...
41
1 Supply chain performance measurement and improvement system: A MCDA-DMAIC methodology Tahaur REHMAN Industrial and Manufacturing Engineering Department NED University of Engineering and Technology Karachi- Pakistan Email: [email protected] Sharfuddin Ahmed KHAN Industrial Engineering and Engineering Management Department University of Sharjah Sharjah-UAE Email: [email protected] Simonov KUSI-SARPONG (Corresponding Author) Eco-Engineering and Management Consult Limited No. 409 Abafum Avenue Ti’s - Adentan, Accra-Ghana Email: [email protected] Syed Mehmood HASSAN Director ORIC and Assistant Professor Industrial and Manufacturing Engineering Department NED University of Engineering and Technology Karachi- Pakistan Email: [email protected]
Transcript of Supply chain performance measurement and improvement ... · Supply chain performance measurement...
1
Supply chain performance measurement and improvement system: A
MCDA-DMAIC methodology
Tahaur REHMAN
Industrial and Manufacturing Engineering Department
NED University of Engineering and Technology
Karachi- Pakistan
Email: [email protected]
Sharfuddin Ahmed KHAN
Industrial Engineering and Engineering Management Department
University of Sharjah
Sharjah-UAE
Email: [email protected]
Simonov KUSI-SARPONG (Corresponding Author)
Eco-Engineering and Management Consult Limited
No. 409 Abafum Avenue
Ti’s - Adentan, Accra-Ghana
Email: [email protected]
Syed Mehmood HASSAN
Director ORIC and Assistant Professor
Industrial and Manufacturing Engineering Department
NED University of Engineering and Technology
Karachi- Pakistan
Email: [email protected]

2
Supply chain performance measurement and improvement system: A
MCDA-DMAIC methodology
Abstract:
Purpose: The purpose of this paper is to adopt a supply chain performance measurement
(SCPM) framework as proposed by Dweiri and Khan (2012) to model a novel supply chain
performance measurement indexing (SCPMI) system to measure and improve supply chain
performance.
Design/methodology/approach: The adopted SCPM framework developed by Dweiri and
Khan (2012) is used to model a generic SCPMI framework aided by Analytic Hierarchy
Process (AHP) method and inputs from industrial experts. To exemplify the applicability and
efficiency of the generic SCPMI system, an automobile assembling company from an emerging
economy was utilized. This SCMPI system is used to measure, improve and measure post-
improvement supply chain performance (SCP) guided by DMAIC (Define, Measure, Analyze,
Improve and Control) methodology.
Findings: The study’s initial measurement results showed an average SCP of the case company
over a four month period as 82%. DMAIC methodology was utilized to identify inherent
problems and proposed improvements. The post-improvement SCP measurement saw an
improvement from an average of 82% to 83.82% over a four month period.
Practical Implications: The proposed generic SCPMI framework aided by AHP-DMAIC has
been successfully implemented in a case company. After implementation, managers and
decision makers saw an improvement in their SCP. The proposed SCPMI system and results
can be useful for benchmarking by manufacturing organizations for continuous SCP
improvement.
Originality: An original SCPMI framework proposed is general in nature and can be applied
in any organization.
Keywords: Supply chain management; Performance measurement; Analytical Hierarchal
Process; AHP; DMAIC

3
1.0 Introduction
Typically, supply chain procures raw materials from suppliers and value added to them at
production facilities transported to warehouses for transitional storage, and thereafter shipped
to retailers or customers (Simchi-Levi, Kaminsky and Simchi-Levi, 2008; Chopra and Meindl,
2016). Therefore, for cost reduction and improved customer service, effective supply chain
strategies must take into consideration the various supply chain elements. Supply Chain (SC)
is a system that encompasses many intra- and inter-organizational activates ranging from
purchasing to logistics/distribution and manufacturing to warehousing etc. The performance of
these activities can be determined once all elements are well-defined. For example, freight cost
per unit and delayed shipment rate of raw materials.
Supply Chain Management (SCM) can be defined as the use of set of tools and techniques for
controlling and managing SC activities for effective SC coordination with the aim of improving
over supply chain performance (SCP) (Bai, Kusi-Sarpong, and Sarkis 2017; Kusi-Sarpong,
Sarkis, and Wang 2016a; Croxton et al.,. 2001) SCM takes into consideration all aspect of the
chain that have cost implications and plays a significant role in ensuring the conformance of
customer orders, thus from supplier to retailers and stores (Simchi-Levi, Kaminsky and
Simchi-Levi, 2008; Chopra and Meindl, 2016). Since the objective of SCM is to ensure
efficient and cost-effective supply chains, there’s the need for the focal firms to extend their
SCM focus as much as they can beyond only the first tier suppliers and customers (Kusi-
Sarpong, Sarkis, and Wang 2016b; Handfield, Robert et al.,. 1999; Simchi-Levi, Kaminsky,
and Simchi-Levi 2008). As stated earlier, measurement is important as it directly affects the
behavior that impacts SCP (Gunasekaran, Patel and Tirtiroglu, 2001). Therefore it is essential
for organizations to know their overall SC performance (Khan, 2013).Thus, supply chain
performance measurement (SCPM) provides a means to help firms assess whether or not their
supply chains is doing well (Saad and Patel, 2006; Agami, Saleh and Rasmy, 2012).
Firms are willing to evaluate the performance of the systems they implement within their
organizations such as lean thinking and total quality management systems etc. but develop
performance measurement and management systems that are internally focused. However, the
performance of these systems depends on actions and decisions taken by other players within
their supply chains. That is, for businesses to compete successfully in the current competitive
globalized business environment, there’s the need to integrate their operations with that of their
suppliers and customers to minimize unnecessary costs and inefficiencies, and ensuring the

4
best value for the final consumer (Naude and Badenhorst-weiss, 2011; Madhani, 2013). This
means that, the disintegrated and internally focused measurement and management approach
by organizations to evaluate their performances cannot aid in addressing their supply chain-
based problems holistically. Therefore, much more attention and consideration should be given
to all aspects of the chain when managing the supply chain for achieving best decisions. Also,
these systems performance evaluation are usually completed based on subjective opinions that
are mostly biased. This evaluation processes mostly lack the appropriate frameworks or factors
to aid in developing these frameworks. Therefore, there is the need to have a framework that is
capable of measuring and managing performances locally but have a global supply chain focus.
This study therefore adopt a SCPM framework that is usable locally but have a global supply
chain focus and integrates a scientific approach in the SCP evaluation process. This SCPM
framework is used to model a novel Supply Chain Performance Measurement Index (SCPMI)
with the aid of Analytic Hierarchy Process (AHP), and Define, Measure, Analyze, Improve
and Control (DMAIC), to measure, improve and measure post-improvement SCP.
The general objective of this paper is to adopt a SCPM framework as proposed by Dweiri and
Khan (2012) for the manufacturing sector, and introduces an integrated AHP and DMAIC
methodology to aid in modeling a novel SCPMI. The SCPMI system is applied to an
automotive manufacturing company to measure, improve and measure post-improvement SCP.
The specific objectives of this study are as below:
a) To adopt a SCPM framework to model a novel SCPMI system/framework using an
automotive company’s managers aided by AHP.
b) To measure and analyze overall SCP of an automotive company using the novel SCPMI
system/framework.
c) To improve the overall SCP of the automotive company by implementing DMAIC
approach.
d) To measure overall post-improvement SCP of the automotive company.
The contributions of this paper are manifold. First, the issue of supply chain performance
measurement and improvement in an integrated fashion has only seen limited discussion in the
literature. This paper contributes to this discussion. Second, a focused investigation of supply
chain performance measurement and improvement in the Pakistan automobile manufacturing
5
industry context is non-existent; this work is the first to investigate this issue. Third, the focus
of Pakistan represents an emerging economy nation focus on supply chain performance
measurement and improvement, an area that has not seen significant supply chain research in
general or specifically to the automobile manufacturing industry. Fourth, for the first time, this
paper proposes a hybrid methodological framework based on AHP and DMAIC methodology
for aiding supply chain performance measurement and improvement in the automobile
manufacturing, contributing to decision making application.
The reminder of the paper is organized as follows. Section 2 provides brief overview of the
literature on SCP, SCPMI and, research gaps and highlights. The methodological backgrounds
of AHP and DMAIC cycle are discussed in Section 3. Section 4 presents the proposed
methodological steps and its implementation in a case company in Section 5. The results are
discussed and conclusion is elaborated in Section 6.
2.0 Literature Review
2.1 Supply Chain Performance (SCP) Models
There are many SCPM systems that have been developed over the last two decades. Different
authors classified SC performance measurement in different perspective such as balance
scorecard, SC link etc (Gunasekaran and Kobu, 2007). Financial Performance Measurement
Systems (FPMS) that are basically centered on financial indicators, have received heavy
criticisms for it incompleteness and neglect of some more imperative and strategic non-
financial measures (Neely, Adams and Crowe, 2001; Kennerley and Neely, 2003; Agami,
Saleh and Rasmy, 2012). Economic Value Added (EVA) is a method for assessing a firm’s
capital return or economic value added (Bahri, St-Pierre and Sakka, 2011). Supply Chain
Balanced Scorecard (SCBS) consists of four key areas that firms ought to measure including
the following: Financial; Customer; Internal Business Processes; and Innovation and Learning
perspectives (Kaplan and Norton, 1992). Supply Chain Operations Reference (SCOR) Model
argues that a SC consists of five key main interrelated processes: Plan, Source, Make, Deliver
and Return. The process performance is measured from five areas, namely: cost, reliability,
flexibility, responsiveness, and asset (Sharahi, and Abedian 2009; Leończuk 2016).
Dimension-based Measurement System (DBMS) defines three categories of measures as the
main elements of SCP measurement systems, namely: resources (R), output (O) and flexibility
(F) (Rezaei, Çelik and Baalousha, 2011; Agami, Saleh and Rasmy, 2012).

6
Interface-based Measurement System (IBMS) is a framework for guiding the performance
measurement and linking each stage within the supply chain (Lambert and Pohlen, 2001).
Perspective-based Measurement System (PBMS) identify six main perspectives of SCP
including: Logistics, Strategy, Marketing, Operations Research, Organization and System
Dynamics. Hierarchical-based Measurement Systems (HBMS) measures are classified as
strategic, tactical or operational. Function-based Measurement System (FBMS) is a
performance measurement system that combines the measures of the various SC functional
processes across the chain. Efficiency-based Measurement System (EBMS) is a system that
measures the SCP in terms of efficiency. However, most EBMS are DEA-based.
2.2 Supply Chain Performance Measurement Index (SCMPI)
SCPM is essential for organizational success. However, the measurement process sometimes
lacks the key ingredients to cover the focus areas. What cannot be measured cannot be
improved and so much more attention should be placed on the measurement framework to aid
in the improvement and management. Nowadays competition has shifted from between
organizations to between supply chains and is on the basis of SCP. Digitalization and ever
rising customers demand have forced many organizations to come up with different ways of
doing business and delivering products or services more rapidly to their customers. Over the
years, many authors have developed different SCPM systems such as Balance Scorecard
(BSC), Supply chain operations reference (SCOR) model etc. emphasizing that SCPM is a key
concern to practitioners and researcher. To measure the overall SCP, there is the need for a
proper model that can help in the evaluation. This SCPM framework should be capable of
capturing and utilizing the knowledge and experience of experts in making decisions as well
as includes essential criteria. There is also an important need for a unit-free indexing framework
for benchmarking purpose.
2.3 Research Gaps and Highlights
A recent attempt was made by (Dweiri and Khan 2012) to develop a SCPMI. The proposed
SCPMI was implemented in a lube oil blending company. Unfortunately, the criteria
importance of the proposed SCPMI was determined based on expert’s direct ratings without
any scientific tool to analysis the ratings, which can be biased. Due to the lack of scientific
tools and techniques, the biasness among the experts and decision makers were not addressed.
Therefore, this study adopts the SCMP framework as developed by ( Dweiri and Khan 2012)
and apply an integrated AHP and DMAIC methods capable of dealing with the biasness among
7
the expert group to model a novel SCMPI system/framework to measure, improve and measure
post-improvement overall SCP of an automobile manufacturing company. Although some
studies have used the joint AHP-DMAIC methodology, none have applied it to companies in
the automobile manufacturing industry from emerging economy nation context in general and
specifically to companies in Pakistan. For example, Fırat et al. (2017) proposed the use of the
AHP-DMAIC methodology in the service industry of Turkey while (Thakkar, Deshmukh and
Kanda, 2006) in the service (education) sector of India, utilized the AHP-DMAIC methodology
for aiding the decision and improvement. Rimantho et al. (2017) in their study applied AHP-
DMAIC methodology to analyze the variable lead time calibration process instrumentation in
the pharmaceutical industry of Indonesia, Chakrabortty and Biswas, (2013) in their paper,
applied the AHP-DMAIC approach to reduce process variability of a food processing industry
in Bangladesh, among others. The fact that the AHP-DMAIC methodology has seen many
applications and heavy presence in the literature shows and reinforces it robustness and
successful outcomes. Thus, the application of the AHP-DMAIC methodology to the
automobile manufacturing industry from an emerging economy nation, Pakistan, is novel and
warranted.
3.0 Methodological Background
3.1 AHP Methodology
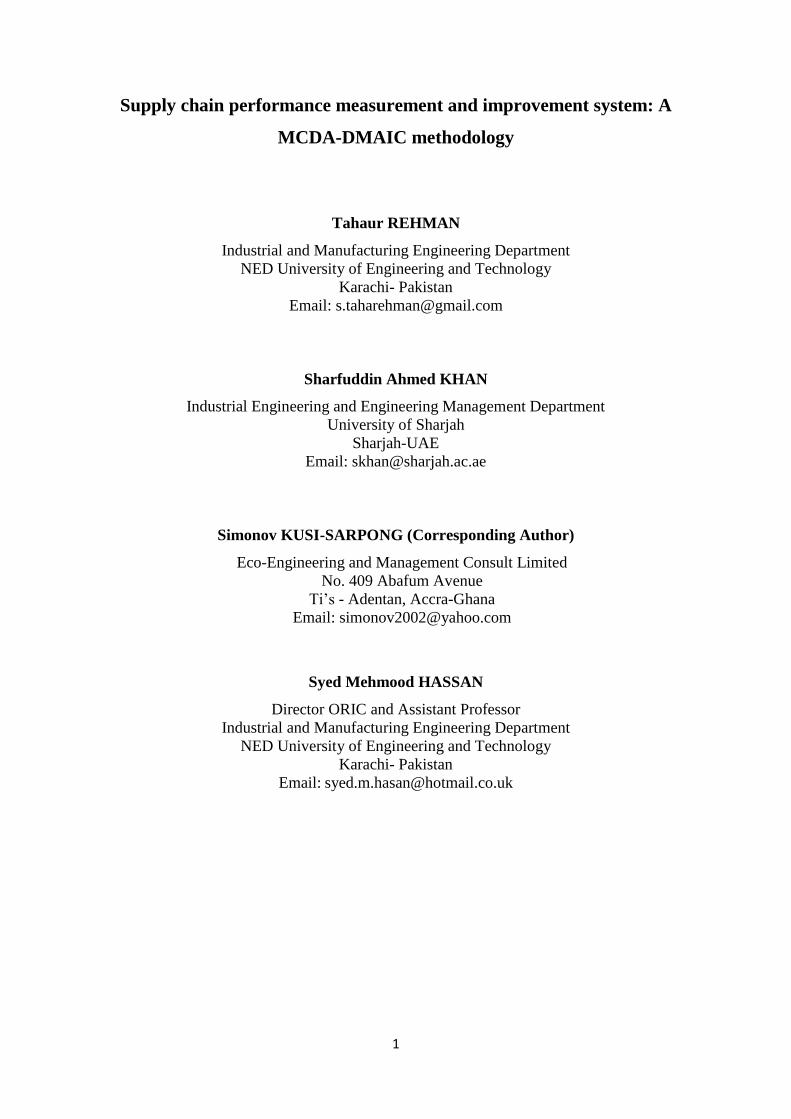
AHP is a well-known and widely used mulit-criteria decision making (MCDM) technique that
utilizes mutli-echon hierarchical categoriztion of criteria to deal with complex decision
problems. For numerical examples and step by step approach on how AHP works, readers can
refer to (Dweiri et al.,., 2016; Khan, Dweiri, and Jain, 2016; Saaty, 2008). Steps of AHP are
illustrated in figure 3.1 below:
[Insert Figure 3.1 about here]
AHP has been widely applied in areas such as project evaluation and selection (Dey 2004,
2006), performance assessment (Jagdev, Brennan, and Browne 2004), automotive parts
supplier selection (Dweiri et al.,. 2016; Khan, Dweiri, and Jain 2016b), production planning
forecasting methods selection (Dweiri, Khan, and Jain 2015), reverse logistics supplier
selection (Jain and Khan, 2017), operational performance measurement (Dey, Hariharan, and
Clegg 2006), and warehouse performance evaluation (Khan, Dweiri and Chaabane, 2016).

8
3.2 DMAIC Methodology
DMAIC cycle is a continuous improvement technique which is used to identify and improve
specific areas of a process (Qureshi et al.,., 2014). For a discussion of the DMAIC cycle readers
can refer ( Gijo, Scaria, and Antony 2011; Gejdoš 2015; Jirasukprasert et al.,. 2014; Pyzdek
and Keller 2010).
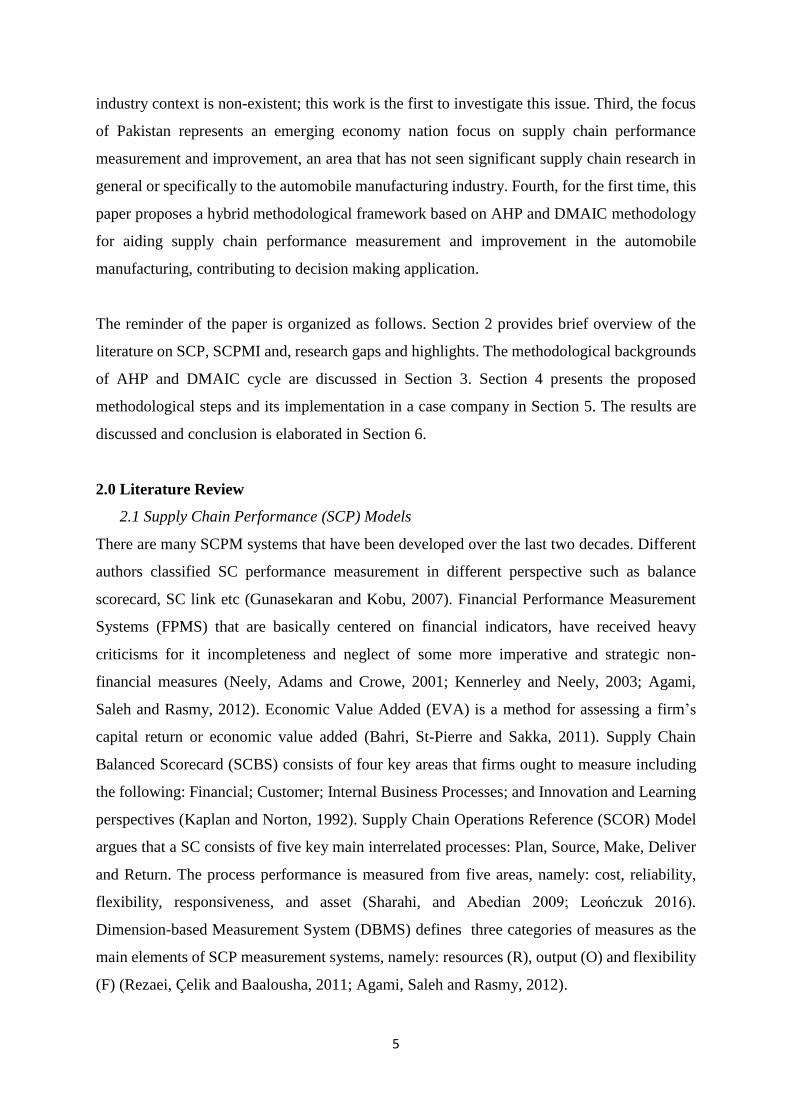
DMAIC process consists of five phases and brief introduction of these steps are mentioned
below.
The first phase is a “Define” phase where the team’s role; project scope and boundary;
customer requirements and expectations; and the goals of selected projects are defined.
The second phase is a “Measure” phase where measurement factors are selected to be
improved, providing a structure to evaluate current performance, and assessing,
comparing and monitoring subsequent improvements and their capability.
The third phase is an “Analyze” phase where the root cause of problems (defects) are
determined, understanding why defects have taken place, comparing and prioritizing
opportunities for advance betterment.
The fourth and fifth phases are “Improve” and “Control” phases. In improve phase,
experimentation and statistical techniques are used to generate possible improvements
to reduce the amount of quality problems and/or defects. The main objective of this step
is to implement proposed solution and evaluate results. Once the results of proposed
solutions are acceptable, future problems of implemented solutions are controlled.
Figure 3.2 below shows the schematic view of DMAIC process.
[Insert Figure 3.2 about here]
DMAIC methodology has been effectively implemented in many applications such as supply
chain management performance (Yeh, Cheng and Chi, 2007), SC quality management (Wang,
Huang, and Dismukes 2004), human and process factor in Six Sigma implementation (Antony,
Kumar and Madu, 2005), internationalization of higher education (Qureshi et al.,., 2014),
design process improvements (Eldin and Hamza, 2008), among others.

9
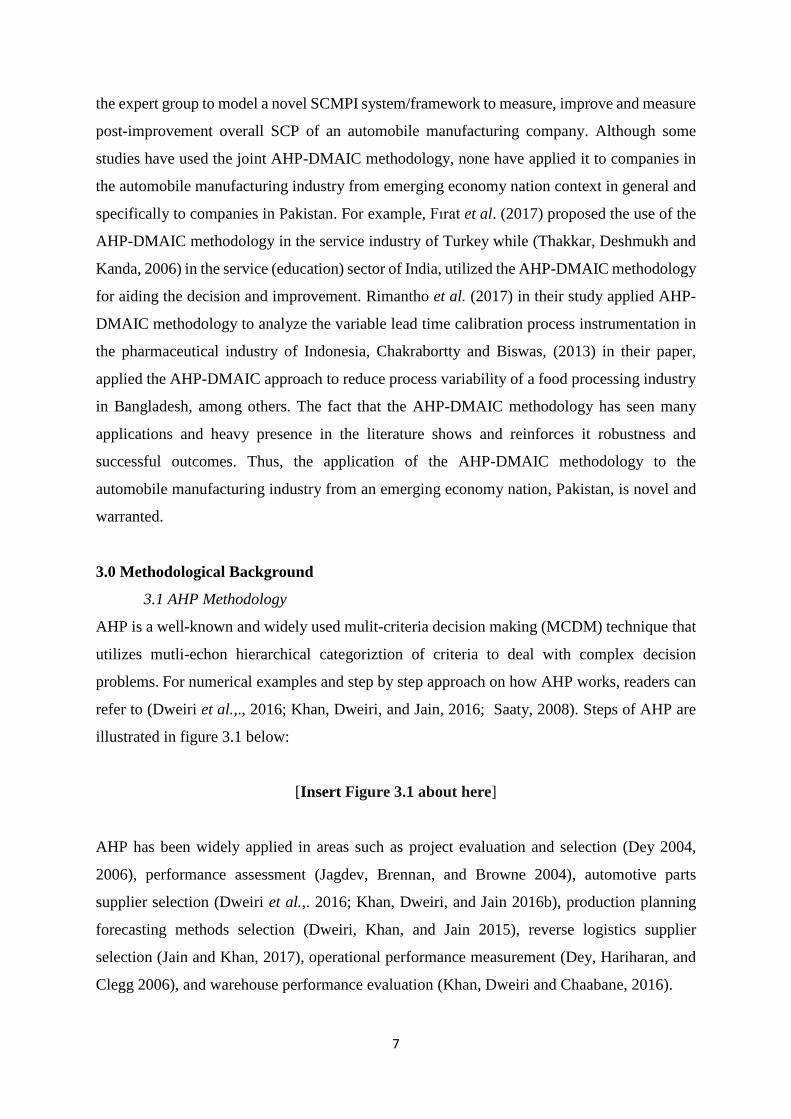
4.0 Proposed Methodology
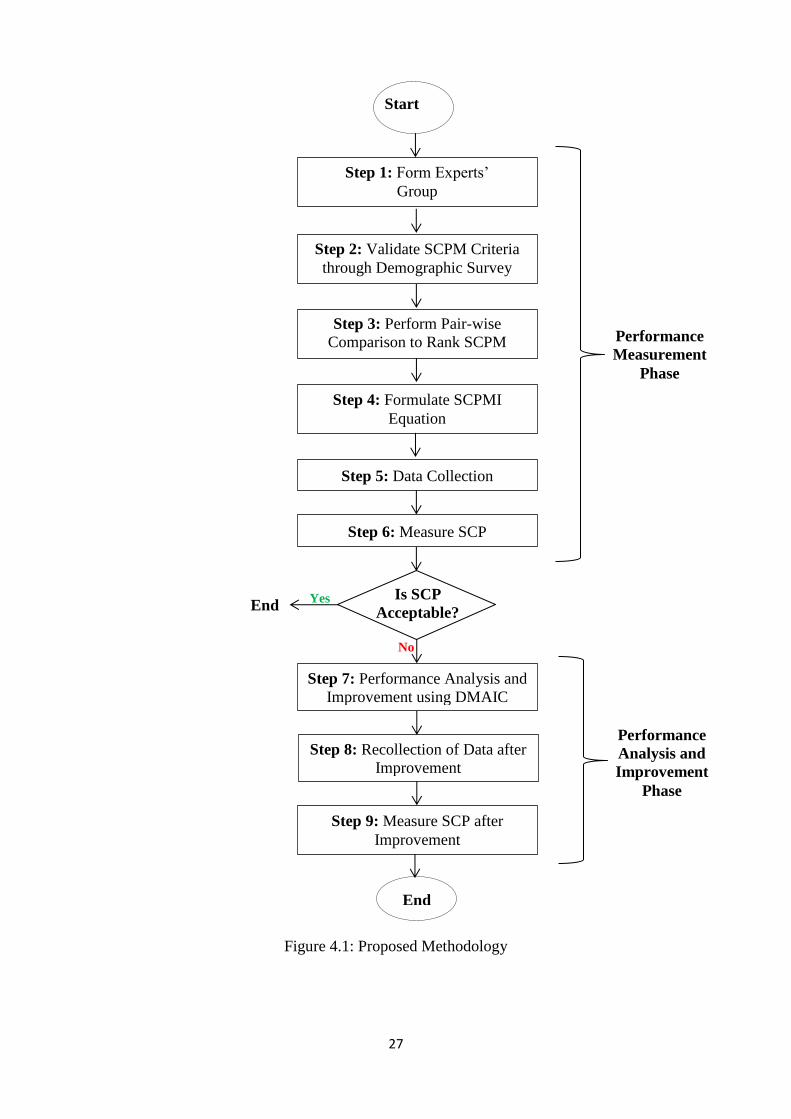
In order to measure and improve SCP using AHP and DMAIC, a systematic step-by-step
approach has been proposed in figure 4.1 below:
[Inset Figure 4.1 about here]
4.1 Performance Measurement Phase
Step 1: Form Experts’ Group
In the step, a group of supply chain experts is formed.
Step 2: Validate SCPM Criteria through Demographic Survey
In this step, a survey among the expert group is conducted to determine what criteria are used
to evaluate their SCP.
Step 3: Perform Pair-wise Comparison to Rank SCPM Criteria
In this step, pair-wise comparisons are conducted on the expert group and data collected are
entered into the Expert Choice (AHP) software to compute the criteria weights.
Step 4: Formulate SCPMI Equation
In this step, the criteria weights obtained in the previous step are used to formulate an index
equation to measure SCP.
Step 5: Data Collection
The relevant data for the criteria defined in the model are collected and used in the equation
for performance measurement. Secondary data was collected from the case company database
as this data collection technique is time-saving and cost-efficient.
Step 6: Measure SCP
The results of the equation provide the SCP.
4.2 Performance Analysis and Improvement Phase
Step 7: Performance Analysis and Improvement using DMAIC
10
The results of the performance are then used to analyze the loop holes in the SC so the
underperformed criteria are highlighted and worked upon to improve overall SCP. DMAIC
approach will be used to improve the underperformed criteria.
Step 8: Recollection of Data after Improvement
Data is recollected for SCP to confirm improvement.
Step 9: Measure SCP after Improvement
The recollected data is then used to measure SCP.
5.0 Implementation of Proposed Methodology
5.1 Company Overview
In order to implement our proposed methodology to measure and improve overall SCP, a
leading automobile company from an emerging economy that assembles SUV cars was
utilized. This case company was established in early 1990’s and is located in one of the biggest
city of Pakistan. The case company has world class plant with a production capacity of around
250 cars / day. Their production plant is located within a 100 acre site and produces all sort of
cars including passenger cars, commercial vehicles etc.
Step 1: Form Experts’ Group
The experts group formed consisted of ten (10) respondents composed of a senior SC manager
with 7years working experience, three SC executives with 7years, 5years and 5years working
experience, a warehouse manager with 5years working experience, two production managers
with 6years and 5years working experience, a marketing manager with 9years working
experience, finance manager with 10years working experience, and a logistics manager with
4years working experience. These respondents have worked with the case company for a
minimum of 5years. They were selected based on a combination of purposive, convenience
and self-selection approaches. Purposive in the sense that they are knowledgeable, convenience
as they are easily accessible and self-selection based on their willingness to participate in the
study. This combined approach helped to reaffirms their commitments to the study. All of them
were at least graduates in their respective field and having been trained locally and
internationally.
Step 2: Validate SCPM Criteria through Demographic Survey
11
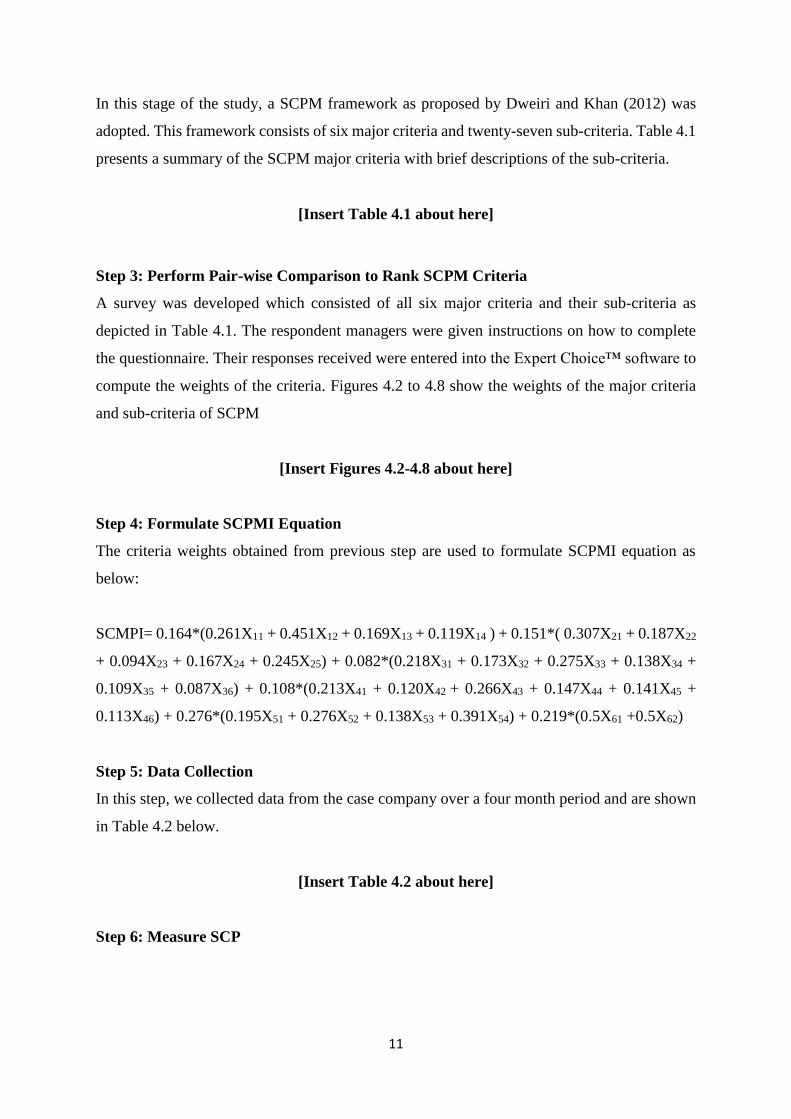
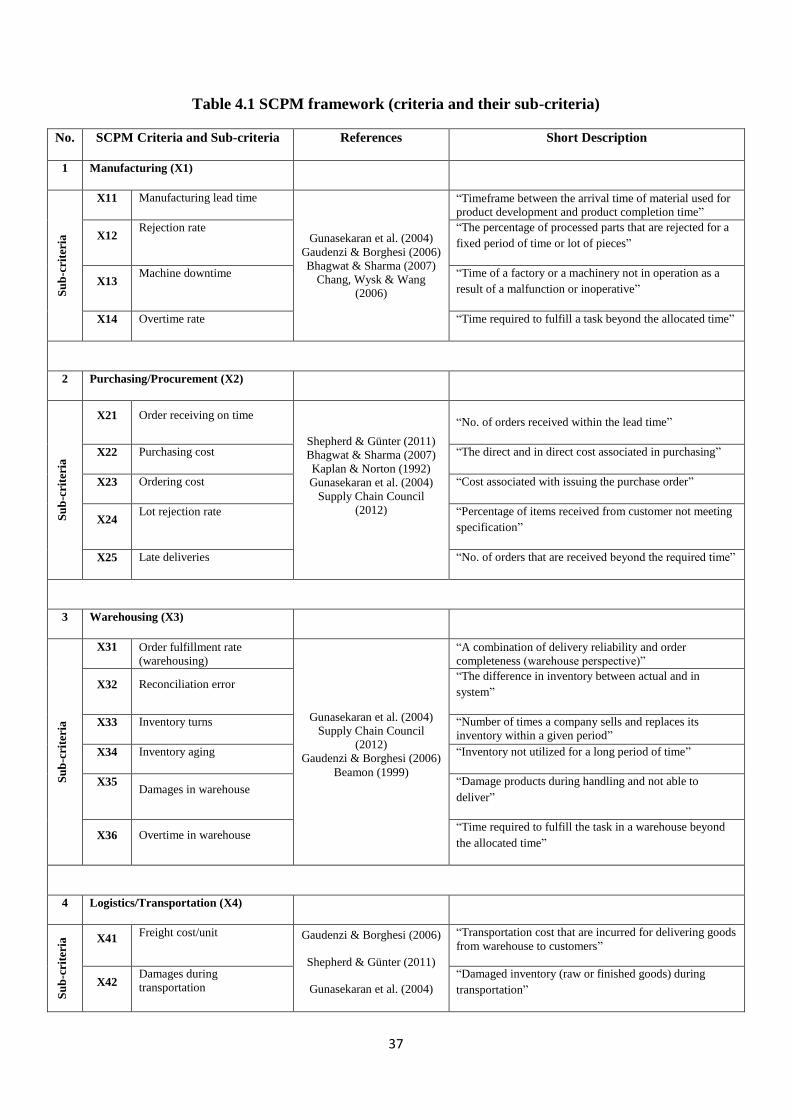
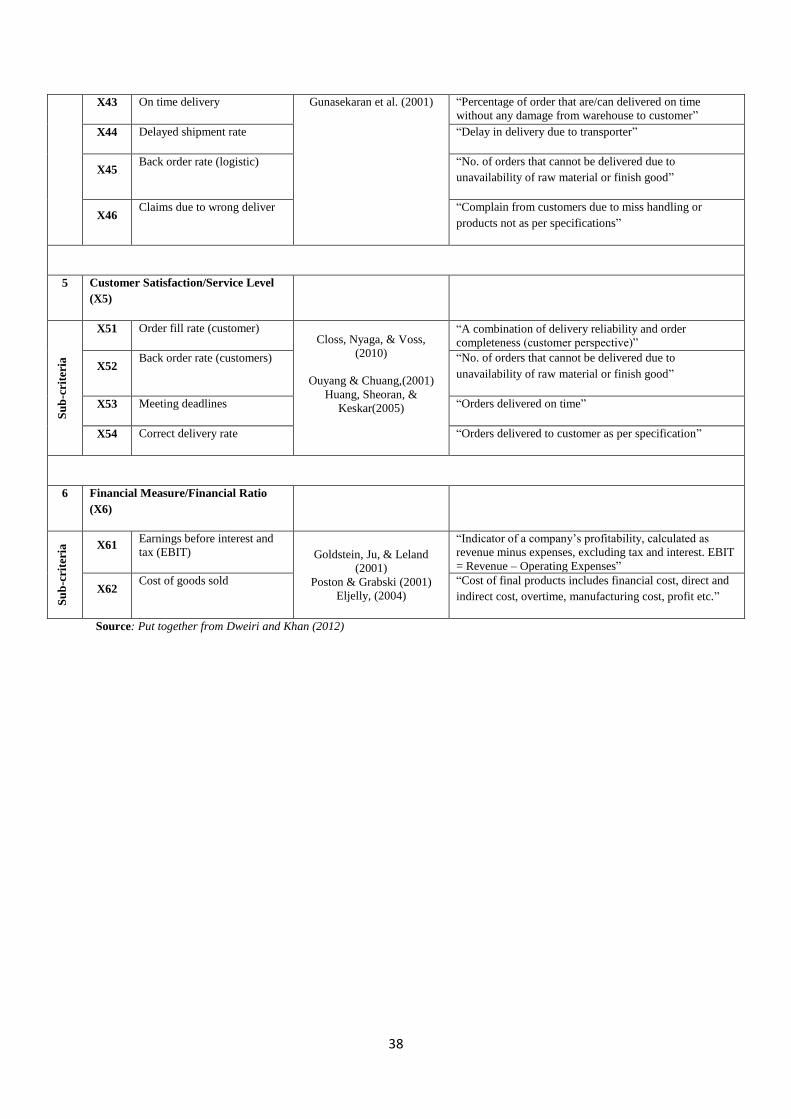
In this stage of the study, a SCPM framework as proposed by Dweiri and Khan (2012) was
adopted. This framework consists of six major criteria and twenty-seven sub-criteria. Table 4.1
presents a summary of the SCPM major criteria with brief descriptions of the sub-criteria.
[Insert Table 4.1 about here]
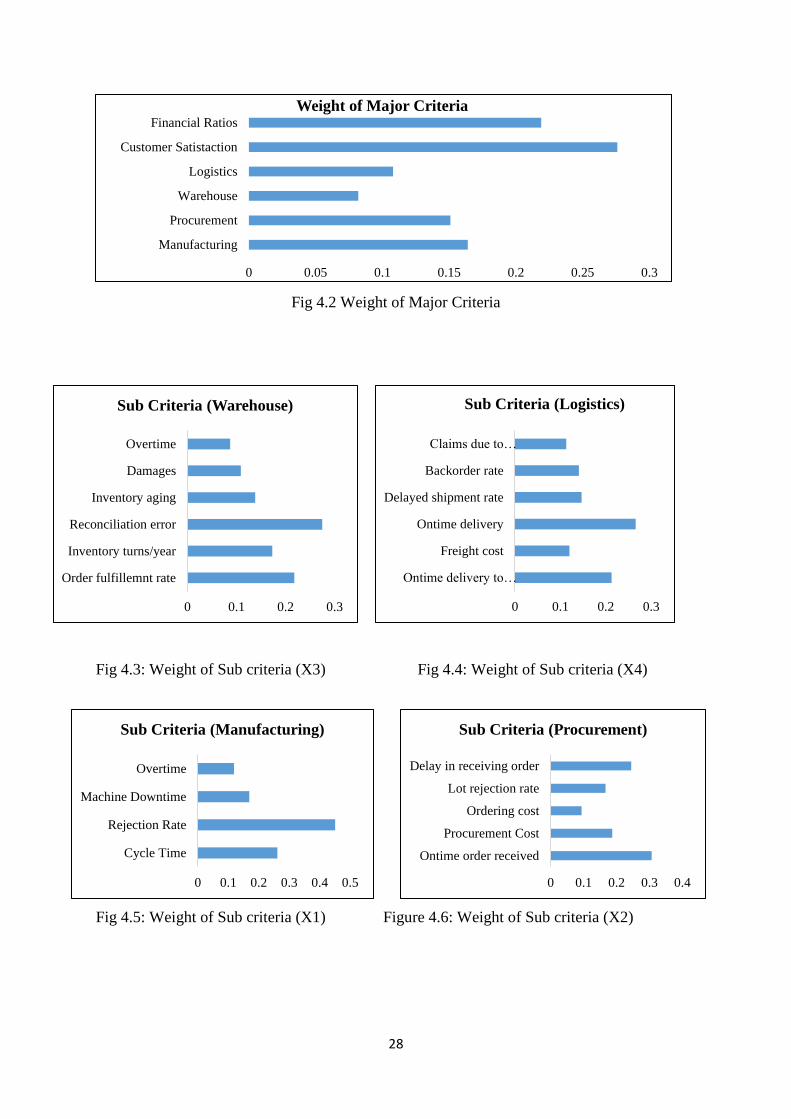
Step 3: Perform Pair-wise Comparison to Rank SCPM Criteria
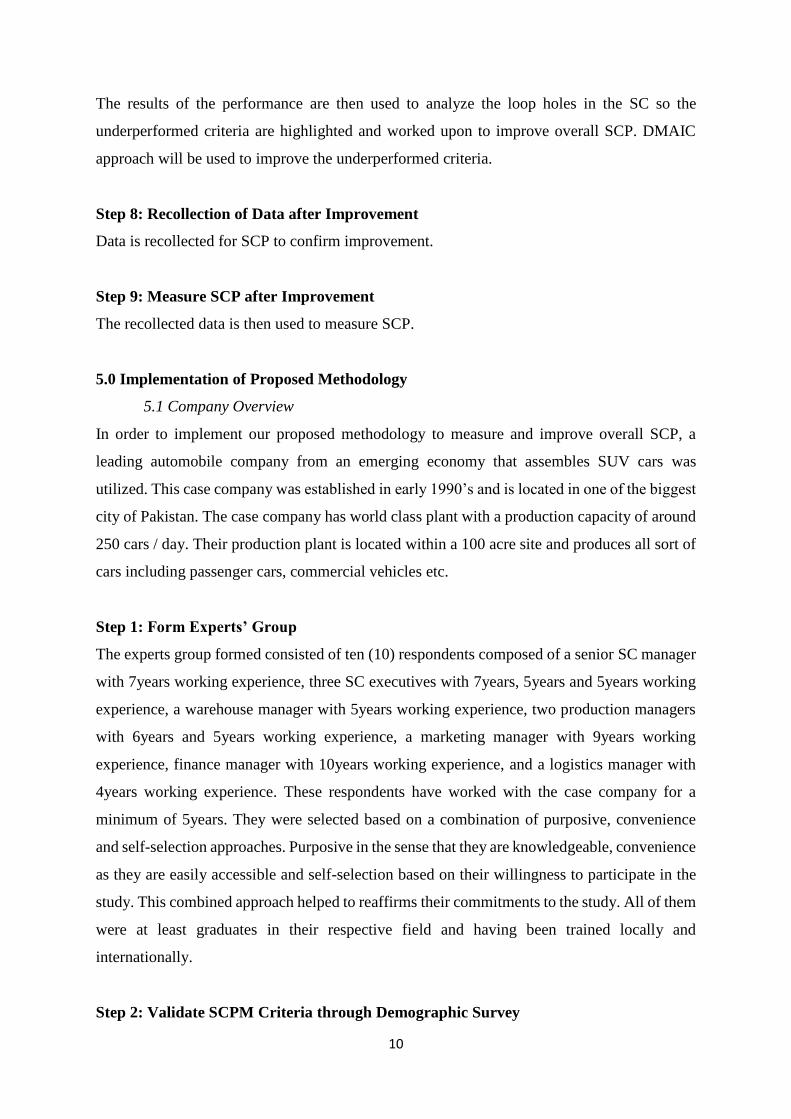
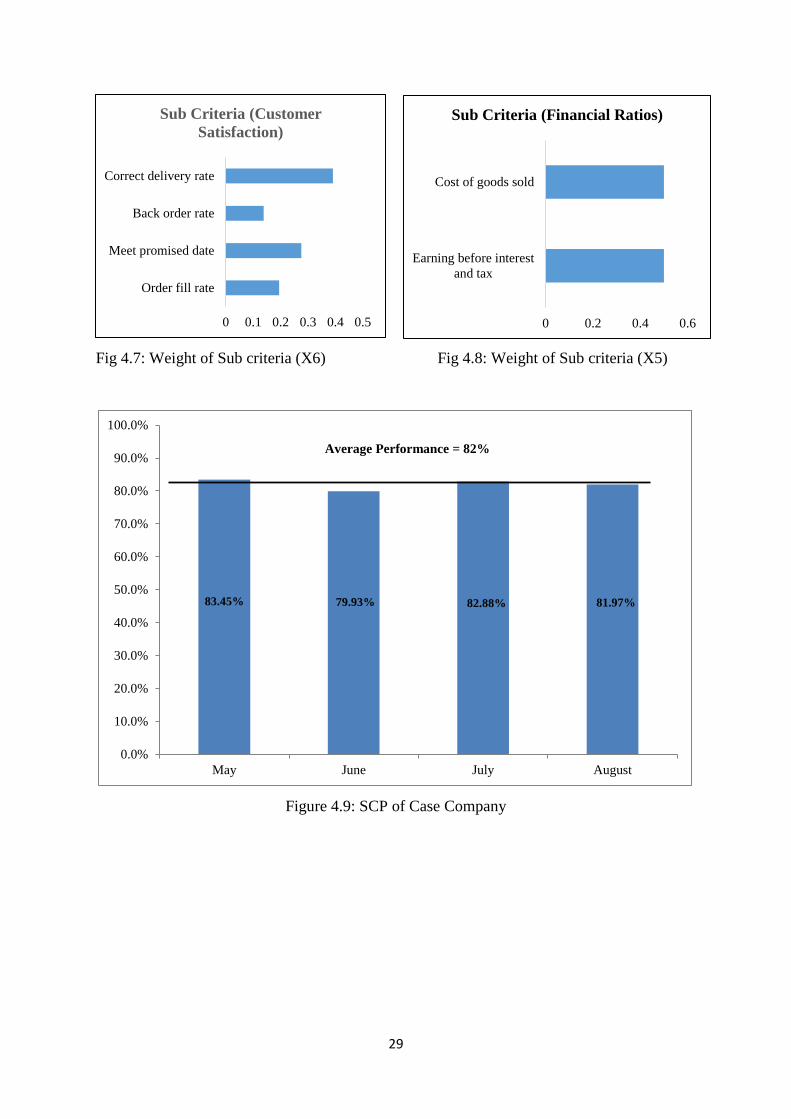
A survey was developed which consisted of all six major criteria and their sub-criteria as
depicted in Table 4.1. The respondent managers were given instructions on how to complete
the questionnaire. Their responses received were entered into the Expert Choice™ software to
compute the weights of the criteria. Figures 4.2 to 4.8 show the weights of the major criteria
and sub-criteria of SCPM
[Insert Figures 4.2-4.8 about here]
Step 4: Formulate SCPMI Equation
The criteria weights obtained from previous step are used to formulate SCPMI equation as
below:
SCMPI= 0.164*(0.261X11 + 0.451X12 + 0.169X13 + 0.119X14 ) + 0.151*( 0.307X21 + 0.187X22
+ 0.094X23 + 0.167X24 + 0.245X25) + 0.082*(0.218X31 + 0.173X32 + 0.275X33 + 0.138X34 +
0.109X35 + 0.087X36) + 0.108*(0.213X41 + 0.120X42 + 0.266X43 + 0.147X44 + 0.141X45 +
0.113X46) + 0.276*(0.195X51 + 0.276X52 + 0.138X53 + 0.391X54) + 0.219*(0.5X61 +0.5X62)
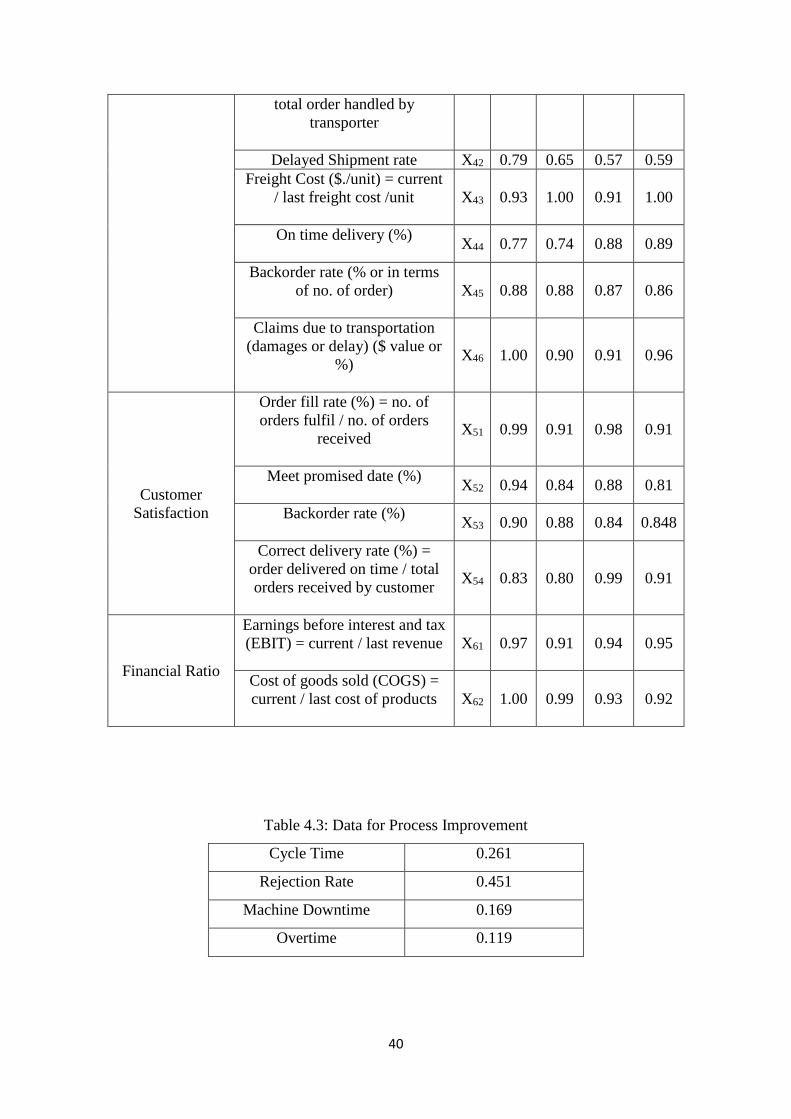
Step 5: Data Collection
In this step, we collected data from the case company over a four month period and are shown
in Table 4.2 below.
[Insert Table 4.2 about here]
Step 6: Measure SCP

12
Using SCPMI equation developed in step 4 and data collected form the case company
mentioned in Table 4.2, an average four months SCMPI achieved is 82.72%. Each month’s
SCP outcome is plotted in Figure 4.9 below.
Step 7: Performance Analysis and Improvement using DMAIC
Since manufacturing is the core activity of the case company’s SC, it was selected as the
focal/starting point to improve the overall SCP.
After selecting “manufacturing” for improving the overall SCP of the case company using the
SCMPI, it was then mandatory to choose one of the sub-criteria within manufacturing to work
on, again, as the starting point. From Figure 4.5, it was found that, the ‘rejection rate’ was the
highest ranked sub-criteria within the manufacturing cluster/group. This graph/figure is
transformed into Table 4.3 below.
[Insert Table 4.3 about here]
Since manufacturing line consists of various processes understanding material properties and
inspection activity are important for quality reasons. Even if a task is accurately completed,
product rejection can still occur. Material, design, parts coming from different suppliers and
processing method all contributes to the cause of products rejection. Accordingly, finding the
root cause is vital to prevent the continuity of the problem. Product quality affects
manufacturing cost, profit and company’s image. From engineering perspective, problems
related to product rejection could be analyzed by using statistical methods, visual inspection,
and various engineering techniques.
Product rejection can be loosely defined as the unreasonable danger of a product. Lack of
quantification, assessment and attention for the products rejection should be a thing of the past.
Zero rejection of products never existed in actual manufacturing. Therefore, defective products
should be a standard rejection that does not put the user in danger/risk. Product rejection can
be divided into four main categories including design rejection, manufacturing rejection, lack
of warning, and instruction rejection. Mostly, rejections are from manufacturing processes that
are possibly caused by low quality of raw material and operational mistakes. Therefore,
tracking down products rejection during process inspection is important to prevent the
harm/problem to occur during usage.

13
Define Phase
ABC Engineering Limited has supplied Part “A” to case company over the past twenty years.
Because of the high rejection rate in case company’s Part “A”’s feed production line, the
company is interested in minimizing this rejection rate. Therefore, to minimize the rejection
rate of case company, ABC Engineering rejection rate must first be minimized. Part “A”
manufacturing involves six key steps. These include blanking, compound die bending-I and
piercing, punching, restrike, flanging/bending-II, and incoming. Defects are observed more at
two stages mainly punching stage and incoming. The defects occurring at “punching” stage
were studied in details, and the main reasons were identified with fishbone diagram, and
suggestions were made and implemented to reduce these defects. At “punching” stage, mainly
the causes of the defects include punching in an improper way, incorrect position of
component, and punching out in open die. Punching machine is used for punching operations
at the end of the component which is the third stage for the manufacturing of the component.
Because the components were not held in the proper way during operation, more components
were going to waste. The part is mounted on the bed for bending and the punching machine is
inserted into both ends of part and held securely. When a bend is made too close to a hole, the
hole doesn’t alien properly.
The objectives for DMAIC approach implementation at the case company are as follows:
1. To ascertain the root cause factors of the defects.
2. To enhance the quality by decreasing the defects.
This study focuses on the elimination/lessening of foundry (shop floor) defects with the
application DMAIC approach.
Measure
In this stage, considerable amount of data are collected (measured) and can be seen in Figures
4.10 and 4.11 below. The “X”-axis of both figures shows the number of samples. In both part
A (RH and LH), 40 samples were collected. The “Y”-axis shows the accuracy level in terms of
percentage.
[Insert Figures 4.10 & 4.11 about here]
14
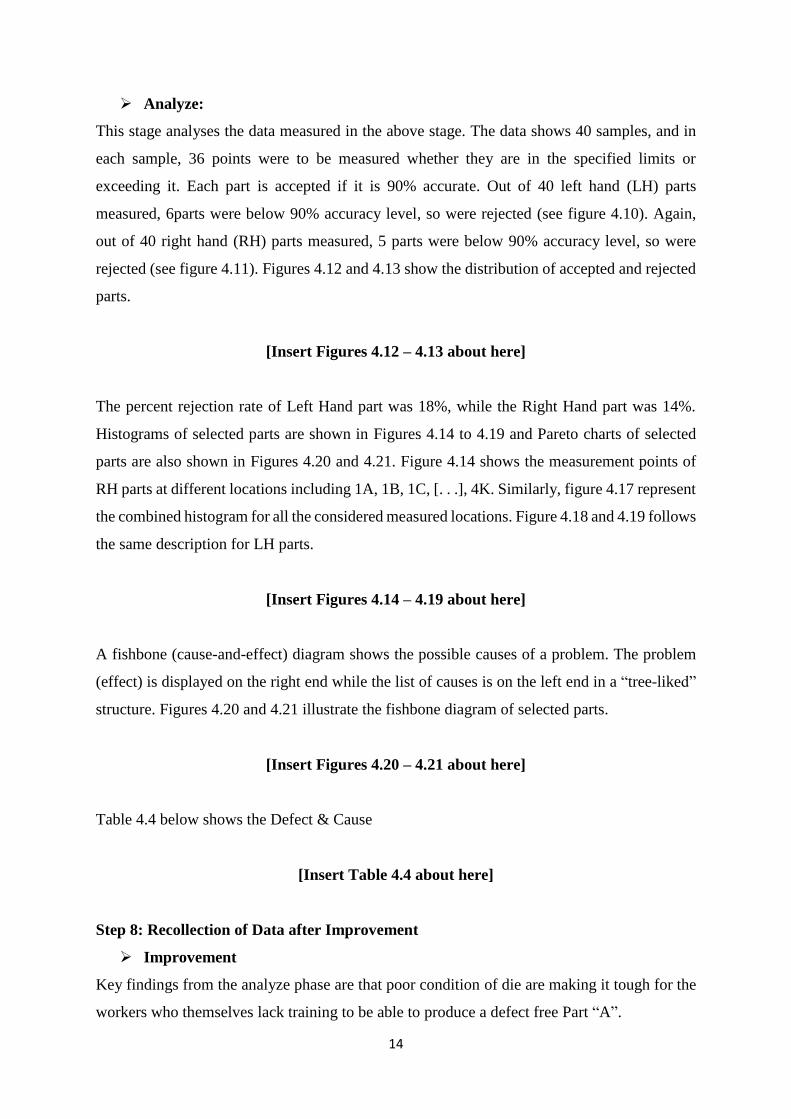
Analyze:
This stage analyses the data measured in the above stage. The data shows 40 samples, and in
each sample, 36 points were to be measured whether they are in the specified limits or
exceeding it. Each part is accepted if it is 90% accurate. Out of 40 left hand (LH) parts
measured, 6parts were below 90% accuracy level, so were rejected (see figure 4.10). Again,
out of 40 right hand (RH) parts measured, 5 parts were below 90% accuracy level, so were
rejected (see figure 4.11). Figures 4.12 and 4.13 show the distribution of accepted and rejected
parts.
[Insert Figures 4.12 – 4.13 about here]
The percent rejection rate of Left Hand part was 18%, while the Right Hand part was 14%.
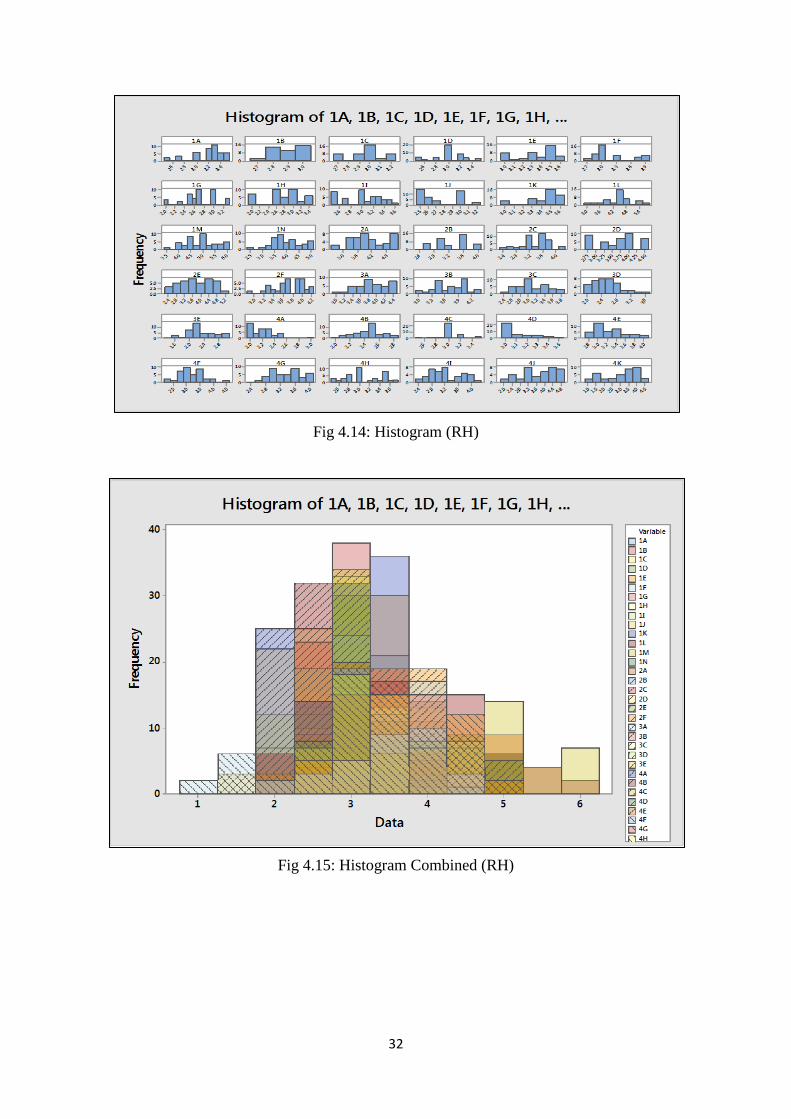
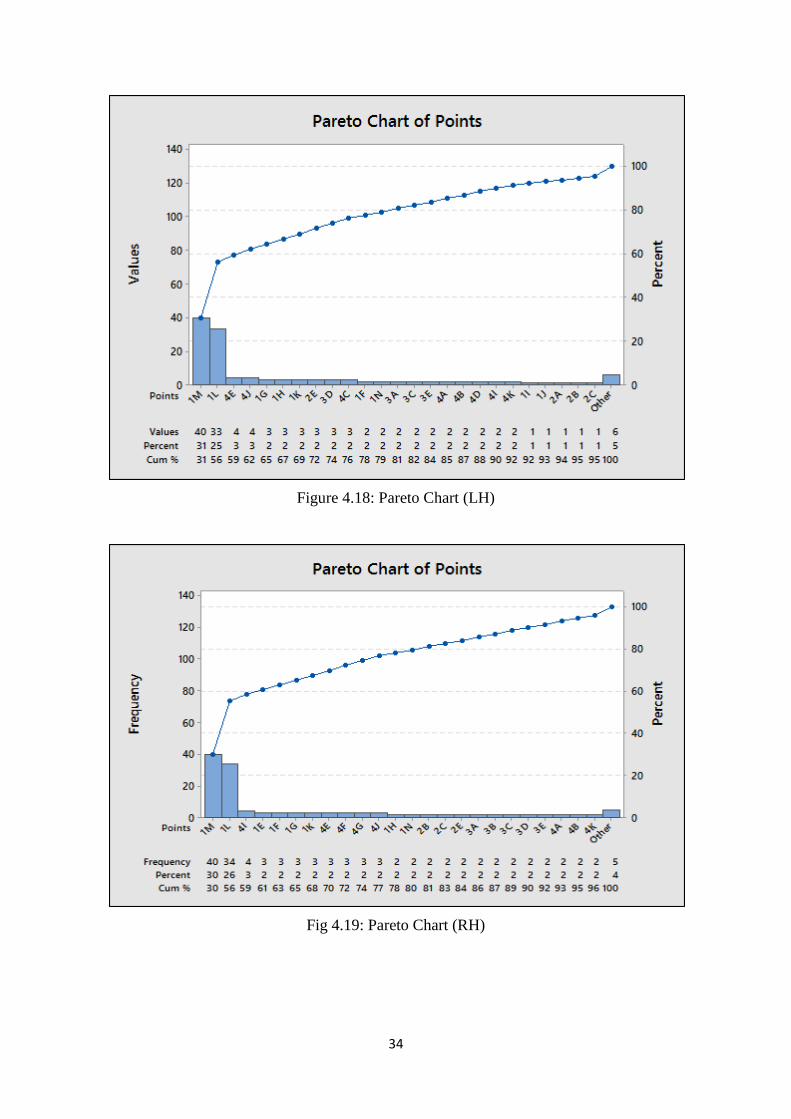
Histograms of selected parts are shown in Figures 4.14 to 4.19 and Pareto charts of selected
parts are also shown in Figures 4.20 and 4.21. Figure 4.14 shows the measurement points of
RH parts at different locations including 1A, 1B, 1C, [. . .], 4K. Similarly, figure 4.17 represent
the combined histogram for all the considered measured locations. Figure 4.18 and 4.19 follows
the same description for LH parts.
[Insert Figures 4.14 – 4.19 about here]
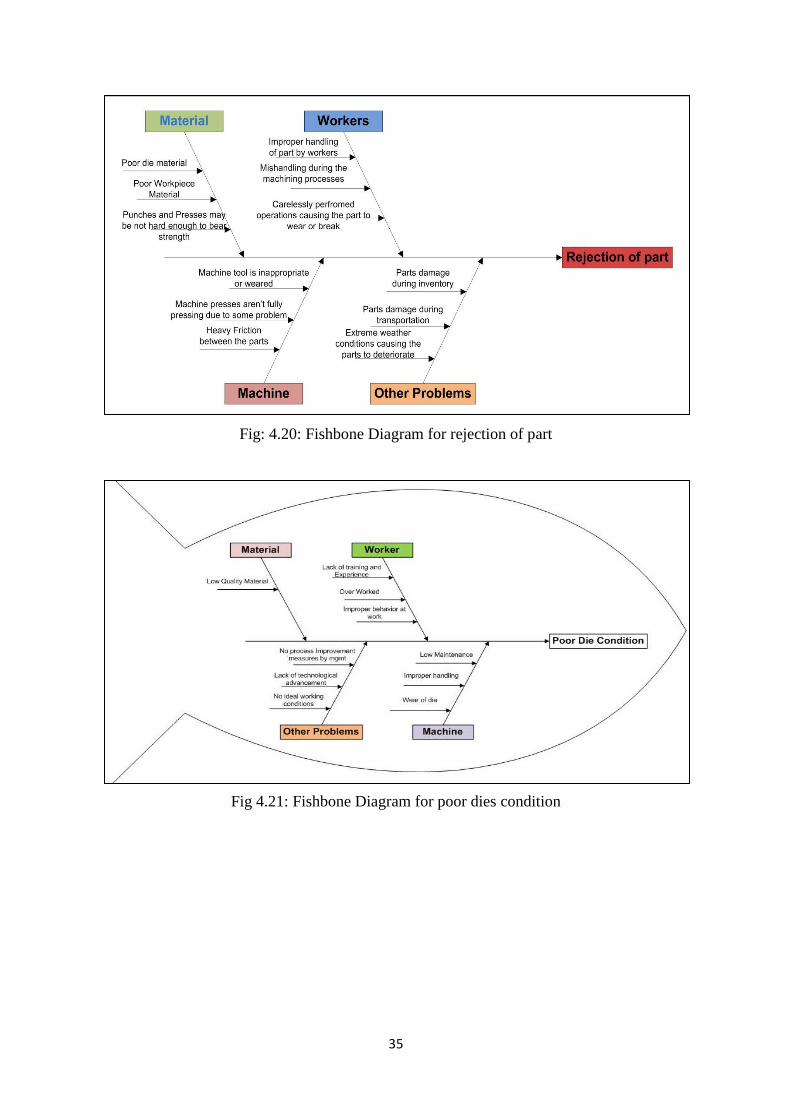
A fishbone (cause-and-effect) diagram shows the possible causes of a problem. The problem
(effect) is displayed on the right end while the list of causes is on the left end in a “tree-liked”
structure. Figures 4.20 and 4.21 illustrate the fishbone diagram of selected parts.
[Insert Figures 4.20 – 4.21 about here]
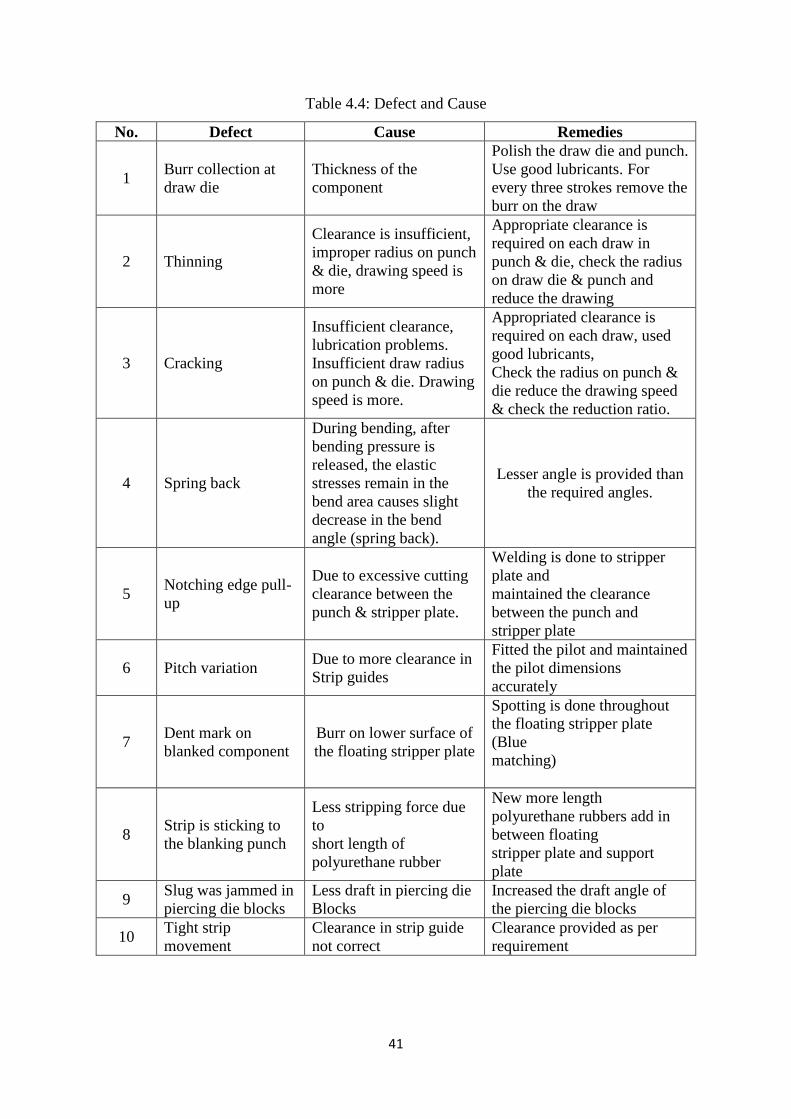
Table 4.4 below shows the Defect & Cause
[Insert Table 4.4 about here]
Step 8: Recollection of Data after Improvement
Improvement
Key findings from the analyze phase are that poor condition of die are making it tough for the
workers who themselves lack training to be able to produce a defect free Part “A”.

15
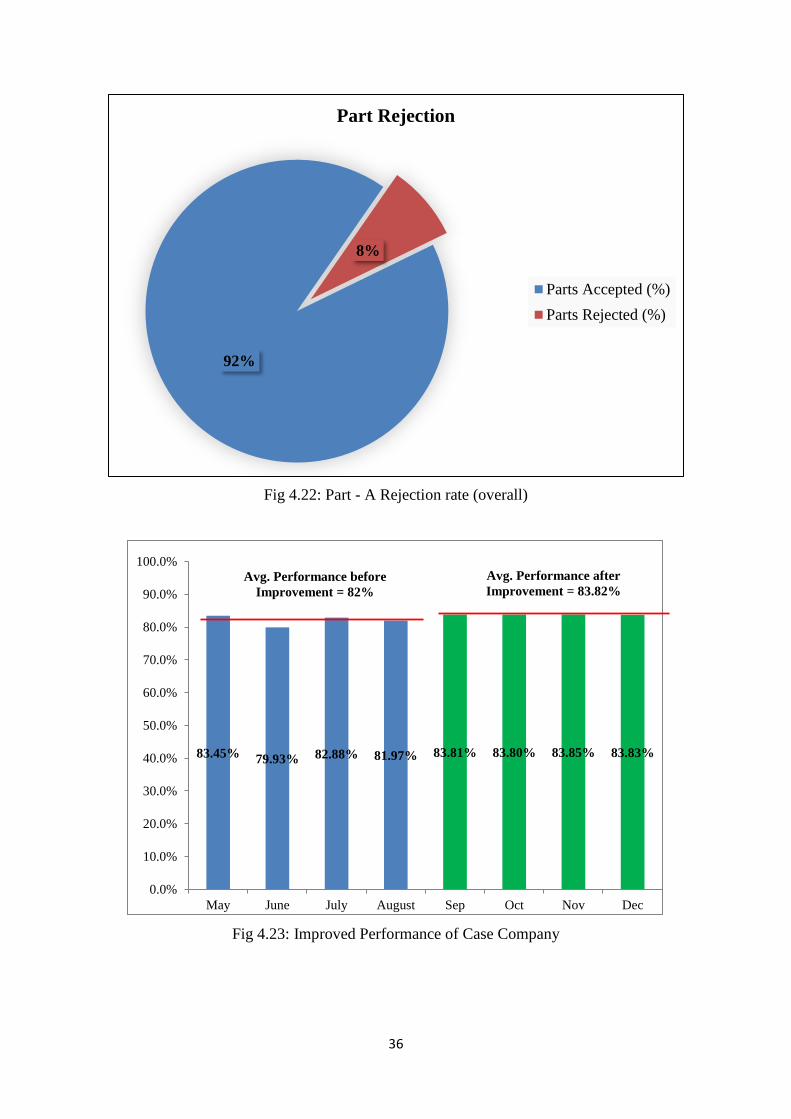
After implementation of the suggestions, the rejection rate of part “A” reduced on an average
from 16% to 8% as shown in Figure 4.22. Similarly, the SCP raised to 83.82% in four months
September - December (as it took four months to implement DMAIC and measure SCP) as
mentioned in Figure 4.23.
[Insert Figures 4.22 & 4.23 about here]
Step 9: Measure SCP after Improvement
Control
To ensure sustenance of the proposed improvement methods, there’s the need to implement
some control measures to equip them to be more proactive in managing future process
variations and unexpected deviations. Several tools are available for their use given their
circumstances.
One useful way is to make some best practices when companies are subcontracting part of their
manufacturing to their strategic partners. Many end user products are produced in foreign
markets transported with the help of multiple logistics providers through air, ocean, and trucks.
It may take weeks or even months for an end product to get to the shelves of a store from a
supplier. Additionally, many of these manufacturers have simplified their supply chains and
executed lean inventory techniques. As such, any issue with regards to suppliers (e.g. quality)
can easily create stock outs. Organizations that sell industrial products are required to maintain
their preferred supplier status to be continuously considered for future business. Therefore,
they are under some level of pressure to make sure their products continuously meet or exceed
the acceptable parts per million (PPM) and Corrective Action (CA) thresholds set by their
customers. Hence, the topmost agenda of these companies is the managing of their own
supplier’s quality. Here there are a few of the best practices that maybe implemented for
controlling.
Most organizations aren’t tracking and measuring the cost of poor supplier quality (COPQ)
attributed to their suppliers. Such COPQ may amount to over 10% of the revenue of the firm.
Some organizations just track supplier COPQ through scrap measuring and material review
board (MRB) inventory increase. The purpose of MRB is to electronically document, manage
and track discrepancies in the inventory (raw material, in-process or finish goods). Quality

16
Management Systems (QMS) can be used to track any of the above costs incurred as a result
of supplier quality issues. Renowned manufacturers are utilizing the above tools to track COPQ
that are actual supplier-related.
Total COPQ is COPQ of OEM plus suppliers inherited COPQ. Therefore, organizations must
work with their suppliers to enhance their quality, to enable them reduce their total COPQ.
Introducing a cost-recovery system where suppliers are surcharged for offering low quality
components, is an effective way of bringing discipline and accountability into the supply
chains.
There is a general view that less than 50% of organizations follow up with their suppliers cost
recovery (Oren, 2000; MacCormack et al.,., 2010). Many of these firms just recover cost of
material. A recent report by advanced market research (AMR) stated that, about 65% of the
costs due to poor supplier quality are non-material related. If a firm establishes QMS to
agglomerate such costs and surcharge it suppliers, they may not only be able to recover fully
their suppliers’ poor quality costs, but will be able to also institute discipline to enhance
products quality.
One of the ways to go is through supplier audit ensuring that a supplier follows an agreed
processes and procedures during the selection and negotiation stages. The supplier audit
determines non-conformances in supplier’s invoicing process, shipment process,
manufacturing process, engineering change process, and quality process. After the audit,
corrective actions are jointly identified which ought to be executed by the supplier within a
stipulated timeframe. A future audit is conducted to ensure that the corrective actions were and
have been implemented successfully.
Manufacturers ensuring their suppliers implement best practices ensure an effective and
efficient audit process and allow them to conduct a supply-base audit at least yearly while
maintaining a lean staff of auditors. Supplier Scorecards is one of the best techniques in using
facts to rank the supplier’s relative performance within the supply-base and tracking
improvement in supplier’s quality over time. Scorecards also provide a data point into any
future business negotiations.
6.0 Discussion and conclusion
17
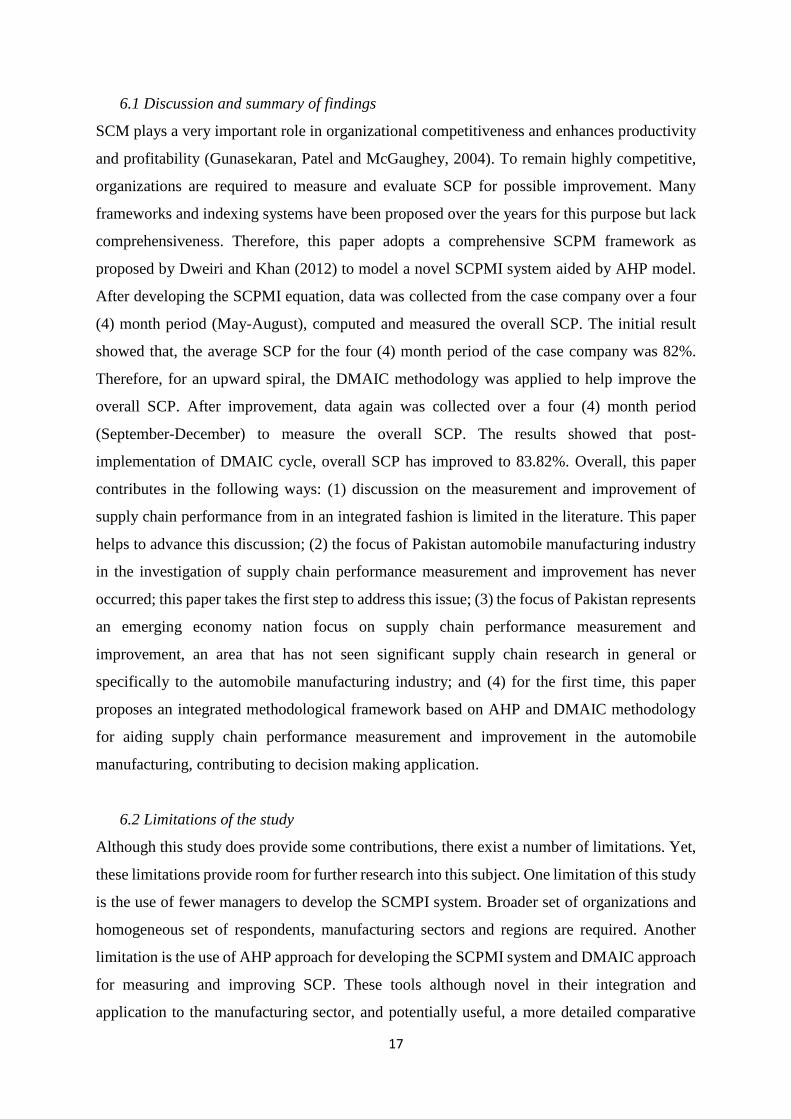
6.1 Discussion and summary of findings
SCM plays a very important role in organizational competitiveness and enhances productivity
and profitability (Gunasekaran, Patel and McGaughey, 2004). To remain highly competitive,
organizations are required to measure and evaluate SCP for possible improvement. Many
frameworks and indexing systems have been proposed over the years for this purpose but lack
comprehensiveness. Therefore, this paper adopts a comprehensive SCPM framework as
proposed by Dweiri and Khan (2012) to model a novel SCPMI system aided by AHP model.
After developing the SCPMI equation, data was collected from the case company over a four
(4) month period (May-August), computed and measured the overall SCP. The initial result
showed that, the average SCP for the four (4) month period of the case company was 82%.
Therefore, for an upward spiral, the DMAIC methodology was applied to help improve the
overall SCP. After improvement, data again was collected over a four (4) month period
(September-December) to measure the overall SCP. The results showed that post-
implementation of DMAIC cycle, overall SCP has improved to 83.82%. Overall, this paper
contributes in the following ways: (1) discussion on the measurement and improvement of
supply chain performance from in an integrated fashion is limited in the literature. This paper
helps to advance this discussion; (2) the focus of Pakistan automobile manufacturing industry
in the investigation of supply chain performance measurement and improvement has never
occurred; this paper takes the first step to address this issue; (3) the focus of Pakistan represents
an emerging economy nation focus on supply chain performance measurement and
improvement, an area that has not seen significant supply chain research in general or
specifically to the automobile manufacturing industry; and (4) for the first time, this paper
proposes an integrated methodological framework based on AHP and DMAIC methodology
for aiding supply chain performance measurement and improvement in the automobile
manufacturing, contributing to decision making application.
6.2 Limitations of the study
Although this study does provide some contributions, there exist a number of limitations. Yet,
these limitations provide room for further research into this subject. One limitation of this study
is the use of fewer managers to develop the SCMPI system. Broader set of organizations and
homogeneous set of respondents, manufacturing sectors and regions are required. Another
limitation is the use of AHP approach for developing the SCPMI system and DMAIC approach
for measuring and improving SCP. These tools although novel in their integration and
application to the manufacturing sector, and potentially useful, a more detailed comparative
18
analysis with other tools, is necessitated. Due to data scarcity, this study unfortunately used a
shorter period (4 months) data set to test and exemplify the applicability of the proposed
methodological framework to the case company. We therefore acknowledge this as one of the
limitations to our study. We do recommend future researchers to use other tools to aid in
developing the SCPMI systems, and measuring and improving SCP and compare their
outcomes with that of this study.
6.3 Academic and managerial implications
Academically, the SCPM framework can serve as a theoretical basis for further empirical
studies. This framework can be used to evaluate other strategic and tactical decisions such as
broader business processes. It also provides some unique approach for managers to measure
and improve overall SCP. This work provides researchers and industrial managers with an
understanding of how to measure and improve supply chain performance. Researchers and
industrial managers can also use this work to help determine how to identify specific low
performing areas of supply chain process to propose possible improvement strategies such as
improved operational practices and supply chain synergies. The results can serve as a
benchmark for continuous performance improvement by case company and other industrial
players. Thus, the results are useful for managing overall supply chain performance
highlighting the areas of the chain that have to be dealt with to improve the supply chain
performance. After having practical implementation in the automobile manufacturing company
in Pakistan, it can be argued that this study would make a fruitful impact on managerial decision
making for reducing different types of supply chain performance challenges. This work sets
the stage for additional research investigation and practical application of the framework within
the manufacturing sector.
Acknowledgements:
The authors are grateful to the referees for their constructive comments that have helped in
shaping the format and content of this manuscript.
References
Adams, C. W., Gupta, P. and Wilson, C. E. (2003), Six Sigma Deployment, pp.79-104. doi:
10.1016/B978-0-7506-7523-9.50011-8.
19
Agami, N., Saleh, M. and Rasmy, M. (2012), "Supply Chain Performance Measurement
Approaches: Review and Classification", The Journal of Organizational
Management Studies, Vol. 2012, pp. 1–20. doi: 10.5171/2012.872753.
Antony, J., Kumar, M. and Madu, C. N. (2005), "Six sigma in small‐ and medium‐sized UK
manufacturing enterprises", International Journal of Quality & Reliability
Management, Vol 22 No. 8, pp. 860–874. doi: 10.1108/02656710510617265.
Bahri, M., St-Pierre, J. and Sakka, O. (2011), "Economic value added: a useful tool for SME
performance management", International Journal of Productivity and Performance
Management, Vol 60 No. 6, pp. 603–621. doi: 10.1108/17410401111150779.
Chopra, S. and Meindl, P. (2016), Supply Chain Management: Strategy, Planning, and
Operation. 6th edn. Pearson Prentice Hall.
Croxton, K. L., Garcia-Dastugue, S. J., Lambert, D. M. and Rogers, D. S. (2001), "The
Supply Chain Management Processes", The International Journal of Logistics
Management, Vol 12 No. 2, pp. 13–36. doi: 10.1108/09574090110806271.
Dey, P. K. (2004), "Analytic hierarchy process helps evaluate project in Indian oil pipelines
industry", International Journal of Operations & Production Management, Vol 24
No. 6, pp. 588–604. doi: 10.1108/01443570410538122.
Dey, P. K. (2006), "Integrated project evaluation and selection using multiple-attribute
decision-making technique", International Journal of Production Economics, Vol
103 No. 1, pp. 90–103. doi: 10.1016/j.ijpe.2004.11.018.
Dey, P. K., Hariharan, S. and Clegg, B. T. (2006), "Measuring the operational performance of
intensive care units using the analytic hierarchy process approach", International
Journal of Operations & Production Management, Vol 26 No. 8, pp. 849–865. doi:
10.1108/01443570610678639.
Dweiri, F. and Khan, S. A. (2012), "Development of a universal supply chain management
performance index", International Journal of Business Performance and Supply

20
Chain Modelling, Vol.4 No. (3/4), pp. 232–236.
doi: 10.1504/IJBPSCM.2012.050387.
Dweiri, F., Khan, S. A. and Jain, V. (2015), "Production planning forecasting method
selection in a supply chain: A case study", International Journal of Applied
Management Science, Vol 7 No. 1, pp. 38–58. doi: 10.1504/IJAMS.2015.068056.
Dweiri, F., Kumar, S., Khan, S. A. and Jain, V. (2016), "Designing an integrated AHP based
decision support system for supplier selection in automotive industry", Expert
Systems with Applications,Vol 62, pp. 273–283.
Eldin, S. and Hamza, A. (2008), "Design process improvement through the DMAIC Six
Sigma approach: a case study from the Middle East", Int. J. Six Sigma and
Competitive Advantage J. Six Sigma and Competitive Advantage, Vol 4 No.1, pp.
35–47. doi: 10.1504/IJSSCA.2008.018419.
Fırat, S. Ü. O., Akan, M. Ö. A., Ersoy, E., Gök, S. and Ünal, U. (2017) ‘A Six Sigma
DMAIC Process for Supplier Performance Evaluation using AHP and Kano’s
Model’, International Journal of Business Analytics, 4(2), pp. 37–61. doi:
10.4018/IJBAN.2017040103.
Gejdoš, P. (2015), "Continuous Quality Improvement by Statistical Process Control",
Procedia Economics and Finance,Vol 34 No. 15, pp. 565–572. doi: 10.1016/S2212-
5671(15)01669-X.
Gijo, E. V., Scaria, J. and Antony, J. (2011), "Application of six sigma methodology to
reduce defects of a grinding process", Quality and Reliability Engineering
International, Vol. 27 No. 8, pp. 1221–1234. doi: 10.1002/qre.1212.
Gunasekaran, A., Patel, C. and McGaughey, R. E. (2004), "A framework for supply chain
performance measurement", International Journal of Production Economics, Vol 87
No. 3, pp. 333–347. doi: 10.1016/j.ijpe.2003.08.003.
Gunasekaran, A., Patel, C. and Tirtiroglu, E. (2001) Performance measures and metrics in a
21
supply chain environment, International Journal of Operations & Production
Management. doi: 10.1108/01443570110358468.
Gunasekaran and Kobu (2007) ‘Performance measures and metrics in logistics and supply
chain management: a review of recent literature (1995–2004) for research and
applications’, International Journal of Production Research, 45(12), pp. 2819–2840.
doi: 10.1080/00207540600806513.
Handfield, Robert B. and Ernest L. Nichols, Jr. (1999) Introduction to Supply Chain
Management. New Jersey: Prentice Hall, Inc., Upper Saddle River,.
Jagdev, H., Brennan, A. and Browne, J. (2004) Strategic Decision Making in Modern
Manufacturing. Massachusetts, MA: Kluwer Academic Publishers.
Jain, V. and Khan, S. A. (2017),"Application of AHP in reverse logistics service provider
selection: A case study", International Journal of Business Innovation and Research,
Vol 12 No. 1, pp. 94–119. doi: 10.1504/IJBIR.2017.080711.
Jirasukprasert, P., Arturo Garza-Reyes, J., Kumar, V. and K. Lim, M. (2014), "A Six Sigma
and DMAIC application for the reduction of defects in a rubber gloves manufacturing
process", International Journal of Lean Six Sigma, Vol 5 No. 1, pp. 2–21. doi:
10.1108/IJLSS-03-2013-0020.
Kaplan, R. S. and Norton, D. P. (1992), "The balanced scorecard--measures that drive
performance", Harvard Business Review, Vol 70 No 1, pp. 71–79. doi: 00178012.
Kennerley, M. and Neely, A. (2003), "Measuring performance in a changing business
environment", International Journal of Operations & Production Management, Vol
23 No. 2, pp. 213–229. doi: 10.1108/01443570310458465.
Khan, S. A., Dweiri, F. and Chaabane, A. (2016), "Fuzzy-AHP approach for warehouse
performance measurement", IEEE International Conference on Industrial
Engineering and Engineering Management, pp. 871–875. doi:
10.1109/IEEM.2016.7798001.

22
Khan, S. A. (2013) ‘Importance of Measuring Supply Chain Management Performance’,
Industrial Engineering & Management, 2(5), pp. 1–2.
doi:10.4172/2169-0316.1000e120
Khan, S. A., Dweiri, F. and Jain, V. (2016), "Integrating analytical hierarchy process and
quality function deployment in automotive supplier selection", International Journal
of Business Excellence, Vol 9 No. 2, pp. 156–177. doi: 10.1504/IJBEX.2016.074851.
Kusi-Sarpong, S., Sarkis, J. and Wang, X. (2016a), "Green supply chain practices and
performance in Ghana’s mining industry: a comparative evaluation based on
DEMATEL and AHP", International Journal of Business Performance and Supply
Chain Modelling, Vol 8 No. 4, p. 320. doi: 10.1504/IJBPSCM.2016.081290.
Kusi-Sarpong, S., Sarkis, J. and Wang, X. (2016b), "Assessing green supply chain practices
in the Ghanaian mining industry: A framework and evaluation", International
Journal of Production Economics, Vol 181, pp. 325–341. doi:
10.1016/j.ijpe.2016.04.002.
Lambert, D. M. and Pohlen, T. L. (2001), "Supply Chain Metrics", The International Journal
of Logistics Management, Vol 12 No. 1, pp. 1–19. doi:
http://dx.doi.org/10.1108/09574090110806190.
Leończuk, D. (2016), "Categories of Supply Chain Performance Indicators: an Overview of
Approaches", Business, Management and Education, Vol 14 No. 1, pp. 103–115. doi:
10.3846/bme.2016.317.
MacCormack, J., Hollis, A., Zareipour, H. and Rosehart, W. (2010), "The large-scale
integration of wind generation: Impacts on price, reliability and dispatchable
conventional suppliers"’, Energy Policy, Vol 38 No. 7, pp. 3837–3846. doi:
10.1016/j.enpol.2010.03.004.
Madhani, P. M. (2013), "Demand Chain Management : Integrating Marketing and Supply
Chain Management for Enhancing Customer Value Proposition ", Changing

23
Paradigms in Services Marketing, pp. 261–275.
Montgomery, D. C. and Woodall, W. H. (2008), "An overview of six sigma", International
Statistical Review, pp. 329–346. doi: 10.1111/j.1751-5823.2008.00061.x.
Naude, M. J. and Badenhorst-weiss, J. A. (2011), "The effect of problems on supply chain
wide efficiency", Journal of Transport and Supply Chain Management, Vol 5 No. 1,
pp. 278–298.
Neely, A., Adams, C. and Crowe, P. (2001), "The performance prism in practice", Measuring
Business Excellence, Vol 5 No. 2, pp. 6–13. doi: 10.1108/13683040110385142.
Omachonu, V. K., Ross, J. E. and Swift, J. a. (2004), "Principles of Total Quality".
http://books.google.com/books?id=Qie6Cc_IUpsC&pgis=1%5Cnhttps://imchekedu.f
iles.wordpress.com/2013/09/total-quality-management.pdf.
Oren, S. S. (2000), "Capacity Payments and Supply Adequacy in Competitive Electricity
Markets", Symposium of Specialists in electric operational and expansion planning,
pp. 1–8.
Pyzdek, T. and Keller, P. (2010), "Building the Responsive Six Sigma Organization", in The
SIx Sigma Handook. A complete guide for Green Belts, Black Belts and Managers at
all levels, pp. 3–36.
Qureshi, M. I., Janjua, S. Y., Zaman, K., Lodhi, M. S. and Tariq, Y. Bin
(2014),"Internationalization of higher education institutions: Implementation of
DMAIC cycle", Scientometrics, Vol 98 No. 3, pp. 2295–2310. doi: 10.1007/s11192-
013-1163-9.
Rezaei, A. R., Çelik, T. and Baalousha, Y. (2011) ‘Performance measurement in a quality
management system’, Scientia Iranica, 18(3 E), pp. 742–752. doi:
10.1016/j.scient.2011.05.021.
Rimantho, D., Rahman, T. A., Cahyadi, B. and Tina Hernawati, S. (2017) ‘Application of six
sigma and AHP in analysis of variable lead time calibration process instrumentation’,

24
in AIP Conference Proceedings. doi: 10.1063/1.4975969.
Ripon Kumar Chakrabortty, Tarun Kumar Biswas, I. A. (2013) ‘Reducing Process Variability
By Using Dmaic Model: a Case Study in Bangladesh’, International Journal for
Quality Research, 7(1), pp. 127–140.
Saad, M. and Patel, B. (2006), "An investigation of supply chain performance measurement
in the Indian automotive sector" Benchmarking: An International Journal, Vol 13
No. 1/2, pp. 36–53. doi: 10.1108/14635770610644565.
Saaty, T. (2008), "Decision making with the analytic hierarchy process" Int. J. Services
Sciences, Vol 1 No. 1, pp. 83–98.
http://www.colorado.edu/geography/leyk/geog_5113/readings/saaty_2008.pdf.
Sharahi, S. and Abedian, M. (2009), "Supply Chain and Logistics in National, International
and Governmental Environment", in Supply Chain and logistics in National,
International and Governmental Environement, pp. 21–42.
Simchi-Levi, D., Kaminsky, P. and Simchi-Levi, E. (2008), "Designing and managing the
supply chain: concepts, strategies, and case studies", Book.
Thakkar, J., Deshmukh, S. G. and Kanda, A. (2006) ‘Implementing Six Sigma in service
sector using AHP and Alderfer’s motivational model - A case of educational
services’, International Journal of Six Sigma and Competitive Advantage, 2(4). doi:
10.1504/IJSSCA.2006.011565.
Wang, G., Huang, S. H. and Dismukes, J. P. (2004), "Product-driven supply chain selection
using integrated multi-criteria decision-making methodology", International Journal
of Production Economics, Vol 91 No. 1, pp. 1–15. doi: 10.1016/S0925-
5273(03)00221-4.
Yeh, D. Y., Cheng, C. H. and Chi, M. L. (2007), "A modified two-tuple FLC model for
evaluating the performance of SCM: By the Six Sigma DMAIC process", Applied
Soft Computing , Vol 7 No. 3, pp. 1027–1034. doi: 10.1016/j.asoc.2006.06.008.

25
.
.
Figure 3.1: Steps of AHP
Define Alternative
Develop Hierarchy
Perform Pairwise
Comparison
Ranking of Alternative
Check
Consistency
CR≤0.1?
No
Yes

26
Fig 3.2: DMAIC Process
Define
Measure
Analyze
Improve
Control
Modify
Design
Redesign
Yes
No
27
Start
Figure 4.1: Proposed Methodology
Step 1: Form Experts’
Group
Step 2: Validate SCPM Criteria
through Demographic Survey
Step 3: Perform Pair-wise
Comparison to Rank SCPM
Criteria
Step 4: Formulate SCPMI
Equation
Step 5: Data Collection
Step 6: Measure SCP
Is SCP
Acceptable?
End Yes
No
Step 7: Performance Analysis and
Improvement using DMAIC
Step 8: Recollection of Data after
Improvement
Step 9: Measure SCP after
Improvement
Performance
Analysis and
Improvement
Phase
Performance
Measurement
Phase
End
28
Fig 4.2 Weight of Major Criteria
Fig 4.3: Weight of Sub criteria (X3) Fig 4.4: Weight of Sub criteria (X4)
Fig 4.5: Weight of Sub criteria (X1) Figure 4.6: Weight of Sub criteria (X2)
0 0.05 0.1 0.15 0.2 0.25 0.3
Manufacturing
Procurement
Warehouse
Logistics
Customer Satistaction
Financial Ratios
Weight of Major Criteria
0 0.1 0.2 0.3
Ontime delivery to…
Freight cost
Ontime delivery
Delayed shipment rate
Backorder rate
Claims due to…
Sub Criteria (Logistics)
0 0.1 0.2 0.3
Order fulfillemnt rate
Inventory turns/year
Reconciliation error
Inventory aging
Damages
Overtime
Sub Criteria (Warehouse)
0 0.1 0.2 0.3 0.4 0.5
Cycle Time
Rejection Rate
Machine Downtime
Overtime
Sub Criteria (Manufacturing)
0 0.1 0.2 0.3 0.4
Ontime order received
Procurement Cost
Ordering cost
Lot rejection rate
Delay in receiving order
Sub Criteria (Procurement)
29
Fig 4.7: Weight of Sub criteria (X6) Fig 4.8: Weight of Sub criteria (X5)
Figure 4.9: SCP of Case Company
0 0.1 0.2 0.3 0.4 0.5
Order fill rate
Meet promised date
Back order rate
Correct delivery rate
Sub Criteria (Customer
Satisfaction)
83.45% 79.93% 82.88% 81.97%
0.0%
10.0%
20.0%
30.0%
40.0%
50.0%
60.0%
70.0%
80.0%
90.0%
100.0%
May June July August
0 0.2 0.4 0.6
Earning before interest
and tax
Cost of goods sold
Sub Criteria (Financial Ratios)
Average Performance = 82%

30
Fig. 4.10: Data of Part – A (LH)
4.11: Data of Part – A (RH)
70.00%
75.00%
80.00%
85.00%
90.00%
95.00%
100.00%
1 3 5 7 9 11 13 15 17 19 21 23 25 27 29 31 33 35 37 39
Items Acceptance
Number of Samples
70.00%
75.00%
80.00%
85.00%
90.00%
95.00%
100.00%
1 3 5 7 9 11 13 15 17 19 21 23 25 27 29 31 33 35 37 39
Items Acceptance
Number of Samples
Acc
ura
cy L
evel
in
Ter
ms
of
%
Acc
ura
cy L
evel
in
Ter
ms
of
%

31
4.12: Part - A (LH) Rejection
Fig 4.13: Part - A (RH) Rejection
82%
18%
Part - A (LH) Rejection
Parts Accepted (%)
Parts Rejected (%)
86%
14%
Part - A (RH) Rejection
Parts Accepted (%)
Parts Rejected (%)
32
Fig 4.14: Histogram (RH)
Fig 4.15: Histogram Combined (RH)

33
Fig 4.16: Histogram (LH)
Fig 4.17: Histogram (LH)
34
Figure 4.18: Pareto Chart (LH)
Fig 4.19: Pareto Chart (RH)
35
Fig: 4.20: Fishbone Diagram for rejection of part
Fig 4.21: Fishbone Diagram for poor dies condition
36
Fig 4.22: Part - A Rejection rate (overall)
Fig 4.23: Improved Performance of Case Company
92%
8%
Part Rejection
Parts Accepted (%)
Parts Rejected (%)
83.45% 79.93% 82.88% 81.97% 83.81% 83.80% 83.85% 83.83%
0.0%
10.0%
20.0%
30.0%
40.0%
50.0%
60.0%
70.0%
80.0%
90.0%
100.0%
May June July August Sep Oct Nov Dec
Avg. Performance before
Improvement = 82% Avg. Performance after
Improvement = 83.82%
37
Table 4.1 SCPM framework (criteria and their sub-criteria)
No. SCPM Criteria and Sub-criteria References Short Description
1 Manufacturing (X1)
Su
b-c
rite
ria
X11 Manufacturing lead time
Gunasekaran et al. (2004)
Gaudenzi & Borghesi (2006)
Bhagwat & Sharma (2007)
Chang, Wysk & Wang
(2006)
“Timeframe between the arrival time of material used for
product development and product completion time”
X12 Rejection rate “The percentage of processed parts that are rejected for a
fixed period of time or lot of pieces”
X13 Machine downtime “Time of a factory or a machinery not in operation as a
result of a malfunction or inoperative”
X14 Overtime rate “Time required to fulfill a task beyond the allocated time”
2 Purchasing/Procurement (X2)
Su
b-c
rite
ria
X21 Order receiving on time
Shepherd & Günter (2011)
Bhagwat & Sharma (2007)
Kaplan & Norton (1992)
Gunasekaran et al. (2004)
Supply Chain Council
(2012)
“No. of orders received within the lead time”
X22 Purchasing cost “The direct and in direct cost associated in purchasing”
X23 Ordering cost “Cost associated with issuing the purchase order”
X24 Lot rejection rate “Percentage of items received from customer not meeting
specification”
X25 Late deliveries “No. of orders that are received beyond the required time”
3 Warehousing (X3)
Su
b-c
rite
ria
X31 Order fulfillment rate
(warehousing)
Gunasekaran et al. (2004)
Supply Chain Council
(2012)
Gaudenzi & Borghesi (2006) Beamon (1999)
“A combination of delivery reliability and order
completeness (warehouse perspective)”
X32 Reconciliation error “The difference in inventory between actual and in
system”
X33 Inventory turns “Number of times a company sells and replaces its
inventory within a given period”
X34 Inventory aging “Inventory not utilized for a long period of time”
X35 Damages in warehouse
“Damage products during handling and not able to
deliver”
X36 Overtime in warehouse “Time required to fulfill the task in a warehouse beyond
the allocated time”
4 Logistics/Transportation (X4)
Su
b-c
rite
ria X41
Freight cost/unit Gaudenzi & Borghesi (2006)
Shepherd & Günter (2011)
Gunasekaran et al. (2004)
“Transportation cost that are incurred for delivering goods
from warehouse to customers”
X42 Damages during
transportation
“Damaged inventory (raw or finished goods) during
transportation”
38
X43 On time delivery Gunasekaran et al. (2001)
“Percentage of order that are/can delivered on time
without any damage from warehouse to customer”
X44 Delayed shipment rate “Delay in delivery due to transporter”
X45 Back order rate (logistic) “No. of orders that cannot be delivered due to
unavailability of raw material or finish good”
X46 Claims due to wrong deliver “Complain from customers due to miss handling or
products not as per specifications”
5 Customer Satisfaction/Service Level
(X5)
Su
b-c
rite
ria
X51 Order fill rate (customer) Closs, Nyaga, & Voss,
(2010)
Ouyang & Chuang,(2001)
Huang, Sheoran, &
Keskar(2005)
“A combination of delivery reliability and order
completeness (customer perspective)”
X52 Back order rate (customers) “No. of orders that cannot be delivered due to
unavailability of raw material or finish good”
X53 Meeting deadlines “Orders delivered on time”
X54 Correct delivery rate “Orders delivered to customer as per specification”
6 Financial Measure/Financial Ratio
(X6)
Su
b-c
rite
ria X61
Earnings before interest and
tax (EBIT) Goldstein, Ju, & Leland
(2001)
Poston & Grabski (2001)
Eljelly, (2004)
“Indicator of a company’s profitability, calculated as
revenue minus expenses, excluding tax and interest. EBIT
= Revenue – Operating Expenses”
X62 Cost of goods sold “Cost of final products includes financial cost, direct and
indirect cost, overtime, manufacturing cost, profit etc.”
Source: Put together from Dweiri and Khan (2012)

39
Table 4.2: Data of Case Company
Major Criteria Sub-Criteria May June July Aug
Manufacturing
Manufacturing or process cycle
time or production lead time =
actual / standard lead time
X11 0.77 0.57 0.67 0.69
Rejection rate (%) (defects)
X12 0.84 0.84 0.84 0.91
Machine downtime due to
maintenance/unavailability of
raw material
X13 0.77 0.76 0.67 0.69
Overtime rate (%) X14 0.55 0.36 0.488 0.47
Purchasing
On time order receive (%) = no.
of orders received on time /
total orders due
X21 0.91 0.94 0.98 0.97
Procurement cost ($) (%) =
current / last cost of
procurement
X22 0.15 0.21 0.33 0.26
Ordering cost
X23 0.26 0.12 0.36 0.21
Lot rejection rate (due to wrong
delivery etc.)
X24 0.84 0.84 0.84 0.91
Delay in receiving order
X25 0.79 0.89 0.96 0.89
Warehouse
Order fulfilment rate (%) for
the warehouse = order
delivered to internal customer /
total order received
X31 0.99 0.94 1.00 0.91
Inventory turns / year (%) =
current / last inventory turns
X32 0.84 0.86 0.91 0.92
Reconciliation error (difference
between actual and inventory
system quantity) (%)
X33 0.07 0.02 0.03 0.1
Inventory aging (%)
X34 0.60 0.70 0.49 0.66
Damages (%)
X35 0.90 0.80 0.91 0.77
Overtime (%)
X36 0.45 0.36 0.30 0.60
Logistics On time delivery (to customer)
(%) = order delivered on time / X41 0.97 0.91 0.81 0.86
40
total order handled by
transporter
Delayed Shipment rate X42 0.79 0.65 0.57 0.59
Freight Cost ($./unit) = current
/ last freight cost /unit
X43 0.93 1.00 0.91 1.00
On time delivery (%)
X44 0.77 0.74 0.88 0.89
Backorder rate (% or in terms
of no. of order)
X45 0.88 0.88 0.87 0.86
Claims due to transportation
(damages or delay) ($ value or
%)
X46 1.00 0.90 0.91 0.96
Customer
Satisfaction
Order fill rate (%) = no. of
orders fulfil / no. of orders
received
X51 0.99 0.91 0.98 0.91
Meet promised date (%)
X52 0.94 0.84 0.88 0.81
Backorder rate (%)
X53 0.90 0.88 0.84 0.848
Correct delivery rate (%) =
order delivered on time / total
orders received by customer
X54 0.83 0.80 0.99 0.91
Financial Ratio
Earnings before interest and tax
(EBIT) = current / last revenue
X61 0.97 0.91 0.94 0.95
Cost of goods sold (COGS) =
current / last cost of products
X62 1.00 0.99 0.93 0.92
Table 4.3: Data for Process Improvement
Cycle Time 0.261
Rejection Rate 0.451
Machine Downtime 0.169
Overtime 0.119
41
Table 4.4: Defect and Cause
No. Defect Cause Remedies
1 Burr collection at
draw die
Thickness of the
component
Polish the draw die and punch.
Use good lubricants. For
every three strokes remove the
burr on the draw
2 Thinning
Clearance is insufficient,
improper radius on punch
& die, drawing speed is
more
Appropriate clearance is
required on each draw in
punch & die, check the radius
on draw die & punch and
reduce the drawing
3 Cracking
Insufficient clearance,
lubrication problems.
Insufficient draw radius
on punch & die. Drawing
speed is more.
Appropriated clearance is
required on each draw, used
good lubricants,
Check the radius on punch &
die reduce the drawing speed
& check the reduction ratio.
4 Spring back
During bending, after
bending pressure is
released, the elastic
stresses remain in the
bend area causes slight
decrease in the bend
angle (spring back).
Lesser angle is provided than
the required angles.
5 Notching edge pull-
up
Due to excessive cutting
clearance between the
punch & stripper plate.
Welding is done to stripper
plate and
maintained the clearance
between the punch and
stripper plate
6 Pitch variation Due to more clearance in
Strip guides
Fitted the pilot and maintained
the pilot dimensions
accurately
7 Dent mark on
blanked component
Burr on lower surface of
the floating stripper plate
Spotting is done throughout
the floating stripper plate
(Blue
matching)
8 Strip is sticking to
the blanking punch
Less stripping force due
to
short length of
polyurethane rubber
New more length
polyurethane rubbers add in
between floating
stripper plate and support
plate
9 Slug was jammed in
piercing die blocks
Less draft in piercing die
Blocks
Increased the draft angle of
the piercing die blocks
10 Tight strip
movement
Clearance in strip guide
not correct
Clearance provided as per
requirement