Article The wider context of performance analysis and it ...
Upload
tristan-wiggillCategory
view
29download
0
Supply Chain Collaboration in a wider context:
The role of government and the railway
Jan Havenga
Department of Logistics
Stellenbosch University

Logistics costs as a % of GDP – a 12 year time series

South Africa’s logistics costs in perspective

Logistics cost components tracked over time

South Africa’s freight profile….
Current freight
Future freight

South Africa’s freight demand
What does it say about how we manage freight
transport?
I’ve not seen a single transport indicator, where South
Africa is lower than world average

Demand side
• Reshoring (trade reduction)
• Lower choice
• Consumption at source
• Recycling at source
• 3D printing
Supply side
• More efficient trucking
• Drivetrain
• Fuel
• Driving habits
• More efficient logistics
• Scheduling
• Visibility and collaboration
• Lower empty haul
• Modal shift
Solutions

Tonne-kilometers by mode and typology

Rail friendly freight – The case for corridors
• Natal economic corridor
• Natal rail friendly corridor
We estimate that between 40 and 60% of corridor
freight is rail friendly
• Cape economic corridor
• Cape rail friendly corridor
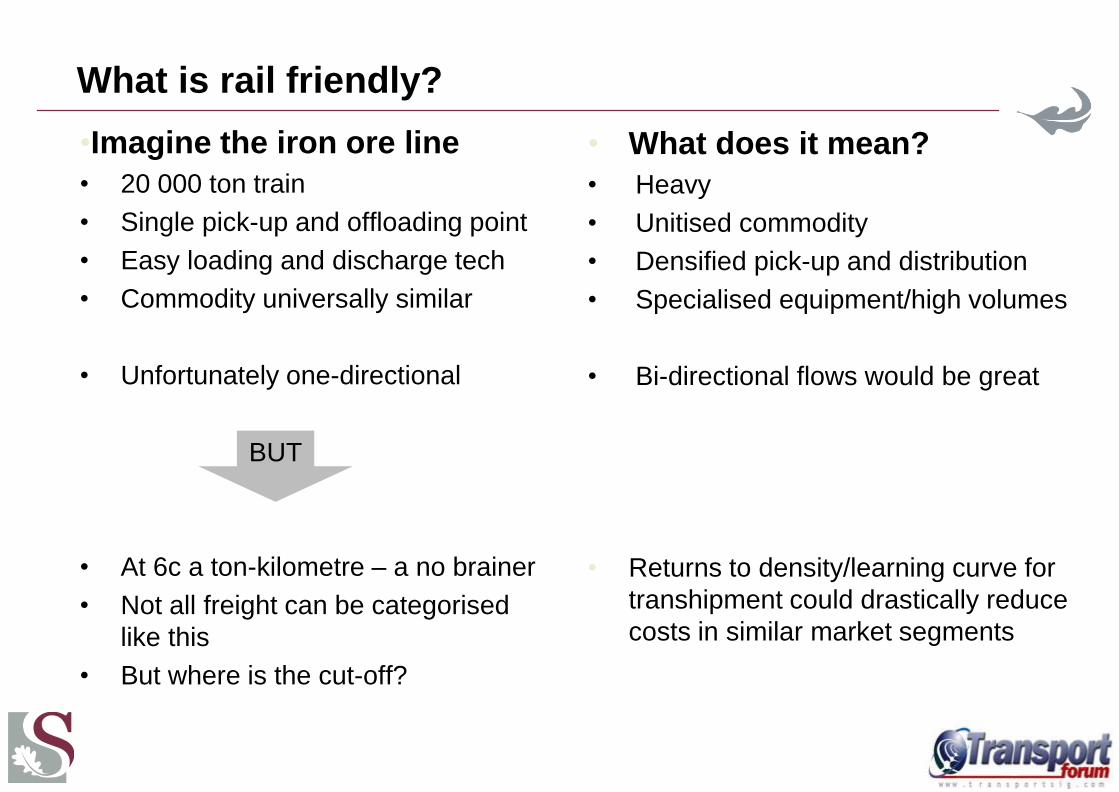
•Imagine the iron ore line
• 20 000 ton train
• Single pick-up and offloading point
• Easy loading and discharge tech
• Commodity universally similar
• Unfortunately one-directional
• At 6c a ton-kilometre – a no brainer
• Not all freight can be categorised
like this
• But where is the cut-off?
• What does it mean?
• Heavy
• Unitised commodity
• Densified pick-up and distribution
• Specialised equipment/high volumes
• Bi-directional flows would be great
• Returns to density/learning curve for
transhipment could drastically reduce
costs in similar market segments
What is rail friendly?
BUT

Heavy intermodal fits the bill
• And that includes domestic intermodal
• But how large is this freight segmet?l
• Average is 700 TEU train
• Experiments with 1 200 TEU ongoing

Searching for ∆
∆
Co
st
0 d* d Distance
Intermodal
Road-only
Intermodal*

What informs ∆
• Volume and average travel distance
for different logistics systems
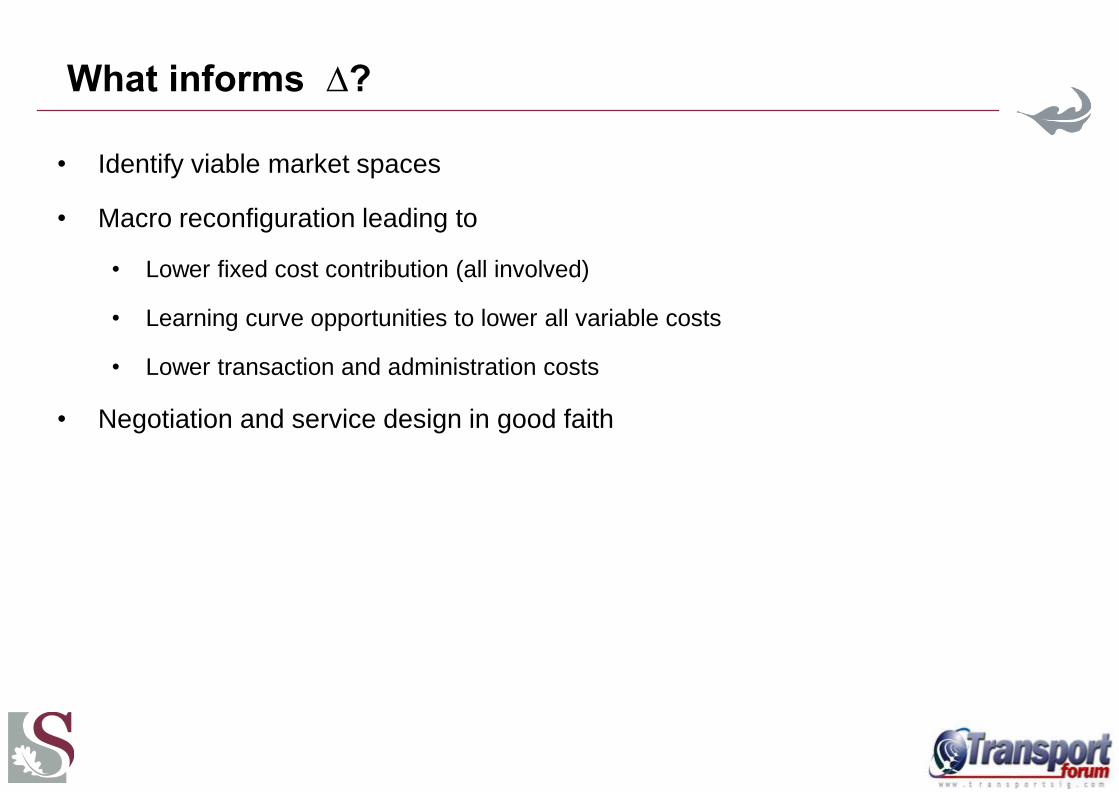
What informs ∆?
• Identify viable market spaces
• Macro reconfiguration leading to
• Lower fixed cost contribution (all involved)
• Learning curve opportunities to lower all variable costs
• Lower transaction and administration costs
• Negotiation and service design in good faith

The typical FMCG long distance supply chain has
natural “catchment” areas
DC DC
M R
M R
DC DC
M R
M R
DC DC
M R
M R
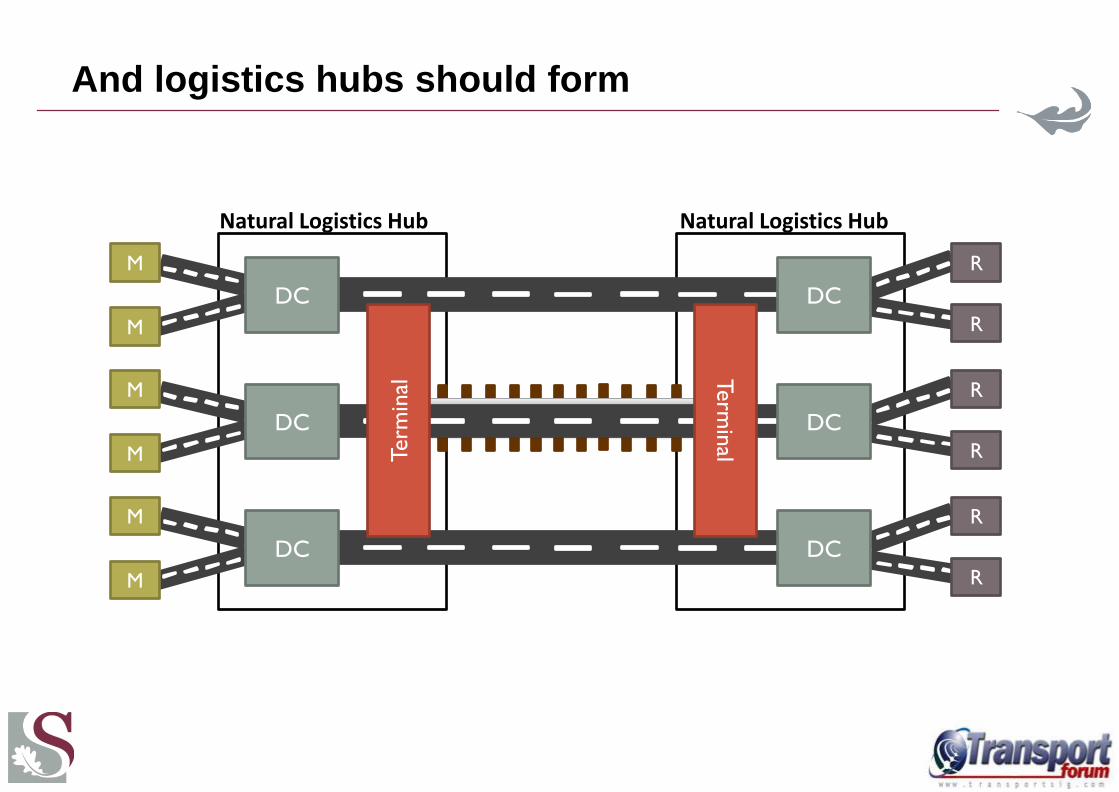
And logistics hubs should form
DC DC
M R
M R
DC DC
M R
M R
DC DC
M R
M R
Term
inal
Term
inal
Natural Logistics Hub Natural Logistics Hub

We’re stuck with this version of FMCG heavy haul…
17
Source: Rapport, 31 July 2011
Is this a train?
Definitely not effective. This can be done cheaper

Collaboration – 4 spheres
• Freight owners
• Logistics service providers
• Railway
• Regulator
18

19
Government 1. Framework for PPP 2. Internalise externalities 3. Industrialisation without industry
engagement impossible 4. Centre of Excellence
Railway 1. Lower contribution to fixed cost (initially
none?) 2. Visibility (Cost and Cargo) 3. Leaning curve assumptions 4. Lower overheads and transaction cost
LSP’s 1. Change fixed cost and overhead
assumptions 2. Visibility 3. Learning curve assumptions 4. Accept change in risk / return profile
Freight owners 1. Environmental accounting 2. Lower transaction costs 3. Outsourcing 4. Change purchasing habits 5. Choice?