Supply Base Report: Osula Graanul OÜ
29
Supply Base Report: Osula Graanul OÜ Third Surveillance Audit www.sbp-cert.org
Transcript of Supply Base Report: Osula Graanul OÜ

Supply Base Report: Osula Graanul OÜ
Third Surveillance Audit
www.sbp-cert.org

Focusing on sustainable sourcing solutions
Supply Base Report: Osula Graanul OÜ, Third Surveillance Audit Page ii
Completed in accordance with the Supply Base Report Template Version 1.3
For further information on the SBP Framework and to view the full set of documentation see www.sbp-cert.org
Document history
Version 1.0: published 26 March 2015
Version 1.1 published 22 February 2016
Version 1.2 published 23 June 2016
Version 1.3 published 14 January 2019
© Copyright The Sustainable Biomass Program Limited 2019

Focusing on sustainable sourcing solutions
Supply Base Report: Osula Graanul OÜ, Third Surveillance Audit Page iii
Contents 1 Overview ................................................................................................................................................ 1
2 Description of the Supply Base ........................................................................................................... 2
2.1 General description ................................................................................................................................. 2
2.2 Actions taken to promote certification amongst feedstock suppliers .................................................... 10
2.3 Final harvest sampling programme ...................................................................................................... 11
2.4 Flow diagram of feedstock inputs showing feedstock type [optional] ................................................... 11
2.5 Quantification of the Supply Base ......................................................................................................... 11
3 Requirement for a Supply Base Evaluation ..................................................................................... 13
4 Supply Base Evaluation ..................................................................................................................... 14
4.1 Scope .................................................................................................................................................... 14
4.2 Justification ........................................................................................................................................... 14
4.3 Results of Risk Assessment ................................................................................................................. 14
4.4 Results of Supplier Verification Programme ......................................................................................... 15
4.5 Conclusion ............................................................................................................................................ 15
5 Supply Base Evaluation Process ...................................................................................................... 16
6 Stakeholder Consultation .................................................................................................................. 17
6.1 Response to stakeholder comments .................................................................................................... 17
7 Overview of Initial Assessment of Risk ............................................................................................ 18
8 Supplier Verification Programme ...................................................................................................... 19
8.1 Description of the Supplier Verification Programme ............................................................................. 19
8.2 Site visits ............................................................................................................................................... 19
8.3 Conclusions from the Supplier Verification Programme ....................................................................... 19
9 Mitigation Measures ........................................................................................................................... 20
9.1 Mitigation measures .............................................................................................................................. 20
9.2 Monitoring and outcomes ..................................................................................................................... 21
10 Detailed Findings for Indicators ........................................................................................................ 22
11 Review of Report ................................................................................................................................ 23
11.1 Peer review ........................................................................................................................................... 23
11.2 Public or additional reviews .................................................................................................................. 23
12 Approval of Report ............................................................................................................................. 24

Focusing on sustainable sourcing solutions
Supply Base Report: Osula Graanul OÜ, Third Surveillance Audit Page iv
13 Updates ................................................................................................................................................ 25
13.1 Significant changes in the Supply Base ................................................................................................ 25
13.2 Effectiveness of previous mitigation measures ..................................................................................... 25
13.3 New risk ratings and mitigation measures ............................................................................................ 25
13.4 Actual figures for feedstock over the previous 12 months .................................................................... 25
13.5 Projected figures for feedstock over the next 12 months ...................................................................... 25

Focusing on sustainable sourcing solutions
Supply Base Report: Osula Graanul OÜ, Third Surveillance Audit Page 1
1 Overview Producer name: Osula Graanul OÜ
Producer location: Varese, 66642 Võru maakond, Estonia
(Head Office – Humala 2, 10617 Tallinn, Estonia)
Geographic position: 57°52'28.7"N 26°47'42.7"E
Primary contact: Mihkel Jugaste, Head of Quality and Certification Systems, +372 5519000 [email protected]
Company website: www.graanulinvest.com
Date report finalised: 26/Oct/2019
Reference period: 1/Oct/2018-30/Sep/2019
Close of last CB audit: 5-10/Nov/2019
Name of CB: NEPCon Estonia
Translations from English: Yes
SBP Standard(s) used: Standard 1 version 1.0; Standard 2 version 1.0; Standard 4 version 1.0; Standard 5 version 1.0,
Weblink to Standard(s) used: https://sbp-cert.org/documents/standards-documents/standards
SBP Endorsed Regional Risk Assessment: https://sbp-cert.org/documents/risk-assessments/estonia
Weblink to SBE on Company website: http://www.graanulinvest.ee/eng/environment/SBR
Indicate how the current evaluation fits within the cycle of Supply Base Evaluations
Main (Initial) Evaluation
First Surveillance
Second Surveillance
Third Surveillance
Fourth Surveillance
☐ ☐ ☐ x ☐
Focusing on sustainable sourcing solutions
Supply Base Report: Osula Graanul OÜ, Third Surveillance Audit Page 2
2 Description of the Supply Base
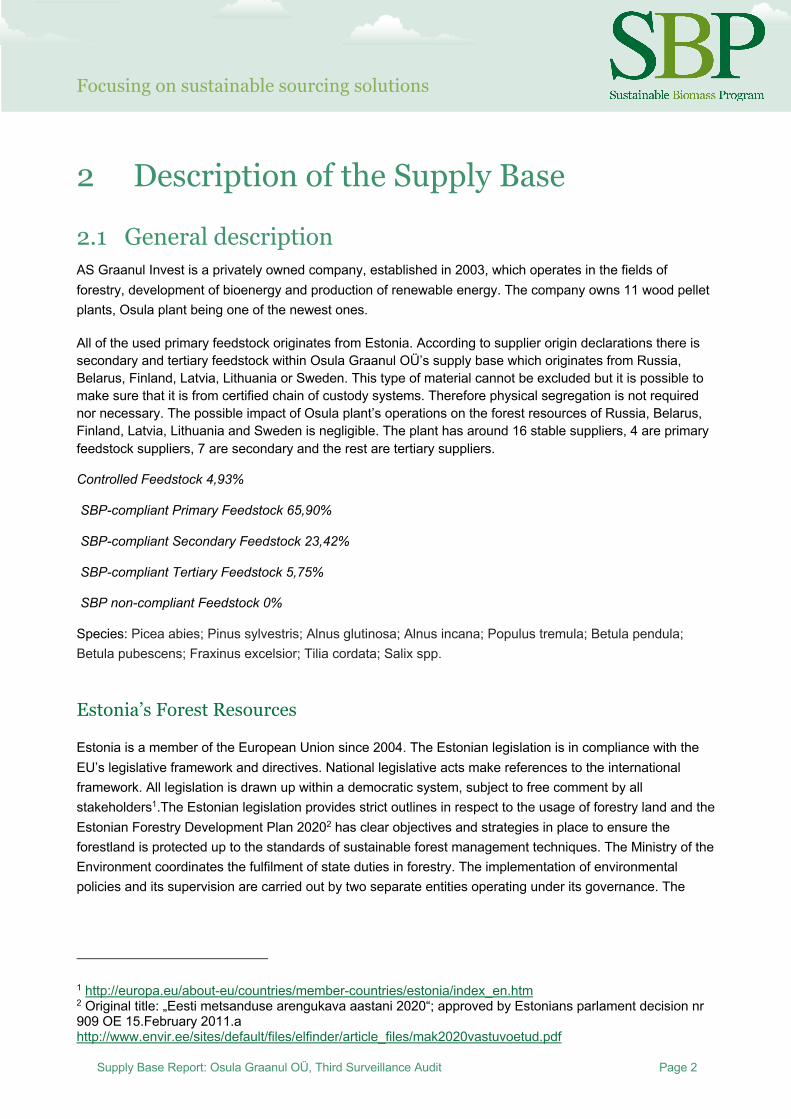
2.1 General description AS Graanul Invest is a privately owned company, established in 2003, which operates in the fields of forestry, development of bioenergy and production of renewable energy. The company owns 11 wood pellet plants, Osula plant being one of the newest ones.
All of the used primary feedstock originates from Estonia. According to supplier origin declarations there is secondary and tertiary feedstock within Osula Graanul OÜ’s supply base which originates from Russia, Belarus, Finland, Latvia, Lithuania or Sweden. This type of material cannot be excluded but it is possible to make sure that it is from certified chain of custody systems. Therefore physical segregation is not required nor necessary. The possible impact of Osula plant’s operations on the forest resources of Russia, Belarus, Finland, Latvia, Lithuania and Sweden is negligible. The plant has around 16 stable suppliers, 4 are primary feedstock suppliers, 7 are secondary and the rest are tertiary suppliers.
Controlled Feedstock 4,93%
SBP-compliant Primary Feedstock 65,90%
SBP-compliant Secondary Feedstock 23,42%
SBP-compliant Tertiary Feedstock 5,75%
SBP non-compliant Feedstock 0%
Species: Picea abies; Pinus sylvestris; Alnus glutinosa; Alnus incana; Populus tremula; Betula pendula; Betula pubescens; Fraxinus excelsior; Tilia cordata; Salix spp.
Estonia’s Forest Resources
Estonia is a member of the European Union since 2004. The Estonian legislation is in compliance with the EU’s legislative framework and directives. National legislative acts make references to the international framework. All legislation is drawn up within a democratic system, subject to free comment by all stakeholders1.The Estonian legislation provides strict outlines in respect to the usage of forestry land and the Estonian Forestry Development Plan 20202 has clear objectives and strategies in place to ensure the forestland is protected up to the standards of sustainable forest management techniques. The Ministry of the Environment coordinates the fulfilment of state duties in forestry. The implementation of environmental policies and its supervision are carried out by two separate entities operating under its governance. The
1 http://europa.eu/about-eu/countries/member-countries/estonia/index_en.htm 2 Original title: „Eesti metsanduse arengukava aastani 2020“; approved by Estonians parlament decision nr 909 OE 15.February 2011.a http://www.envir.ee/sites/default/files/elfinder/article_files/mak2020vastuvoetud.pdf

Focusing on sustainable sourcing solutions
Supply Base Report: Osula Graanul OÜ, Third Surveillance Audit Page 3
Estonian Environmental Board monitors all of the work carried out in Estonia’s forests whereas the Environmental Inspectorate exercises supervision in all areas of environmental protection.
The forest is defined in the Forest Act. There are three main forest categories described in this legislation: commercial forests, protection forests and protected forests. According to the ownership, forests are also divided into private forests, municipality forests and state owned forests. The state owned forest represent approximately 40% of the total forest area3 and are certified according to FSC and PEFC forest management and chain of custody standards in which the indicators related to forest management planning, maps and availability of forest inventory records are being constantly evaluated and addressed4. The state forest is managed by State Forest Management Centre (RMK) which is a profit-making state agency founded on the basis of the Forest Act and its main duty lies in a sustainable and efficient management of state forest.
Currently more than 2 230 000 ha, equal to 51% of the Estonian land territory, is covered by forest as indicated in Figure 1 and the share of forest land is growing. According to FAO data, during 2000 - 2005, average annual change in the forest cover was +0.4 %5. Forestry Development Plan 2012-2020 and Yearbook Forest 2014, that gives annual reports and facts about the forest in Estonia, state that during last decade the cutting rate in Estonian forests is from 7 to 11 mill m³ per year6. The amount is in line with sustainable development principle when the cutting rate doesn’t exceed the annual increment and gives the potential to meet the long-term economic, social and environmental needs. According to the Forestry Development Plan 2012-2020 the sustainable cutting rate is 12-15 mil ha per year.
Figure 1. Forest cover of Estonia (FAO: http://www.fao.org/forestry/country/en/est/).
3 http://www.rmk.ee/organisation/operating-areas 4 http://www.rmk.ee/organisation/environmental-policy-of-rmk/certificates 5 http://www.fao.org/forestry/country/32185/en/est/ 6 Yearbook Forest 2014 (all key figures, graphs and tables are bilingual)
Focusing on sustainable sourcing solutions
Supply Base Report: Osula Graanul OÜ, Third Surveillance Audit Page 4
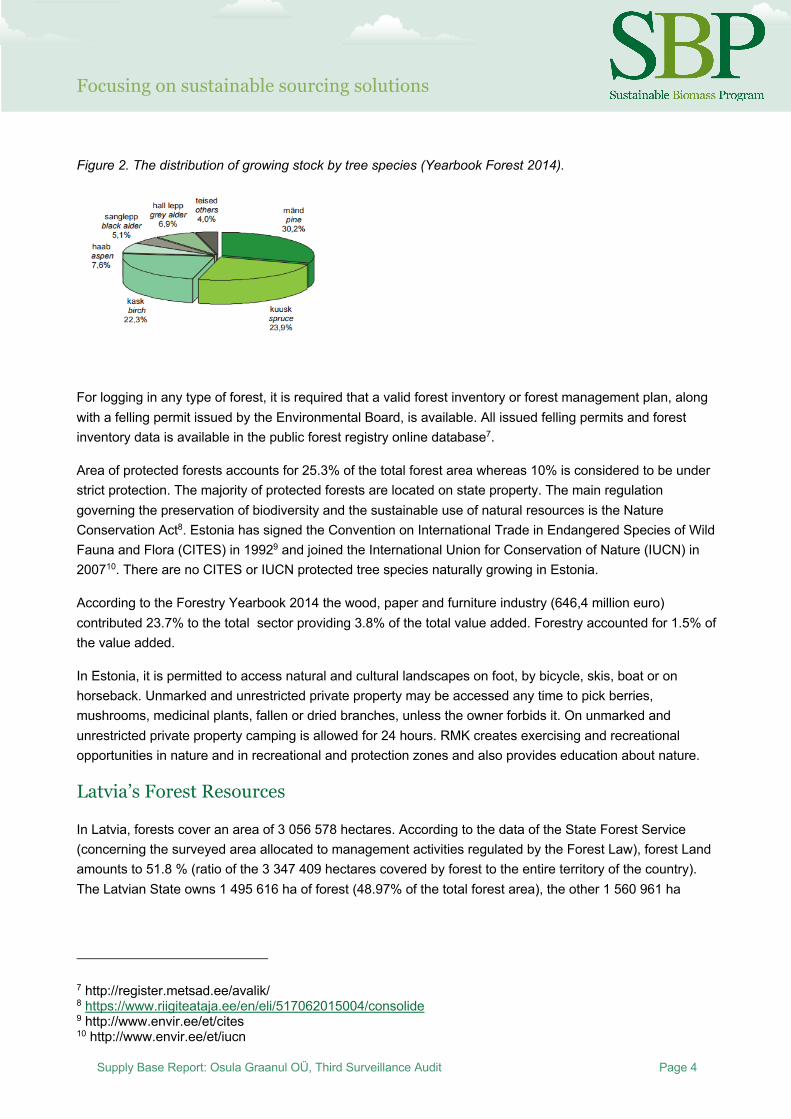
Figure 2. The distribution of growing stock by tree species (Yearbook Forest 2014).
For logging in any type of forest, it is required that a valid forest inventory or forest management plan, along with a felling permit issued by the Environmental Board, is available. All issued felling permits and forest inventory data is available in the public forest registry online database7.
Area of protected forests accounts for 25.3% of the total forest area whereas 10% is considered to be under strict protection. The majority of protected forests are located on state property. The main regulation governing the preservation of biodiversity and the sustainable use of natural resources is the Nature Conservation Act8. Estonia has signed the Convention on International Trade in Endangered Species of Wild Fauna and Flora (CITES) in 19929 and joined the International Union for Conservation of Nature (IUCN) in 200710. There are no CITES or IUCN protected tree species naturally growing in Estonia.
According to the Forestry Yearbook 2014 the wood, paper and furniture industry (646,4 million euro) contributed 23.7% to the total sector providing 3.8% of the total value added. Forestry accounted for 1.5% of the value added.
In Estonia, it is permitted to access natural and cultural landscapes on foot, by bicycle, skis, boat or on horseback. Unmarked and unrestricted private property may be accessed any time to pick berries, mushrooms, medicinal plants, fallen or dried branches, unless the owner forbids it. On unmarked and unrestricted private property camping is allowed for 24 hours. RMK creates exercising and recreational opportunities in nature and in recreational and protection zones and also provides education about nature.
Latvia’s Forest Resources
In Latvia, forests cover an area of 3 056 578 hectares. According to the data of the State Forest Service (concerning the surveyed area allocated to management activities regulated by the Forest Law), forest Land amounts to 51.8 % (ratio of the 3 347 409 hectares covered by forest to the entire territory of the country). The Latvian State owns 1 495 616 ha of forest (48.97% of the total forest area), the other 1 560 961 ha
7 http://register.metsad.ee/avalik/ 8 https://www.riigiteataja.ee/en/eli/517062015004/consolide 9 http://www.envir.ee/et/cites 10 http://www.envir.ee/et/iucn

Focusing on sustainable sourcing solutions
Supply Base Report: Osula Graanul OÜ, Third Surveillance Audit Page 5
(51.68 % of the total forest area) belongs to private sector owners. Private forest owners in Latvia amount to approximately 144 thousand.
The area covered by forest is increasing. The expansion happens both naturally and by afforestation of infertile land unsuitable for agriculture. Within the last decade, the timber production in Latvia has fluctuated between 9 and 13 million cubic meters (State Forest Services: vmd.gov.lv, 2015).
Forest land consists of: • forests 3 056 578 ha (91.3%); • marshes 175 111.8 ha (5.3%); • glades (forest meadows) 35 446.7 ha (1.1%); • flooded areas 18 453.2 ha (0,5%); • objects of infrastructure 61 813.4 ha (1.8%). State Forest Services: vmd.gov.lv, 2015.
Distribution of forests by the dominant species: • pine 34.3 %; • spruce 18.0 %; • birch 30.8 %; • black alder 3.0 %; • grey alder 7.4 %: • aspen 5.4 %; • oak 0.3 %; • ash 0.5 %: • other species 0.3 %. State Forest Services: vmd.gov.lv, 2015.
Share of species used in reforestation, by planting area (2014): • pine 20 %; • spruce 17 %; • birch 28 %; • grey alder 12 %; • aspen 20 %; • other species 3 %. State Forest Services: vmd.gov.lv, 2015.
Timber production by types of cuts, by volume produced (2014): • final cuts 81.00 %; • thinning 12.57 %; • sanitary clear-cuts 3.63 %; • sanitary selective cuts 1.43 %; • deforestation cuts 0.76 %; • other types of cuts 0.06 %.

Focusing on sustainable sourcing solutions
Supply Base Report: Osula Graanul OÜ, Third Surveillance Audit Page 6
State Forest Services: vmd.gov.lv, 2015.
In Latvia, the field of forestry is supervised by the Ministry of Agriculture, which in cooperation with stakeholders of the sphere develops forest policy, development strategy of the field, as well as drafts of legislative acts concerning forest management, use of forest resources, nature protection and hunting (www.zm.gov.lv). Implementation of requirements of the national law and regulations notwithstanding the type of tenure is carried out by the State Forest Service under the Ministry of Agriculture (State Forest Services: www.vmd.gov.lv). Management of the state-owned forests is performed by the Joint Stock Company “Latvia’s State Forests”, established in 1999. The enterprise ensures implementation of the best interests of the state by preserving value of the forest and increasing the share of forest in the national economy (www.lvm.lv). Export yielded 1.978 billion euro (approx. 20 % of the total amount in 2014).
Historically, extensive use of forests as a source of profit began later than in many other European countries, therefore a greater biological diversity has been preserved in Latvia. For the sake of conservation of natural values, a total number of 674 protected areas have been established. Part of the areas have been included in the European network of protected areas Natura 2000. Most of the protected areas are state-owned. In order to protect highly endangered species and biotopes located without the designated protected areas, if a functional zone does not provide that, micro-reserves are established. According to data of the State Forest Service (2015), the total area of micro reserves is 40 595 ha. Identification and protection planning of biologically valuable forest stands is carried out continuously. Latvia has been a signatory of the CITES Convention since 1997. CITES requirements are respected in forest management, although there are no species included in the CITES lists in Latvia.
Areas where recreation is one of the main forest management objectives add up to 8 % of the total forest area or 293 000 ha (2012y). Observation towers, educational trails, natural objects of culture history value, picnic venues: they are just a few of recreational infrastructure objects available to everyone free of charge. Special attention is devoted to creation of such areas in state-owned forests. Recreational forest areas include national parks (excluding strictly protected areas), nature parks, protected landscape areas, protected dendrological objects, protected geological and geomorphologic objects, nature parks of local significance, the Baltic Sea dune protection zone, protective zones around cities and towns, forests within
administrative territory of cities and towns. Management and governance of specially protected natural areas in Latvia is co-ordinated by the Nature Conservation Agency under the Ministry for Environmental Protection and Regional Development.
Finnish forest resources
Finland is Europe's most heavily forested country, with over 3/4 of the land area representing 23 million hectares, under forest cover. Altogether forestry land accounts for 86% of the land area.
There are four coniferous species native to Finland, and over twenty species of deciduous trees. The most common species, which are also economically most significant, are Scots pine (Pinus sylvestris), Norway spruce (Picea abies), and silver and downy birch (Betula pendula and Betula pubescens).
Despite the 13% reduction in forest area in 1944 due to the losses of land in the war, Finland's wood resources are currently more plentiful than in the pre-war years. According to the 1st national forest inventory

Focusing on sustainable sourcing solutions
Supply Base Report: Osula Graanul OÜ, Third Surveillance Audit Page 7
(1921–1924), the total growing stock volume was 1 588 million m³. The latest estimate, based on the 11th inventory, is 2 332 million m³ (103 m³/ha) with annual growth of 105 million m³ (4,6 m³/ha).
As in the majority of Western European countries, non-industrial forest ownership dominates in Finland. Private persons, ordinary Finnish citizens, own about 60% of all the forestry land. The Government owns 25%, forest industries 10%, and municipalities and parishes 5% of the Finnish forested area.
Finnish forestry is based on the management of native tree species. The management of forests seeks to respect their natural growth and mimic the natural cycle of boreal forests. The objective is to secure the production of high-quality timber, and to preserve the biological diversity of forests as well as the preconditions for the multiple use of forest. Currently, about 120 000 hectares of forest land are planted or seeded annually favouring almost exclusively native tree species.
Today forestry and the forest industry make up about 5% of Finland's gross domestic product, and approximately 20% of Finnish exports. High-quality printing and writing paper make up over 40% of the total export value of forest industry products, while sawn goods and wood-based panels account for some 20% of export value.
http://www.metla.fi/suomen-metsat/index-en.htm
Swedish forest resources
Sweden is the third largest country by area in Europe, and 70% of it is forest. The total area of forest land is 28 million hectares.
Swedish forests are primarily boreal. The total standing volume is about 3 000 million m3, of which 41% is spruce/whitewood (Picea abies), also called Norwegian spruce, and 40% pine/redwood (Pinus sylvestris), also called Scots pine. 18% is birch and 6% consists of other deciduous trees.
50% of Sweden’s forests are owned by private individuals, 25% by large forest companies and 25% by the state and other public organizations. A major part of the mountain forest is state-owned. The average size of a privately owned forest is roughly 50 hectares. In total, there are about 350 000 private forest owners in Sweden, of whom 70% live on their properties.
Annual growth is about 120 million m3 and annual felling is around 80 million m3. Each year the volume of standing timber increases by around 40 million m3 (net annual increment).
The forest products industry plays a major role in the Swedish economy, and accounts for between nine and 12 percent of Swedish industry’s total employment, exports, sales and added value. It includes companies within the pulp and paper industry, as well as the wood-mechanical industry. Close to 90 percent of paper and pulp production is exported, and the corresponding figure for sawn-wood products is almost 75 percent.
http://www.svenskttra.se/siteassets/6-om-oss/publikationer/pdfer/swedish-forestry.pdf
Focusing on sustainable sourcing solutions
Supply Base Report: Osula Graanul OÜ, Third Surveillance Audit Page 8
Russian forest resources
Twenty two percent of all forest land mass and 25 % of the world’s wood reserves belong to Russia but its share in the world forest products trade is below 4 percent. Forests take up 69% of all land and the area occupied with forests amounts to 1,183.3 million out of which 885 million ha is forest land. This is owned and managed by the state.
Most Russian forests are boreal. Predominant forest tree species are the larch, pine, spruce, Siberian pine, oak, beech, birch, and aspen. According to the 2010 forest account, the total growing stock of the forest estate is 83 billion m3.The country average growing stock of mature and overmature stands (without shrubs) is 132 m3 /ha. The mean annual increment in volume is rather low in Russia: it is no more than 1.23 m3 per hectare of forested land.
The annual allowable cut for 2010 was 633 million m3, including 61 million m3 for protection forests and 573 million m3 for production forests. The greatest allowable cut is set for coniferous forests (128 million m3). The actual cut is below 28% of the allowable cut.
Wood biomass for energy use will double, increasing from 32 million cubic metres (2011) to 75 million cubic metres (2033). The national market will be the prime consumer of this biofuel. Limited export only is foreseen for pellets and will originate from those regions with the necessary transportation and economic conditions.
By the end of 2011, 30 million hectares of Russian forests had been certified under the Forest Stewardship Council (FSC) scheme. A much smaller area (177 000 hectares) was certified under the Programme for the Endorsement of Forest Certification (PEFC). At present, Russia ranks second after Canada for area of certified forests. Certified forests represent 26 percent of all Russian forest leased for logging. The average growth rate of certified forests is about 2.7 million hectares per year.
http://www.fao.org/docrep/016/i3020e/i3020e00.pdf “THE RUSSIAN FEDERATION FOREST SECTOR: OUTLOOK STUDY TO 2030”
Belarus forest resources
In Belarus forests cover area of 9,5 milj hectares. According to the data of the State Forest Ministry Woodenness amounts to 39,3 % Forest industry input into IKP is 1,1%; The area covered by forest is increasing. The expansion happens both naturally and by afforestation of infertile land unsuitable for agriculture. Within the last decade, the timber production in Belarus has fluctuated aprox., 11 million cubic metres (http://www.mlh.by , 2015.)
Forest land consists of: Area (1000 hectares) Forest 7,894; Other wooded land 914; Forest and other wooded land 8,808; Other land 11,94;
Total land area 20,748; Inland water bodies 12; Total area of country 20,76
Source: http://www.mlh.by , 2015.
Distribution of forests by the dominant species: • pine 50,4%; • spruce 9,2%; • birch 23,1%; • black alder 3,3%; • grey alder 3,3 %: • aspen 2,1%; • other species 3,3%.

Focusing on sustainable sourcing solutions
Supply Base Report: Osula Graanul OÜ, Third Surveillance Audit Page 9
Source: http://www.mlh.by , 2015.
Timber production by types of cuts, by volume produced (2013): • final cuts 34,5 %; • thinning 45,79 %; • other types of cuts 19,62 %. Source: http://www.mlh.by,
Biological diversity
Belarus has been a signatory of the CITES Convention since 1995. CITES requirements are respected in forest management, although there are no species included in the CITES lists in Belarus. Forest regeneration is carried out annually over an area of 32,000 ha, including 81% of the forest planting planting and seeding and 19% by natural regeneration. http://belstat.gov.by/ (2015.y.) There are 2 strictly protected Nation reserves and 4 National parks present in Belarus at the moment. Area of National reserves accounts 2,98 milj ha and area of National parks is 3,98 milj ha.
Forest and community
In 2014 in all kinds of felling there were harvested 12,5 million m3 marketable timber. Foreign trade surplus made USD 104 million. 1.9 million cubic meter round timber and 191.8 thousand cubic meter sawn timber were sold abroad. Forest products and services were exported to 25 states, including 95,3% to the near abroad and 4,7% to the remote countries. Among the main forest export directions are Poland (47,9% of the total export volume in value terms), Germany (11,4%), Lithuania (10%), Latvia (8,62%), the Netherlands (3,3%), Belgium (3,46%), Sweden (3,25%).
All forest area is certified by PEFC certification scheme.
Lithuania Forest Resources
Agricultural land covers more than 50 percent of Lithuania. Forested land consists of about 28 percent, with 2,18 million ha, while land classified as forest corresponds to about 30 percent of the total land area. The south-eastern part of the country is most heavily forested, and here forests cover about 45 percent of the land. The total land area under the state Forest Enterprises is divided into forest and non-forest land. Forest land is divided into forested and non-forested land. The total value added in the forest sector (including manufacture of furniture) reached LTL 4.9 billion in 2013 and was 10% higher than in 2012.
Forest land is divided into four protection classes: reserves (2 %); ecological (5.8 %): protected (14.9 %); and commercial (77.3 %). In reserves all types of cuttings are prohibited. In national parks, clear cuttings are prohibited while thinnings and sanitary cuttings are allowed. Clear cutting is permitted, however, with certain restrictions, in protected forests; and thinnings as well. In commercial forests, there are almost no restrictions as to harvesting methods.
Lithuania has been a signatory of the CITES Convention since 2001. CITES requirements are respected in forest management, although there are no species included in the CITES lists in Lithuania.
Lithuania is situated within the so-called mixed forest belt with a high percentage of broadleaves and mixed conifer-broadleaved stands. Most of the forests - especially spruce and birch - often grow in mixed stands. Pine forest is the most common forest type, covering about 38 percent of the forest area. Spruce and birch account for about 24 and 20 percent respectively. Alder forests make up about l2 percent of the forest area, which is fairly high, and indicates the moisture quantity of the sites. Oak and ash can each be found on about 2 percent of the forest area. The area occupied by aspen stands is close to 3 percent.

Focusing on sustainable sourcing solutions
Supply Base Report: Osula Graanul OÜ, Third Surveillance Audit Page 10
The growing stock given as standing volume per hectare is on the average of l80 m3 in Lithuania. In nature stands, the average growing stock in all Lithuanian forests is about 244 m3 per hectare. Total annual growth comes to 11 900 000 m3 and the mean timber increment has reached 6.3 m3 per year and per hectare.
Current harvest has reached some 3.0 million m3 u.b. per year. The consumption of industrial wood in the domestic forest industry, including export of industrial wood, is estimated to be less than 2.0 million m3. The remainder is used for fuel or stored in the forests, with a deteriorating quality as a result.
The potential future annual cut is calculated at 5.2 million m3, of which 2.4 million m3 is made up of sawn timber and the remaining 2.8 million m3 of small dimension wood for pulp or board production, or for fuel. The figures refer to the nearest 10-year period. Thereafter a successive increase should be possible if more intensive and efficient forest management systems are introduced.
Certification of all state forests in Lithuania is done according to the strictest certification in the world – the FSC (Forest Stewardship Council) certificate. The audit of this certificate testifies to the fact that Lithuanian state forests are managed especially well – following the principles of the requirements set to protection of and an increase in biological diversity.
http://www.fao.org/docrep/w3722E/w3722e22.htm
2.2 Actions taken to promote certification amongst feedstock suppliers
In order to increase transparency in the supply chain and to reach near 100% certification levels inside the organisation, from 1st of January 2016 Graanul Invest AS started to purchase only certified feedstock. “FSC Controlled Wood” and “PEFC Controlled Sources” (controlled feedstock) were set as the minimum sustainability requirements in supplier contracts. Non-compliant feedstock is rejected at the pellet plant with zero tolerance. This initiated a certification race amongst feedstock suppliers and lead to a 35% increase in Osula’s feedstock certification levels. Since beginning of 2016 Graanul Invest has 0% of “legal-only” material (including material used for heating). This step also increased the certified feedstock levels of other BP’s who source from the same suppliers. The above mentioned changes in supplier contracts also included a section about Woodland Key Habitats. Graanul Invest provided clear guidelines on how feedstock suppliers could minimise the risks related with possible sourcing from WKH’s and only signed contracts with suppliers who implemented the WKH risk mitigation measures. These guidelines reached over 30 feedstock supplying companies in Estonia and were introduced together with a brief overview about SBP certification scheme. In addition Graanul Invest arranged a SBP seminar for all its’ suppliers to further promote and explain the scope and background of the certificate as well as the requirements for GHG data collection, feedstock origin evidence and WKH risk mitigation procedures. This event had 57 participants from 27 different feedstock supplying companies. The seminar was carried out by SBP accredited auditors. From 1st of January 2017 Osula Graanul only accepts SBP compliant feedstock from all suppliers. This means that all production and output in 2017 is 100% compliant.

Focusing on sustainable sourcing solutions
Supply Base Report: Osula Graanul OÜ, Third Surveillance Audit Page 11
2.3 Final harvest sampling programme This analysis and reporting is the responsibility of the Estonian Environmental Agency which is controlled by the Estonian Ministry of the Environment. They collect the final harvest data from the state forest and private forest owners. The statistics are published annually in “Yearbook Forest”. According to the most recent Yearbook Forest 2014 fuelwood accounted for 15% of total roundwood sales. Link to the latest yearbook: http://www.keskkonnaagentuur.ee/sites/default/files/aastaraamat_mets_2014_loplik.pdf
2.4 Flow diagram of feedstock inputs showing feedstock type [optional]
Option was not chosen.
2.5 Quantification of the Supply Base Supply Base a. Total Supply Base area (ha): Estonia 2,23 mln; Latvia 3,05 mln; Finland 1,24 mln; Sweden 12,59 mln;
Russia 885 mln.; Belarus 7,894 mln., Lithuania 2,18 Total: ca 915 mln ha b. Tenure by type (ha): Estonia and Latvia 2,65 mln state forests; 2,63 mln private forests, Russia 885 mln
state forests; Belarus 7,894 mln ha state forests, Lithuania 1,526 mln state and 0,654 mln private (for Sweden and Finland the exact distribution is not known but using the countries’ statistical averages the total split for the countries is 10,8 mln private forests and 4,7 mln state forests.)
c. Forest by type (ha): boreal ca 915 mln d. Forest by management type (ha): ca 915 mln managed semi-natural e. Certified forest by scheme (ha): FSC 69,273 mln; PEFC 26 mln f. Number of suppliers: 16
Feedstock Note: ranges area used so that the numbers would be valid before and after the stakeholder consultation and also because reporting specific numbers would provide confidential information about our performance indicators and recipes.
g. Total volume of Feedstock: >1,000, 000 m3 h. Volume of primary feedstock: >1,000, 000 m3 i. List percentage of primary feedstock (g),
Subdivide by SBP-approved Forest Management Schemes: - Certified to an SBP-approved Forest Management Scheme (45,03%) - Not certified to an SBP-approved Forest Management Scheme (54,97% FSC CW, PEFC CS)
j. List all species in primary feedstock, including scientific name: Picea abies; Pinus sylvestris; Alnus glutinosa; Alnus incana; Populus tremula; Betula pendula; Betula pubescens; Fraxinus excelsior; Tilia cordata; Salix spp.
k. Volume of primary feedstock from primary forest: 0%

Focusing on sustainable sourcing solutions
Supply Base Report: Osula Graanul OÜ, Third Surveillance Audit Page 12
l. List percentage of primary feedstock from primary forest (j), by the following categories. Subdivide by SBP-approved Forest Management Schemes: N/A
m. Volume of secondary feedstock: 600 000 – 800 000 m3 Majority is chips ca 20% and about 9% is sawdust.
n. Volume of tertiary feedstock: 0 – 200 000 m3
Focusing on sustainable sourcing solutions
Supply Base Report: Osula Graanul OÜ, Third Surveillance Audit Page 13
3 Requirement for a Supply Base Evaluation
SBE completed SBE not completed
X ☐
OÜ Osula Graanul pellet plant is only purchasing certified feedstock and is rapidly increasing their forest management certified feedstock levels. All raw material used is already approximately 50% certified and therefore SBP-compliant. Since Estonia has strict forest management laws and AS Graanul Invest has thorough control over their suppliers, there is no doubt that the controlled feedstock is traceable and low risk and therefore also SBP-compliant. A high % of SBP-certified pellets would allow more flexibility for storage and sales.
The SBE was added to the SBP scope in order to make sure that all feedstock used at Osula could be used as SBP-compliant. The current SBE was carried out as a sub-scope to only evaluate controlled feedstock that originates from Estonia.
Since Osula’s controlled wood supply base is strictly within Estonia’s boarders the SBP endorsed regional risk assessment for Estonia is fully applicable and an additional risk assessment is not required.
AS Graanul Invest as well as OÜ Osula Graanul acknowledge and follow the risk assessment report dated 22.04.2016 and found here: https://sbp-cert.org/documents/risk-assessments/estonia

Focusing on sustainable sourcing solutions
Supply Base Report: Osula Graanul OÜ, Third Surveillance Audit Page 14
4 Supply Base Evaluation
4.1 Scope The SBE was initiated to evaluate the feedstock sold to OÜ Osula Graanul pellet plant under the claim “FSC Controlled Wood” or “PEFC Controlled Sources”. The used feedstock and supplier evaluation procedures (also referred to as “mitigation measures” or “GI approach”) were designed to determine whether the feedstock and the documentation provided by the supplier was/is sufficient to prove that the feedstock was not cut from a WKH (only “specified” risk in the SBP endorsed regional risk assessment for Estonia 22.04.2016; indicator 2.1.2) and does not originate from outside of Estonia - the SBE. The evaluation covers both primary and secondary feedstock including all species. These evaluation procedures are a part on risk mitigation measures for feedstock within SBE (explained in chapter 9. of this report).
• Primary feedstock “FSC Controlled Wood” and “PEFC Controlled Sources” – wood origin documentation maintained throughout the supply chain from the felling site to the biomass producer. WKH risk mitigation procedures in place within the supply chain with credible evidence. This is monitored and controlled by pellet plant staff before the feedstock is allowed to enter the plant territory.
• Secondary feedstock “FSC Controlled Wood” and “PEFC Controlled Sources” –wood origin documentation maintained throughout the supply chain from the felling site to the biomass producer. WKH risk mitigation procedures in place within the supply chain with credible evidence. This is/the supplier is audited once every 12 month by the Head of Quality and Certification Systems.
4.2 Justification As mentioned before, AS Graanul Invest as well as OÜ Osula Graanul fully acknowledge and follow the SBP endorsed regional risk assessment for Estonia (22.04.2016) which is in compliance with SBP standards 1 and 2. All stakeholders and interested parties were consulted and involved in the process of putting together the risk assessment for Estonia.
AS Graanul Invest is confident that a GI approach for SBE based on the findings of the regional risk assessment is the most reliable way to evaluate controlled feedstock in Osula pellet plant.
4.3 Results of Risk Assessment The only specified risk identified in the SBP endorsed risk assessment for Estonia is indicator 2.1.2: “Potential threats to forests and other areas with high conservation values from forest management activities are identified and addressed.
In Estonia, legislation covers all aspects of this indicator. According to the Estonian legislation protection of Woodland Key Habitat (WKH) is optional for private forest owners. Private forest owners can sign a contract with the state and protect WKH. In which case the state pays compensation to the owner. If a private forest owner does not want to protect WKH then the owner is allowed to cut it. It is possible to determine the location of WKH from the Public Forest Registry and where felling permits are issued it is possible to see if

Focusing on sustainable sourcing solutions
Supply Base Report: Osula Graanul OÜ, Third Surveillance Audit Page 15
the material is cut from WKH. In cases where fellings are carried out without a felling permit (small scale sanitary cutting is allowed without a felling permit) then an on-site visit is only way to see if the WKH is untouched or not. In state forest, FSC or PEFC-certified private forest, and in private forests where a WKH contract has been signed, WKH are protected.”
Like explained throughout this report the WKH related risk in the only specified risk that requires additional mitigation measures from the whole supply chain. All other indicators in the SBP endorsed risk assessment for Estonia are marked as low risk and are not directly addressed in Osula plant’s SBE.
4.4 Results of Supplier Verification Programme OÜ Osuka Graanul pellet plant did not carry out a supplier verification program as defined in the SBP standard 2. The already implemented mitigation measures for the feedstock supply chain are sufficient to minimise the risk explained in chapter 4.3 of this report. These mitigation measures (further explained in chapter 9.) were developed specifically to address the risk area highlighted in the regional risk assessment as “specified risk” (indicator 2.1.2) and are also approved as internal FSC and PEFC procedures. By mitigating the only “specified” risk related to feedstock AS Graanul Invest can conclude that the feedstock entering Osula plant is low risk and therefore SBP-compliant. A supplier verification program might be introduced once the SBE is extended beyond Estonia’s boarders or the regional risk assessment is changed.
4.5 Conclusion Based on the SBP endorsed regional risk assessment for Estonia, there is only one specified risk area in Estonia – indicator 2.1.2 referring to potential threats from forest management activities to areas with high conservation value. In case of Estonia the potential threats to Woodland Key Habitats (WKHs).
Controlled feedstock within Osula plant’s SBE is only low risk and SBP-compliant IF the mitigation measures have been applied. Once a feedstock supplier is listed in the GI suppliers’ list they have proven that their wood origin documentation is maintained throughout the supply chain from the felling site to the biomass producer. Their WKH risk mitigation procedures are in place within the supply chain with credible evidence. They are either already been audited or have agreed to go through an audit once every 12 months. The GI suppliers list is updated every 3 months and all controlled feedstock, coming from listed/approved suppliers, is considered low risk and SBP-compliant.
The main strength of this SBE is that it extends throughout the supply chain until the felling site. It allows different procedures and accepts different evidence as long as the defined risk is minimised. The only possible weakness is that in theory a supplier can fake documentation to meet the requirements until the audit cycle reaches them. This is unheard of and impossible to benefit from but theoretically possible.

Focusing on sustainable sourcing solutions
Supply Base Report: Osula Graanul OÜ, Third Surveillance Audit Page 16
5 Supply Base Evaluation Process The SBE scope was decided based on OÜ Osula Graanul’s feedstock profile. After assessing the existing controlled feedstock suppliers and SBP-compliant material demand the preliminary suppliers list was put together. These suppliers were approached and informed about SBP and the WKH risk mitigation requirements. The suppliers who expressed readiness to implement the mitigation measures were further consulted and provided with guidelines on how to move forward with the WKH risk mitigation measures and documentation requirements. The suppliers who rejected the changes were removed from the GI suppliers’ list and no longer supplied feedstock to OÜ Osula Graanul pellet plant.
After 3 months the approved suppliers within the SBE were asked to provide a description about how they have implemented the mitigation measures into their internal procedures. What kind of evidence are they prepared to provide and how do they control their sub-suppliers. This feedback was evaluated by AS Graanul Invest central office and necessary changes or improvements were recommended to the suppliers. The suppliers with effective procedures and credible evidence were invited to sign a contract extension committing to continue the mitigation procedures and provide necessary evidence whenever AS Graanul Invest asks.
To further train the suppliers AS Graanul Invest arranged a training seminar for their suppliers. The seminar focused on the WKH risk mitigation procedures and the evidence that suppliers have to record. Attending the seminar was also a precondition for suppliers to qualify for the GI Suppliers List. The seminar had 57 participants from 27 different feedstock suppliers.
AS Graanul Invest audits all suppliers within the SBE at least once every 12 months. The order of the audits is not random but starts with suppliers with highest volumes of controlled feedstock. If the feedstock volumes between suppliers are equal the supplier with higher proportion of secondary feedstock is audited before.
The SBE and the related procedures were developed and carried out by AS Graanul Invest central office personnel. The work group includes: CEO, COO, OÜ Osula Graanul’s Production Manager, Head of Quality and Certification Systems, Biomass Purchasing Manager and the Head of Forestry. Consultations were held with feedstock suppliers, pellet plants from neighbouring countries, forest owners, forest harvesters, certification bodies and SBP.

Focusing on sustainable sourcing solutions
Supply Base Report: Osula Graanul OÜ, Third Surveillance Audit Page 17
6 Stakeholder Consultation 21.12.2016 this SBR was published for stakeholder consultation. In addition to publishing the report on the company’s webpage it was sent to the following key stakeholders: Estonian Private Forests’ Union, Estonian University of Life Sciences, Estonian Renewable Energy Association, Estonian Council of Environmental NGOs, Estonian Nature Fund, Stockholm Environmental Institute Tallinn, Estonian Green Movement, Foundation Private Forest Centre, Estonian Timber, FSC Estonia, PEFC Estonia.
6.1 Response to stakeholder comments No written comments received.

Focusing on sustainable sourcing solutions
Supply Base Report: Osula Graanul OÜ, Third Surveillance Audit Page 18
7 Overview of Initial Assessment of Risk The only specified risk identified in the SBP endorsed risk assessment for Estonia is indicator 2.1.2: “Potential threats to forests and other areas with high conservation values from forest management activities are identified and addressed.”
Refer to point 4.3 for more detail.
Table 1. Overview of results from the risk assessment of all Indicators (prior to SVP)
Indicator Initial Risk Rating
Indicator Initial Risk Rating
Specified Low Unspecified Specified Low Unspecified
1.1.1 X 2.3.1 X
1.1.2 X 2.3.2 X
1.1.3 X 2.3.3 X
1.2.1 X 2.4.1 X
1.3.1 X 2.4.2 X
1.4.1 X 2.4.3 X
1.5.1 X 2.5.1 X
1.6.1 X 2.5.2 X
2.1.1 X 2.6.1 X
2.1.2 X 2.7.1 X
2.1.3 X 2.7.2 X
2.2.1 X 2.7.3 X
2.2.2 X 2.7.4 X
2.2.3 X 2.7.5 X
2.2.4 X 2.8.1 X
2.2.5 X 2.9.1 X
2.2.6 X 2.9.2 X
2.2.7 X 2.10.1 X
2.2.8 X
2.2.9 X

Focusing on sustainable sourcing solutions
Supply Base Report: Osula Graanul OÜ, Third Surveillance Audit Page 19
8 Supplier Verification Programme
8.1 Description of the Supplier Verification Programme OÜ Osula Graanul pellet plant did not carry out a supplier verification program as defined in the SBP standard 2. The already implemented mitigation measures for the feedstock supply chain are sufficient to minimise the risk explained in chapter 4.3 of this report. These mitigation measures (further explained in chapter 9.) were developed specifically to address the risk area highlighted in the regional risk assessment as “specified risk” (indicator 2.1.2) and are also approved as internal FSC and PEFC procedures. By mitigating the only “specified” risk related to feedstock AS Graanul Invest can conclude that the feedstock entering Osula plant is low risk and therefore SBP-compliant. A supplier verification program might be introduced once the SBE is extended beyond Estonia’s boarders or the regional risk assessment is changed.
8.2 Site visits N/A
8.3 Conclusions from the Supplier Verification Programme N/A.

Focusing on sustainable sourcing solutions
Supply Base Report: Osula Graanul OÜ, Third Surveillance Audit Page 20
9 Mitigation Measures
9.1 Mitigation measures Below is explained the whole cycle of feedstock flow through AS Graanul Invest direct and indirect mitigation measures “GI approach”.
1) Every feedstock delivery has to have a delivery note with feedstock type, weight/volume, certification claim and code. The format and content have to be according to FSC and PEFC standards. This is examined by pellet plant personnel before the delivery is allowed through the gate.
2) The GI Suppliers List consist of the companies who are approved by central office and are allowed to deliver feedstock to Osula’s pellet plant. The list is updated every 3 months and a supplier only qualifies for the list if: a.They have a valid certificate visible in the certification scheme’s online database. b.The certificate includes the feedstock types they supply. c.They source their controlled feedstock from inside Estonia’s borders, inside the SBE. d.They have expressed readiness to implement the mitigation measures and provide evidence.

Focusing on sustainable sourcing solutions
Supply Base Report: Osula Graanul OÜ, Third Surveillance Audit Page 21
e.They have signed a contract with AS Graanul Invest which included the WKH risk mitigation measures appendix. f.In case they are not a contractual supplier they must have received the WKH risk mitigation measures’ guidelines from AS Graanul Invest. g.They must have attended the AS Graanul Invest suppliers training seminar (registration was recorded). If one of the conditions from “d”,”e”,”f” or “g” is not met then the supplier only qualifies for the GI Suppliers List if they have been audited by AS Graanul Invest central office and approved. The conditions “a”,”b” and “c” have zero tolerance and not meeting them automatically disqualifies the supplier.
3) If the feedstock is forest management certified then it is SBP-compliant. The accepted certification claims are FSC 100%, FSC Mix Credit or 100% PEFC Certified Material.
4) If the feedstock is controlled feedstock then the harvesting site information has to be shown on the documentation. Controlled feedstock is defined as feedstock with certification claims “FSC Controlled Wood” and “FSC Controlled Sources”.
5) If controlled feedstock does not have the harvesting site information in the delivery documentation then the feedstock can only be accepted if the supplier has been audited by AS Graanul Invest central office and approved. Audited and approved suppliers are marked as “AUDITED” in the suppliers list. This possibility exists because some feedstock suppliers have a WKH risk mitigation measure in place but do not segregate material for their clients. Therefore the risk is low but the exact harvesting site is not known. This system is accepted but has to be audited before.
6) If the controlled feedstock documentation includes the harvesting site information then the site is examined by Osula pellet plant personnel, from the Environmental Agency’s WKH database or Forest Registry’s WKH map. If the harvesting site does not have a WKH on it the material can be accepted as SBP-compliant.
7) SBP-compliant material is allowed to enter the pellet plant territory and is stored according to the plant’s storage plan. The compliant material is recorded according to its’ quality and sustainability characteristics.
8) Whatever the reason for feedstock rejection the pellet plant has to register and report the case to central office. Each case will be reviewed individually and measures will be taken to avoid similar issues in the future.
9.2 Monitoring and outcomes The mitigation measures have been well implemented and all feedstock supplies are according to SBE and SBP requirements. Not a single feedstock shipment has been rejected so far.
Graanul Invest AS has audited all suppliers who are within the SBE scope and has not discovered any non-conformances.
Between 1.10.2018-30.09.2019 no material with WKH risk has entered the pellet plant. There has been 10 cases where the WKH public registry gave an alert for the origin but further inquiries to the environmental agency and visual inspections cleared the timber as low risk and was accepted.
Focusing on sustainable sourcing solutions
Supply Base Report: Osula Graanul OÜ, Third Surveillance Audit Page 22
10 Detailed Findings for Indicators Detailed findings for each Indicator are given in the SBP endorsed regional risk assessment for Estonia dated 22.04.2016 and found here:
https://sbp-cert.org/documents/risk-assessments/estonia

Focusing on sustainable sourcing solutions
Supply Base Report: Osula Graanul OÜ, Third Surveillance Audit Page 23
11 Review of Report
11.1 Peer review This report was reviewed by AS Graanul Invest central office’s top management: CEO, COO, Head of Quality and Certification Systems, Biomass Purchasing Manager and the Head of Forestry.
The SBR was published to all stakeholders and feedback will be provided to whoever expresses interest or concern.
22.12.2016 this SBR was reviewed by Henrik Välja a representative of the Estonian Timber Association.
11.2 Public or additional reviews 21.12.2016 this SBR was published for stakeholder consultation. In addition to publishing the report on the company’s webpage it was sent to the following key stakeholders: Estonian Private Forests’ Union, Estonian University of Life Sciences, Estonian Renewable Energy Association, Estonian Council of Environmental NGOs, Estonian Nature Fund, Stockholm Environmental Institute Tallinn, Estonian Green Movement, Foundation Private Forest Centre, Estonian Timber, FSC Estonia, PEFC Estonia.
No comments received.

Focusing on sustainable sourcing solutions
Supply Base Report: Osula Graanul OÜ, Third Surveillance Audit Page 24
12 Approval of Report
Approval of Supply Base Report by senior management
Report Prepared by:
Mihkel Jugaste Head of Quality and Certification Systems 26.11.2019
Name Title Date
The undersigned persons confirm that I/we are members of the organisation’s senior management and do hereby affirm that the contents of this evaluation report were duly acknowledged by senior management as being accurate prior to approval and finalisation of the report.
Report approved by:
Raul Kirjanen CEO 26.11.2019
Name Title Date

Focusing on sustainable sourcing solutions
Supply Base Report: Osula Graanul OÜ, Third Surveillance Audit Page 25
13 Updates
13.1 Significant changes in the Supply Base 2.1 Supply base description changed to include new countries 2.2 Feedstock split updated. 2.5 Supply base quantification updated
13.2 Effectiveness of previous mitigation measures Graanul Invest has concluded the mitigation measures to be 100% effective and therefore the same measures are continued without changes.
13.3 New risk ratings and mitigation measures NA
13.4 Actual figures for feedstock over the previous 12 months This report included the actual figures because it was updated right at the end of the reference period.
Reason for the volume banding is to prevent the company from publishing commercially sensitive data.
13.5 Projected figures for feedstock over the next 12 months o. Total volume of Feedstock: >1,000, 000 m3 p. Volume of primary feedstock: >1,000, 000 m3 q. List percentage of primary feedstock (g),
Subdivide by SBP-approved Forest Management Schemes: - Certified to an SBP-approved Forest Management Scheme (50%) - Not certified to an SBP-approved Forest Management Scheme (50% FSC CW, PEFC CS)
r. Volume of secondary feedstock: 600 000 – 800 000 m3 s. Volume of tertiary feedstock: 0 – 200 000 m3
Reason for the volume banding is to prevent the company from publishing commercially sensitive data.