Supply and Demand of Natural Graphite
36
43 Information Center of the Ministry of Natural Resources (ICMNR)
Transcript of Supply and Demand of Natural Graphite
43
Information Center of the Ministry of Natural Resources (ICMNR)
The BGR (Federal Institute for Geosciences and Natural Resources)
to the Federal Ministry for Economic Affairs and Energy (BMWi).
Editors: German Mineral Resources Agency (DERA) at the Federal Institute for Geosciences and Natural Resources (BGR) Wilhelmstrasse 25 – 30 13593 Berlin, Germany Ph: +49 30 36993 226 [email protected] www.dera.bund.de
Information Centre of Ministry of Natural Resources (ICMNR) 28 Lianhuachi West Road Haidan District 100036 Beijing, China Ph.: +86 010 6388 2125
Authors: Zhou Qizhong (ICMNR)
Layout: deckermedia GbR
Date: July 2020
:
Reference: DAMM, S. ZHOU, Q. (2020):
ISBN: 978-3-948532-10-9 (PDF)ISSN: 2193-5319
Berlin, 2020
Supply and Demand of Natural Graphite
Information Center of the Ministry of Natural Resources (ICMNR)

3Supply and Demand of Natural Graphite
Table of contents
List of figures 4
List of tables 4
Preface 5
Executive summary 6
1 Introduction 7
1.1 Background 7
1.2 Graphite occurrences 8
1.3 Natural graphite reserves and resources 9
1.3.1 Chinese natural graphite reserves and resources 10
1.3.2 European natural graphite reserves and resources 10
1.3.3 Remaining world natural graphite reserves and resources 10
1.4 Mining and beneficiation of natural graphite 11
1.5 Natural graphite applications 13
2 Natural graphite production 15
2.1 Chinese natural graphite mine production 15
2.2 European natural graphite mine production 16
2.3 Remaining world natural graphite mine production 17
3 International trade in natural graphite 20
3.1 Chinese trade in natural graphite 20
3.2 European trade in natural graphite 22
3.3 Remaining world trade in natural graphite 23
4 Natural graphite prices 25
5 Natural graphite consumption 26
5.1 Chinese natural graphite consumption 26
5.2 European natural graphite consumption 26
5.3 Remaining world natural graphite consumption 27
6 Graphite industry outlook 29
6.1 Demand outlook 29
6.2 Supply outlook 30
7 References 31

Supply and Demand of Natural Graphite4
List of figures
Fig. 1: Global graphite supply 7
Fig. 2: Chinese natural graphite reserves and resources 9
Fig. 3: Simplified beneficiation flowsheet for natural graphite 12
Fig. 4: Graphite applications by type 13
Fig. 5: Chinese natural graphite production between 1990 and 2018 15
Fig. 6: European natural graphite production in 2018 16
Fig. 7: Natural graphite production outside China and Europe in 2018 17
Fig. 8: Global natural graphite trade by type and region in 2018 20
Fig. 9: Chinese natural graphite export volumes by type from 2012 to 2018 21
Fig. 10: Chinese natural graphite import volumes by type from 2012 to 2018 21
Fig. 11: European natural graphite imports and their origins 22
Fig. 12: Top European natural graphite importers in 2018 22
Fig. 13: Top natural graphite exporters outside China and Europe in 2018 and their trading partners 23
Fig. 14: Global natural graphite consumption in 2018 by region and application 25
Fig. 15: Chinese natural graphite consumption in 2018 26
Fig. 16: European natural graphite consumption in 2018 28
Fig. 17: Global natural graphite consumption by region in 2018 28
List of tables
Tab. 1: Market terminology and associated flake sizes and purities 8
Tab. 2: Selected European graphite exploration projects and their published reserves and resources 10
Tab. 3: Graphite reserves outside China and Europe 11
Tab. 4: Global natural graphite production in 2018 15
Tab. 5: Apparent consumption of graphite in China for the years 2014 and 2018 27
Tab. 6: Current and future demand for major natural graphite applications 29
Tab. 7: Market demand and future forecast for flake graphite products in China 29
5Supply and Demand of Natural Graphite
Dr. Peter Buchholz
Federal Institute for Geosciences and Natural Resources (BGR)
Dr. Li Xiao-Bo
Information Center of the Ministry of Natural Resources (ICMNR)
Preface
It is with our greatest pleasure to present our latest joint report on the global natural graphite market with a special emphasis on China and Europe.
Natural graphite has many important applications, such as the refractory industry, in foundry applica-tions, in lubricants, in friction materials such as carbon brushes and many others. While graphite has a long-standing use in a range of battery types and applications, it is graphite-based anodes in lithium-ion batteries in particular for the transport sector that are forecast to show the strongest growth rates of all applications over the next decade. China is currently by far the largest producer of natural graphite, fol-lowed by Mozambique, Brazil and India. The vast majority of downstream processing into battery-grade spherical graphite and anode materials is also located in China, highlighting the importance of the country for the battery industry as a whole.
This report is the latest instalment in a series of joint publications on important mineral raw material mar-kets most relevant to the Chinese and European economies. Previous publications included reports on steel, ferroalloys (including manganese, vanadium, chromium and molybdenum), lithium and gallium. The publications are a joint effort of the mineral resources working group between the Information Center of the Ministry of Natural Resources (ICMNR) in Beijing and the Federal Institute for Geosciences and Nat-ural Resources (BGR) in Hannover and its Mineral Resources Agency (DERA) in Berlin. The cooperation is designed as a scientific-technical cooperation project according to the arrangements stipulated in the bilateral agreement signed on June 19, 1979.
For the Sino-German cooperation it is of great benefit to integrate and share knowledge, to increase Ger-many’s and China’s research capacities and to help provide fundamental information to our industries. Finally yet importantly, the cooperation between DERA and the ICMNR also strengthens our long lasting partnership.
Supply and Demand of Natural Graphite6
Executive summary
Graphite is a form of elemental carbon and one of the few elements that occur in nature in its native form. With a high electrical and thermal conductivity, excellent thermal stability and lubricity, graphite combines both metallic and non-metallic properties, making it suitable for a wide range of industrial applications.
The graphite industry is likely to undergo significant market changes in the coming decades, as the boom- ing lithium-ion battery industry is expected to substantially increase demand for graphite. The steel indus- try has traditionally been the main driver for the consumption of natural graphite through its use of refractory products. While global graphite demand is forecast to grow at a rate of approximately 7 % p. a., traditional applications are expected to lose market share to battery applications, where graphite is used as the main anode material. Depending on economic factors such as market penetration and uptake, robust growth for the battery sector is forecast to drive demand, as an increasing number of countries around the world are stepping up their efforts to promote the development and utilisation of renewable energy in a move towards a lower emissions future in the transport and energy sectors. Natural graphite competes with synthetic graphite for market share in battery applications, with the choice of material down to price, availability and customer requirements.
China remains the centre of the graphite industry as the biggest producer, consumer and exporter world- wide. Around 75 % of the global natural graphite production of 1.64m t originated in China in 2018, and the country consumed an estimated 1.02m t. The lithium-ion manufacturing chain is dominated by China, with the majority of processing of natural flake graphite into battery grade for use in the battery sector carried out within the country. China is also the largest manufacturer of anode materials, battery components and lithium-ion batteries.
World mine production of natural graphite is forecast to increase between 6 % and 9 % p. a. over the next few years and should adequately meet increasing global demand. However, China’s dominance as the world’s leading producer could potentially be challenged, as a number of new projects are expected to come online in the medium term. Robust demand growth from the battery sector has led to a flurry of exploration activity around the globe, substantially increasing the global reserves and resources base and potentially adding to future supply from outside China.
Overall graphite supply is deemed sufficient and graphite raw material production is expected to meet future demand. The graphite market is in a state of oversupply and existing capacities for natural graphite exceed current and projected future demand. However, potential shortages and bottlenecks might still arise, in particular across specialty applications, where consumers require very specific precursor materials with respect to carbon content, structure and impurities.
This report aims to give a brief overview of the natural graphite industry and its current supply and demand situation.
7Supply and Demand of Natural Graphite
1 Introduction
This report was compiled as part of the technical cooperation between the Chinese Information Cen-ter of the Ministry of Natural Resources (ICMNR) and the German Federal Institute for Geosciences and Natural Resources (BGR). It aims to give a brief overview of the current global natural graphite industry, with a special focus on China.
The centre of the global graphite industry is in China; the country currently ranks number one in the mining and processing of both natural and synthetic graphite. A projected strong increase in demand from the lithium-ion battery industry has resulted in increased exploration efforts and the development of a range of new natural graphite projects outside of China. Some of these projects have the potential to add to future global supply, but will have to prove that they can compete with current Chinese supply.
The report looks at the current production and consumption of and the global trade in natural
graphite, giving brief overviews of the Chinese and European markets as well as the remaining world.
1.1 Background
Graphite is one of several allotropes of elemen-tal carbon and one of the few elements that occur in nature in its native form. With a high electrical and thermal conductivity, excellent thermal stabil-ity and lubricity, graphite combines both metallic and non-metallic properties, making it suitable for a wide range of industrial applications. The word graphite is derived from the Greek word graphein for writing, reflecting its long-standing use in pen-cils. Today, graphite as an industrial mineral com-modity is used across a wide array of industries such as refractories, foundries, steel-making and automotive as well as specialty applications in the nuclear industry, powder metallurgy, fuel cells and flame retardants.
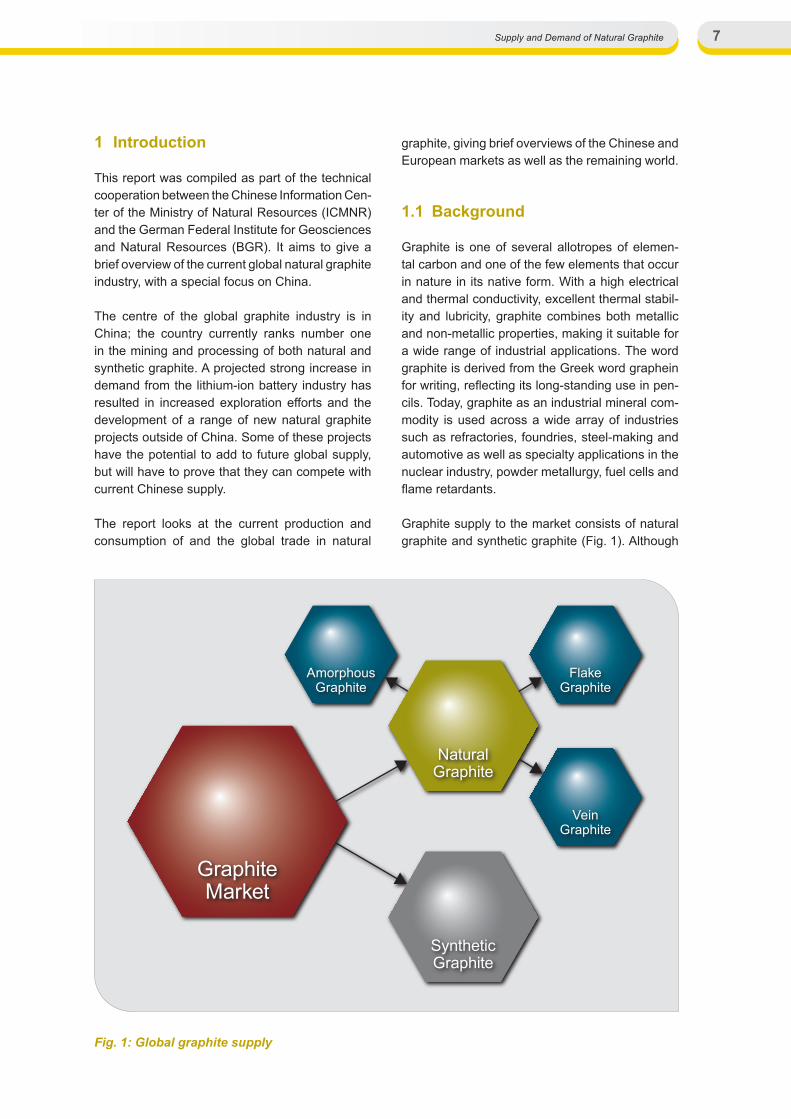
Graphite supply to the market consists of natural graphite and synthetic graphite (Fig. 1). Although
GraphiteMarket
SyntheticGraphite
AmorphousGraphite
FlakeGraphite
VeinGraphite
NaturalGraphite
Fig. 1: Global graphite supply
Supply and Demand of Natural Graphite8
both are called graphite, they are essentially two different commodities with unique properties. Nat-ural and synthetic graphite each have their own applications and generally do not compete for mar-ket share. In applications where both synthetic and natural graphite can be used, the choice of material comes down to customer specifications, availabil-ity and cost. The main markets for natural graph-ite are linked to the steel industry; the largest end use is the refractory industry, accounting for almost half of global consumption. Demand is expected to increase over the coming years, as consumption as anode material in lithium-ion batteries is pro-jected to surge in line with the uptake of electric vehicles and lithium-ion battery applications. In these applications, natural graphite currently com-petes with synthetic graphite for market share, and a mix of both materials in battery applications is common. Understanding the difference between natural and synthetic graphite and their respective characteristics and applications is imperative for the overall understanding of the graphite market.
1.2 Graphite occurrences
Natural graphite occurs in a variety of geologi-cal settings around the globe. Economically via-ble deposits are generally associated with the graphitisation of organic, carbon-rich precursors through metamorphic processes, specifically medium-pressure and medium-to-high tempera-ture metamorphism of organic, carbon-rich precur-sor materials. The grade of metamorphism deter-mines crystallinity, thus allowing classification into three physically distinct deposit types referred to as microcrystalline (also called amorphous), vein (lump or chip), and crystalline (flake) graphite by the graphite industry, the latter two being the most commercially viable (Simandl et al., 2015).
Amorphous graphite deposits, also called cryptocrystalline or microcrystalline graphite, are associated with lower-grade metamorphism (sub-greenschist to greenschist facies), contact metamorphism or regional metamorphism of coal seams. Amorphous graphite deposits vary in grade between 30 and 95 % C, and typically consist of predominantly very fine to fine-grained graphite flakes. The term amorphous is somewhat mislead-ing, as amorphous graphite, despite its name, still exhibits a crystalline structure.
Higher-grade (upper amphibolite to granulite facies) metamorphism creates progressively more crystalline flake and vein graphite deposits.
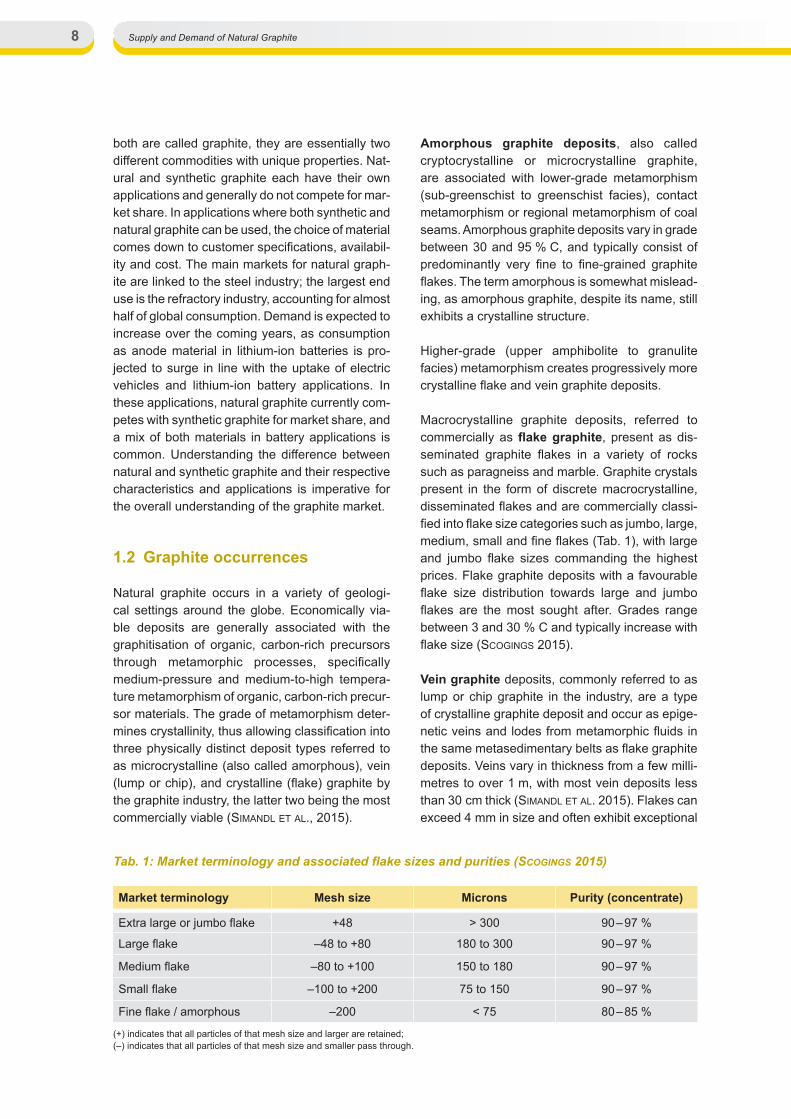
Macrocrystalline graphite deposits, referred to commercially as flake graphite, present as dis-seminated graphite flakes in a variety of rocks such as paragneiss and marble. Graphite crystals present in the form of discrete macrocrystalline, disseminated flakes and are commercially classi-fied into flake size categories such as jumbo, large, medium, small and fine flakes (Tab. 1), with large and jumbo flake sizes commanding the highest prices. Flake graphite deposits with a favourable flake size distribution towards large and jumbo flakes are the most sought after. Grades range between 3 and 30 % C and typically increase with flake size (ScogingS 2015).
Vein graphite deposits, commonly referred to as lump or chip graphite in the industry, are a type of crystalline graphite deposit and occur as epige-netic veins and lodes from metamorphic fluids in the same metasedimentary belts as flake graphite deposits. Veins vary in thickness from a few milli-metres to over 1 m, with most vein deposits less than 30 cm thick (Simandl et al. 2015). Flakes can exceed 4 mm in size and often exhibit exceptional
Tab. 1: Market terminology and associated flake sizes and purities (ScogingS 2015)
Market terminology Mesh size Microns Purity (concentrate)
Extra large or jumbo flake +48 > 300 90 – 97 %
Large flake –48 to +80 180 to 300 90 – 97 %
Medium flake –80 to +100 150 to 180 90 – 97 %
Small flake –100 to +200 75 to 150 90 – 97 %
Fine flake / amorphous –200 < 75 80 – 85 %
(+) indicates that all particles of that mesh size and larger are retained; (–) indicates that all particles of that mesh size and smaller pass through.

9Supply and Demand of Natural Graphite
purities and near-perfect crystals. Grades are typi-cally highest in vein graphite deposits, reaching up to 90 % and more. Sri Lanka is currently the sole commercial source of vein graphite.
In addition to resource tonnage and grade, flake size distribution and purity are considered key attri-butes when assessing the quality of graphite pro-jects and the salability of the product. Purity, in par-ticular, plays a major role in determining whether the end product from a specific deposit is suitable for consumption in high-value applications such as lithium-ion batteries. Typically, the purity of the end product increases with the size of the flakes in a deposit. More often than not, the marketing strate-gies of the respective company depend on the end user they are trying to attract.
1.3 Natural graphite reserves and resources
Global graphite reserves are widely distributed and located on five continents. Total estimates of recoverable graphite reserves amounted to 300m t in 2019; recoverable graphite in inferred resources exceeded 800m t worldwide (USGS 2020).
According to USGS data, Chinese graphite reserves accounted for about 24 % of the world total, a number substantially lower than official Chinese data (see 1.3.1). Despite the Chinese figures including both reserves and resources, the discrepancy is likely due to different reporting standards.
Available figures on graphite resources are largely based on estimates, as graphite deposits, like other industrial mineral commodities, are typically not fully delineated and reported far in advance of development (RobinSon et al. 2017), and resource and reserve estimation for graphite differs from those common for metals. This is particularly true for mineralisation zone-domaining based solely on grade, as it is common for the resource estimation of metals and precious metals. Compositional vari-ations of a graphite resource, in particular concern-ing purity, porosity, crystallinity and particle size, need to be fully understood in order to adequately classify a graphite resource in accordance with reporting codes such as the Australian JORC or the Canadian NI 43-101 code (ScogingS 2015).
0
50
100
150
200
250
300
350
400
450
500
2010 2011 2012 2013 2014 2015 2016 2017 2018
Mill
ion
Tonn
es
Amorphous Graphite Flake Graphite
Fig. 2: Chinese natural graphite reserves and resources (ICMNR 2019)
Supply and Demand of Natural Graphite10
1.3.1 Chinese natural graphite reserves and resources
Chinese natural graphite reserves and resources were estimated to be 537m t in 2018 (ICMNR 2019), corresponding to a net increase of 83m t, or 18 %, over the previous year. Since 2010, significant progress has been made in prospecting for flake graphite in China, with an additional 252m t of flake graphite discovered. This represents an increase of 136 % between 2010 and 2018 (Fig. 2). Flake graphite resources in China are widely distributed, with current operations in 20 provinces (auton-omous regions, municipalities) and 173 mining areas in 2018. China’s main producing regions are concentrated in Heilongjiang and Inner Mongolia.
Chinese reserves and resources of amorphous graphite have increased by over 70 % since 2010 (ICMNR 2019), amounting to 100m t in 2018, a net increase of 13m t or close to 14 % over the previous year. By the end of 2018, ten Chinese provinces (autonomous regions, municipalities) and 38 min-ing areas had operating graphite mines. China’s main producing regions for amorphous graphite are concentrated in Inner Mongolia autonomous region and Jilin and Hunan provinces.
1.3.2 European natural graphite reserves and resources
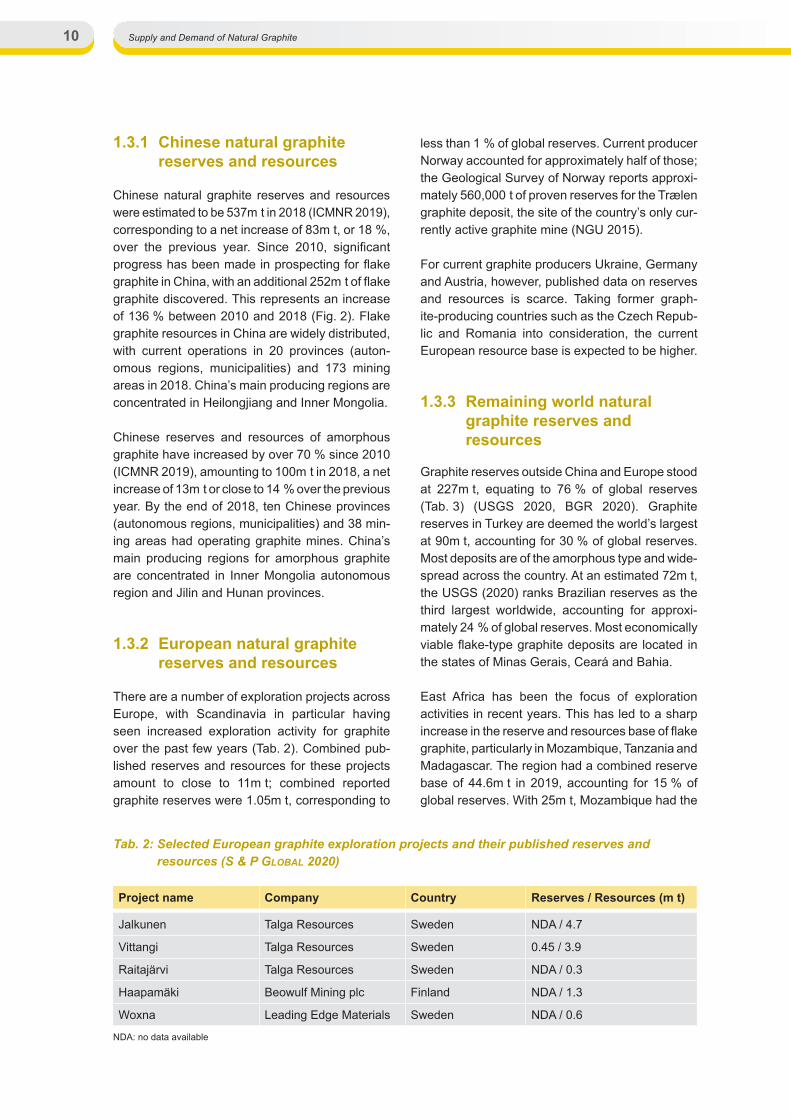
There are a number of exploration projects across Europe, with Scandinavia in particular having seen increased exploration activity for graphite over the past few years (Tab. 2). Combined pub-lished reserves and resources for these projects amount to close to 11m t; combined reported graphite reserves were 1.05m t, corresponding to
less than 1 % of global reserves. Current producer Norway accounted for approximately half of those; the Geological Survey of Norway reports approxi-mately 560,000 t of proven reserves for the Trælen graphite deposit, the site of the country’s only cur-rently active graphite mine (NGU 2015).
For current graphite producers Ukraine, Germany and Austria, however, published data on reserves and resources is scarce. Taking former graph-ite-producing countries such as the Czech Repub-lic and Romania into consideration, the current European resource base is expected to be higher.
1.3.3 Remaining world natural graphite reserves and resources
Graphite reserves outside China and Europe stood at 227m t, equating to 76 % of global reserves (Tab. 3) (USGS 2020, BGR 2020). Graphite reserves in Turkey are deemed the world’s largest at 90m t, accounting for 30 % of global reserves. Most deposits are of the amorphous type and wide-spread across the country. At an estimated 72m t, the USGS (2020) ranks Brazilian reserves as the third largest worldwide, accounting for approxi-mately 24 % of global reserves. Most economically viable flake-type graphite deposits are located in the states of Minas Gerais, Ceará and Bahia.
East Africa has been the focus of exploration activities in recent years. This has led to a sharp increase in the reserve and resources base of flake graphite, particularly in Mozambique, Tanzania and Madagascar. The region had a combined reserve base of 44.6m t in 2019, accounting for 15 % of global reserves. With 25m t, Mozambique had the
Tab. 2: Selected European graphite exploration projects and their published reserves and resources (S & P global 2020)
Project name Company Country Reserves / Resources (m t)
Jalkunen Talga Resources Sweden NDA / 4.7
Vittangi Talga Resources Sweden 0.45 / 3.9
Raitajärvi Talga Resources Sweden NDA / 0.3
Haapamäki Beowulf Mining plc Finland NDA / 1.3
Woxna Leading Edge Materials Sweden NDA / 0.6
NDA: no data available

11Supply and Demand of Natural Graphite
world’s fourth largest known graphite reserves in 2019, equating to about 8 % of global reserves and a combined reserves and resources base of over 344m t (S & P global 2020). The country also boasts the largest African reserves, including the world’s single largest graphite resource at the Balama project in Cabo Delgado province in the country’s north. Tanzanian reserves amounted to 18m t of graphite, accounting for a global share of 6 %; reserves in Madagascar currently stand at 1.6m t. Exploration activities in East Africa have almost exclusively focused on the delineation of flake graphite deposits, with Madagascan deposits in particular known for their large flake size. Con-tinued exploration efforts in these countries are likely to lead to an increase in the reserve base over the coming years.
Indian reserves stood at close to 8m t in 2019, or approximately 3 % of global reserves. However, the country’s resource base is much larger, highlight-ing the potential for an increase in Indian graphite reserves in the future. Graphite occurrences are widespread in India, with the states of Jharkhand, Tamil Nadu and Odisha hosting almost 100 % of reserves, and Arunachal Pradesh, Jammu & Kashmir and Odisha accounting for over 80 % of resources (IBM 2018). Indian reserves include flake, amorphous and vein graphite deposits. Additional Asian countries with substantial graph-ite reserves and resources outside China include Russia, Democratic People’s Republic of Korea (DPR Korea), Pakistan, Sri Lanka and Vietnam.
Canada and Australia also host a number of known graphite deposits, accounting, however, for less than 2 % of global resources. Canadian graphite resources are predominantly located in Québec and Ontario and include both flake and amorphous deposits. Australia’s graphite resource base is located in the states of Western Australia and South Australia. Current exploration efforts in both countries are focused on the discovery and advancement of flake graphite projects.
There are a number of other countries with known graphite resources, such as the USA, Pakistan, Indonesia, Malawi, Ghana, Guinea, Namibia and Ethiopia. However, limited data are available on the resource bases and the type of known de- posits.
1.4 Mining and beneficiation of natural graphite
Graphite deposits are mined using conventional mining methods. Flake graphite deposits are typi-cally found near the surface and, depending on the degree of weathering, can be mined using conven-tional hard or soft-rock mining techniques. Amor-phous graphite deposits are exploited using con-ventional coal-type extraction techniques, while vein graphite deposits can be mined using open-pit or conventional shaft methods. While flake and amorphous graphite deposits are currently mined in both underground and open pit operations, vein graphite deposits are almost exclusively mined in underground operations.
Beneficiation techniques depend on the type of deposit, flake size distribution, and the required specifications of the final concentrate such as crystallinity, texture of the flakes, ash content and level of impurities. They can be divided into commi-nution, beneficiation and, for flake graphite, refin-ing stages. Comminution processes focus on the liberation of graphite flakes from the host rock to increase recovery during the following beneficia-tion stages. The liberation of the graphite flakes is critical for the ultimate grade of the final product. However, as flake size and carbon content are important commercial considerations, with large and jumbo graphite flakes commanding the high-est prices, any processing that reduces flake size should be kept to a minimum. Depending on the type of graphite ore, processing flowsheets for the
Tab. 3: Graphite reserves outside China and Europe (USGS 2020, BGR 2020)
Country Graphite reserves in million tonnes
Turkey 90
Brazil 72
Mozambique 25
Tanzania 18
India 8
Vietnam 7.6
Mexico 3.1
North Korea 2
Madagascar 1.6
TOTAL 227.3
Supply and Demand of Natural Graphite12
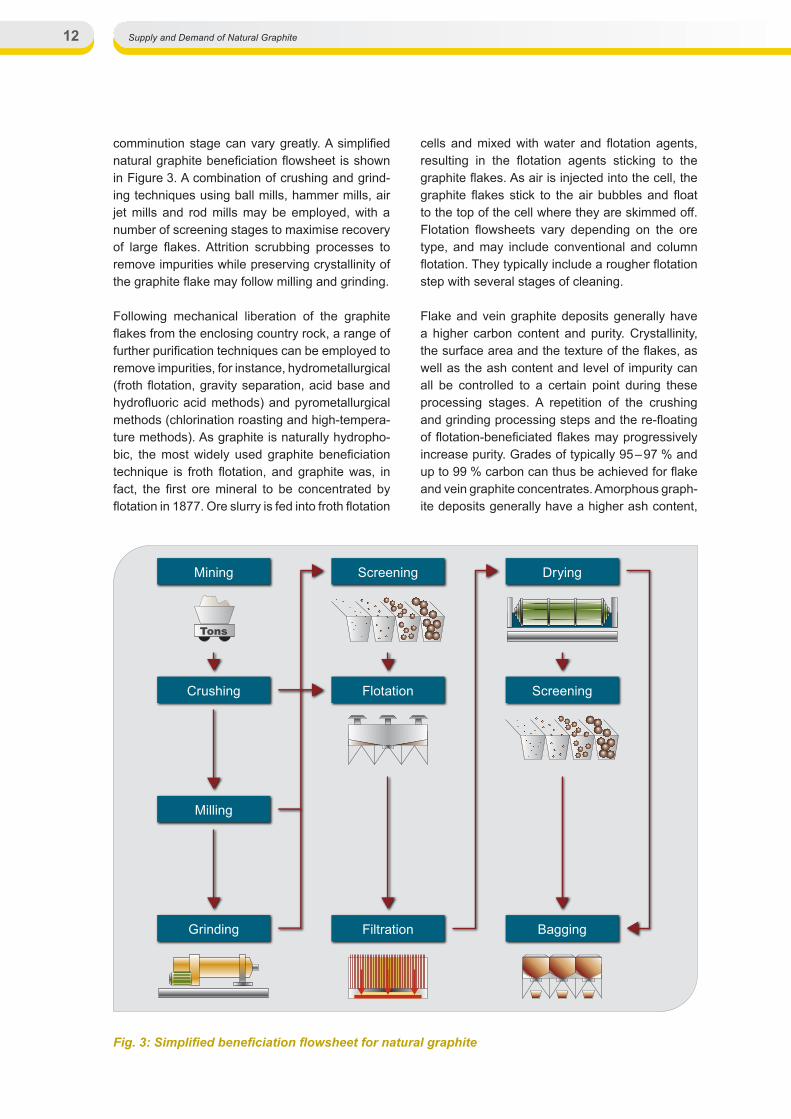
comminution stage can vary greatly. A simplified natural graphite beneficiation flowsheet is shown in Figure 3. A combination of crushing and grind-ing techniques using ball mills, hammer mills, air jet mills and rod mills may be employed, with a number of screening stages to maximise recovery of large flakes. Attrition scrubbing processes to remove impurities while preserving crystallinity of the graphite flake may follow milling and grinding.
Following mechanical liberation of the graphite flakes from the enclosing country rock, a range of further purification techniques can be employed to remove impurities, for instance, hydrometallurgical (froth flotation, gravity separation, acid base and hydrofluoric acid methods) and pyrometallurgical methods (chlorination roasting and high-tempera-ture methods). As graphite is naturally hydropho-bic, the most widely used graphite beneficiation technique is froth flotation, and graphite was, in fact, the first ore mineral to be concentrated by flotation in 1877. Ore slurry is fed into froth flotation
cells and mixed with water and flotation agents, resulting in the flotation agents sticking to the graphite flakes. As air is injected into the cell, the graphite flakes stick to the air bubbles and float to the top of the cell where they are skimmed off. Flotation flowsheets vary depending on the ore type, and may include conventional and column flotation. They typically include a rougher flotation step with several stages of cleaning.
Flake and vein graphite deposits generally have a higher carbon content and purity. Crystallinity, the surface area and the texture of the flakes, as well as the ash content and level of impurity can all be controlled to a certain point during these processing stages. A repetition of the crushing and grinding processing steps and the re-floating of flotation-beneficiated flakes may progressively increase purity. Grades of typically 95 – 97 % and up to 99 % carbon can thus be achieved for flake and vein graphite concentrates. Amorphous graph-ite deposits generally have a higher ash content,
Screening
Flotation
Filtration
Tons
Mining
Crushing
Milling
Grinding
Screening
Bagging
Drying
Fig. 3: Simplified beneficiation flowsheet for natural graphite
13Supply and Demand of Natural Graphite
with impurities attached to the graphite crystals or contained within the lattice structure. This makes flotation and other chemical-based separation techniques in these types of deposits difficult, and the concentrate grades obtained at 75 – 85 % are generally substantially lower. Yield rates depend on the processing technology and efficiency and can vary greatly across the different producer coun-tries. Chinese yield rates are typically assumed to be in the 50 – 55 % range, while Indian yield rates are as low as 20 % of crude output.
Following the flotation stage, the concentrate is filtered and dried before being bagged for trans-port. The product may also undergo screening into different fractions.
High-end applications, such as battery applications, flame retardants and graphite gaskets and seals require upgrading to purities in excess of 99 % C. Mineral grain impurities attached to the surface of the graphite flake itself, trapped between adjacent flakes or intercalated between the graphene layers of the graphite crystal cannot be removed using mechanical methods and usually require thermal or chemical treatment. Further processing depends on the level of contaminants in the deposit and its physical characteristics such as particle size, as well as on customer requirements and the applica-tion of the end product. Chemical purification tech-niques can yield grades of 99.98 % and include the use of strong acids such as HF, HCl, H2HSO4 and HNO3, raising concerns over environmental pollu-
tion. Thermal purification requiring large amounts of energy to heat graphite to temperatures of up to 3,000 °C can achieve grades exceeding 99.99 %. The use of strong acids and reagents and high production and energy costs have thus far dis-couraged any commercially viable development of processing capacity worth mentioning outside China. The lithium-ion manufacturing value chain in particular is currently almost exclusively focused on China, with some high-end processing in the Republic of Korea and Japan.
1.5 Natural graphite applications
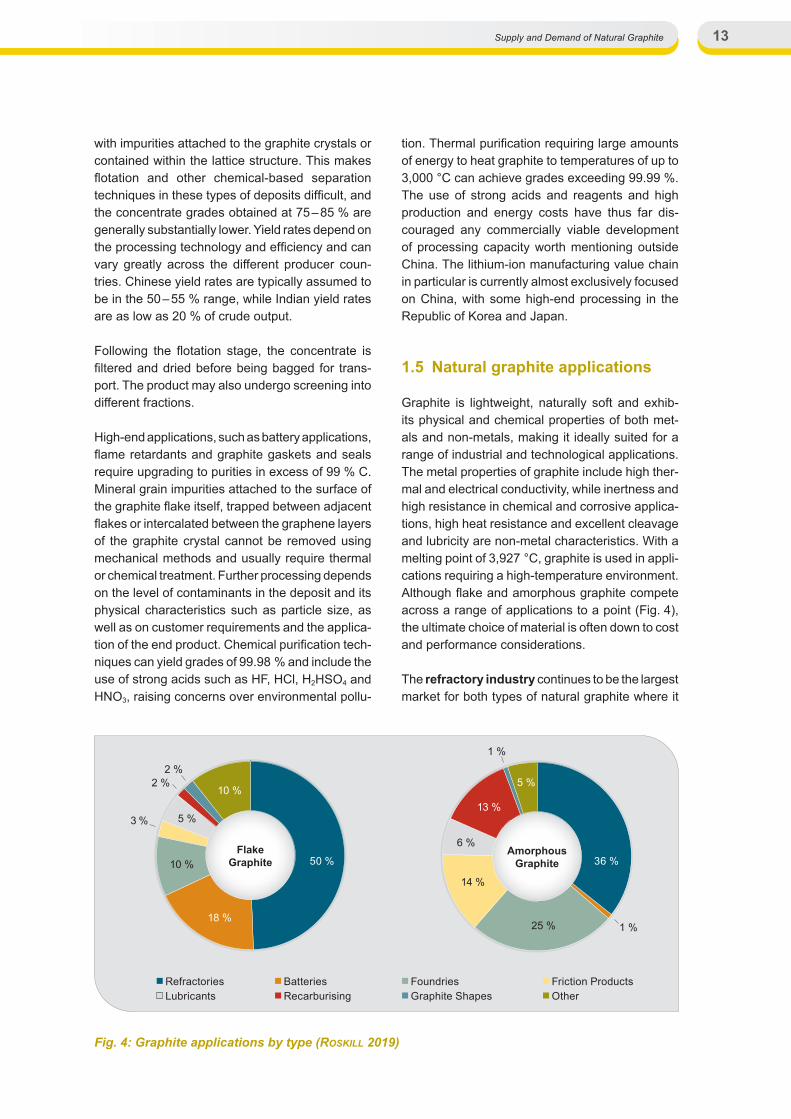
Graphite is lightweight, naturally soft and exhib-its physical and chemical properties of both met-als and non-metals, making it ideally suited for a range of industrial and technological applications. The metal properties of graphite include high ther-mal and electrical conductivity, while inertness and high resistance in chemical and corrosive applica-tions, high heat resistance and excellent cleavage and lubricity are non-metal characteristics. With a melting point of 3,927 °C, graphite is used in appli-cations requiring a high-temperature environment. Although flake and amorphous graphite compete across a range of applications to a point (Fig. 4), the ultimate choice of material is often down to cost and performance considerations.
The refractory industry continues to be the largest market for both types of natural graphite where it
RefractoriesLubricants
BatteriesRecarburising
FoundriesGraphite Shapes
Friction ProductsOther
36 %
25 %
14 %
AmorphousGraphite
6 %
13 %
5 %
1 %
1 %
Flake Graphite10 %
10 %
2 %2 %
3 % 5 %
50 %
18 %
Fig. 4: Graphite applications by type (RoSkill 2019)
Supply and Demand of Natural Graphite14
is used in the production of materials for high-tem-perature environments such as the linings for kilns, incinerators, reactors and furnaces. Predominantly large flakes are used in the production of refractory materials, with some smaller flake sizes and amor-phous graphite also used. The steel industry is by far the largest consumer of refractory materials, followed by the non-ferrous metals and non-metal-lic producing industries such as cement and glass production. In refractories, graphite is used in the form of magnesia-carbon, alumina-carbon, alumi-na-magnesia-carbon and silicon carbide-graphite, and as graphite blocks in electric arc and basic oxygen furnaces, linings in ilmenite smelting and crucibles in steel, non-ferrous and precious metal production.
The foundry industry accounted for the third largest application of flake and the second larg-est application of amorphous graphite, with use as facing sand and mould wash in a variety of cast-ing methods. The production of ferrous castings had the largest global share of all casting meth-ods, followed by non-ferrous casting such as alu-minium, copper, zinc and lead, magnesium and titanium-based casting. The main applications for foundry-cast metals include the automotive and other transport industries, pipelines and machin-ery.
Graphite is the most widely used anode material in batteries. Battery types include both primary (non-rechargeable) and secondary (recharge-able) batteries, where natural graphite competes with synthetic graphite across a range of differ-ent battery types. In 2018, approximately 14 % of natural graphite worldwide was used in batteries (RoSkill 2019). Close to 90 % of all natural graph-ite consumption in batteries was in lithium-ion batteries, with the balance consumed in primary batteries (such as alkaline and zinc-air), as well as other secondary batteries (such as lead-acid and nickel-metal-hydride).
Other applications for both flake and amorphous graphite include lubricants such as oils, greases and fluid dispersions in industrial and consumer applications; shaped graphite products for the automotive, aerospace, electronics and industrial machinery industries; friction materials such as used in brake pads and clutches in the automo-tive and aviation industries; and in the construction industry and other specialty applications.
15Supply and Demand of Natural Graphite
2 Natural graphite production
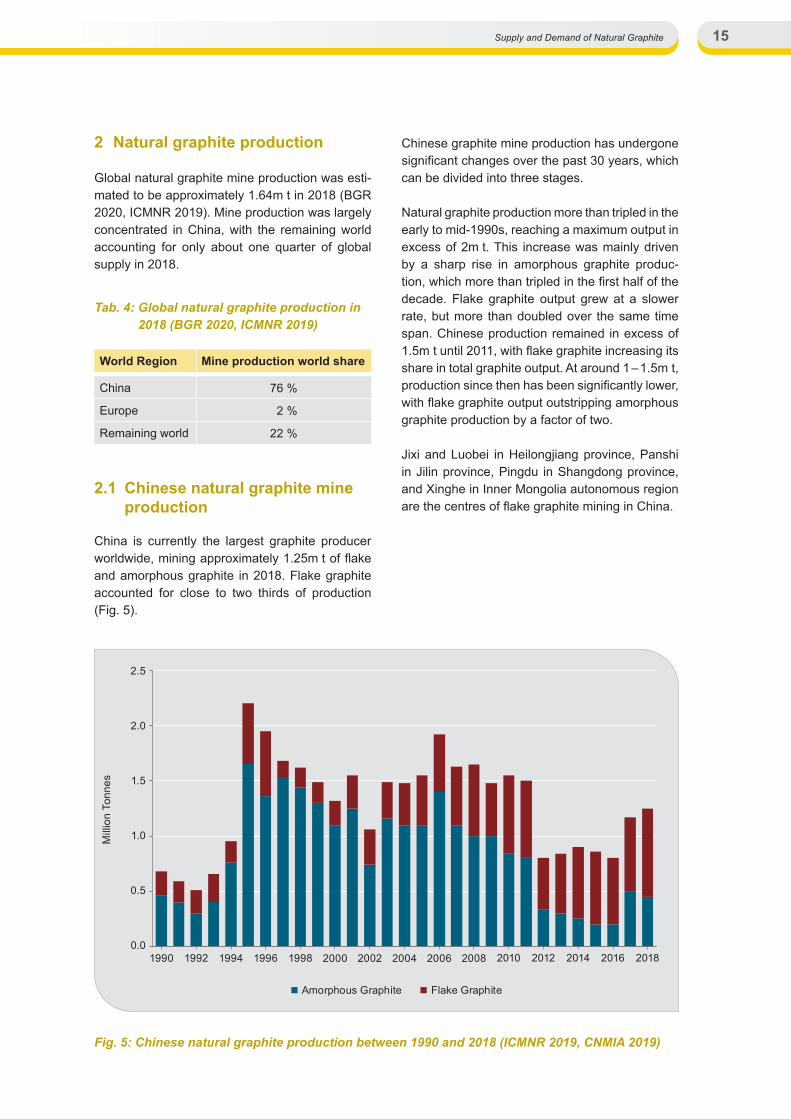
Global natural graphite mine production was esti-mated to be approximately 1.64m t in 2018 (BGR 2020, ICMNR 2019). Mine production was largely concentrated in China, with the remaining world accounting for only about one quarter of global supply in 2018.
2.1 Chinese natural graphite mine production
China is currently the largest graphite producer worldwide, mining approximately 1.25m t of flake and amorphous graphite in 2018. Flake graphite accounted for close to two thirds of production (Fig. 5).
Chinese graphite mine production has undergone significant changes over the past 30 years, which can be divided into three stages.
Natural graphite production more than tripled in the early to mid-1990s, reaching a maximum output in excess of 2m t. This increase was mainly driven by a sharp rise in amorphous graphite produc-tion, which more than tripled in the first half of the decade. Flake graphite output grew at a slower rate, but more than doubled over the same time span. Chinese production remained in excess of 1.5m t until 2011, with flake graphite increasing its share in total graphite output. At around 1 – 1.5m t, production since then has been significantly lower, with flake graphite output outstripping amorphous graphite production by a factor of two.
Jixi and Luobei in Heilongjiang province, Panshi in Jilin province, Pingdu in Shangdong province, and Xinghe in Inner Mongolia autonomous region are the centres of flake graphite mining in China.
Tab. 4: Global natural graphite production in 2018 (BGR 2020, ICMNR 2019)
World Region Mine production world share
China 76 %
Europe 2 %
Remaining world 22 %
0.0
0.5
1.0
1.5
2.0
2.5
1990 1992 1994 1996 1998 2000 2002 2004 2006 2008 2010 2012 2014 2016 2018
Mill
ion
Tonn
es
Amorphous Graphite Flake Graphite
Fig. 5: Chinese natural graphite production between 1990 and 2018 (ICMNR 2019, CNMIA 2019)
Supply and Demand of Natural Graphite16
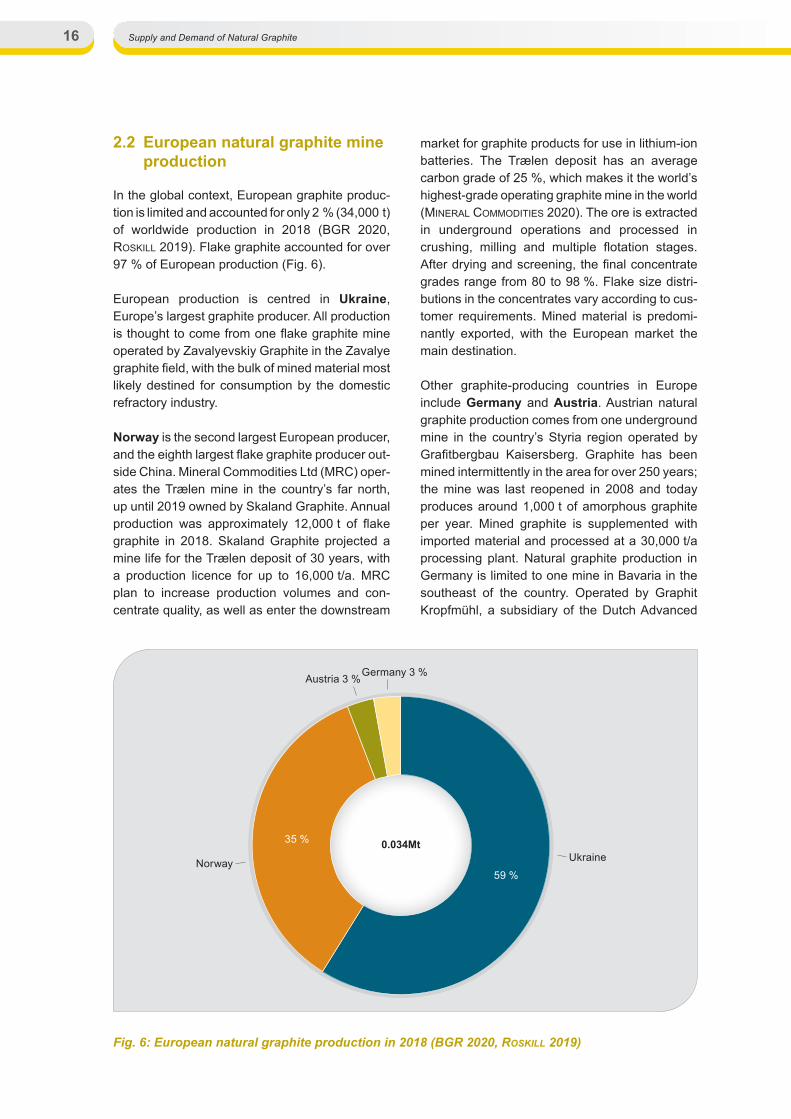
2.2 European natural graphite mine production
In the global context, European graphite produc-tion is limited and accounted for only 2 % (34,000 t) of worldwide production in 2018 (BGR 2020, RoSkill 2019). Flake graphite accounted for over 97 % of European production (Fig. 6).
European production is centred in Ukraine, Europe’s largest graphite producer. All production is thought to come from one flake graphite mine operated by Zavalyevskiy Graphite in the Zavalye graphite field, with the bulk of mined material most likely destined for consumption by the domestic refractory industry.
Norway is the second largest European producer, and the eighth largest flake graphite producer out-side China. Mineral Commodities Ltd (MRC) oper-ates the Trælen mine in the country’s far north, up until 2019 owned by Skaland Graphite. Annual production was approximately 12,000 t of flake graphite in 2018. Skaland Graphite projected a mine life for the Trælen deposit of 30 years, with a production licence for up to 16,000 t/a. MRC plan to increase production volumes and con-centrate quality, as well as enter the downstream
market for graphite products for use in lithium-ion batteries. The Trælen deposit has an average carbon grade of 25 %, which makes it the world’s highest-grade operating graphite mine in the world (mineRal commoditieS 2020). The ore is extracted in underground operations and processed in crushing, milling and multiple flotation stages. After drying and screening, the final concentrate grades range from 80 to 98 %. Flake size distri-butions in the concentrates vary according to cus-tomer requirements. Mined material is predomi-nantly exported, with the European market the main destination.
Other graphite-producing countries in Europe include Germany and Austria. Austrian natural graphite production comes from one underground mine in the country’s Styria region operated by Grafitbergbau Kaisersberg. Graphite has been mined intermittently in the area for over 250 years; the mine was last reopened in 2008 and today produces around 1,000 t of amorphous graphite per year. Mined graphite is supplemented with imported material and processed at a 30,000 t/a processing plant. Natural graphite production in Germany is limited to one mine in Bavaria in the southeast of the country. Operated by Graphit Kropfmühl, a subsidiary of the Dutch Advanced
0.034Mt
59 %
35 %
Austria 3 %Germany 3 %
UkraineNorway
Fig. 6: European natural graphite production in 2018 (BGR 2020, RoSkill 2019)
17Supply and Demand of Natural Graphite
Metallurgical Group N.V. (AMG) since 2012, the mine produced approximately 1,000 t of flake graphite in 2017.
There are a number of European countries with historical graphite production, including Sweden and the Czech Republic.
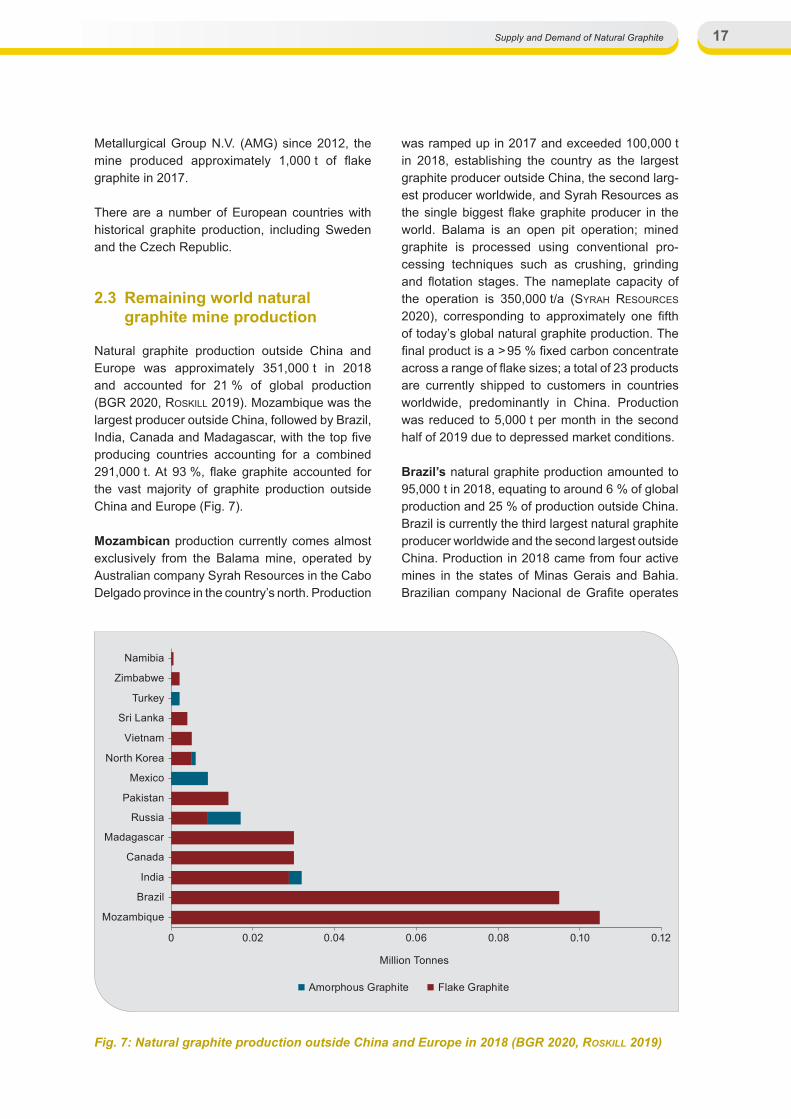
2.3 Remaining world natural graphite mine production
Natural graphite production outside China and Europe was approximately 351,000 t in 2018 and accounted for 21 % of global production (BGR 2020, RoSkill 2019). Mozambique was the largest producer outside China, followed by Brazil, India, Canada and Madagascar, with the top five producing countries accounting for a combined 291,000 t. At 93 %, flake graphite accounted for the vast majority of graphite production outside China and Europe (Fig. 7).
Mozambican production currently comes almost exclusively from the Balama mine, operated by Australian company Syrah Resources in the Cabo Delgado province in the country’s north. Production
was ramped up in 2017 and exceeded 100,000 t in 2018, establishing the country as the largest graphite producer outside China, the second larg-est producer worldwide, and Syrah Resources as the single biggest flake graphite producer in the world. Balama is an open pit operation; mined graphite is processed using conventional pro-cessing techniques such as crushing, grinding and flotation stages. The nameplate capacity of the operation is 350,000 t/a (SyRah ReSouRceS 2020), corresponding to approximately one fifth of today’s global natural graphite production. The final product is a > 95 % fixed carbon concentrate across a range of flake sizes; a total of 23 products are currently shipped to customers in countries worldwide, predominantly in China. Production was reduced to 5,000 t per month in the second half of 2019 due to depressed market conditions.
Brazil’s natural graphite production amounted to 95,000 t in 2018, equating to around 6 % of global production and 25 % of production outside China. Brazil is currently the third largest natural graphite producer worldwide and the second largest outside China. Production in 2018 came from four active mines in the states of Minas Gerais and Bahia. Brazilian company Nacional de Grafite operates
0 0.02 0.04 0.06 0.08 0.10 0.12
Mozambique
Brazil
India
Canada
Madagascar
Russia
Pakistan
Mexico
North Korea
Vietnam
Sri Lanka
Turkey
Zimbabwe
Namibia
Million Tonnes
Amorphous Graphite Flake Graphite
Fig. 7: Natural graphite production outside China and Europe in 2018 (BGR 2020, RoSkill 2019)
Supply and Demand of Natural Graphite18
the Itapecerica, Pedra Azul and Salto da Divisa mines, accounting for over 80 % of total Brazilian production. Extrativa Metalquimica operates the Maiquinique mine in Bahia, where production is estimated to be around 15,000 t/a.
At 32,000 t in 2018, India is currently the third largest natural graphite producer outside China. Both flake graphite and amorphous graphite are produced, although the majority of production is flake, making the country the fifth-largest flake graphite producer globally after China, Mozam-bique, Brazil and Canada. Graphite production statistics in India are reported in tonnes run-of-mine; the carbon content of active deposits can vary considerably, but generally ranges between 10 and 20 % fixed carbon. According to Indian government sources, there were nine producing graphite mines in 2017 – 2018, in the states of Odi-sha, Tamil Nadu, Jharkhand, Kerala and Karnataka (IBM 2018). Owing to generally lower ore grades and less efficient processing technologies, the majority of Indian graphite concentrates are gen-erally lower in grades than those of many other graphite-producing countries. They are reported to be in the range 70 – 80 % carbon, with some pro-ducers reaching up to 92 % after repeated cycles of beneficiation.
In 2018, Canadian mine production of natural graphite accounted for approximately 2 % of global production, placing the country in the top five global producers and establishing it as the fourth larg-est outside China. Two active mines produced an estimated 30,000 t of flake graphite. The Canadian authorities do not publish official production data in order to protect the country’s two main producers. This estimate is based on previous years of pro-duction, but could well be lower, based particularly on a lower output by the country’s largest mine, Lac-des-Îles in Québec, owned and operated by Imerys Graphite & Carbon. The Black Crystal mine in British Columbia, owned and operated by Eagle Graphite, reportedly restarted production in 2008 (eagle gRaPhite 2020) and is thought to be in the process of ramping up. Output in 2018 is estimated to have been 7,500 t of flake graphite.
Madagascar’s natural graphite output was 30,000 t of flake graphite in 2018, placing it in the top four flake graphite-producing countries outside China. The country’s natural graphite deposits are generally large and known for their high-quality
large size flakes; crude ore grades typically range between 10 and 20 % carbon. Produced con-centrates typically contain grades of 80 – 84 %, although grades of up to 95 % have been reported (RoSkill 2019).
Russia is both a flake and amorphous graphite producer; annual production was estimated to be around 17,000 t from two active mines in 2018. Flake graphite production accounted for 53 % (9,000 t) of total graphite output and came from the Taiginka mine owned by Uralgraphite in the Ural mountains. On its website, the company states the mine’s capacity as being 15,000 t per year of mine production, mined in open pit operation (uRalgRaPhite 2020). Russian amorphous graph-ite production was slightly lower, at 8,000 t in 2018, and came exclusively from the Kureiskoe deposit, operated by Krasnoyarsk Grafit. According to the company website, the processing capacity could be doubled to 15 – 20,000 t, depending on cus-tomer demand (kRaSnoyaRSk gRafit 2020).
Further graphite producers included Pakistan, Mexico, DPR Korea, Vietnam, Sri Lanka, Turkey, Zimbabwe and Namibia, accounting for a combined 42,500 t or 2 % of global production. Mexican production stood at 9,000 t and was exclusively amorphous graphite, with US company Asbury Carbon operating two mines in the state of Sonora. Flake graphite mining in Pakistan amounted to approximately 14,000 t in 2018 and production is mainly destined for domestic consumption. Out-put in DPR Korea was estimated to be around 6,000 t in 2018 and most likely includes both flake and amorphous graphite; China is currently the main export destination. Graphite production in Sri Lanka is for vein graphite, and although there are known vein graphite deposits outside Sri Lanka, the country is currently the only current producer of this kind of deposit. Annual production from several underground mines was estimated at 4,000 t in 2018, which is mainly destined for overseas consumption. Turkey produced around 2,000 t of amorphous graphite at 85 % carbon in 2017, from the Oysu mine in Kütahya province in Western Turkey. Oysu has been owned by Turk-ish company Karabacak Madencilik Sanayi ve Dış Ticaret Turizm A.Ş. since 1986. The mine is the only active graphite mine in the region, thus repre-senting the only alternative source of amorphous graphite for the region outside China (kaRabacak 2018).
19Supply and Demand of Natural Graphite
Additional African natural graphite production outside of major producer Mozambique included Namibia and Zimbabwe in 2018, albeit with low output. Namibian production was less than 1,000 t in 2018. The Okanjande flake graphite project 250 km north of Windhoek, owned by Gecko Namibia and operated in a joint venture with Swiss graphite producer Imerys Graphite & Car-bon, experienced ramp-up issues and was put on care and maintenance in late 2018. Graphite pro-duction in Zimbabwe in 2018 is thought to come from the Lynx mine in Karoi, approximately 200 km northwest of Harare. Owned by Zimbabwe Mining Development Corporation, the mine has been in operation for over 50 years, with annual production volumes between 5,000 and 7,000 t over the last five years. Strikes and the search for new investors resulted in substantially lower production for 2018, at an estimated 2,000 t.

Supply and Demand of Natural Graphite20
3 International trade in natural graphite
The global export volume of natural graphite was roughly 560,000 tonnes in 2018. Natural graphite is traded as flake graphite (HS code 250410, reported as “natural graphite, in powder or in flakes”) and amorphous graphite (HS code 250490, reported as “natural graphite, except powder or flakes”). At 76 %, flake graphite accounted for the majority of global natural graphite exports. China was by far the dominant single exporting nation (Fig. 8). Other major flake-exporting countries were Mozambique and Madagascar.
Global natural graphite imports were approx i - mately 570,000 t in 2018; the largest single im port-ing country was China, accounting for 11 % of global natural graphite imports (Fig. 8). Germany, Austria and Poland accounted for over half of European imports, while Japan, the USA and the Republic of Korea were the largest importers out-side China.
3.1 Chinese trade in natural graphite
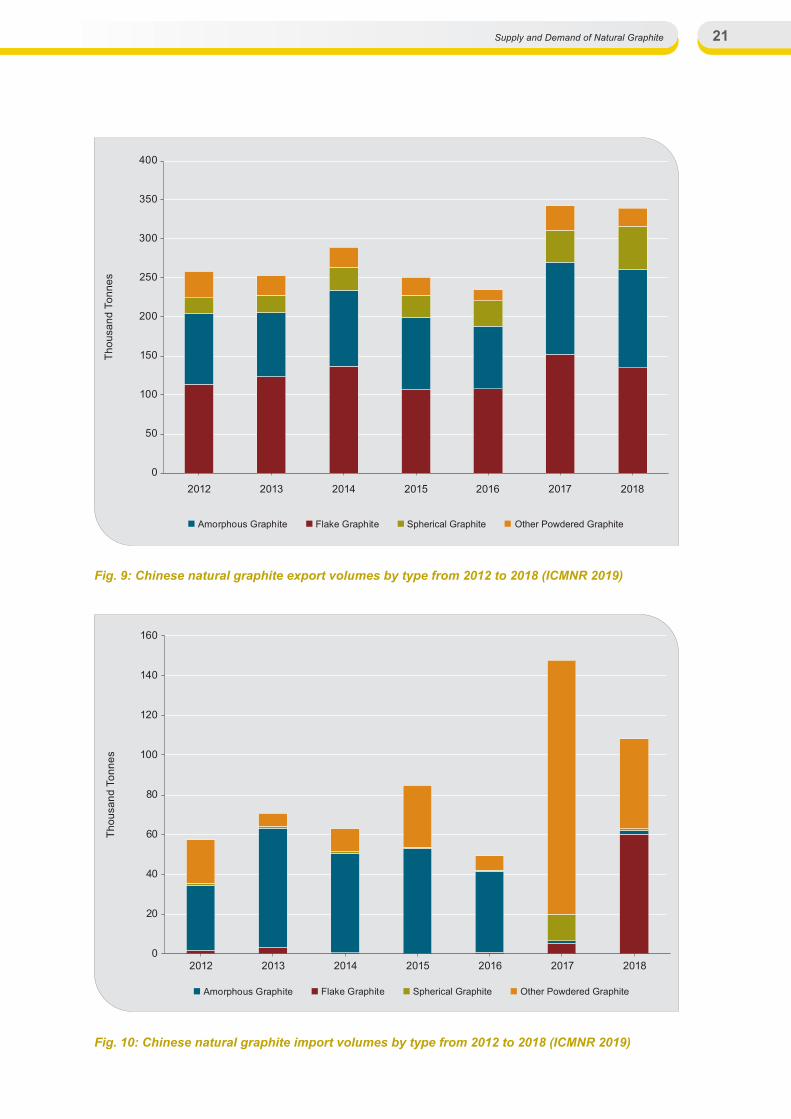
China is the main exporter of natural graphite, accounting for over 60 % of the world‘s graph-ite exports (Fig. 8). Graphite has become one of the non-metallic mineral products with the largest export volume for China. Chinese export volumes of natural graphite have been relatively stable at 250,000 t/a, though increasing sharply by about 100,000 t in 2017 (Fig. 9). At approximately 40 %, flake graphite accounted for the biggest share of export volume in 2018; spherical graphite had a 16 % share.
China’s natural graphite is mainly exported to Japan, the USA, Germany, India, Republic of Korea, Turkey, the Netherlands, Pakistan, Iran, Belgium and other countries, with Japan being the main export market.
Despite being a major exporter of natural graphite, China has also become a large importer of partic-
GlobalExports by
Type76 %
24 %
GlobalImports by
Type
88 %
12 %
GlobalExports by
Region
61 %
29 %
9 %
GlobalImports by
Region30 %
59 %
11 %
Remaining WorldChina EuropeAmorphous GraphiteFlake Graphite
Fig. 8: Global natural graphite trade by type and region in 2018 (HS codes 250410 and 250490) (IHS 2020)
21Supply and Demand of Natural Graphite
0
50
100
150
200
250
300
350
400
2012 2013 2014 2015 2016 2017 2018
Thou
sand
Ton
nes
Amorphous Graphite Flake Graphite Spherical Graphite Other Powdered Graphite
0
20
40
60
80
100
120
140
160
2012 2013 2014 2015 2016 2017 2018
Thou
sand
Ton
nes
Amorphous Graphite Flake Graphite Spherical Graphite Other Powdered Graphite
Fig. 9: Chinese natural graphite export volumes by type from 2012 to 2018 (ICMNR 2019)
Fig. 10: Chinese natural graphite import volumes by type from 2012 to 2018 (ICMNR 2019)
Supply and Demand of Natural Graphite22
ularly flake graphite over the past couple of years. Prior to 2017, the annual import volume of natu-ral graphite in China fluctuated slightly at around 60,000 t but increased significantly in 2017, with imports of 147,400 t for that year. While amor-phous graphite imports were the most important natural graphite imports up until 2016, flake graph-ite imports have since increased most significantly.
3.2 European trade in natural graphite
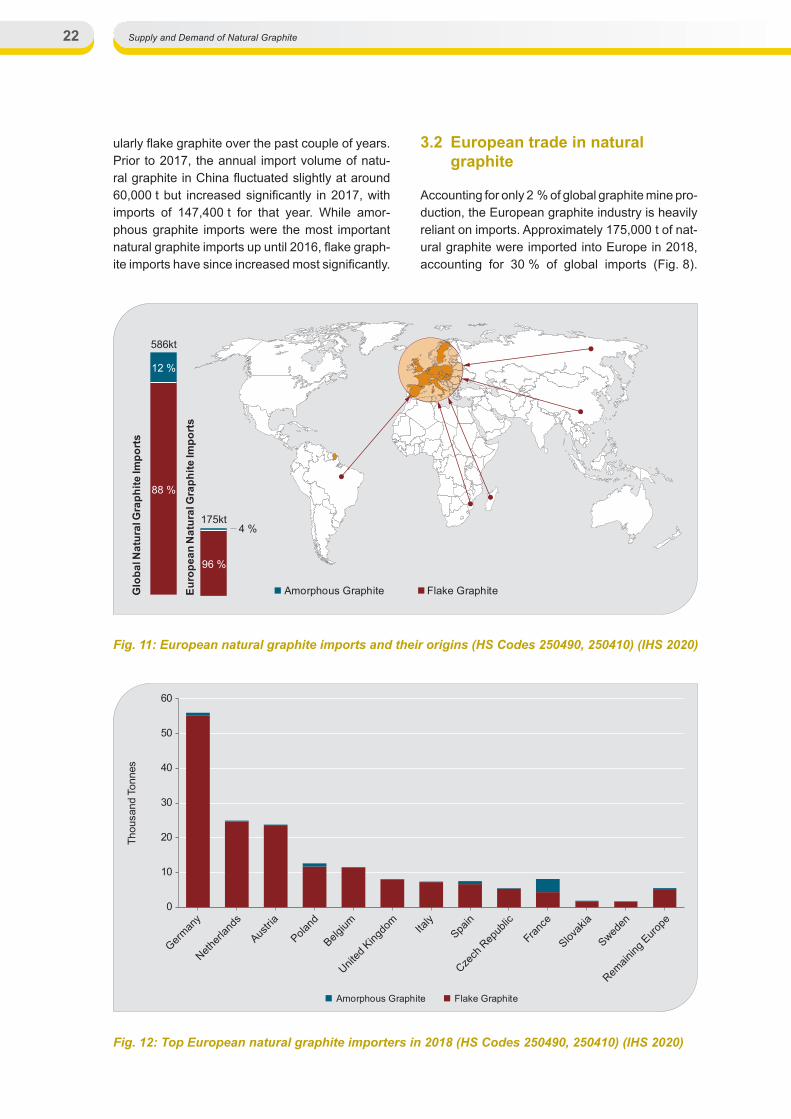
Accounting for only 2 % of global graphite mine pro-duction, the European graphite industry is heavily reliant on imports. Approximately 175,000 t of nat-ural graphite were imported into Europe in 2018, accounting for 30 % of global imports (Fig. 8).
Amorphous Graphite Flake GraphiteEuro
pean
Nat
ural
Gra
phite
Impo
rts
Glo
bal N
atur
al G
raph
ite Im
port
s
586kt
175kt
12 %
88 %
96 %
4 %
Fig. 11: European natural graphite imports and their origins (HS Codes 250490, 250410) (IHS 2020)
0
10
20
30
40
50
60
German
y
Netherl
ands
Austria
Poland
Belgium Ita
ly
United
King
dom
Spain
Czech
Rep
ublic
France
Slovak
ia
Sweden
Remain
ing E
urope
Thou
sand
Ton
nes
Amorphous Graphite Flake Graphite
Fig. 12: Top European natural graphite importers in 2018 (HS Codes 250490, 250410) (IHS 2020)
23Supply and Demand of Natural Graphite
Flake graphite was by far the most important type of graphite, accounting for 96 % of all European imports (Fig. 11). Approximately 35 % of European imports originated in China; imports from Euro-pean countries were 30 %. Germany is Europe’s single largest importer of natural graphite, import-ing close to 56,000 t in 2018, approximately 44 % from China (Fig. 12).
European countries exported approximately 46,000 t of natural graphite; flake graphite account- ed for over 95 % of exports. Most material was des-tined for the European market, with approximately 85 % of exports shipped to European custom-ers. Germany was the largest exporter of natural graphite in Europe, accounting for 35 % of all Euro-pean exports. Exceeding German domestic mine production in 2018 by far, the bulk of the mate-rial was imported for processing and destined for re-export. Graphite producers Norway, Austria and Ukraine accounted for a further 36 % of European exports.
3.3 Remaining world trade in natural graphite
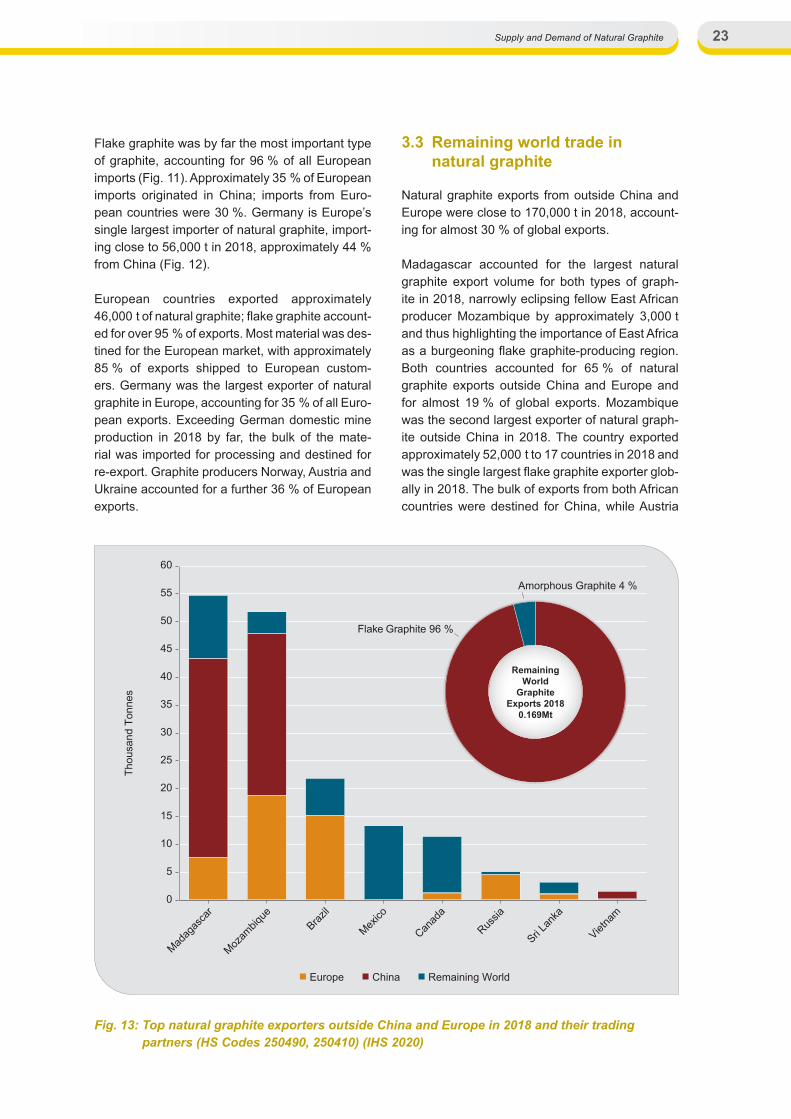
Natural graphite exports from outside China and Europe were close to 170,000 t in 2018, account-ing for almost 30 % of global exports.
Madagascar accounted for the largest natural graphite export volume for both types of graph-ite in 2018, narrowly eclipsing fellow East African producer Mozambique by approximately 3,000 t and thus highlighting the importance of East Africa as a burgeoning flake graphite-producing region. Both countries accounted for 65 % of natural graphite exports outside China and Europe and for almost 19 % of global exports. Mozambique was the second largest exporter of natural graph-ite outside China in 2018. The country exported approximately 52,000 t to 17 countries in 2018 and was the single largest flake graphite exporter glob-ally in 2018. The bulk of exports from both African countries were destined for China, while Austria
0
5
10
15
20
25
30
35
40
45
50
55
60
Madag
asca
r
Mozam
bique
Brazil
Mexico
Canad
a
Russia
Sri Lan
ka
Vietna
m
Thou
sand
Ton
nes
Europe China Remaining World
Flake Graphite 96 %
RemainingWorld
GraphiteExports 2018
0.169Mt
Amorphous Graphite 4 %
Fig. 13: Top natural graphite exporters outside China and Europe in 2018 and their trading partners (HS Codes 250490, 250410) (IHS 2020)
Supply and Demand of Natural Graphite24
and Germany accounted for the largest European imports. The majority of Mozambican material came from Syrah Resources’ Balama operations, the world’s single largest flake graphite producer in 2018.
Brazilian exports are substantially lower than domestic mine production, indicating domestic consumption by the country’s steel and refrac-tory industries. Europe was by far the main export destination for Brazilian natural graphite, with Ger-many accounting for 30 % of exports.
25Supply and Demand of Natural Graphite
4 Natural graphite prices
Natural graphite is not traded on any commodity exchange and prices are subject to negotiations between suppliers and consumers on a contract basis. Pricing is determined by a number of factors such as carbon content, flake size, level of present impurities, and degree of processing. Proximity to the market can also play a role in price negotia-tions. Both flake graphite and amorphous graphite are sold as concentrates following basic process-ing (see 1.4); prices are available for grades of up to 97 % and 85 % carbon content, respectively. An increasing amount of flake graphite undergoes further processing such as thermal and chemical purification, with higher carbon content fetching substantially higher prices. Other modifications such as shaping (e. g. spheroidisation), micronisa-tion and expansion required for specialty applica-tions also command higher prices.
China as the main producing country has been the crucial driver for natural graphite prices over the last couple of decades. Its prices, historically much lower than those of other major producers, have gone up due to rising costs of labour and energy, greater domestic demand, and a shift towards the domestic development of the lithium-ion battery value chain. The projected surge in demand for lithium-ion batteries has given rise to availability concerns, further adding to price rises.
More recently, changing environmental regulations and Chinese processing plant closures led to an increase in prices in early 2018. Rising demand for flake graphite from the lithium-ion battery industry and tightening supply contributed to further price increases, particularly for higher carbon content grades. Prices have since experienced a down-ward adjustment to 2017 levels across some flake sizes, mainly attributed to a slower than expected demand increase and ongoing oversupply woes of the Chinese market along with additional new supply from outside China.
AsiaEuropeRemaining World
65 %12 %
23 %
Consumptionby Region
Consumptionby
Application 46 %
14 %
14 %
6 %
5 %
4 %2 %
9 %
RefractoriesFriction ProductsGraphite Shapes
BatteriesLubricantsOther
FoundriesRecarburising
Fig. 14: Global natural graphite consumption in 2018 by region and application (RoSkill 2019)
Supply and Demand of Natural Graphite26
5 Natural graphite consumption
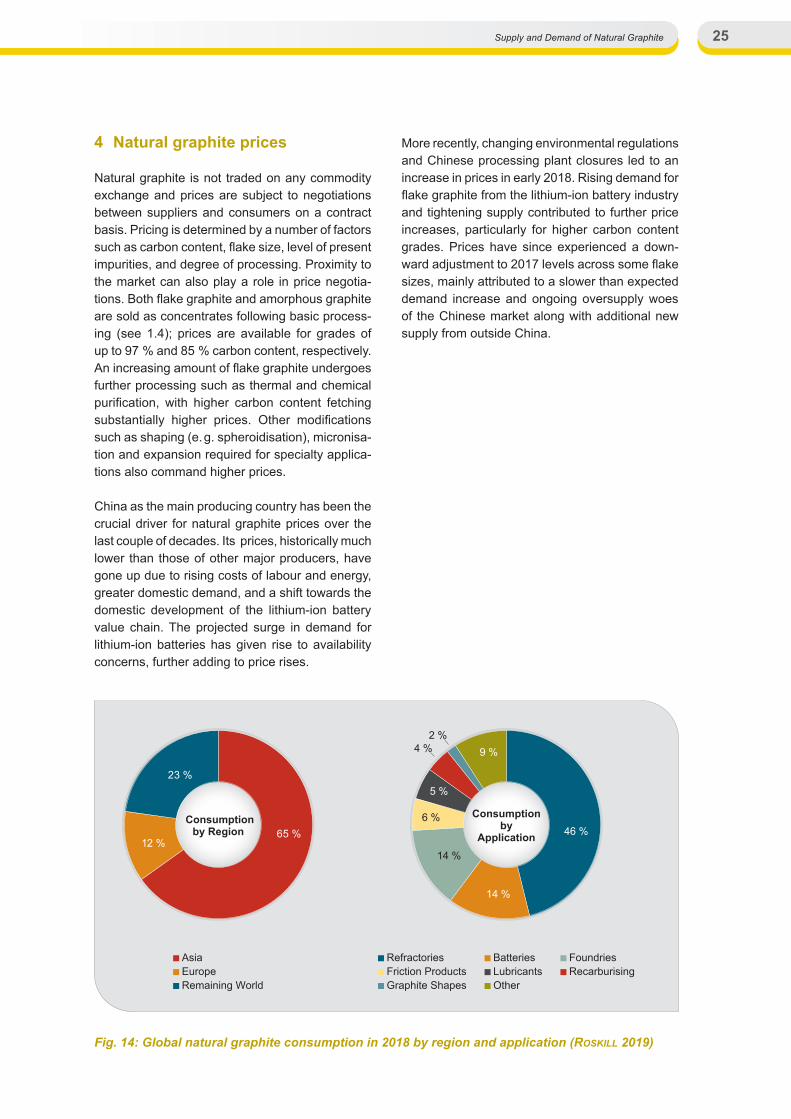
Global consumption of natural graphite was ap- pro ximately 947,000 t in 2018 (RoSkill 2019). The refractory industry is by far the largest consumer of natural graphite, accounting for approximately 46 % of global consumption (Fig. 14). Refractory products are used in all high-temperature indus-trial applications. They are thus indispensable in a range of production processes in the steel, non-fer-rous, cement, lime, and glass industries, which are the backbone of many large economies worldwide. Accounting for 70 % of the global share, the steel industry is the largest consumer of refractory prod-ucts, thus highlighting the importance of natural graphite consumption in this market segment.
Asian consumption accounted for almost two thirds of global natural graphite consumption, owing to the size of the Chinese refractory and steel indus-tries, with consumption in Europe and the remain-ing world making up the balance.
5.1 Chinese natural graphite consumption
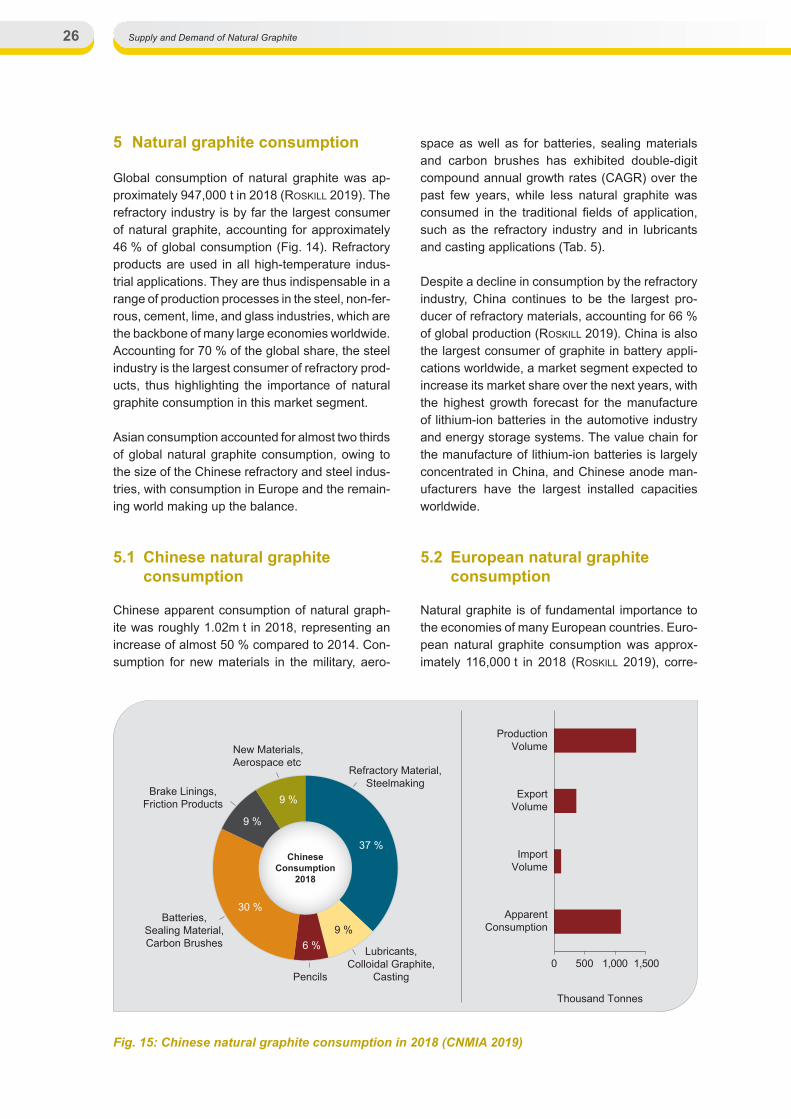
Chinese apparent consumption of natural graph-ite was roughly 1.02m t in 2018, representing an increase of almost 50 % compared to 2014. Con-sumption for new materials in the military, aero-
space as well as for batteries, sealing materials and carbon brushes has exhibited double-digit compound annual growth rates (CAGR) over the past few years, while less natural graphite was consumed in the traditional fields of application, such as the refractory industry and in lubricants and casting applications (Tab. 5).
Despite a decline in consumption by the refractory industry, China continues to be the largest pro-ducer of refractory materials, accounting for 66 % of global production (RoSkill 2019). China is also the largest consumer of graphite in battery appli-cations worldwide, a market segment expected to increase its market share over the next years, with the highest growth forecast for the manufacture of lithium-ion batteries in the automotive industry and energy storage systems. The value chain for the manufacture of lithium-ion batteries is largely concentrated in China, and Chinese anode man-ufacturers have the largest installed capacities worldwide.
5.2 European natural graphite consumption
Natural graphite is of fundamental importance to the economies of many European countries. Euro-pean natural graphite consumption was approx-imately 116,000 t in 2018 (RoSkill 2019), corre-
Thousand Tonnes
ProductionVolume
ExportVolume
ImportVolume
ApparentConsumption
Chinese Consumption
2018
New Materials, Aerospace etc
Brake Linings,Friction Products 9 %
9 %
Refractory Material,Steelmaking
37 %
Lubricants,Colloidal Graphite,
Casting
9 %
Pencils
6 %
Batteries,Sealing Material,Carbon Brushes
30 %
0 500 1,000 1,500
Fig. 15: Chinese natural graphite consumption in 2018 (CNMIA 2019)
27Supply and Demand of Natural Graphite
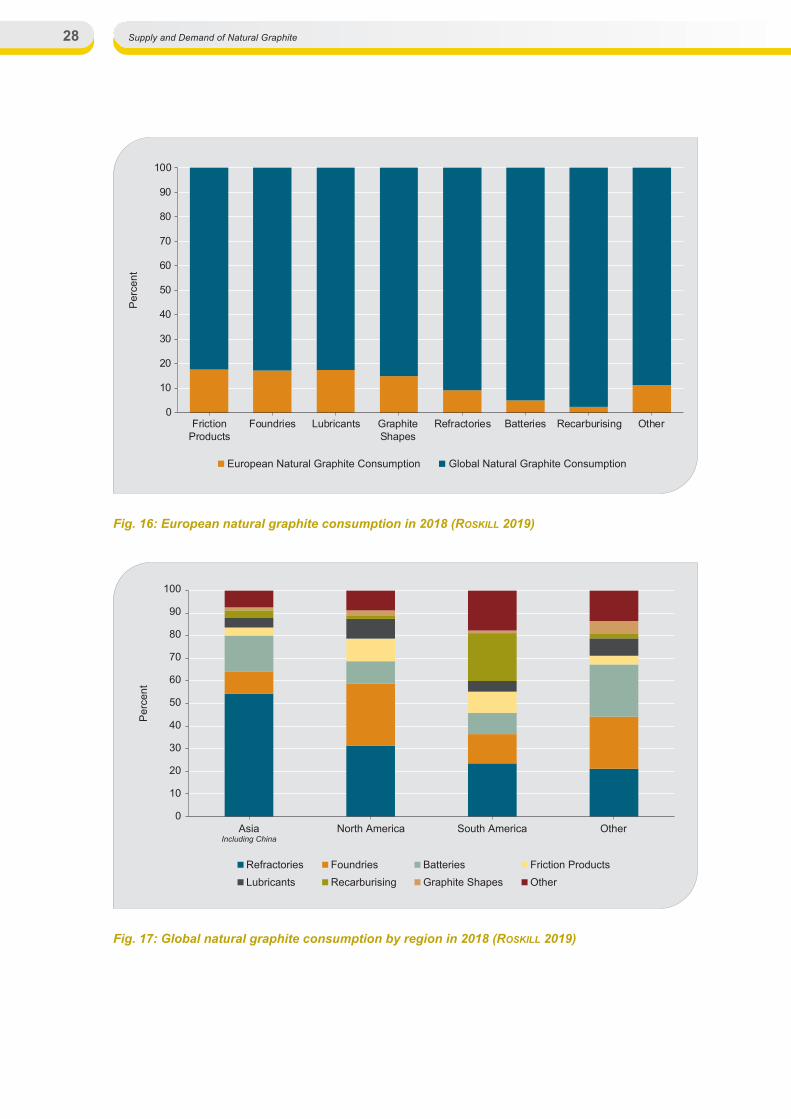
sponding to about 12 % of global consumption. At approximately 44,000 t, the refractory industry is the largest consumer of natural graphite in Europe and had an 11 % share in global production in 2018, the second highest in the world after China (RoSkill 2019) (Fig. 16). The main refractory materials-consuming industry is the steel indus-try, and with 167m t of crude steel production in 2018, Europe is the second largest steel producer after China, accounting for 17.2 % of global steel production in that year (WoRld Steel aSSociation 2019).
The foundry industry was the second largest nat-ural graphite-consuming industry in Europe in 2018. At approximately 28,000 t, second to China and overall Asian consumption, it remains an important consumer of natural graphite in Europe. The foundry industry is closely linked to the perfor-mance of the steel sector and consumption is pre-dominantly in casting products for the automotive industry, which, with 24 % of global motor vehi-cles output in 2018, represents another industry of major economic importance to Europe (ACEA 2019).
5.3 Remaining world natural graphite consumption
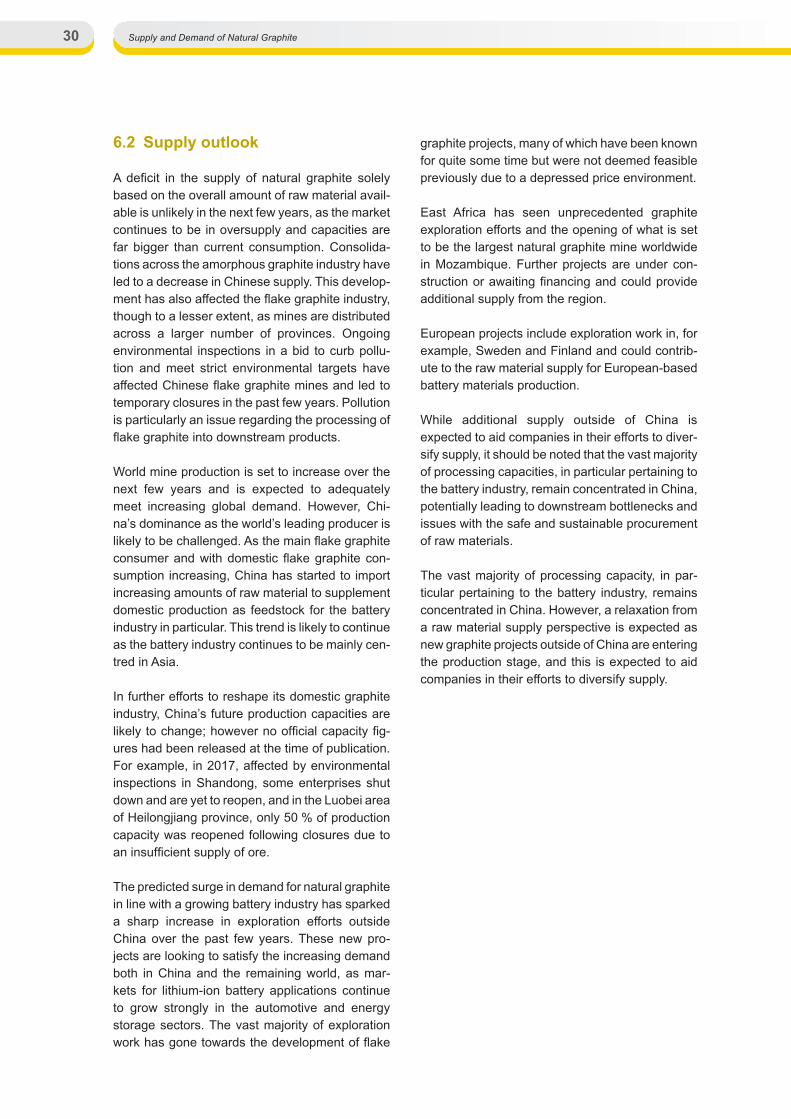
Figure 17 shows global natural graphite consump-tion by region (RoSkill 2019), with, at 65 %, Asian consumption (including China) accounting for the major share. Consistent with global consumption trends, the refractory industry was the major nat-ural graphite-consuming industry; it was highest in countries with large refractory and steel-related
industries, such as the USA, India and Brazil. Indian refractory production grew particularly strongly over the past few years, in line with an increase in domestic steel production. Latin American refrac-tory production has also increased, driven by rising steel outputs in Brazil, Argentina and Mexico.
While the foundry industry in China is by far the most dominant consumer of natural graphite in this market segment, India has shown significant growth, with the North American foundry industry continuing to hold significant market share as well.
Approximately 98,000 t of natural graphite were consumed in battery applications worldwide in 2018, about 75 % of this in Asia, highlighting the focus of the region as the global centre of the lith-ium-ion battery value chain. The anode industry for the manufacture of lithium-ion batteries con-tinues to be concentrated in China, owing to a number of factors such as the availability of raw materials, location of processing facilities and the downstream manufacturing chain, as well as a strong domestic market. However, Japanese and Korean manufacturers continue to hold some mar-ket share, in particular with respect to high-perfor-mance materials.
Other important graphite-consuming industries outside China and Europe include the automotive sector, particularly in other Asian countries such as India and Japan.
Tab. 5: Apparent consumption of graphite in China for the years 2014 and 2018 (CNMIA 2019, CCIC 2019)
Market segmentPercent
2014 2018 CAGR
Refractory materials, steelmaking 47 37 –5.8
Batteries, sealing materials, carbon brushes 10 30 31.6
Lubricants, colloidal graphite, casting 23 9 –20.9
Brake linings, friction products 7 9 6.5
Pencils 12 6 –15.9
New materials, aerospace, etc. 1 9 73.2
Supply and Demand of Natural Graphite28
0
10
20
30
40
50
60
70
80
90
100
FrictionProducts
Foundries Lubricants GraphiteShapes
Refractories Batteries Recarburising Other
Per
cent
European Natural Graphite Consumption Global Natural Graphite Consumption
0
10
20
30
40
50
60
70
80
90
100
AsiaIncluding China
North America South America Other
Per
cent
RefractoriesLubricants
FoundriesRecarburising
BatteriesGraphite Shapes
Friction ProductsOther
Fig. 16: European natural graphite consumption in 2018 (RoSkill 2019)
Fig. 17: Global natural graphite consumption by region in 2018 (RoSkill 2019)

29Supply and Demand of Natural Graphite
6 Graphite industry outlook
6.1 Demand outlook
Global demand for natural graphite is forecast to increase by over 7 % annually until 2025, repre-senting a 67 % increase over consumption in 2018 (Tab. 6). The steel industry has traditionally been a major driver for the consumption of natural graphite through its use of refractory products. However, as demand from the refractory industry is forecast to remain constant over the next few years, due the slow growth of crude steel production and the use of higher efficiency furnaces, its share in global natural graphite demand is set to decrease, as it is eclipsed by the growing demand from the battery sector. Depending on economic factors, such as market penetration and uptake, compound annual growth rates for the battery sector are the only application to reach double digits, as more and more countries around the world are stepping up their efforts to pro-mote the development and utilisation of renewable
energy in a move towards a lower emissions future in the transport and energy sectors.
Global flake graphite demand is expected to increase at a slightly higher rate of almost 10 % p.a. until 2025, mainly on the back of the develop-ing battery industry, where flake graphite is used in the manufacture of spherical graphite for lithi-um-ion batteries for high-performance applications such as electric vehicles. Demand for amorphous graphite is expected to decrease over the same period by approximately 2 % p.a. One reason for this decrease in demand is the increasing availabil-ity of fines from spherical graphite production.
Chinese natural graphite consumption is expected to be in excess of 1.3m t in 2020 (ICMNR 2019), with flake graphite accounting for over 73 %. Mirror- ing the global trend of a decrease in consumption for traditional applications such as refractories, lubricants and pencils, growth rates for Chinese consumption are highest in new energy materials applications such as batteries (Tab. 7).
Tab. 6: Current and future demand for major natural graphite applications (RoSkill 2019)
Market segment2018 consumption
in thousand t2025 demandin thousand t
CAGR
Batteries 133 695 27
Refractories 436 437 < 1
Foundries 133 152 < 1
Other 245 298 2
TOTAL 947 1,582 7.6
Tab. 7: Market demand and future forecast for flake graphite products in China (ICMNR 2019)
Market segmentPercent market share
2014 2018 2020
Refractory materials, steelmaking 47 37 26
Batteries, sealing materials, carbon brushes 10 30 35
Lubricants, colloidal graphite, casting 23 9 8
Brake linings, friction products 7 9 9
Pencils 12 6 5
New materials, aerospace, etc. 1 9 17
Supply and Demand of Natural Graphite30
6.2 Supply outlook
A deficit in the supply of natural graphite solely based on the overall amount of raw material avail-able is unlikely in the next few years, as the market continues to be in oversupply and capacities are far bigger than current consumption. Consolida-tions across the amorphous graphite industry have led to a decrease in Chinese supply. This develop-ment has also affected the flake graphite industry, though to a lesser extent, as mines are distributed across a larger number of provinces. Ongoing environmental inspections in a bid to curb pollu-tion and meet strict environmental targets have affected Chinese flake graphite mines and led to temporary closures in the past few years. Pollution is particularly an issue regarding the processing of flake graphite into downstream products.
World mine production is set to increase over the next few years and is expected to adequately meet increasing global demand. However, Chi-na’s dominance as the world’s leading producer is likely to be challenged. As the main flake graphite consumer and with domestic flake graphite con-sumption increasing, China has started to import increasing amounts of raw material to supplement domestic production as feedstock for the battery industry in particular. This trend is likely to continue as the battery industry continues to be mainly cen-tred in Asia.
In further efforts to reshape its domestic graphite industry, China’s future production capacities are likely to change; however no official capacity fig-ures had been released at the time of publication. For example, in 2017, affected by environmental inspections in Shandong, some enterprises shut down and are yet to reopen, and in the Luobei area of Heilongjiang province, only 50 % of production capacity was reopened following closures due to an insufficient supply of ore.
The predicted surge in demand for natural graphite in line with a growing battery industry has sparked a sharp increase in exploration efforts outside China over the past few years. These new pro-jects are looking to satisfy the increasing demand both in China and the remaining world, as mar-kets for lithium-ion battery applications continue to grow strongly in the automotive and energy storage sectors. The vast majority of exploration work has gone towards the development of flake
graphite projects, many of which have been known for quite some time but were not deemed feasible previously due to a depressed price environment.
East Africa has seen unprecedented graphite exploration efforts and the opening of what is set to be the largest natural graphite mine worldwide in Mozambique. Further projects are under con-struction or awaiting financing and could provide additional supply from the region.
European projects include exploration work in, for example, Sweden and Finland and could contrib-ute to the raw material supply for European-based battery materials production.
While additional supply outside of China is expected to aid companies in their efforts to diver-sify supply, it should be noted that the vast majority of processing capacities, in particular pertaining to the battery industry, remain concentrated in China, potentially leading to downstream bottlenecks and issues with the safe and sustainable procurement of raw materials.
The vast majority of processing capacity, in par-ticular pertaining to the battery industry, remains concentrated in China. However, a relaxation from a raw material supply perspective is expected as new graphite projects outside of China are entering the production stage, and this is expected to aid companies in their efforts to diversify supply.
31Supply and Demand of Natural Graphite
7 References
acea – euRoPean automobile manufactuReRS aSSociation (2019): The Automobile Industry Pocket Guide 2019/2020. – 82 p.; Brussels, Belgium – URL: https://www.acea.be/uploads/publications/ ACEA_Pocket_Guide_2019-2020.pdf [Accessed 06/2020].
bgR – fedeRal inStitute foR geoScienceS and natuRal ReSouRceS (2020): Fachinformations-system Rohstoffe. – unpublished; Hannover. [Accessed 06/2020].
cnmia – infoRmation centRe of miniStRy of nat-uRal ReSouRceS & china non-metallic mateRi-alS induStRy aSSociation (2019): Analysis on the Development Potential of Graphite Resources for Graphene Industry in China. – unpublished.
ccic – china cuStomS infoRmation centeR (2019): Mineral Commodity Trade Database. – Unpublished; Beijing, China.
eagle gRaPhite (2020): Company website. – URL: https://www.eaglegraphite.com/operations [Accessed 06/2020].
icmnR – china infoRmation centeR of the miniS-tRy of natuRal ReSouRceS (2019): China Mineral Resources. – Geological Publishing House; Bei-jing, China.
ihS maRkit– global tRade atlaS (2020): Com-mercial online database. – URL: https://my.ihs.com/Connect [Accessed 05/2020].
ibm – indian buReau of mineS (2019): Indian Min-erals Yearbook 2018 (Part III: Mineral Reviews), 57th Edition: Graphite (Advance Release). 13 p. – Nagpur, India. – URL: https://ibm.gov.in/index.php?c=pages&m=index&id=107&mid=24021 [Accessed 06/2020].
kaRabacak (2018): Oysu Graphite Project, Novem-ber 2018 Update. 55 p. – URL: https://www. nardera.com/wp-content/uploads/2018/12/Oysu-Graphite-Project-Report.pdf [Accessed 06/2020].
kRaSnoyaRSk gRafit (2020): company website. https://www.graphite-ore.com/en/about-us-en.html [Accessed 06/2020].
mineRal commoditieS (2020): company web-site. – URL: https://www.mineralcommodities.com/operations-projects/graphite/norway/ [Accessed 06/2020].
ngu – noRWegian geological SuRvey (2015): The graphite potential of Norway; targets galore. In: Focus No. 8 (August 2015). 2 p. Trondheim. – URL: https://www.ngu.no/sites/default/files/Focus_nr_Graphite_Potential_lowres_0.pdf [Accessed 06/2020].
RobinSon, g. R., JR., hammaRStRom, J. m., and olSon, d. W., 2017, gRaPhite, chaP. J of Schulz, k. J., deyoung, J. h., JR., Seal, R. R., ii, and bRad-ley, d. c. (eds.) (2017): Critical mineral resources of the United States — Economic and environmen-tal geology and prospects for future supply: U.S. Geological Survey Professional Paper 1802, pp. J1– J24. – URL: https://pubs.usgs.gov/pp/1802/j/pp1802j.pdf [Accessed 06/2020].
RoSkill infoRmation SeRviceS ltd. (2019): Natural and synthetic graphite: Global Industry, Markets & Outlook. 548p; London, UK.
S & P global (2020): SNL Metals & Mining, a group within S & P Global Mining Intelligence. – Commer-cial online database; Charlottesville, USA. – URL: https://platform.marketintelligence.spglobal.com/ [Accessed 06/2020].
ScogingS, a. (2015): Graphite: Where Size Matters. In: Australia’s Paydirt (2015): 2 p. – URL: https://www.csaglobal.com/wp-content/uploads/2019/07/PaydirtMarch.pdf [Accessed: 06/2020].
Simandl, g. J., PaRadiS, S., and akam, C., (2015): Graphite deposit types, their origin, and economic significance. – In: Simandl, G. J. and neetz, M. (eds.): Symposium on Strategic and Critical Mate-rials Proceedings, November 13 – 14, 2015, Vic-toria, British Columbia, British Columbia Ministry of Energy and Mines, British Columbia Geologi-cal Survey Paper 2015-3, p. 163 – 171. – URL: http://cmscontent.nrs.gov.bc.ca/geoscience/ PublicationCatalogue/Paper/BCGS_P2015-03-19_Simandl.pdf [Accessed 06/2020].
SyRah ReSouRceS (2020): Syrah Resources business: Balama overview. – URL: http://www.syrahresources.com.au/balama-project [Accessed 06/2020].
Supply and Demand of Natural Graphite32
uRalgRaPhite (2020): Russian natural graphite mining company. – URL: http://uralgraphite.com/en/ [Accessed 06/2020].
uSgS – u.S. geological SuRvey (2020): Min-eral commodity summaries 2020. – 200 p. – URL: https://pubs.usgs.gov/periodicals/mcs2020/mcs2020.pdf [Accessed 06/2020].
WoRld Steel aSSociation (2019): World Steel in Figures 2019. – 17 p. – URL: https://www.worldsteel.org/en/dam/jcr:96d7a585-e6b2-4d63-b943-4cd9ab621a91/World%2520Steel %2520in%2520Figures%25202019.pdf [Accessed 06/2020].

Wilhelmstraße 25 – 3013593 BerlinTel.: +49 30 36993 [email protected]
ISBN: 978-3-948532-10-9 (PDF)ISSN: 2193-5319