SUPPLEMENTARY INFORMATION - Nature M. Kelly, Christoffer Åberg, Ester Polo, Ann O’Connell,...
73
Philip M. Kelly, Christoffer Åberg, Ester Polo, Ann O’Connell, Jennifer Cookman, Jonathan Fallon, Željka Krpetić, Kenneth A. Dawson Mapping protein binding sites on the biomolecular corona of nanoparticles SUPPLEMENTARY INFORMATION DOI: 10.1038/NNANO.2015.47 NATURE NANOTECHNOLOGY | www.nature.com/naturenanotechnology 1 © 2015 Macmillan Publishers Limited. All rights reserved
Transcript of SUPPLEMENTARY INFORMATION - Nature M. Kelly, Christoffer Åberg, Ester Polo, Ann O’Connell,...

Supplementary Information: Mapping protein binding sites on the biomolecular corona of nanoparticles
1
Supplementary Information
Mapping protein binding sites on the biomolecular corona of nanoparticles
Philip M. Kelly, Christoffer Åberg, Ester Polo, Ann O’Connell, Jennifer Cookman, Jonathan
Fallon, Željka Krpetić, Kenneth A. Dawson
Mapping protein binding sites on the biomolecular corona of nanoparticles
SUPPLEMENTARY INFORMATIONDOI: 10.1038/NNANO.2015.47
NATURE NANOTECHNOLOGY | www.nature.com/naturenanotechnology 1
© 2015 Macmillan Publishers Limited. All rights reserved

Supplementary Information: Mapping protein binding sites on the biomolecular corona of nanoparticles
2
Table of Contents
Table of Contents ........................................................................................................... 2
Abbreviations ................................................................................................................. 6
1. Materials .................................................................................................................... 7
1.1 Chemicals ............................................................................................................. 7
1.2 Commercial Nanoparticles................................................................................... 8
1.3 Antibodies ............................................................................................................ 8
1.4 Biological Fluids .................................................................................................. 9
2. Optimisation and Characterisation of Nanoparticles ............................................... 10
2.1. Preparation of Immunogold Labels .................................................................. 10
2.1.1 Preparation of Gold Nanoparticles .............................................................. 10
2.1.2 Optimisation of Immunogold Labels .......................................................... 11
2.2 Characterisation of Immunogold Labels ............................................................ 12
2.2.1 UV-visible Spectroscopy ............................................................................ 12
2.2.2. Differential Centrifugal Sedimentation (DCS) .......................................... 12
2.2.3 Transmission Electron Microscopy (TEM) ................................................ 13
2.3 Preparation of Transferrin-Coated Polystyrene and Human Plasma Corona
Systems .................................................................................................................... 15
2.3.1 Preparation and Characterisation of Transferrin-Coated Polystyrene ........ 15
2.4 Characterisation of Transferrin-Coated Polystyrene and Human Plasma Corona
Systems. ................................................................................................................... 17
2.4.1. Characterisation of Transferrin-Coated Polystyrene and Human Plasma
Corona Nanoparticles........................................................................................... 17
© 2015 Macmillan Publishers Limited. All rights reserved

Supplementary Information: Mapping protein binding sites on the biomolecular corona of nanoparticles
3
2.4.2 Sodium Dodecyl Sulphate Polyacrylamide Gel Electrophoresis (SDS-
PAGE) .................................................................................................................. 18
2.4.3. Protein Assay (Micro Bicinchoninic Acid Assay - µ-BCA) ...................... 18
3. Transferrin-Coated Polystyrene ............................................................................... 21
3.1 Resolving Power of DCS technique .................................................................. 21
3.2 Kinetic Studies of the Labelling of Epitopes with Immunogold ........................... 22
3.3 Single Titrations ................................................................................................. 22
3.4 Double Titrations ............................................................................................... 23
3.5 Stability of the Transferrin Layer ...................................................................... 24
3.6 Counting of the Immunogold Labels ................................................................. 26
4 Investigation of the Biomolecular Corona formed from Human Plasma on
Carboxylated Polystyrene Nanoparticles ..................................................................... 27
4.1 DCS measurements for Epitope Mapping of the Biomolecular Corona formed
from Human Plasma on Carboxylated Polystyrene Nanoparticles .......................... 27
4.2 Control experiments for the Mapping Human Plasma Coronae ........................ 28
4.3 Depleted Plasma Controls .................................................................................. 29
5. Mass Spectrometry and Dot Blots ........................................................................... 30
5.1 Mass Spectrometry Characterisation ................................................................. 30
5.2 Protein Dot Blots................................................................................................ 32
5.2. Nanoparticle Immuno-Blots.............................................................................. 34
6. Versatility of the Method: Labelling of Gold Nanoparticle Systems and 80 nm
Polystyrene ................................................................................................................... 36
6.1 Preparation of Gold Nanoparticles (45 nm) ....................................................... 36
© 2015 Macmillan Publishers Limited. All rights reserved

Supplementary Information: Mapping protein binding sites on the biomolecular corona of nanoparticles
4
6.2 Preparation of Transferrin-Coated Gold Nanoparticles ..................................... 36
6.3 Labelling of Transferrin Epitopes of Gold Nanoparticles ................................. 37
6.4. Mapping the 80 nm Polystyrene Nanoparticles ................................................ 38
7. Electron Microscopy Characterisation of Protein Corona ...................................... 39
7.1 Transmission Electron Microscopy Imaging ................................................ 39
7.2 Processing of the Protein-Coated Nanoparticles for EM Imaging ................ 39
7.3 TEM Imaging and Advanced Analysis of Transferrin-Coated Polystyrene . 40
7.4 3D Reconstruction of a Transferrin-Coated Polystyrene Nanoparticle from
STEM Micrographs ................................................................................................. 44
8. Biological Interaction of Transferrin-Coated Polystyrene ....................................... 47
8.1 Interactions between Transferrin Receptor and Transferrin-Coated Polystyrene
.................................................................................................................................. 47
8.2 The Role of Iron in Transferrin-Transferrin Receptor Binding on the Surface of
Nanoparticles. .......................................................................................................... 50
8.2.1 Characterisation of apo and holo Transferrin ............................................. 50
9. Pairwise Correlations ............................................................................................... 54
10. Assessing the State of Transferrin Denaturation on the Surface of Nanoparticles 55
11. Scatchard Binding Model ...................................................................................... 58
12. Reproducibility and Errors ..................................................................................... 60
References .................................................................................................................... 62
Supplementary Discussion 1 ........................................................................................ 63
Estimating the Number of Immunogold Labels from DCS data ................................. 63
Defining an apparent diameter ................................................................................. 63
Estimating the Number of Immunogold Labels from DCS data ............................. 65
© 2015 Macmillan Publishers Limited. All rights reserved

Supplementary Information: Mapping protein binding sites on the biomolecular corona of nanoparticles
5
References ................................................................................................................ 66
Supplementary Discussion 2 ........................................................................................ 67
Density Correlation Functions on a Sphere ................................................................. 67
Analytical Distribution of Pair-Wise Geodesic Distances for a Completely
Random Placement of Objects (Ideal Gas) .......................................................... 67
Analytical Distribution of Pair-Wise Projected Distances for a Completely
Random Placement of Objects (Ideal Gas) .......................................................... 68
Comparison between Distribution of Pair-Wise Distances for Completely
Random Placement of Objects and Non-Overlapping Objects (Ideal and Hard
Sphere Gases)....................................................................................................... 71
References ................................................................................................................ 73
© 2015 Macmillan Publishers Limited. All rights reserved

Supplementary Information: Mapping protein binding sites on the biomolecular corona of nanoparticles
6
Abbreviations
PBS: Phosphate Buffered Saline
BSA: Bovine Serum Albumin
cAB: polyclonal anti-R Phycoethrythrin
CD: Circular Dichroism
DCS: Differential Centrifugal Sedimentation
DLS: Dynamic Light Scattering
EDX: Energy-Dispersive X-ray spectroscopy
EM: Electron Microscopy
mTf: monoclonal anti-Transferrin
mIgG: anti-Immunoglobulin G
pTf: polyclonal anti-Transferrin
pIgG: polyclonal anti-Immunoglobulin G
SDS-PAGE: Sodium Dodecyl Sulphate Polyacrylamide Gel Electrophoresis
STEM: Scanning Transmission Electron Microscopy
TEM: Transmission Electron Microscopy
UV: Ultraviolet
µ-BCA: Micro Bicinchoninic Acid Assay
© 2015 Macmillan Publishers Limited. All rights reserved

Supplementary Information: Mapping protein binding sites on the biomolecular corona of nanoparticles
7
1. Materials
1.1 Chemicals
All chemicals were of highest grade available, purchased from Sigma Aldrich and
used as received:
Human Transferrin (T4132), MES Hydrate (M2933), Tannic acid (16201), Sodium
citrate (S1804), Ascorbic acid (A5960), Albumin from bovine serum (A7906), PBS
Tablets (P4411), Gold(III) chloride trihydrate (520918), Ethylenediaminetetraacetic
acid disodium salt dihydrate (252352). Dodecane (D22110), IgG from human serum
(I4506), Skimmed milk powder (70166), Tris(2-carboxyethyl)phosphine
hydrochloride (C4706), Sodium dodecyl sulfate (L3771), Glycine (G8898),
Ammonium persulfate (A3678), N,N,N′,N′-Tetramethylethylenediamine (T9281),
Sucrose (m117).
In addition:
- Polystyrene calibration standard for DCS measurements 497 nm (PS000497)
and PVC calibration standard 476 nm (PVC000476) were purchased from
Analytik Ltd.
- Color Plus Pre-stained Protein Ladder, Broad Range (10-230 kDa) (P7711S)
and Blue Loading Buffer for SDS-PAGE were ordered from New England
Bio-Labs (cat. no. B7703S)
- Micro BCA Protein Assay Kit and Pierce ECL (cat. no. 23235) was purchased
from Pierce
- 2D Silver Stain Kit II [Daiichi] (167997) was purchased from Insight
biotechnology
© 2015 Macmillan Publishers Limited. All rights reserved

Supplementary Information: Mapping protein binding sites on the biomolecular corona of nanoparticles
8
- Westran Clear Signal, 0.45 μm PVDF blotting membrane (Z671061) was
obtained from Sigma.
1.2 Commercial Nanoparticles
- i) Polystyrene 200 nm (cat. No. 07304) Polybead Polystyrene Microspheres
(Polysciences Inc.)
- ii) Carboxylated polystyrene 200 nm (cat. No. F8811) Fluospheres
carboxylate-modified microspheres (Invitrogen)
1.3 Antibodies
All primary antibodies were purchased from Abcam, stored long term at -20°C and
for short term use at 4°C:
- ab769: Mouse monoclonal anti-human Transferrin [HTF-14] (mTf)
- ab1223: Rabbit polyclonal anti-human Transferrin (pTf)
- ab99770: Mouse monoclonal H2 anti-human IgG Fc domain (mIgG)
- ab6715: Rabbit polyclonal anti-human IgG H&L (whole IgG) (pIgG)
- ab117263: Anti-R Phycoerythrin antibody (cAb)
- ab1086: Mouse monoclonal Anti-Transferrin Receptor (αTfR)
Secondary antibodies were sourced from Invitrogen:
- A11029: Alexa Fluor® 488 Goat Anti-Mouse IgG (H+L) Antibody, highly
cross-adsorbed
- A-11034: Alexa Fluor® 488 Goat Anti-Rabbit IgG (H+L) Antibody, highly
cross-adsorbed
Transferrin receptor was obtained from R&D systems (cat no 2474-TR-050).
© 2015 Macmillan Publishers Limited. All rights reserved

Supplementary Information: Mapping protein binding sites on the biomolecular corona of nanoparticles
9
1.4 Biological Fluids
- Human Plasma was obtained from the Irish Blood Transfusion Service. Total protein
content was estimated to be ca. 80 mg/ml by micro bicinchoninic acid assay (µ-BCA).
Plasma was defrosted and centrifuged at 16200 RCF for 3 min prior to use.
- Human plasma depleted of transferrin was prepared as described previously.1
Briefly, antibodies against human transferrin were conjugated to the matrix of a
chromatography column. Human plasma was then passed through the column and the
flow through collected. The transferrin was removed from the column using Agilent
Buffer B (5185-5988). The column was subsequently equilibrated in PBS and the
process repeated. The quality of the depleted serum was verified by western blot.
© 2015 Macmillan Publishers Limited. All rights reserved

Supplementary Information: Mapping protein binding sites on the biomolecular corona of nanoparticles
10
2. Optimisation and Characterisation of Nanoparticles
2.1. Preparation of Immunogold Labels
2.1.1 Preparation of Gold Nanoparticles
4-5 nm gold nanoparticles were produced according to the Slot-Geuze method.2,3
Briefly, a reducing solution was prepared (10 ml final volume) containing 0.2% w/w
trisodium citrate, 0.05% w/w tannic acid and 1.25 mM K2CO3. Subsequently, a
0.0125% w/w solution of aqueous HAuCl4 solution was prepared (40 ml). All the
solutions were filtered through a 0.2 µm Millipore® syringe filter before use. The two
solutions were then heated to 60˚C. The HAuCl4 was transferred to a round bottom
flask boiled under reflux, the reducing solution was added once the boiling had
commenced, and the reaction was allowed to boil under constant stirring for 2 min. A
colour change was observed to a deep orange-red upon completion of the reaction.
The colloidal dispersion was then placed on ice to stop the reaction and cooled to
room temperature. The pH of the dispersion was adjusted to 8.5 with 0.4 M NaOH.
For this, pH paper [pH-Fix 0-14, Fisherbrand] was used. Finally, the particles were
filtered through a 0.2 µm Millipore® syringe filter and stored at 4˚C before use.
© 2015 Macmillan Publishers Limited. All rights reserved

Supplementary Information: Mapping protein binding sites on the biomolecular corona of nanoparticles
11
2.1.2 Optimisation of Immunogold Labels
Preparation of Antibody Conjugated Gold Labelling Agents
To prepare immunogold labels, the optimal antibody concentration was determined by
performing a colorimetric salt aggregation test. The particles were characterised using
UV-visible spectroscopy, DCS and TEM (Supplementary Fig. S1-2). Briefly, a range
of antibody amounts (0-10 µg) in total volumes of 20 µl of PBS was added to 250 µl
of the gold colloid. To this 100 µl of 10% NaCl was added and the colour change was
observed after 10 min to determine the lowest amount of antibody that stabilises the
gold particles, that is, where no colour change to blue was observed.
The optimal concentration of antibodies determined for each antibody type is reported
in Supplementary Table S1. 0.25 ml of gold colloid was incubated with this optimised
concentration for 10 min. As a further optimisation step co-incubation of BSA and
antibodies with the gold nanoparticles was investigated and it was found that this
improved the reproducibility of the final dispersion across the board. In some cases
the initial amount of BSA was increased to aid in maintaining the colloidal stability;
this was subsequently reduced to 0.1% w/w with subsequent washes. The prepared
particles were centrifuged and washed to remove excess antibodies at 20000 x g (30
min, 4˚C). The supernatant was then removed and the loose part of the pellet collected
and washed with 0.1% w/w BSA for a total of 4 washes. Centrifugation of these small
gold nanoparticles was achieved in a standard centrifuge [Eppendorf 5810R] by
reducing the volume per tube to 75 µl. This eliminated the need to use an
ultracentrifuge. After washing, the pellets were combined and the concentration of the
antibody-conjugated gold nanoparticles was determined via UV-visible spectroscopy4
and the dispersion measured using DCS (Supplementary Fig. S1a and Supplementary
Table S2).
© 2015 Macmillan Publishers Limited. All rights reserved

Supplementary Information: Mapping protein binding sites on the biomolecular corona of nanoparticles
12
Table S1: Optimised antibody conditions for the preparation of each immunogold label.
ID Antibody added (µg/250µl) cBSA (w/v)
mTF 4 0.12%
pTf 10 0.2%
mIgG 3 0.1%
pIgG 10 0.16%
BSA 0 0.4%
cAb 8 0.3%
2.2 Characterisation of Immunogold Labels
2.2.1 UV-visible Spectroscopy
UV-visible spectra were recorded on a Cary 600i UV-visible spectrophotometer using
a 1 cm path length quartz cells, measuring in the 400-800 nm range (Supplementary
Fig. S1b). Concentration of the antibody-conjugated immunogold labels was
determined using the molar extinction coefficient value 9.696 106 M
-1 cm
-1 for
calculations.4 The antibody conjugated gold colloids were used in the 0-400 nM
concentration range for subsequent titrations.
2.2.2. Differential Centrifugal Sedimentation (DCS)
All DCS measurements of gold nanoparticles were carried out using an 8-24%
sucrose density gradient using PBS as the aqueous component, with a disc speed set
to 24000 rpm while monitoring the 0-100 nm range. Each particle size measurement
was calibrated using a PVC standard of nominal diameter 476 nm. No particle
aggregation was observed in the investigated size range. Particle size distributions of
as prepared and antibody-conjugated immunogold is shown in Supplementary Fig. S1
and diameters measured reported in Supplementary Table S2.
© 2015 Macmillan Publishers Limited. All rights reserved

Supplementary Information: Mapping protein binding sites on the biomolecular corona of nanoparticles
13
Figure S1: Characterisation of immunogold labels. a, DCS measurements of all immunogold labels
used. A shift to smaller apparent diameters for the immunogold labels is observed and is consistent
with a protein layer coating these objects increasing their sedimentation time through a gradient. b,
UV-visible spectra showing gold nanoparticles before and after antibody conjugation.
Table S2: DCS measurements of immunogold labels showing numerical values for peak diameters for
each type based on the nanoparticle weight distributions in Supplementary Fig. S1a.
ID Diameter (nm) Half Width (nm)
gold 4.6 0.9
mTf 3.5 0.9
pTf 3.4 0.9
mIgG 3.4 1.2
pIgG 3.5 0.9
BSA 3.6 0.9
cAb 3.6 0.9
2.2.3 Transmission Electron Microscopy (TEM)
FEI Tecnai G2 20 Twin TEM operating at accelerating voltage of 200 kV was utilised
for imaging. For particle mean diameter determination, images were processed using
TEM Imaging & Analysis (TIA) software. Samples for TEM imaging were prepared
© 2015 Macmillan Publishers Limited. All rights reserved

Supplementary Information: Mapping protein binding sites on the biomolecular corona of nanoparticles
14
by evaporating ca. 10 μ; of the colloidal dispersion onto formvar-coated copper grids
(Agar Scientific), 400 mesh.
Figure S2: TEM characterization of nanoparticles. a, TEM micrograph of gold nanoparticles used
for immunogold labelling experiments. Scale bar 50 nm. b, TEM micrograph of sulphonate polystyrene
nanoparticles. Scale bar 500 nm.
a
a
b
a
500nm
© 2015 Macmillan Publishers Limited. All rights reserved

Supplementary Information: Mapping protein binding sites on the biomolecular corona of nanoparticles
15
2.3 Preparation of Transferrin-Coated Polystyrene and Human Plasma
Corona Systems
2.3.1 Preparation and Characterisation of Transferrin-Coated Polystyrene
The amount of transferrin protein required to saturate the surface of the nanoparticles
(diameter 220 nm by electron microscopy) was determined by three independant
techniques. For this, transferrin was dissolved in 2-(N-morpholino) ethanesulfonic
acid (MES) buffer (50 mM, pH 6.0). Polystyrene nanoparticles (1 mg/ml) were
incubated with transferrin at different concentrations (0.1-5 mg/ml) for 1 h at room
temperature. The nanoparticles were then washed by successive cycles of
centrifugation at 20000 x g for 10 min re-dispersed in the same volume of buffer. In
total the nanoparticles underwent three washes in MES buffer and a further two
washes with PBS (137 mM, pH 7.4) to remove any unbound proteins. The particles
were then analysed by SDS-PAGE, Bicinchoninic- Acid Protein Assay and DCS
(Supplementary Fig. S3).
For preparation of human plasma corona on carboxylated polystyrene nanoparticles
see Methods section of the main text.
© 2015 Macmillan Publishers Limited. All rights reserved

Supplementary Information: Mapping protein binding sites on the biomolecular corona of nanoparticles
16
Table S3: Size and ζ potential measurements of bare and corona-coated polystyrene nanoparticles
measured using Dynamic Light Scattering (DLS) and laser doppler velocimetry, respectively.
Diameter ζ Potential
z-avg
(nm)
σ (nm)
n=3
PDI ζ
(mV)
σ (nm)
n=3
conductivity
(mS/cm)
σ (mS/cm)
n=3
Water
polystyrene (220 nm*) 235 1.5 0.02 -39 0.7 0.0 0.0
transferrin-coated
polystyrene
244 6.9 0.02 -31 1.2 1.1 0.0
carboxylated
polystyrene (200 nm)*
210 1.0 0.02 -42 0.4 0.0 0.0
human plasma corona
on carboxylated
polystyrene
258 3.2 0.02 -21 1.2 2.3 0.1
transferrin-depleted
human plasma corona
on carboxylated
polystyrene
270 2.1 0.03 -20 0.9 1.9 0.1
PBS pH 7.4
polystyrene (220 nm*) 308 10.9 0.13 -19 1.3 18.3 1.4
transferrin-coated
polystyrene
248 3.2 0.01 -9 1.6 19.1 1.9
carboxylated
polystyrene (200 nm)*
198 1.2 0.02 -42 4.9 16.6 1.2
human plasma corona
on carboxylated
polystyrene
291 8.2 0.18 -12 3.2 18.7 1.7
transferrin-depleted
human plasma corona
on carboxylated
polystyrene
256 3.6 0.02 -11 2.6 19.2 1.9
* by TEM
© 2015 Macmillan Publishers Limited. All rights reserved

Supplementary Information: Mapping protein binding sites on the biomolecular corona of nanoparticles
17
2.4 Characterisation of Transferrin-Coated Polystyrene and Human
Plasma Corona Systems.
2.4.1. Characterisation of Transferrin-Coated Polystyrene and Human Plasma Corona Nanoparticles
Dynamic light scattering (DLS) was used to characterise the size and dispersion state
of the polystyrene nanoparticles before and after coating with proteins. In addition,
the ζ potential of the particles was determined using laser doppler velocimetry. Size
and ζ potential measurements reported are an average of three independant
measurements, with each measurement consisting of an accumulation of 105 runs.
Both measurements types were carried out in water and in PBS (137 mM, pH 7.4) for
each sample using a Malvern Zetasizer instrument (Supplementary Table S3).
In addition, particle size and dispersion of the transferrin-coated polystyrene and
human plasma-coated carboxylated polystyrene nanoparticles were measured using a
DCS technique. Moreover, this technique was used to characterise the particle
systems before and after incubation with immunogold labels. The analysis and
titrations with immunogold labels were performed on a 2-8% sucrose density gradient
in PBS used as the aqueous component with a disc speed set to 24000 rpm measuring
in a diameter range from 20 to 1500 nm. Each measurement was calibrated using a
polystyrene standard of nominal size 497 nm. Results are shown in Supplementary
Fig. S3.
© 2015 Macmillan Publishers Limited. All rights reserved

Supplementary Information: Mapping protein binding sites on the biomolecular corona of nanoparticles
18
2.4.2 Sodium Dodecyl Sulphate Polyacrylamide Gel Electrophoresis (SDS-PAGE)
Proteins were separated using a 12% and 4% discontinuous Tris-Glycine SDS-PAGE
system. To remove the proteins from the surface of the nanoparticles, samples were
boiled in loading buffer containing 2% sodium dodecyl sulphate (SDS) and 40 mM
dithiothreitol (DTT). Gels were stained by Coomassie blue.
2.4.3. Protein Assay (Micro Bicinchoninic Acid Assay - µ-BCA)
The amount of protein adsorbed to the surface of the particles was quantified using a
bicinchoninic acid protein assay carried out following the protocol available from the
manufacturer. Briefly, 150 µl of the nanoparticle dispersion (1 mg/ml) was incubated
with 150 µl of working reagent for 1 h at 60°C. After incubation, the nanoparticles
were centrifuged out of solution to avoid contamination of the signal due to
scattering. The protein content was determined by comparing the absorbance of the
sample at (562 nm) with a calibration curve composed of BSA at known
concentrations.
© 2015 Macmillan Publishers Limited. All rights reserved

Supplementary Information: Mapping protein binding sites on the biomolecular corona of nanoparticles
19
Figure S3: Comparison of three techniques used to investigate the amount of protein attached to
the polystyrene nanoparticles. The results indicate that the polystyrene surface is completely covered
by proteins as verified by three independant techniques. The polystyrene nanoparticles were first
incubated with transferrin for 1 h and unbound protein removed by sequential centrifugation and
washing of the particles four times. a, DCS shows a shift in apparent diameter (black); mass of protein
attached per mg of polystyrene nanoparticles, determined using a micro bicinchoninic acid assay
(µBCA) protein assay (red); densitometry of the transferrin protein bands observed in an SDS-PAGE
gel, carried out using ImageJ; b, DCS measurements of polystyrene nanoparticles incubated with
increasing amounts of transferrin protein; c, SDS-PAGE gel showing the proteins attached to
polystyrene nanoparticles as a function of increasing transferrin concentration. The same concentration
of nanoparticles for each condition was loaded. Bands were visualised using a Coomassie blue stain.
© 2015 Macmillan Publishers Limited. All rights reserved

Supplementary Information: Mapping protein binding sites on the biomolecular corona of nanoparticles
20
Figure S4: SDS-PAGE characterisation of the proteins adsorbed to the polystyrene nanoparticles for
each of the conditions tested. (Left) transferrin-coated polystyrene; (centre) polystyrene coated with
human plasma at 80%; (right) polystyrene coated with human plasma depleted of transferrin. For the
transferrin-coated polystyrene nanoparticles low levels of contaminants or degradation products of
transferrin can be observed. Independant samples were run in duplicate or triplicate to demonstrate the
reproducibility of the coronae preparation. Proteins comprising the adsorbed layer in each case were
visualised using a silver staining kit.
© 2015 Macmillan Publishers Limited. All rights reserved

Supplementary Information: Mapping protein binding sites on the biomolecular corona of nanoparticles
21
3. Transferrin-Coated Polystyrene
3.1 Resolving Power of DCS technique
Differential Centrifugal Sedimentation (DCS) measurements were carried out using a
CPS Disc Centrifuge DC24000. Polystyrene samples were analysed using a 2-8%
sucrose density gradient prepared in PBS (0.137 M, pH 7.4) at a disc speed of 24000
rpm. Each measurement was calibrated with a polystyrene standard of nominal
diameter 497 nm.
Figure S5: Sample DCS measurement showing the separation of the peaks between unbound
immunogold labels and transferrin-coated polystyrene labelled with immunogolds. Note that the size of
the immunogold label is misrepresented on this axis as the measurement is calibrated for particles with
the same density as polystyrene, i.e., the size reported for the mTf immunogold label is the diameter a
polystyrene nanoparticle would have if it took the same time as the immunogold label to sediment
through the density gradient.
© 2015 Macmillan Publishers Limited. All rights reserved

Supplementary Information: Mapping protein binding sites on the biomolecular corona of nanoparticles
22
3.2 Kinetic Studies of the Labelling of Epitopes with Immunogold
To study the time evolution of antibody binding, transferrin-coated polystyrene
nanoparticles (50 µg/ml) were incubated with 25 nM mTf immunogold label. The
samples were injected into the DCS disc after different incubation times. The time
points reported correspond to the duration of the incubation prior to injection into the
density gradient.
Figure S6: Time resolved DCS measurements of immunogold binding to transferrin-coated
polystyrene nanoparticles. a, DCS distributions. Arrow shows direction of increasing time. b, Shift of
the peak position relative to the Transferrin coated polystyrene. Results show equilibrium is achieved
after 30 min incubation at room temperature.
3.3 Single Titrations
Transferrin-coated polystyrene nanoparticles (50 µg/ml) were incubated with
increasing concentrations of antibody-conjugated nanoparticles (1-300 nM) for 1 h at
room temperature. Following this incubation, the sample was injected neat into the
disc centrifuge. For TEM imaging, samples were prepared as follows: 10 µl aliquot of
each sample was taken and diluted to 100 µl with milli-Q water. The particles were
then centrifuged at 14000 rpm for 10 min and the supernatant discarded. This
cleaning step was repeated 3-7 times, depending on the amount of excess
immunogold present in the sample. Subsequently, 10 µl of the immunogold-labelled
© 2015 Macmillan Publishers Limited. All rights reserved

Supplementary Information: Mapping protein binding sites on the biomolecular corona of nanoparticles
23
transferrin-coated polystyrene particles were dried in a dry box onto formvar coated
copper grids (400 mesh) or Lacey carbon grids (Agar Scientific).
3.4 Double Titrations
For double titrations the polystyrene particles were incubated with one antibody-
conjugated immunogold type at a concentration corresponding to saturation. The
excess gold was washed away via successive cycles of centrifugation and re-
dispersion (three times). Subsequently, the sample was incubated with immunogold
labels conjugated to a different antibody. The samples were injected into the disc
centrifuge for analysis.
Figure S7: Full DCS distributions shifts for transferrin-coated polystyrene, corresponding to Fig
1. a, mTf immunogold labels; b, pTf; c, nanoparticles saturated with mTf immunogold labels, then
titrated with pTf. Distributions show the presence of a small side peak to the right of the distributions,
intrinsic to the original dispersion. This side peak is present in the stock nanoparticles and shifts
alongside the main peak after coating with protein and incubation with immunogold indicating no
further aggregation caused by the labelling/incubation process. For the purpose of clarity the
distributions were clipped at 60% of the peak height (dashed line) to aid with visualisation of the
distribution peak shifts in Fig. 1. The presence of the population of larger sizes does not influence the
smaller-sized population which comprises the majority of the distribution, as the DCS instrument is
capable of resolving individual populations of nanoparticles that differ from each other as little as 2%.
© 2015 Macmillan Publishers Limited. All rights reserved

Supplementary Information: Mapping protein binding sites on the biomolecular corona of nanoparticles
24
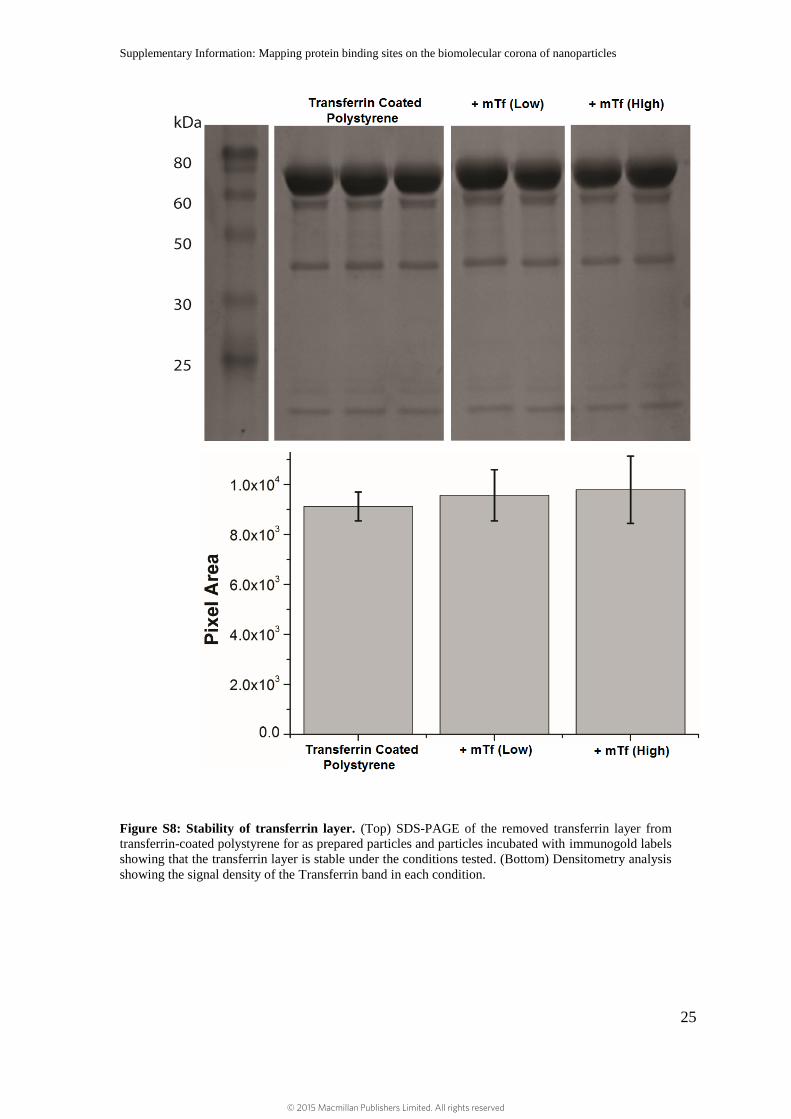
3.5 Stability of the Transferrin Layer
The stability of the transferrin layer was tested in order to ensure the protein remained
intact and was not removed during the labelling process. Transferrin-coated
polystyrene was labelled with low and medium amounts of mTf immungold labels,
i.e. 10 nM and 100 nM. All the samples were prepared in duplicate. The excess
immunogold was removed by three cycles of centrifugation and re-dispersion in fresh
PBS. As a control, unlabeled transferrin-coated polystyrene was also analysed in
triplicate. The transferrin layer was then removed from the particles and analysed by
SDS-PAGE. The intensity of the band corresponding to transferrin was subsequently
quantified using densitometry. The results showed no significant change in the
transferrin layer, as shown in Supplementary Fig. S8.
© 2015 Macmillan Publishers Limited. All rights reserved
Supplementary Information: Mapping protein binding sites on the biomolecular corona of nanoparticles
25
Figure S8: Stability of transferrin layer. (Top) SDS-PAGE of the removed transferrin layer from
transferrin-coated polystyrene for as prepared particles and particles incubated with immunogold labels
showing that the transferrin layer is stable under the conditions tested. (Bottom) Densitometry analysis
showing the signal density of the Transferrin band in each condition.
© 2015 Macmillan Publishers Limited. All rights reserved

Supplementary Information: Mapping protein binding sites on the biomolecular corona of nanoparticles
26
3.6 Counting of the Immunogold Labels
The number and locations of the immunogold labels on the polystyrene nanoparticles
were counted manually using ImageJ software. For control purposes the same batches
of images were analysed by several independant people to eliminate experimental bias
and to estimate the variance between users.
To assess whether enough particles had been analysed to discuss the mean of the
population the average number of immunogold labels per polystyrene nanoparticle
was plotted as a function of the number of polystyrene nanoparticles investigated.
Supplementary Fig. S9 shows that the mean converges after several tens of
polystyrene nanoparticles.
Figure S9: Determination of a robust mean value of labelled epitopes for polystyrene
nanoparticles coated with transferrin and subsequently labelled with mTf (red) and pTf
immunogolds (black). The mean value of immunogold labels per polystyrene nanoparticle converges
after a few tens of images indicating a reasonable estimate of the mean number of epitopes labelled for
each condition.
© 2015 Macmillan Publishers Limited. All rights reserved

Supplementary Information: Mapping protein binding sites on the biomolecular corona of nanoparticles
27
4 Investigation of the Biomolecular Corona formed from Human
Plasma on Carboxylated Polystyrene Nanoparticles
4.1 DCS measurements for Epitope Mapping of the Biomolecular Corona
formed from Human Plasma on Carboxylated Polystyrene Nanoparticles
Figure S10: Full DCS distribution shifts for human plasma corona formed on carboxylated
polystyrene nanoparticles, corresponding to Fig. 4. a, mTf, b, pTf, c, mIgG d, pIgG. Arrows
correspond to direction of increasing concentration. For the purpose of clarity the distributions were
clipped at 60% of the peak height (dashed line) to aid with visualisation of the distribution peak shifts
in Fig. 4.
© 2015 Macmillan Publishers Limited. All rights reserved

Supplementary Information: Mapping protein binding sites on the biomolecular corona of nanoparticles
28
4.2 Control experiments for the Mapping Human Plasma Coronae
Control experiments include using immunogold labels prepared with:
(a, c) BSA, to exclude the influence of the interaction between the blocking agent and
the samples and
(b, d) An antibody raised against a marine protein (R-Phycoetherin) which has no
reported cross reactivity with human plasma proteins (cAb).
Figure S11: DCS distributions of controls shown in Fig. 2 and Fig. 4. a, Titration of BSA
immunogolds against transferrin-coated polystyrene nanoparticles. b, Titration of BSA immunogolds
against human plasma coronae formed on carboxylated polystyrene nanoparticles. c, Titration of cAB
immunogolds against transferrin-coated polystyrene nanoparticles. d, Titration of cAB immunogolds
against human plasma coronae formed on carboxylated polystyrene nanoparticles . Results show small
shifts for both controls used. The controls showed greater binding in the case of human plasma
coronae, which may be attributed to nonspecific binding due to the complex nature of coronae formed
from plasma.
© 2015 Macmillan Publishers Limited. All rights reserved

Supplementary Information: Mapping protein binding sites on the biomolecular corona of nanoparticles
29
4.3 Depleted Plasma Controls
To confirm that the interactions observed were indeed transferrin-mediated, human
plasma was depleted of transferrin and subsequently used to form a corona on
polystyrene nanoparticles. The resultant corona was probed with immunogolds with
mTf, pTf and cAb antibodies for unspecific binding. The results showed a minor
element of nonspecific binding in the case of the pTf (Supplementary Fig. S12b)
which was confirmed in later experiments.
Figure S12: Immunogold titrations for corona formed using plasma depleted of transferrin on
carboxylated polystyrene nanoparticles. Titration curves of a, mTF immunogolds; b, pTf and c, cAb.
d, Relative diameter shift for each of these titrations. Hollow symbols represent the saturation point
observed for corona derived from full plasma (including Transferrin) for each of the conditions. The
results show a decrease in immunogold binding for both mTf and cAb immunogold labels after
depletion of transferrin. However, pTf immunogold labels still shows comparable levels of binding,
indicating that in a real situation with a complex corona this particular polyclonal antibody has a
certain level of non-specific binding.
© 2015 Macmillan Publishers Limited. All rights reserved

Supplementary Information: Mapping protein binding sites on the biomolecular corona of nanoparticles
30
5. Mass Spectrometry and Dot Blots
5.1 Mass Spectrometry Characterisation
The biomolecular corona was stripped off the surface of the polystyrene nanoparticles
and analysed using SDS-PAGE. The gel was run for a ca. 10 min until the buffer line
was 1 cm past the interface between the stacking gel and the separation gel. This was
carried out to condense all the proteins into a single sample for mass spectrometry
analysis, thereby avoiding gel fractionation. The SDS-PAGE gel was stained using a
colloidal Coomassie stain in order to visualise the proteins. The gel section containing
the proteins was removed using a sterile scalpel and transferred to a clean 0.5 ml
sample tube which had been pre-rinsed with acetonitrile. The gel sections were
trypsin digested in gel. The samples were resuspended in 0.1% w/w formic acid prior
to analysis by electrospray liquid chromatography (LC-MS/MS). A HPLC-coupled to
a Thermofisher Q-Exactive was used to analyse the samples.
Spectra were analysed by label free quantification using MaxQuant 1.4.1.2.5 The
normalised spectral count for each protein was calculated using the following
equation.
𝑁𝑆𝑝𝐶 =
𝑆𝑝𝐶𝑀𝑤
⁄
∑(𝑆𝑝𝐶
𝑀𝑤⁄ )
(1)
© 2015 Macmillan Publishers Limited. All rights reserved

Supplementary Information: Mapping protein binding sites on the biomolecular corona of nanoparticles
31
Table S4: Mass Spectrometry identification of proteins in coronae formed from human plasma on
carboxylated polystyrene nanoparticles. Only the top most abundant proteins and proteins of interest
are shown.
ID Mol. weight (kDa) Uniprot acc. no. Protein identity NSpC*
1 55.928 P02675 Fibrinogen Beta Chain 18.74
2 50.322 P02679-2 Fibrinogen Gamma Chain 14.06
3 94.972 P02671-1 Fibrinogen Alpha Chain, 12.91
4 103.36 Q14624-1 Inter-alpha-trypsin inhibitor heavy
chain H4
9.85
5 71.957 P01042-1 Kininogen-1 8.02
6 54.305 P04004 Vitronectin 4.09
7 24.409 P00761 Trypsin 2.86
8 36.154 P02649 Apolipoprotein E 2.10
9 41.736 P60709 Actin cytoplasmic 1 2.08
10 59.578 P04196 HRG Histidine-rich glycoprotein 2.07
11 30.777 P02647 Apolipoprotein A-I 1.93
12 9.3318 P02654 Apolipoprotein C-I 1.78
13 69.366 P02768-1 Serum albumin 1.43
14 45.398 P06727 Apolipoprotein A-IV 1.22
15 70.108 P03951-1 Coagulation factor XI 1.02
16 10.845 P02776 Platelet factor 4 0.95
17 45.701 P05154 Plasma serine protease inhibitor 0.85
18 15.998 P68871 Hemoglobin subunit beta 0.77
19 57.832 P10909-1 Clusterin 0.70
20 16.55 P03950 Angiogenin 0.69
- - - - -
119 77.049 P02787 Sero Transferrin 0.013
121 51.098 P01859 Ig gamma-2 chain C region 0.014
© 2015 Macmillan Publishers Limited. All rights reserved

Supplementary Information: Mapping protein binding sites on the biomolecular corona of nanoparticles
32
5.2 Protein Dot Blots
Protein dot blots were used to verify the activity of the antibodies for their specific
antigen and to determine any level of cross-reactivity. In this experiment 1 µl of each
protein (transferrin, IgG, BSA) and fluid (plasma and plasma depleted of transferrin)
were spotted onto a PVDF membrane at four decreasing concentrations. For single
proteins 1, 0.2, 0.1 and 0.02 mg/ml was used; for plasma, owing to its complex
nature, 80, 16, 8 and 1.6 mg/ml was used. Each blot was blocked with 5% w/w
skimmed milk powder in PBS for 1 h at room temperature and subsequently
incubated with primary antibody dispersed in 5% w/w skimmed milk at a
concentration of 0.4 µg/ml for 1 h at room temperature. The blots were washed five
times with PBS and incubated with a fluorescent secondary antibody against the
primary host species, in this case anti-mouse 488 and anti-rabbit-488 (1 h, room
temperature). The blots were washed 5 times with PBS and allowed to dry in the dark.
Blots were subsequently imaged using a Syngene G:BOX imaging system using a
blue LED to excite the fluorophore with an emission filter of 525 nm. As a control,
blots were also incubated with secondary antibody after blocking to control for non-
specific secondary binding.
© 2015 Macmillan Publishers Limited. All rights reserved

Supplementary Information: Mapping protein binding sites on the biomolecular corona of nanoparticles
33
Figure S13: Dot blots with proteins immobilised on a PVDF membrane incubated with different
primary antibodies and visualised using two different secondary antibodies. For ease of
interpretation each section of the blots corresponding to an individual protein has been grouped to
analyse the reactivity of each antibody for individual proteins. In the case of the protein transferrin,
mTf and pTf recognise this protein and there is also some binding of pIgG. For human IgG spotted on
the membrane mIgG and pIgG show more binding than other antibodies. However, there is cross
reactivity observed between the secondary probes, secondary anti mouse, secondary anti rabbit and
human IgG. This is the origin of the signal obtained for the other antibodies. In the case of plasma
there is low level binding of mTf and pTf and strong binding of mIgG and pIgG. This is consistent with
the levels of transferrin and IgG present in human plasma.6 For plasma depleted of transferrin, low
level binding of mTf and pTF is observed, whereas the mIgG and pIgG binding is retained. No
appreciable binding was observed for BSA with any of the antibodies.
© 2015 Macmillan Publishers Limited. All rights reserved

Supplementary Information: Mapping protein binding sites on the biomolecular corona of nanoparticles
34
5.2. Nanoparticle Immuno-Blots
To examine how the antibodies interact with their antigens once they are adsorbed to
the surface of polystyrene nanoparticles, immuno-blots were performed.
Briefly, 1 µl of each antibody was spotted on a PVDF membrane from stocks of two
different concentrations (500 µg/ml) and (25 µg/ml). The membranes were blocked
with 5% w/w skimmed milk in PBS for 1 h at room temperature. The blots were then
washed twice with PBS and each blot was incubated with polystyrene nanoparticles
with different adsorbed proteins representing the conditions tested in this study:
transferrin-coated polystyrene, BSA-coated polystyrene, human plasma coronae
formed on carboxylated polystyrene, and coronae formed from human plasma
depleted of transferrin on carboxylated polystyrene nanoparticles.
To further investigate the specificity of these interactions, each nanoparticle-protein
complex, was incubated with the immuno-blots in PBS, transferrin, IgG and BSA.
This competition experiment allows one to investigate whether an interaction is
specific or non-specific by comparing the binding of nanoparticles in PBS with the
binding in the presence of free antigen. Where specific binding is present one would
expect the signal to decrease in the presence of free antigen. For ease of interpretation
the blots are grouped per nanoparticle type.
© 2015 Macmillan Publishers Limited. All rights reserved

Supplementary Information: Mapping protein binding sites on the biomolecular corona of nanoparticles
35
Figure S14: Immuno-blots showing the interaction of each protein covered nanoparticle with all
antibodies used in this study. Each nanoparticle type was incubated with the membrane in PBS,
transferrin, IgG and BSA. This allows visualisation of whether an interaction is specific or non-
specific, e.g., binding between antibodies against transferrin (mTf and pTf) and transferrin-coated
polystyrene nanoparticles is reduced in the presence of free transferrin. This shows that at least some of
the interaction is specific. Conversely for BSA-coated polystyrene nanoparticles binding is low for the
pTf antibody and does not decrease upon incubation with free transferrin, indicating that this
interaction is non-specific.
© 2015 Macmillan Publishers Limited. All rights reserved

Supplementary Information: Mapping protein binding sites on the biomolecular corona of nanoparticles
36
6. Versatility of the Method: Labelling of Gold Nanoparticle Systems
and 80 nm Polystyrene
6.1 Preparation of Gold Nanoparticles (45 nm)
For the preparation of gold nanoparticles of ca. 45 nm diameter a modified two-step
seeded growth method was followed.7 Briefly, HAuCl4 trihydrate (14.5 mg) was
dissolved in milli-Q water (125 ml) and subsequently heated to boiling. A gold
colloidal dispersion was then quickly added (15 nm gold core diameter acting as
seeds, 5 ml, prepared as reported elsewhere8), followed by the addition of an aqueous
trisodium citrate solution (1 % w/w, 21.7 μmol). The mixture was refluxed for 30 min
under vigorous stirring. To secure the colloidal stability, a second aqueous trisodium
citrate solution (1 % w/w, 5 ml) was added to the reaction mixture and further
refluxed for 1 h until the dispersion turned raspberry red in colour. Particles were then
cooled to room temperature and filtered through a 0.2 μm Millipore® filters and
characterised by UV-visible spectroscopy observing the plasmon bands, typically 534
nm for particles of 45 nm diameter. Particle size distribution was determined by
Differential Centrifugal Sedimentation (DCS).
6.2 Preparation of Transferrin-Coated Gold Nanoparticles
To coat the gold nanoparticles with transferrin, the particles were incubated in excess
transferrin (5 mg/ml) in MES buffer (50 mM, pH 6.0) for 1 h at room temperature.
The particles were subsequently washed 4 times by centrifugation and were re-
dispersed in PBS to remove the unbound proteins. The final concentration of gold
particles used was 0.1 nM.
© 2015 Macmillan Publishers Limited. All rights reserved

Supplementary Information: Mapping protein binding sites on the biomolecular corona of nanoparticles
37
6.3 Labelling of Transferrin Epitopes of Gold Nanoparticles
Gold nanoparticles of ca. 45 nm were coated with transferrin to investigate the
versatility of the labelling approach with particles of similar density. Subsequently the
particles were titrated with mTf and pTf immunogold labels. The results show
relatively small shifts after incubation with immunogold labels as the density of the
nanoparticle and the immunogold label are similar.
Figure S15: Titration curves for transferrin-coated gold nanoparticles. a, mTf; b, pTf. The
apparent diameter shifts to smaller sizes, upon incubation with immunogolds. c, The absolute shift as a
function of immunogold label concentration. For gold nanoparticles incubation with immunogold
labels causes a shift to smaller apparent diameters, as incubation with these particles actually lowers
the net density of the nanoparticles.9 These changes are small and as such the scale of the apparent
diameter shift is much less than for polystyrene, where the density difference is much greater.
© 2015 Macmillan Publishers Limited. All rights reserved

Supplementary Information: Mapping protein binding sites on the biomolecular corona of nanoparticles
38
6.4. Mapping the 80 nm Polystyrene Nanoparticles
80 nm polystyrene particles were incubated with transferrin dispersed in MES buffer
(pH 6.0) at a concentration of 1 mg/ml and 10 mg/ml respectively. The excess
transferrin was removed by centrifugation at 20000 RCF for 30 min followed by
redispersion in PBS. In total, the particles were washed six times prior to titration
experiments.
Analysis by DCS showed a shift towards larger apparent diameters post transferrin
adsorption, consistent with the binding of a protein layer. The nanoparticles were
mapped with mTf immunogold labels, and saturation confirmed using DCS
(Supplementary Fig. S16b). The number of immunogold labels was counted from
TEM micrographs.
Figure S16: Epitope mapping 80 nm polystyrene nanoparticles. a, Apparent diameter of
polystyrene nanoparticle pre and post transferrin adsorption. b, Confirmation that all available epitopes
have been labelled with mTf immunogold labels. c, Mean number of immunogold labels as a function
of the number of polystyrene nanoparticles investigated.
© 2015 Macmillan Publishers Limited. All rights reserved

Supplementary Information: Mapping protein binding sites on the biomolecular corona of nanoparticles
39
7. Electron Microscopy Characterisation of Protein Corona
7.1 Transmission Electron Microscopy Imaging
For TEM imaging, the excess gold nanoparticles were washed by several cycles of
centrifugation and redispersion in fresh Milli-Q water. Control samples were analysed
by DCS to ensure the immunogold labels were not washed off. The particles were
deposited onto formvar coated copper grids (400 mesh) or Lacey carbon (Agar
Scientific) grids and dried in a desiccator. The grids were imaged using a FEI Tecnai
G2 20 Twin Electron Microscope operating at accelerating voltage of 200 keV.
Images were taken with a single polystyrene nanoparticle per micrograph to facilitate
counting of immunogold labels.
7.2 Processing of the Protein-Coated Nanoparticles for EM Imaging
After incubation with transferrin, in order to visualise the adsorbed proteins on
nanoparticles the samples were processed for EM imaging.10
Briefly, primary fixation
of proteins bound particles was carried out with 2.5% w/w glutaraldehyde dissolved
in phosphate buffer (0.2 M, pH 6.2, 1 h). After fixation, the particles were washed
with buffer and stained with 1% w/w OsO4 in phosphate buffer (1 h). Subsequently
the particles were dehydrated with a series of ethanol solutions (30%, 50%, 70%, 90%
and 100%). The final wash was repeated three times and 1 µl of the sample deposited
onto formvar coated copper grids (400 mesh) or Lacey carbon grids and dried prior to
post-staining process.
Alternatively, TEM grids containing fixed protein-coated polystyrene nanoparticles
were stained with 2.5% uranyl acetate in 50% ethanol and 2% aqueous lead citrate
© 2015 Macmillan Publishers Limited. All rights reserved

Supplementary Information: Mapping protein binding sites on the biomolecular corona of nanoparticles
40
solution. Specimens were then imaged using FEI Tecnai G2 20 Twin Microscope
operating at accelerating voltage of 200 kV.
7.3 TEM Imaging and Advanced Analysis of Transferrin-Coated
Polystyrene
The advanced electron microscopy analysis was carried out using the following
instrumentation. An FEI Titan transmission electron microscope equipped with a field
emission gun was operated and used for STEM acquisition and EDX maps at an
accelerating voltage of 300 keV. For Helium Ion Beam microscopy a Carl Zeiss
Helium Ion microscope (HIM) was used operating at 30 keV.
Figure S17: TEM micrographs showing transferrin-coated polystyrene nanoparticles. a, unstained transferrin-coated polystyrene nanoparticle. b, Os-stained transferrin-coated polystyrene
nanoparticle. c, Uranyl Acetate / Lead Citrate post stained transferrin-coated polystyrene nanoparticles
showing a rough surface attributed to the adsorbed transferrin layer.
© 2015 Macmillan Publishers Limited. All rights reserved

Supplementary Information: Mapping protein binding sites on the biomolecular corona of nanoparticles
41
Figure S18: EDX analysis. a, uncoated polystyrene nanoparticles. b, Os-stained transferrin-coated
polystyrene nanoparticles. The Osmium staining can be detected in panel b via EDX analysis. In order
to detect the signal for Osmium large areas needed to be analysed (region 5 and 6). These regions
showed the presence of Osmium, attributed to the protein staining. No Osmium signal was detected in
polystyrene nanoparticles without protein and stained using the Os staining protocol.
© 2015 Macmillan Publishers Limited. All rights reserved

Supplementary Information: Mapping protein binding sites on the biomolecular corona of nanoparticles
42
Figure S19: He-Ion beam microscopy analysis. a, Bare polystyrene nanoparticles; b, transferrin-
coated polystyrene nanoparticles; c, transferrin-coated polystyrene nanoparticles labelled with mTf
immunogold labels. d-f, The same samples in back scattered mode, demonstrating increasing contrast
in the presence of immunogold labels. g, bright field TEM and h, STEM micrographs for transferrin-
coated polystyrene nanoparticles labelled with mTf immunogold labels.
© 2015 Macmillan Publishers Limited. All rights reserved

Supplementary Information: Mapping protein binding sites on the biomolecular corona of nanoparticles
43
Figure S20: STEM images of Uranyl Acetate / Lead Citrate stained transferrin-coated
polystyrene nanoparticles. A detailed EDX map shows the presence of lead corresponding with the
contrast observed in the STEM image.
Figure S21: Transferrin-coated polystyrene nanoparticles fixed with glutaraldehyde and post-
stained with Uranyl Acetate / Lead Citrate. In these micrographs the tilt in the TEM was adjusted to
+/- 50° to show coverage of protein around the particle surface.
© 2015 Macmillan Publishers Limited. All rights reserved

Supplementary Information: Mapping protein binding sites on the biomolecular corona of nanoparticles
44
7.4 3D Reconstruction of a Transferrin-Coated Polystyrene Nanoparticle
from STEM Micrographs
This identification was carried out using the following criteria: if the immunogold
label was not in focus on the top plane and became in focus or more sharp in the
bottom plane then it was designated as ‘bottom’. If the immunogold label was not in
focus on the bottom plane and became in focus or more sharp in the top plane then it
was designated as ‘top’. More often, though, the particle was in focus on the top and
in focus on the bottom; then it was designated as ‘top’. As the imaging modality is not
confocal, intensity from all planes is observed and the particles on the top will be
shaper inherently.
Figure S22: Scheme showing the difference between top and bottom focused immunogold labels
on polystyrene nanoparticle in STEM images. Shown here is a distribution of immunogold labels
around a sphere viewed from a top down and side on view. The small gold particles are coloured
differently to aid in visualisation.
© 2015 Macmillan Publishers Limited. All rights reserved

Supplementary Information: Mapping protein binding sites on the biomolecular corona of nanoparticles
45
Figure S23: High-resolution TEM images showing bright field and STEM modes focused on the
‘Top’ or ‘Bottom’ of transferrin-coated polystyrene nanoparticles. Sample images were taken for
transferrin-coated polystyrene nanoparticles incubated in low (25nM), medium (100 nM) and saturated
(300 nM) with mTf immunogold labels.
Supplementary Fig. S23 shows the same nanoparticles imaged with bright field
imaging and STEM mode focused on the top or bottom of the nanoparticle. This was
carried out for transferrin-coated polystyrene nanoparticles with a low, medium and
high amount of mTf immunogold labels attached. The high sample in particular
corresponds to the saturation point and therefore is of most interest.
Once the immunogold label was designated as top or bottom, its two-dimensional co-
ordinates was measured as xy pairs. The centre of the polystyrene nanoparticle was
identified by finding the merging point of the bisector of multiple arcs on the sphere;
after identification this xy coordinate was stored.
© 2015 Macmillan Publishers Limited. All rights reserved

Supplementary Information: Mapping protein binding sites on the biomolecular corona of nanoparticles
46
The distance between each of the immunogold labels and the centre of the polystyrene
nanoparticle was determined. The coordinate in the third dimension was determined
by assuming the immunogold labels are on the surface of the polystyrene
nanoparticle. Using Pythagoras theorem the z coordinate can then be determined as
𝑧 = √𝑑2 + 𝑟2, where d is the distance between the origin and the immunogold label
and r is fixed as the radius of the polystyrene nanoparticle.
Figure S24: Three-dimensional reconstruction of a transferrin-coated polystyrene labelled with mTf
immunogold. a, Schematic highlighting that each particle is at a fixed radius from the centre of the
sphere. b, Three-dimensional reconstruction of Supplementary Fig. S23 “high”. See also additional
movie of three-dimensional reconstruction.
© 2015 Macmillan Publishers Limited. All rights reserved

Supplementary Information: Mapping protein binding sites on the biomolecular corona of nanoparticles
47
8. Biological Interaction of Transferrin-Coated Polystyrene
8.1 Interactions between Transferrin Receptor and Transferrin-Coated
Polystyrene
To understand the biological activity of the model particles examined in this system
the interaction of these transferrin-coated nanoparticles with transferrin receptor was
examined. The transferrin receptor is a transmembrane receptor which exists as a
homo-dimer. Most soluble forms of the receptor are generated by cleavage of the
receptor from the membrane using enzymes, and these cleave the receptor typically at
residue R100, which is after the critical di-sulphide bridge which holds the homo-dimer
together located at C98.The homo-dimers role in ligand binding is understood.11
Transferrin receptor was purchased from R&D systems. This recombinant receptor
was chosen as it contained the residues required to form a homo-dimer. Each 50 µg
vial of lyophilised receptor was reconstituted using 250 µl of filtered PBS (137 mM,
pH 7.4). In order to verify if this receptor is actually a dimer or a monomer a
combination of SDS and Native PAGE gels was used. For both gel systems the same
percentage gel was used namely 6% 4%, in order to enable separation of the high
molecular weight species. Transferrin was used in order to compare the difference in
mobility. The theoretical molecular weight of the TfR monomer is 76 kDa with the
corresponding value for the dimer of 152 kDa. In contrast, transferrin is 79.5 kDa.
This means that if the receptor is a monomer it should arrive at the same point as the
transferrin, whereas if it is a dimer it should be much larger. The results of these gels
as shown in Supplementary Fig. S25. Supplementary Fig. S25a shows that when the
proteins are in native form there is a distinct difference in the migration of TfR when
compared to Tf, indicating that the receptor is a dimer. When the samples are
© 2015 Macmillan Publishers Limited. All rights reserved

Supplementary Information: Mapping protein binding sites on the biomolecular corona of nanoparticles
48
denatured and analysed by SDS-PAGE both proteins show similar molecular weights
indicative of a denatured dimer.
It was shown that the particles are capable of binding this recombinant TfR protein
(Fig. 3).
Figure S25: Analysis of recombinant TfR receptor by Native and SDS PAGE. Both gels were
carried out on 6% 4% discontinuous system. From the SDS-PAGE one band for the receptor is
observed with similar molecular weight as transferrin. This band corresponds to the TfR monomer with
a predicted molecular weight of 76 kDa in comparison to Tf (79.5 kDa). From the Native PAGE the
TfR is migrating with a larger molecular weight than Transferrin indicating the presence of the receptor
homo-dimer.
© 2015 Macmillan Publishers Limited. All rights reserved

Supplementary Information: Mapping protein binding sites on the biomolecular corona of nanoparticles
49
Figure S26: TEM micrographs showing larger population of representative images from results
of Fig. 3c. Scale bar 100 nm.
© 2015 Macmillan Publishers Limited. All rights reserved

Supplementary Information: Mapping protein binding sites on the biomolecular corona of nanoparticles
50
8.2 The Role of Iron in Transferrin-Transferrin Receptor Binding on the
Surface of Nanoparticles.
8.2.1 Characterisation of apo and holo Transferrin
To confirm that the interaction between the transferrin receptor and transferrin
adsorbed on the nanoparticle surface was indeed representative of the native binding
interaction, the role of iron was investigated. It has previously been shown that the
affinity of transferrin for the transferrin receptor varies depending on whether the
transferrin is diferric (holo) or iron free (apo).12
To do this, the iron was removed
from the transferrin by lowering the pH to 5.0. After its removal, the pH was adjusted
to 7.5. The dispersion of the transferrin was analysed by DLS in order to ensure that
the iron removal treatment did not cause any aggregation of the protein. The DLS
results indicate no significant change in the observed hydrodynamic diameter as a
result of the treatment. The dispersion of transferrin in MES buffer (pH 6.0), the
buffer used for the adsorption process, was also tested and can be found in
Supplementary Table S5 and Supplementary Fig. S27.
Furthermore, the removal of iron was monitored by UV-Vis spectroscopy. Di-ferric
transferrin is orange in colour with a peak absorbance at 465 nm. This peak
disappears once the iron is removed, and the solution turns transparent (see
Supplementary Fig. S28).
Finally, the secondary structure of holo and apo transferrin was checked using
Circular Dichroism (CD) which showed no significant change upon the removal of
iron. The results of this characterisation verified that the iron was removed from the
transferrin with negligible effect on the structure and dispersion.
© 2015 Macmillan Publishers Limited. All rights reserved

Supplementary Information: Mapping protein binding sites on the biomolecular corona of nanoparticles
51
Polystyrene particles (diameter 220 by electron microscopy) were coated in apo
transferrin and their interaction with the soluble receptor fragment checked. It was
found that by removing the iron, the interaction previously observed for holo
transferrin was lost and no shift in apparent diameter was observed.
UV-Visible Spectroscopy
UV-visible spectra were recorded using a Varian Cary 6000i Spectrometer. Samples
were analysed at a concentration of 200 µg/ml registering in the spectral range from
400 to 800 nm using a quartz cuvette with a 1 cm path length.
Circular Dichroism
Circular dichroism (CD) measurements were performed on a JASCO J810
Spectropolarimeter using a 1 mm quartz cuvette. The protein was analysed at a
concentration of 60 µg/ml in PBS (pH 7.4). Near UV-CD spectra were recorded in the
spectral range from 200 to 300 nm at a scan speed of 50 nm/min. Each measurement
was an average of 5 accumulations.
Dynamic Light Scattering.
Size measurements of the protein were carried out at a protein concentration of 200
µg/ml in a low volume cuvette. Measurements are an average of three individual runs
with 10-15 accumulations per run. Samples were analysed on a Malvern Nanosizer
ZS Series DLS at a temperature of 25°C.
© 2015 Macmillan Publishers Limited. All rights reserved

Supplementary Information: Mapping protein binding sites on the biomolecular corona of nanoparticles
52
Table S5: Diameter and dispersion of holo and apo transferrin as measured by dynamic light
scattering.
Sample z-ave
(nm)
σ (nm) n=3
PDI σ n=3
holo-Tf 9.1 0.3 0.28 0.03
Tf MES pH6 9.4 0.3 0.31 0.03
apo-Tf 10.8 0.2 0.31 0.008
Figure S27: DLS number distributions. a, holo-transferrin. b, transferrin in MES Buffer pH 6.0. c,
apo-transferrin.
© 2015 Macmillan Publishers Limited. All rights reserved

Supplementary Information: Mapping protein binding sites on the biomolecular corona of nanoparticles
53
Figure S28: Characterisation of apo and holo transferrin. a, UV-visible spectroscopy showing the
change in the absorption spectrum of transferrin upon removal of the iron. b, Circular Dichroism
spectra for apo and holo transferrin showing no significant difference in the observed secondary
structure. c, photograph of holo (left) and apo (right) transferrin, showing a clear change in the colour
of the protein once the iron has been removed.
a b
c
© 2015 Macmillan Publishers Limited. All rights reserved

Supplementary Information: Mapping protein binding sites on the biomolecular corona of nanoparticles
54
9. Pairwise Correlations
Figure S29: The average shown in Fig. 2d is robust. The results shown in Fig. 2d were averaged
over 18 transferrin-coated polystyrene nanoparticles, but in order to show that the average is robust,
the intermediate results were investigated. a, Full distributions after averaging over 5, 10 and all 18
transferrin-coated polystyrene particles. After 18 particles the distribution appears rather smooth,
indicating a robust average. b, Variation of particular values of the distribution with the number
transferrin-coated polystyrene nanoparticles taken into account in the average. The particular values
indicated in panel a were normalised with their final average, and is shown as a function of the number
transferrin-coated polystyrene particles taken into account in the average. (Dotted lines) final average.
The variation is always within 10% of the final average and, more importantly, appears to have
stabilised after, say, 13 transferrin-coated polystyrene nanoparticles. This suggests that even if more
transferrin-coated polystyrene nanoparticles were investigated the results would not change, i.e., that
the average is robust.
© 2015 Macmillan Publishers Limited. All rights reserved

Supplementary Information: Mapping protein binding sites on the biomolecular corona of nanoparticles
55
10. Assessing the State of Transferrin Denaturation on the Surface of
Nanoparticles
In order to rule out the denaturation as a cause of the stochastic adsorption observed
for these systems, it is important to determine the affect adsorption has on the
conformational state of the protein. The conformational state of transferrin was
probed by investigating the intrinsic tryptophan fluorescence of the protein.
Transferrin contains 8 tryptophan residues at amino acids 27, 147, 283, 363, 377, 460,
479 and 569. Tryptophan fluorescence has been used previously as an indicator of
tertiary structure.13
The tryptophan fluorescence was monitored using a Horiba Fluorolog fluorimeter.
The protein or protein-coated nanoparticles were exited at 280 nm and the emission
was recorded from 315 to 450 nm. Both excitation and emission slit widths were set
to 3 nm. Samples were analysed in a low volume quartz cuvette with an average of 5
accumulations per measurement. Thermal denaturation profiles were generated
between 25 and 80 °C using a heated sample stage coupled to a water bath.
As a control, samples of particle pre and post thermal treatment were centrifuged to
pellet all the nanoparticles and adsorbed proteins. Both the supernatant and the pellets
were analysed by SDS-PAGE to check if the protein was coming off the nanoparticle
surface. The results indicate that a small amount of transferrin is detaching from the
particles due to the heating process.
© 2015 Macmillan Publishers Limited. All rights reserved

Supplementary Information: Mapping protein binding sites on the biomolecular corona of nanoparticles
56
Figure S30: Tryptophan fluorescence emission as a function of temperature. a, transferrin; b,
transferrin-coated polystyrene nanoparticles of 220 nm (diameter by EM); c, transferrin-coated 80 nm
polystyrene nanoparticles; d, transferrin-coated gold nanoparticles of nominal diameter 45 nm.
Temperature is represented in degrees Celsius.
Figure S31: Scatter plot showing the tryptophan emission peak as a function of temperature. Error bars are representative of the uncertainty in the position of the emission peak due to the noise of
the measurement.
Transferrin
Transferrin coated polystyrene 80nm
Transferrin coated polystyrene 220nm
Transferrin coated gold 45nm
© 2015 Macmillan Publishers Limited. All rights reserved

Supplementary Information: Mapping protein binding sites on the biomolecular corona of nanoparticles
57
FigureS32: SDS-PAGE of both the nanoparticles and the supernatants pre and post thermal
treatment. The gel shows that a small amount of transferrin is released from the nanoparticles during
the thermal cycle from 25-80 degrees. More transferrin is observed in the supernatant of 80 nm
polystyrene particle post temperature treatment than for the 220 nm case.
Transferrin coated
polystyrene 220nm
Transferrin coated
polystyrene 80nm
Transferrin coated
polystyrene 220nm
Transferrin coated
polystyrene 80nm
© 2015 Macmillan Publishers Limited. All rights reserved

Supplementary Information: Mapping protein binding sites on the biomolecular corona of nanoparticles
58
11. Scatchard Binding Model
The Scatchard equation has traditionally been applied to analyse the binding of
ligands to proteins. The equation reads.
𝜃
[𝐿]= 𝑛𝐾 − 𝐾𝜃
where θ is the ratio of total number of bound ligands to the total number of proteins.
[L] the concentration of free ligands, K the binding constant for each site and n the
number of binding sites per protein. In practice, one typically adds a certain
concentration of protein in solution,𝑐𝑝, titrate in a certain concentration of ligand,𝑐𝐿,
and measure the concentration of free ligand [L] after equilibrium has been reached.
One can then calculate θ as 𝜃 = (𝑐𝐿 − |𝐿|)/𝑐𝑃, and use the Scatchard equation to find
the number of binding sites and the binding constant. If the resultant plot is not linear
(as it should be according to the Scatchard equation) then this is interpreted in terms
of co-operativity of binding. For our case the nanoparticle takes on the role of the
protein and the immunogold labels are the ligands. It is then clear that θ is simply the
number of immunogold labels bound per nanoparticle. However, we do not have the
concentration of free immunogold once equilibrium is reached so usage of the
Scatchard equation proper is not possible. Re-writing the concentration of free
immunogold as the total immunogold concentration minus the bound immunogold we
can derive the generalization.
𝜃
𝑐𝐼𝐺 − 𝜃𝑐𝑁𝑃= 𝑛𝐾 − 𝐾𝜃
© 2015 Macmillan Publishers Limited. All rights reserved

Supplementary Information: Mapping protein binding sites on the biomolecular corona of nanoparticles
59
Where 𝑐𝐼𝐺 is the total concentration of immunogold labels and 𝑐𝑁𝑃 is the
concentration of nanoparticles. Using this expression and the number of immunogold
labels per polystyrene nanoparticle directly counted by TEM it becomes possible to
construct Scatchard plots for both monoclonal and polyclonal titrations
Figure S33: Scatchard plots for transferrin-coated polystyrene nanoparticles. Nanoparticles
titrated with a, mTf immunogold labels and b, pTf.
© 2015 Macmillan Publishers Limited. All rights reserved

Supplementary Information: Mapping protein binding sites on the biomolecular corona of nanoparticles
60
12. Reproducibility and Errors
It is useful to describe elements of the reproducibility of this system as analysed by
DCS and TEM to avoid over-interpretation on the DCS measurements. Fig. S34a.
shows that the measurements are repeatable in a technical sense and gives an
indication of the precision of DCS measurements for this system. It is noted that the
absolute size of biologically coated nanoparticles can vary greater than the precision
over the course of several weeks. This is likely due to variances in the composition of
the gradient in the DCS, temperature and humidity on different days or weeks. What
is representative is the shift in the reported diameter at saturation. Fig. S34b. shows
the shift in nanoparticle diameter after saturation with (red) mTf and (black) pTf on 3
and 2 independant replicates measurements respectively created using different
batches of Immunogold label, transferrin coated polystyrene and on different days.
Fig. S34c-d shows the raw data traces for the replicates to demonstrate the variance
which can be observed. The most important point however is that the number of
immunogold labels counted by TEM, once saturation has been reached, is consistent.
For comparison see Fig 2b and Fig 3d. This is an important point as it highlights that
the role of DCS is to validate that the nanoparticles have been saturated with
immunogold label to ensure that TEM imaging is representative.
© 2015 Macmillan Publishers Limited. All rights reserved

Supplementary Information: Mapping protein binding sites on the biomolecular corona of nanoparticles
61
Figure S34: Assessment of the reproducibility of the system. a. Estimate of the precision of DCS
measurements for this system. Eight technical replicates of transferrin coated polystyrene were
measured on the DCS; the results are shown in black with the rolling mean and standard deviation in
red. b. Diameter shift relative to transferrin coated polystyrene for particles saturated with mTf (red)
and pTf (black) immunogold labels. DCS measurements for three independant replicates for mTf c. and
pTf d. immunogold labels.
© 2015 Macmillan Publishers Limited. All rights reserved

Supplementary Information: Mapping protein binding sites on the biomolecular corona of nanoparticles
62
References
1 Salvati, A. et al. Transferrin-functionalized nanoparticles lose their targeting
capabilities when a biomolecule corona adsorbs on the surface. Nature
Nanotech. 8, 137-143 (2013).
2 Hancock, J. F. & Prior, I. A. Electron microscopic imaging of Ras signaling
domains. Methods 37, 165-172 (2005).
3 Slot, J. W. & Geuze, H. J. A new method of preparing gold probes for
multiple-labeling cytochemistry. Eur. J. Cell Biol. 38, 87-93 (1985).
4 Haiss, W., Thanh, N. T., Aveyard, J. & Fernig, D. G. Determination of size
and concentration of gold nanoparticles from UV-vis spectra. Anal. Chem. 79,
4215-4221 (2007).
5 Cox, J. & Mann, M. MaxQuant enables high peptide identification rates,
individualized p.p.b.-range mass accuracies and proteome-wide protein
quantification. Nature Biotechnol. 26, 1367-1372 (2008).
6 Gonzalez-Quintela, A. et al. Serum levels of immunoglobulins (IgG, IgA,
IgM) in a general adult population and their relationship with alcohol
consumption, smoking and common metabolic abnormalities. Clin. Exp.
Immunol. 151, 42-50 (2008).
7 Liu, S. H. & Han, M. Y. Synthesis, functionalization, and bioconjugation of
monodisperse, silica-coated gold nanoparticles: Robust bioprobes. Adv. Funct.
Mater. 15, 961-967 (2005).
8 Krpetic, Z. et al. Directed Assembly of DNA-Functionalized Gold
Nanoparticles Using Pyrrole-Imidazole Polyamides. J. Am. Chem. Soc. 134,
8356-8359 (2012).
9 Krpetic, Z. et al. High Resolution Sizing of Monolayer Protected Gold
Clusters by Differential Centrifugal Sedimentation. ACS Nano (2013).
10 Krpetic, Z. et al. Negotiation of Intracellular Membrane Barriers by TAT-
Modified Gold Nanoparticles. ACS Nano 5, 5195-5201 (2011).
11 Giannetti, A. M., Snow, P. M., Zak, O. & Bjorkman, P. J. Mechanism for
multiple ligand recognition by the human transferrin receptor. PLoS Biol. 1,
E51 (2003).
12 Thorstensen, K. & Romslo, I. The role of transferrin in the mechanism of
cellular iron uptake. Biochem. J. 271, 1-9 (1990).
13 Sharma, V. K. & Kalonia, D. S. Steady-state tryptophan fluorescence
spectroscopy study to probe tertiary structure of proteins in solid powders. J.
Pharm. Sci. 92, 890-899 (2003).
© 2015 Macmillan Publishers Limited. All rights reserved

Supplementary Discussion 1: Mapping protein binding sites on the biomolecular corona of nanoparticles
63
Supplementary Discussion 1
Estimating the Number of Immunogold Labels from DCS data
While differential centrifugation sedimentation is a useful technique for analysis of
nanoparticle size, the technique actually measures the time taken to sediment, which
only subsequently can be related to a size. For uniform particles this is
straightforward and is, for the set-up used here, implemented in the instrument.
However, for non-uniform particles – such as nanoparticles with a corona of protein,
and even a second corona of immunogold labels – this relation is less straightforward
and has to be modelled.
The essential issue is that adsorption (of protein or subsequent immunogold
labels) causes two effects: First, the nett density changes; in the case of polystyrene
nanoparticles, adsorption causes a nett increase in density, which leads to a quicker
sedimentation. Second, the (hydrodynamic) size of the particles increases, leading to a
slower sedimentation. In the case of immunogold label adsorption to polystyrene
nanoparticles the effect of increased density is vastly larger than that due to increased
size; regardless, the extraction of actual physical parameters from the apparent
diameters measured has to be performed by modelling. This Supplementary
Discussion reports how this may be done.
Defining an apparent diameter
In the centrifuge, particles are subjected to a centrifugal force
where is the angular velocity of the centrifuge, and R the distance from the axis of
rotation. Here we have already corrected for the buoyancy of the medium which,
according to Archimedes' principle, counteracts the centrifugal force by the weight of
the displaced medium, Vf. The effect has been included by the introduction of the
effective mass, meff, in the last equality. The medium also exerts a viscous drag force
proportional to the velocity of the particle, which, according to Stokes' law, is given
by
where is the viscosity of the medium, DH the hydrodynamic diameter of the particle
and the minus sign has been taken since the motion occurs in the direction away from
the axis of rotation. The two forces rapidly balance for each distance from the axis of
rotation, and thus we may assume
Integrating this expression then gives that the sedimentation time is given by
(1)
© 2015 Macmillan Publishers Limited. All rights reserved

Supplementary Discussion 1: Mapping protein binding sites on the biomolecular corona of nanoparticles
64
where Rf and R0 is the final and initial distance from the axis of rotation, respectively.
In practice, the instrument used in this study measures the sedimentation time of
the sample of interest and compares this to the sedimentation time tstd of a calibration
standard of known size and narrow size distribution. It follows immediately from
Equation 1 that
(2)
where meff,std and DH,std is the effective mass and hydrodynamic diameter of the
calibration standard, respectively.
For a particle of uniform density, the ratio meff /DH is simply given by
(3)
Thus, if we assume both the sample particle and the standard to be uniform, it follows
from Equations 2 and 3 that
(4)
For the data presented in this paper the assumption that both the sample and standard
particles are uniform has tacitly been accepted, and Equation 4 used to show the
results.
For particles of non-uniform density, however, one better view Equation 4 as the
operational definition of an apparent diameter. Obviously, by construction the
apparent diameter is equal to the physical diameter for a particle of uniform density.
For our purposes it is more useful to work with a different expression for the apparent
diameter; under the assumption that the calibration standard is of uniform density but
for a general sample, Equations 2 and 4 become
(5)
This is the general result of this section, relating the apparent diameter, Dapp, as
presented by the instrument to the physical characteristics of the particle in terms of
the ratio meff/DH. For a particle that is actually of uniform density, Equation 5 reduces
to stating that the apparent diameter is equal to the physical diameter. However, for
more complicated particles this is not so. For example, for a particle made up of a
core of diameter Dc and density c, and a shell of density s such that the full particle
has diameter Ds, the ratio meff/DH is given by
and the apparent diameter is
(6)
This agrees with the result in ref 1.
© 2015 Macmillan Publishers Limited. All rights reserved

Supplementary Discussion 1: Mapping protein binding sites on the biomolecular corona of nanoparticles
65
Estimating the Number of Immunogold Labels from DCS data
For the particle under question in the present work, the situation is more complicated
than a simple core-shell particle (Equation 6). Rather, there are at least two shells: one
due to the adsorbed transferrin protein and the second due to the adsorbed
immunogold labels. It is difficult to imagine the latter as being constituted by a
homogeneous layer, however. Fortunately, due to the high density of gold in
comparison to polystyrene and transferrin, one may completely neglect the increase in
size of the full complex and just consider the increase in (effective) mass due to the
immunogold labels.
We start by defining the characteristics of the polystyrene-transferrin corona
complex. The diameter of the bare particle (without adsorbed transferrin) is according
electron microscopy analysis 220 nm, while the apparent diameter measured by DCS
is 228 nm (Supplementary Figure S3b) assuming (as done in Figure 1-4) that the
sample density is equal to that of the polystyrene calibration standard, which has
density std=1.052 g/ml. Since the electron microscopy measurement and the DCS
measurements do not completely match, we adjusted the density in Equation 4 to
=1.0545 g/ml which made them agree. Using this density in the application of
Equation 4 to the experimental data, the polystyrene-transferrin corona complex
measured by DCS is now 271 nm. The actual thickness of the transferrin shell appears
to be 4 nm from electron microscopy, which is also reasonable considering the size of
the free protein. Using the core-shell model (Equation 6), we subsequently estimated
the density of the transferrin layer to be 1.2 g/ml.
Using the same parameters for the polystyrene-transferrin corona-immunogold
complexes, the apparent diameter measured at saturation with monoclonal antibody
(Fig. 1b) is 517 nm, while for the polyclonal antibody the apparent diameter plateaus
at 662 nm (Fig. 1b). Under the assumption that the adsorption of immunogold to the
polystyrene-transferrin corona complex only increases the mass of the full complex,
but not its size, the meff/DH ratio is given by
where DPS is the diameter of the polystyrene particle, PS the density of polystyrene,
DPS-TF the diameter of the polystyrene-transferrin corona complex, Tf the density of
the transferrin layer and mIG the total mass of immunogold labels. Using this in the
general expression for the apparent diameter (Equation 5) we may then estimate the
total mass of immunogold labels at saturation to be 510 MDa and 960 MDa for the
monoclonal and polyclonal antibody, respectively. From electron microscopy, the
average diameter of an immunogold label appears to be 6 nm (Supplementary Figure
S2). If it has one antibody and, say, 5 BSA molecules, then this corresponds to 280
and 530 immunogold labels per polystyrene-transferrin corona complex for the
monoclonal and polyclonal antibody, respectively. This is in rough agreement with the
results from direct counting (Figure 2b).
Such values could also be compared to the maximum number of immunogold
labels on the polystyrene-transferrin corona complex surface. Not taking into account
packing restrictions and curvature, we may estimate the maximum number of
immunogold labels from the total surface area of the polystyrene-transferrin corona
complex over the cross-section area of an immunogold label. This (over) estimate is
© 2015 Macmillan Publishers Limited. All rights reserved

Supplementary Discussion 1: Mapping protein binding sites on the biomolecular corona of nanoparticles
66
5,800 immunogold labels per polystyrene-transferrin corona complex.
References
1. Walczyk, D., Baldelli Bombelli, F., Monopoli, M. P., Lynch, I. & Dawson, K. A.
What the cell “sees” in bionanoscience. J. Am. Chem. Soc. 132, 5761–5768 (2010).
© 2015 Macmillan Publishers Limited. All rights reserved

Supplementary Discussion 2: Mapping protein binding sites on the biomolecular corona of nanoparticles
67
Supplementary Discussion 2
Density Correlation Functions on a Sphere
Systems to which density correlation functions have been applied to elucidate the spatial structure
in the past tend typically to be three-dimensional, of Euclidean geometry and (at least in principle)
of infinite size. These characteristics imply certain simplifications which are not valid for the
systems under discussion at present.
Perhaps the most important difference is that objects on a sphere are subjected to a curved
geometry. In principle, one may of course consider the 'normal' three-dimensional Euclidean
distance between objects – as if the sphere was not there. However, it would seem appropriate to
accept that the objects are in some idealised picture confined to the sphere (though that is not
actually the case for proteins in the corona) and use distances along the sphere – i.e. the geodesic
distance between two points – to describe the spatial structure.
Additionally, experimentally it is simpler to acquire images from which only the coordinates of
the objects projected onto a plane can be extracted. Hence it is useful to discuss also such cases.
Of special importance in the application of correlation functions is the exclusion of contribution
due a completely random placement, i.e. the part analogous to the second term in the general
expression for the covariance of two random variables X and Y
For physical systems, this part is sometimes referred to as the “ideal gas” contribution, since the
spatial structure of an ideal gas is, indeed, completely random. Everything different from a
completely random placement is a sign of structuring. It should be noted that in this view even the
absence of overlap between two objects actually gives rise to some structure – it is not completely
random. That is, even in the simplest case where there is no particular structure arising from
protein-protein or protein-nanoparticle interactions, we do expect the corona to show a structure
arising from the fact that two proteins (or even immunogold labels) cannot be in the same place. A
useful theoretical starting-point to understand such effects is the “hard sphere gas”, though we note
that the immunogold labels actually map epitopes, rather than individual proteins, and as such a
one-component hard sphere gas is not quite appropriate.
The reminder of this Discussion contains derivations of analytical expressions for the
completely random contribution, both in geodesic coordinates and in projected coordinates.
Furthermore, the completely random distribution (ideal gas) is compared to non-overlapping objects
(hard spheres), both in geodesic and projected coordinates.
Analytical Distribution of Pair-Wise Geodesic Distances for a Completely Random Placement of Objects (Ideal Gas)
To calculate the distribution of pair-wise geodesic distances for a completely random placement, it
is sufficient to consider a sphere of uniform density and calculate the distances between each point
and all other points. Due to the high degree of symmetry, this derivation is readily carried out. Thus,
place a sphere of radius R at the origin and choose the first point, A, at (0, 0, R). We are now
interested in the number of other points, B, at the geodesic distance, , from point A. It is clear that
all points B on the sphere with the same z coordinate also at the same geodesic distance from point
A, as illustrated in Figure 1. According to elementary calculus the area element is then given by
(1)
© 2015 Macmillan Publishers Limited. All rights reserved

Supplementary Discussion 2: Mapping protein binding sites on the biomolecular corona of nanoparticles
68
Figure 1. Schematic of the geometry used to calculate the distribution of pair-wise geodesic
distances. The point A can be chosen to lie at the “north pole” of the sphere. All points B at a
(geodesic) distance from point A are then equivalent to all points on the sphere with a given z
coordinate.
However, the square root in Equation (1) is simply d. Furthermore, we have
for the angle defined in Figure 1. Obviously it is also, the case that R = . Collating, we can
express the area element solely in the geodesic distance, , as
Taking into account how the point A was chosen, and including the (area) density of objects on
the sphere, we then have that the distribution of pair-wise distances is given by
is restricted to the interval [0, R].
Analytical Distribution of Pair-Wise Projected Distances for a Completely Random Placement of Objects (Ideal Gas)
To calculate the distribution of pair-wise distances for a completely random placement it is
sufficient to consider a sphere of uniform density and calculate the distances of each point with all
other points. We denote the first point A and the second point B, where naturally both points will
take on all positions on the sphere. For geodesic distances (previous section) one may utilize the
high symmetry of the situation to simplify the calculation, but the projection breaks part of the
symmetry, and the calculation becomes more tedious. Nevertheless, there is still a considerable
amount of symmetry left. Thus, denoting the direction of projection by z, it is clear that we may
choose the location of point A on (say) the upper hemisphere and above the x axis. The location of
point B we may choose (say) on the upper hemisphere and with positive y coordinate. See Figure 2
for a schematic illustration.
© 2015 Macmillan Publishers Limited. All rights reserved

Supplementary Discussion 2: Mapping protein binding sites on the biomolecular corona of nanoparticles
69
Figure 2. Schematic of the geometry used to calculate the distribution of pair-wise projected
distances. The coordinate axes have been chosen such that the z axis is along the direction of
projection. The shaded ellipse shows the projected area of the sphere, and the dotted lines how the
two points A and B are projected onto the xy-plane. Due to the symmetry, point A can be chosen on
the upper hemisphere and directly above the x axis, and point B to be both on the upper hemisphere
and the hemisphere further away (with positive y coordinate).
We now choose to parametrise the sphere in two different ways for the points A and B. For
point A we choose the parametrisation
where r is the radial coordinate in the xy-plane and the corresponding polar angle. R is the radius
of the sphere. Here we have not yet chosen point A on the x axis, only on the upper hemisphere. The
area element in this parametrisation is given by
which is obviously independent of the polar angle, , as it should. By integrating over the polar
angle, we can now choose point A on the x axis and find
(2)
in terms of the x coordinate of point A, xA. This result should be multiplied by a factor of 2 to
account for the point corresponding to point A on the lower hemisphere.
For point B we choose a parametrisation based upon the x coordinate of point A
because we have thereby built the projected distance between the two points, , into the calculation.
For a given xA, takes on values in the interval [0, R + xA]. Furthermore, the calculation separates
into two cases, as illustrated in Figure 3: If is in the interval [0, R - xA], then can take on all the
values [0, ]; for in the interval [R – xA, R + xA], on the other hand, is restricted to the interval
© 2015 Macmillan Publishers Limited. All rights reserved

Supplementary Discussion 2: Mapping protein binding sites on the biomolecular corona of nanoparticles
70
[c, ] where
The latter equation follows from the observation that the smallest angle is such that point B must be
on the circle of radius R in the xy-plane.
Figure 3. Distances in the projected geometry. For short distances from point A, all points at the
distance correspond to the projected position of a point on the sphere, as exemplified by point B1.
On the other hand, point B2 exemplifies that for longer distances, not all points at the distance
correspond to the projected position of a point on the sphere.
The area element in this parametrisation is given by
(3)
which should be multiplied by a factor of 4 to take into account that point B was chosen on the
upper hemisphere and with positive y coordinate.
We have thereby essentially expressed the number of points A on the sphere that has x
coordinate xA (Equation 2) and the number of points B on the sphere which has a projected position
a distance away from point A (Equation 3). It remains only to average over all points A and B, that
is, to ingrate over their positions. Hence, the number of pair-wise distances, , is given by
where we have included the factors needed to account for how points A and B were chosen (as
mentioned above) and, also, the (area) density, , of the ideal gas on the sphere. We also have to
define the two different cases (Figure 3) in terms of , rather than xA. Thus, only for in the interval
[0, R] does there exists points A belonging to the first case (Figure 3), and these have xA in the
interval [0, R - ]. For all in the interval [0, 2R] (the upper limit obviously being the maximum
projected distance) there exists points A belonging to the second case (Figure 3), and these have xA
in the interval [max(R – , - R), R] where max(...) denotes the maximum of its two arguments.
Finally, the distribution of pair-wise distances is thus given by
(4)
where rect[a, b](...) is a function which is unity when its argument is in the interval [a, b] and
© 2015 Macmillan Publishers Limited. All rights reserved

Supplementary Discussion 2: Mapping protein binding sites on the biomolecular corona of nanoparticles
71
otherwise vanishes. Here we have also transformed the integration over to an integration over u =
cos .
This distribution is compared to corresponding simulations in Figure 4 to excellent agreement.
Figure 4. Distribution of pair-wise projected distances for a completely random placement of
objects. (Solid line) Analytical formula, i.e. an evaluation of Equation (4). (Histogram) Numerical
simulations corresponding to 22500 objects placed on a sphere. The normalisation is such that if N
is the number of objects (22500), then the histogram sums to N(N – 1)/2, the number of independent
pairs.
Comparison between Distribution of Pair-Wise Distances for Completely Random Placement of Objects and Non-Overlapping Objects (Ideal and Hard Sphere Gases)
It is imperative to understand the distribution coming solely from a completely random placement
of objects (preceding two sections), but it is also instructive to see what structure arises solely from
the fact that two objects cannot overlap. In order to investigate this, numerical simulations were
performed, in which N smaller spheres were placed on the surface of a large sphere. For each small
sphere added to the large sphere surface, a random location was chosen. If the random location
overlapped with another small sphere, then a new random location was chosen, etc. until a location
was found which did not overlap with any of the other spheres. This was repeated for each small
sphere. Results were averaged over a large number of large spheres until the distributions
converged. Note that this procedure does not converge to the thermodynamic equilibrium
distribution; however, it does describe adsorption of immobile objects,1 which is deemed more
appropriate for the (for practical purposes) irreversible adsorption of hard corona proteins.2 In any
case, the differences are likely small, at least for the lower densities investigated here.
Figure 5 shows the distribution of pair-wise distances for non-overlapping spheres (histogram)
in comparison to completely random placement (solid line) in terms of geodesic distances.
Parameters have been chosen to, in some sense, correspond to the experimental Transferrin coated
polystyrene system, though a one-component system is not quite appropriate (as already
mentioned). For all but very short distances (> one small sphere diameter), the distance distribution
is identical to a completely random distribution (Figure 5, left). The only difference appears at short
distances (Figure 5, right), where one observes an “exclusion zone”, as expected due to the fact that
non-overlapping spheres cannot be closer to each other than the diameter of the spheres.
© 2015 Macmillan Publishers Limited. All rights reserved

Supplementary Discussion 2: Mapping protein binding sites on the biomolecular corona of nanoparticles
72
Figure 5. Distribution of pair-wise geodesic distances for non-overlapping spheres mimicking
the Transferrin coated polystyrene system. (Left) Full distribution. (Right) Short-distance
behaviour. The diameter of the larger sphere was set to 200 nm. (Histogram) Distribution of
distances between 200 non-overlapping small spheres of diameter 5 nm. (Solid line) Completely
random distribution. Note that the bin sizes have been chosen different for the two panels.
However, regardless of them being non-overlapping two spheres can be arbitrarily close to each
other in terms of their projected inter-distances (by “stacking on top of each other”). Consequently,
the distribution of projected distances between non-overlapping spheres (histogram) shown in
Figure 6 is almost identical to that of a completely random placement (solid lines).
Figure 6. Distribution of pair-wise projected distances for non-overlapping spheres mimicking
the Transferrin coated polystyrene system. (Left) Full distribution. (Right) Short-distance
behaviour. The diameter of the larger sphere was set to 200 nm. (Histogram) Distribution of
distances between 200 non-overlapping small spheres of diameter 5 nm. (Solid line) Completely
random distribution. Note that the bin sizes have been chosen different for the two panels.
For completeness, we show in Figure 7 also the distributions for a density significantly higher
than those observed experimentally for proteins in the corona. In terms of the geodesic distances
(Figure 7, left), one now observes the formation of a “coordination layer”, i.e. a higher density
outside just outside the “exclusion zone”, though it is slight. In projected coordinates (Figure 7,
right), a difference with a completely random placement is revealed, though it is still fairly small.
© 2015 Macmillan Publishers Limited. All rights reserved

Supplementary Discussion 2: Mapping protein binding sites on the biomolecular corona of nanoparticles
73
Figure 7. Distribution of pair-wise distances for non-overlapping spheres on the surface of a
larger sphere at higher density. (Left) Distribution of geodesic distances. (Right) Distribution of
projected distances. The diameter of the larger sphere was set to 200 nm. (Histogram) Distribution
of distances between 1500 non-overlapping small spheres of diameter 5 nm. (Solid line) Completely
random distribution.
In essence, then, we observe that for values of the parameters mimicking the experimental
Transferrin coated polystyrene system the absence of overlap is not expected to give rise to large
effects in the distance distributions, in particular the projected distances where the effects are
negligible.
References
1. Widom, B. Random Sequential Addition of Hard Spheres to a Volume. J. Chem. Phys. 44, 3888-
3894 (1966).
2. Walczyk, D., Baldelli Bombelli, F., Monopoli, M. P., Lynch, I. & Dawson, K. A. What the Cell
‘Sees’ in Bionanoscience. J. Am. Chem. Soc. 132, 5761–5768 (2010).
© 2015 Macmillan Publishers Limited. All rights reserved