
Supplementary information Kopecky resubmission R3
20
1 Supplementary Information Supplementary Methods Supplementary References Supplementary Figure S1. Specificity of the ELISA Supplementary Figure S2. Detection of SAA(HDL) Supplementary Figure S3. Detection of SP‐B(HDL) Supplementary Figure S4. SAA(HDL) and SP‐B(HDL) are enriched in ESRD patients Supplementary Figure S5. Apolipoprotein B‐depleted serum generated by PEG precipitation Supplementary Figure S6. SAA(HDL) and SP‐B(HDL) levels in apolipoprotein B‐depleted serum and HDL Supplementary Figure S7. Inter‐assay variation of the SAA(HDL) and SP‐B(HDL) ELISA Supplementary Figure S8. Distribution of SAA(HDL) and SP‐B(HDL) by Kernel density estimation Supplementary Figure S9. Kaplan‐Meier estimates for cardiac events in subgroups of patients according to quartiles of baseline SAA(HDL) Supplementary Figure S10. Kaplan‐Meier estimates for all‐cause mortality in subgroups of patients according to quartiles of baseline SP‐B(HDL) Supplementary Figure S11. Subgroup analysis Atorvastatin vs. Placebo stratified by SAA(HDL) quartile (endpoint: all cardiac events combined). Supplementary Table S1. Cardiac events according to quartiles of SAA(HDL) Supplementary Table S2. All‐cause mortality according to quartiles of SP‐B(HDL)
Transcript of Supplementary information Kopecky resubmission R3
1
Supplementary Information
Supplementary Methods
Supplementary References
Supplementary Figure S1. Specificity of the ELISA
Supplementary Figure S2. Detection of SAA(HDL)
Supplementary Figure S3. Detection of SP‐B(HDL)
Supplementary Figure S4. SAA(HDL) and SP‐B(HDL) are enriched in ESRD patients
Supplementary Figure S5. Apolipoprotein B‐depleted serum generated by PEG precipitation
Supplementary Figure S6. SAA(HDL) and SP‐B(HDL) levels in apolipoprotein B‐depleted serum and
HDL
Supplementary Figure S7. Inter‐assay variation of the SAA(HDL) and SP‐B(HDL) ELISA
Supplementary Figure S8. Distribution of SAA(HDL) and SP‐B(HDL) by Kernel density estimation
Supplementary Figure S9. Kaplan‐Meier estimates for cardiac events in subgroups of patients
according to quartiles of baseline SAA(HDL)
Supplementary Figure S10. Kaplan‐Meier estimates for all‐cause mortality in subgroups of patients
according to quartiles of baseline SP‐B(HDL)
Supplementary Figure S11. Subgroup analysis Atorvastatin vs. Placebo stratified by SAA(HDL)
quartile (endpoint: all cardiac events combined).
Supplementary Table S1. Cardiac events according to quartiles of SAA(HDL)
Supplementary Table S2. All‐cause mortality according to quartiles of SP‐B(HDL)

2
Supplementary Methods
Materials
All chemicals were purchased from Sigma‐Aldrich (St. Louis, MO, USA) unless stated otherwise.
Sample Preparation
HDL for the experimental cohort was isolated from fresh plasma of non‐fasting subjects by sequential
ultracentrifugation as described.1 In brief, the density of plasma was raised to ρ=1.063 kg/L by
addition of potassium bromide (KBr) (Merck, Darmstadt, Germany). The samples were then
centrifuged in a type 50.4 Ti rotor in an Optima L‐90‐K ultracentrifuge (Beckmann, Fullerton, CA, USA)
at 50,000 rpm for 12 hours at 20°C. After removal of the supernatant containing the larger
lipoproteins, the density of the infranate fraction was raised to ρ=1.210 kg/L by addition of KBr and
samples were centrifuged for further 12 hours in the type 50.4 Ti rotor at 50,000 rpm. HDL was then
collected from the top of the centrifuge tubes, aliquoted and stored at ‐80°C until further use.
Apolipoprotein B‐depleted serum was prepared from thawed serum samples by precipitation
of apolipoprotein B‐containing lipoproteins with polyethyleneglycol (PEG). 20% PEG in 200mM
glycine buffer pH 7.4 was added to serum samples diluted at 1:2.5. After incubation for 20 minutes at
room temperature while shaking, samples were centrifuged at 16.000xg for 30 minutes at 4°C. The
supernatant (apolipoprotein B‐depleted serum) was collected and used immediately; the pellet
containing lipoprotein fractions with apolipoprotein B was discarded.
Statistical Analysis
Statistical analysis was performed using the GraphPad Prism 6 software. Data were compared by
using Mann‐Whitney‐U test or unpaired, two‐tailed student’s t‐test. Linear regression analysis was
performed when testing for the relationship of two variables. Results are expressed as means +SEM.
3
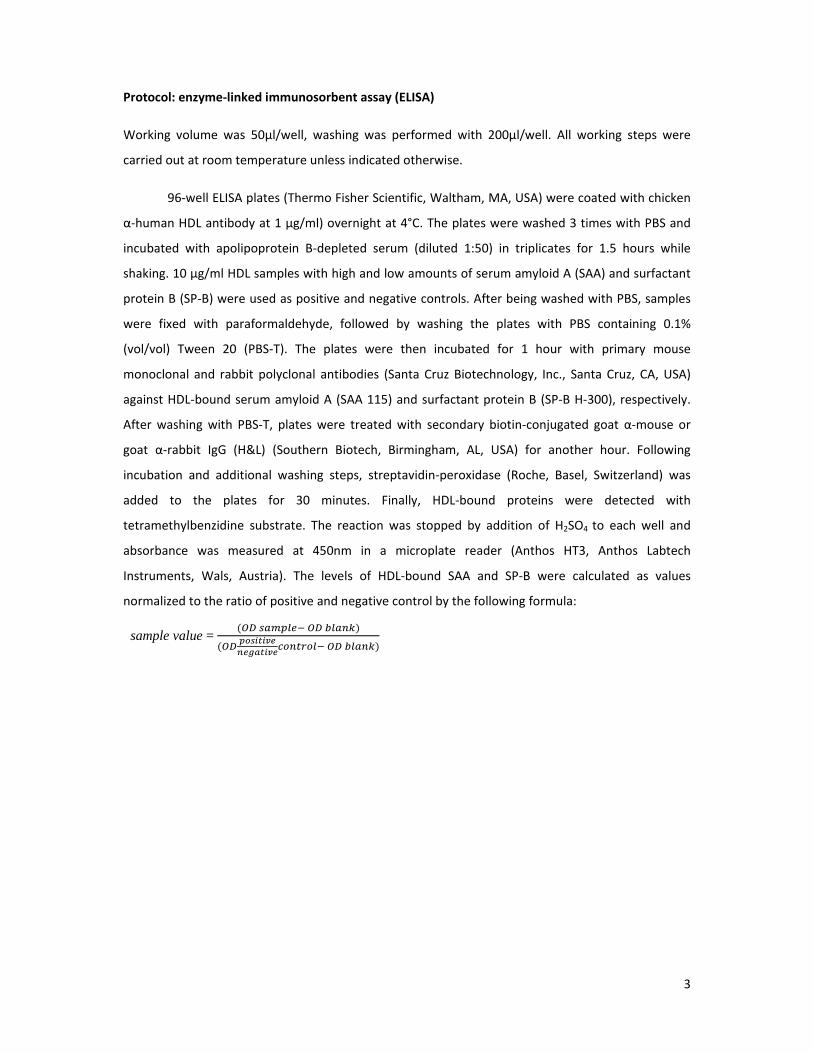
Protocol: enzyme‐linked immunosorbent assay (ELISA)
Working volume was 50µl/well, washing was performed with 200µl/well. All working steps were
carried out at room temperature unless indicated otherwise.
96‐well ELISA plates (Thermo Fisher Scientific, Waltham, MA, USA) were coated with chicken
α‐human HDL antibody at 1 µg/ml) overnight at 4°C. The plates were washed 3 times with PBS and
incubated with apolipoprotein B‐depleted serum (diluted 1:50) in triplicates for 1.5 hours while
shaking. 10 µg/ml HDL samples with high and low amounts of serum amyloid A (SAA) and surfactant
protein B (SP‐B) were used as positive and negative controls. After being washed with PBS, samples
were fixed with paraformaldehyde, followed by washing the plates with PBS containing 0.1%
(vol/vol) Tween 20 (PBS‐T). The plates were then incubated for 1 hour with primary mouse
monoclonal and rabbit polyclonal antibodies (Santa Cruz Biotechnology, Inc., Santa Cruz, CA, USA)
against HDL‐bound serum amyloid A (SAA 115) and surfactant protein B (SP‐B H‐300), respectively.
After washing with PBS‐T, plates were treated with secondary biotin‐conjugated goat α‐mouse or
goat α‐rabbit IgG (H&L) (Southern Biotech, Birmingham, AL, USA) for another hour. Following
incubation and additional washing steps, streptavidin‐peroxidase (Roche, Basel, Switzerland) was
added to the plates for 30 minutes. Finally, HDL‐bound proteins were detected with
tetramethylbenzidine substrate. The reaction was stopped by addition of H2SO4 to each well and
absorbance was measured at 450nm in a microplate reader (Anthos HT3, Anthos Labtech
Instruments, Wals, Austria). The levels of HDL‐bound SAA and SP‐B were calculated as values
normalized to the ratio of positive and negative control by the following formula:
sample value =
4
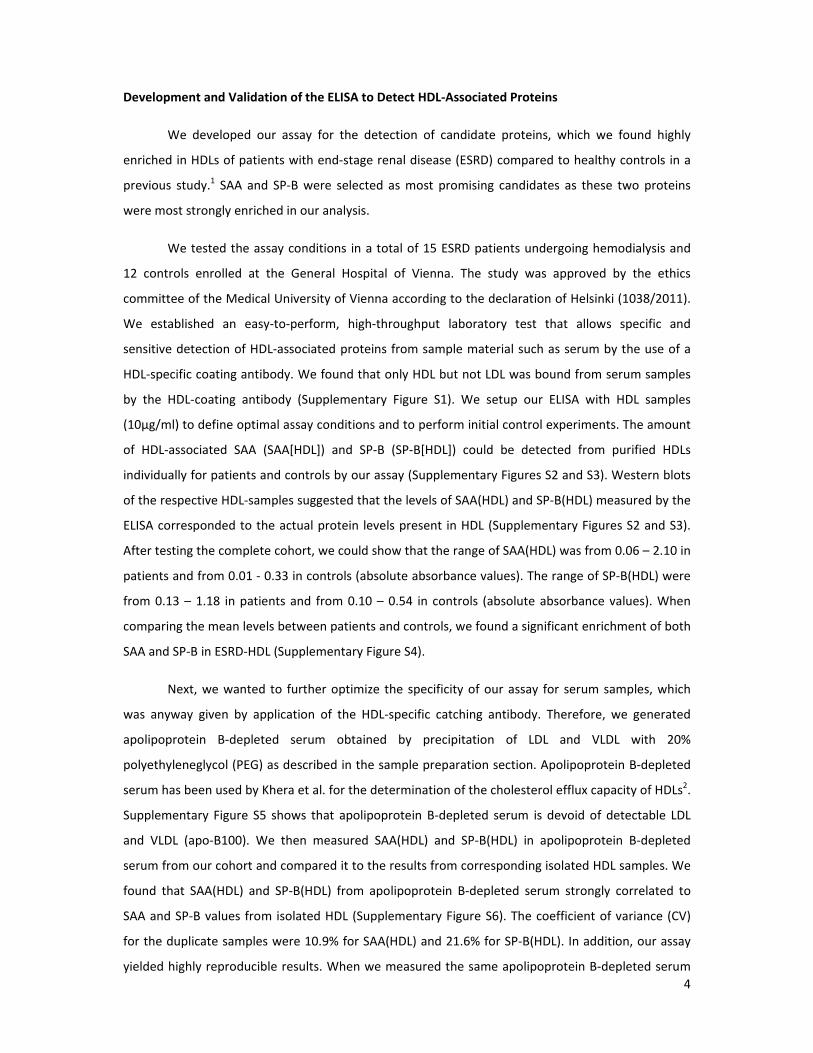
Development and Validation of the ELISA to Detect HDL‐Associated Proteins
We developed our assay for the detection of candidate proteins, which we found highly
enriched in HDLs of patients with end‐stage renal disease (ESRD) compared to healthy controls in a
previous study.1 SAA and SP‐B were selected as most promising candidates as these two proteins
were most strongly enriched in our analysis.
We tested the assay conditions in a total of 15 ESRD patients undergoing hemodialysis and
12 controls enrolled at the General Hospital of Vienna. The study was approved by the ethics
committee of the Medical University of Vienna according to the declaration of Helsinki (1038/2011).
We established an easy‐to‐perform, high‐throughput laboratory test that allows specific and
sensitive detection of HDL‐associated proteins from sample material such as serum by the use of a
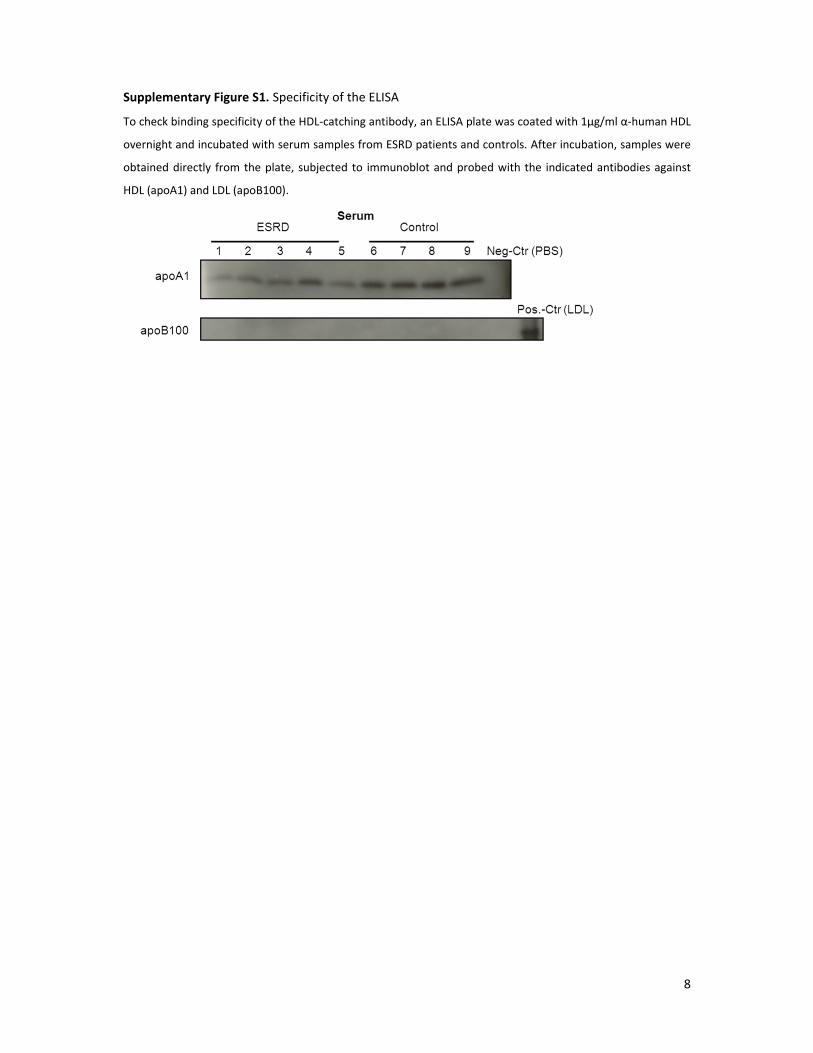
HDL‐specific coating antibody. We found that only HDL but not LDL was bound from serum samples
by the HDL‐coating antibody (Supplementary Figure S1). We setup our ELISA with HDL samples
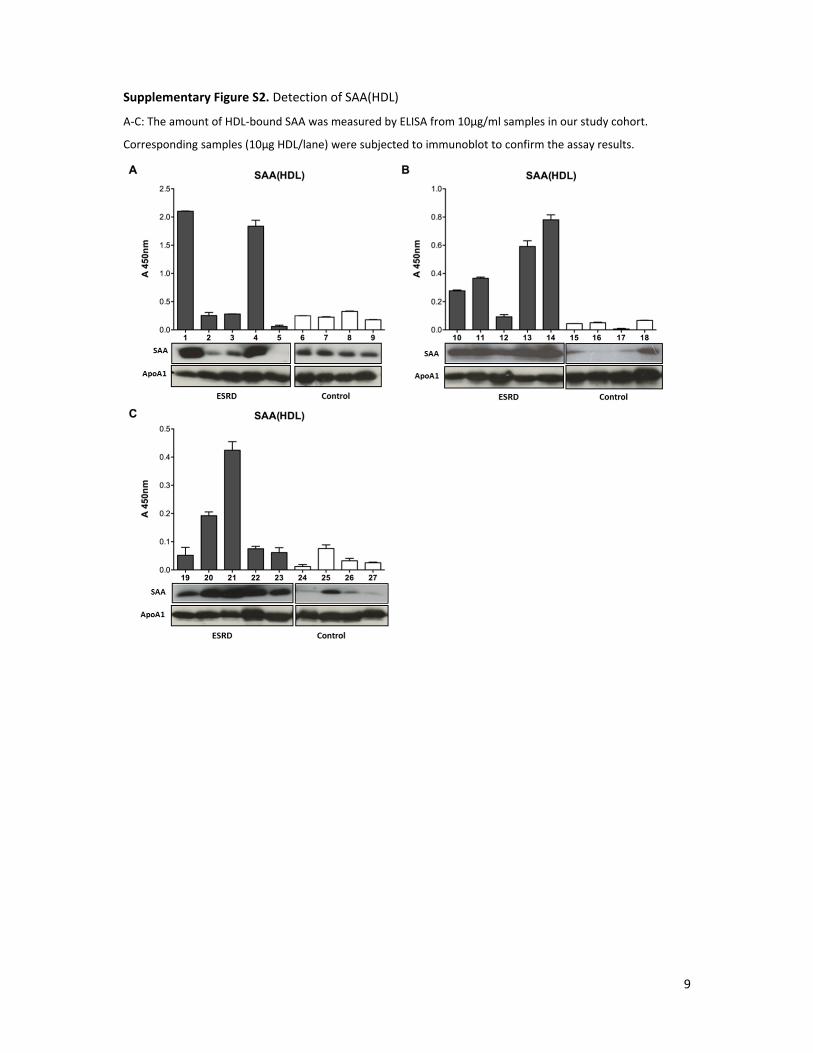
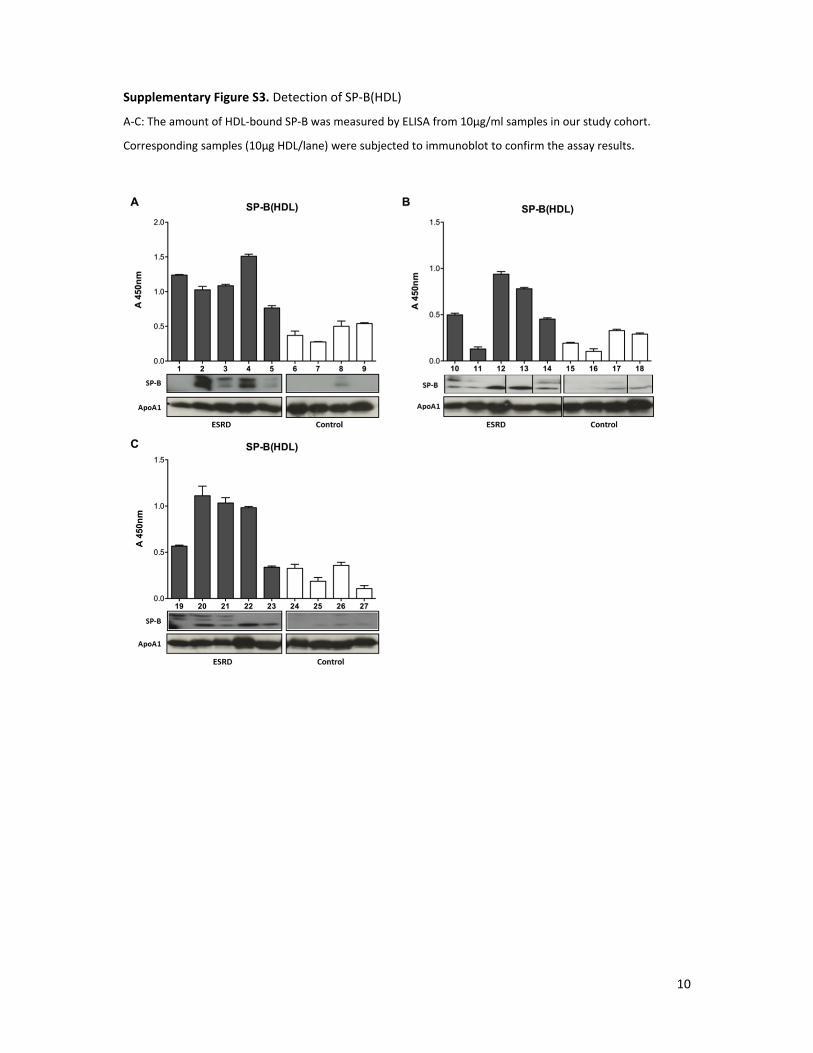
(10µg/ml) to define optimal assay conditions and to perform initial control experiments. The amount
of HDL‐associated SAA (SAA[HDL]) and SP‐B (SP‐B[HDL]) could be detected from purified HDLs
individually for patients and controls by our assay (Supplementary Figures S2 and S3). Western blots
of the respective HDL‐samples suggested that the levels of SAA(HDL) and SP‐B(HDL) measured by the
ELISA corresponded to the actual protein levels present in HDL (Supplementary Figures S2 and S3).
After testing the complete cohort, we could show that the range of SAA(HDL) was from 0.06 – 2.10 in
patients and from 0.01 ‐ 0.33 in controls (absolute absorbance values). The range of SP‐B(HDL) were
from 0.13 – 1.18 in patients and from 0.10 – 0.54 in controls (absolute absorbance values). When
comparing the mean levels between patients and controls, we found a significant enrichment of both
SAA and SP‐B in ESRD‐HDL (Supplementary Figure S4).
Next, we wanted to further optimize the specificity of our assay for serum samples, which
was anyway given by application of the HDL‐specific catching antibody. Therefore, we generated
apolipoprotein B‐depleted serum obtained by precipitation of LDL and VLDL with 20%
polyethyleneglycol (PEG) as described in the sample preparation section. Apolipoprotein B‐depleted
serum has been used by Khera et al. for the determination of the cholesterol efflux capacity of HDLs2.
Supplementary Figure S5 shows that apolipoprotein B‐depleted serum is devoid of detectable LDL
and VLDL (apo‐B100). We then measured SAA(HDL) and SP‐B(HDL) in apolipoprotein B‐depleted
serum from our cohort and compared it to the results from corresponding isolated HDL samples. We
found that SAA(HDL) and SP‐B(HDL) from apolipoprotein B‐depleted serum strongly correlated to
SAA and SP‐B values from isolated HDL (Supplementary Figure S6). The coefficient of variance (CV)
for the duplicate samples were 10.9% for SAA(HDL) and 21.6% for SP‐B(HDL). In addition, our assay
yielded highly reproducible results. When we measured the same apolipoprotein B‐depleted serum
5
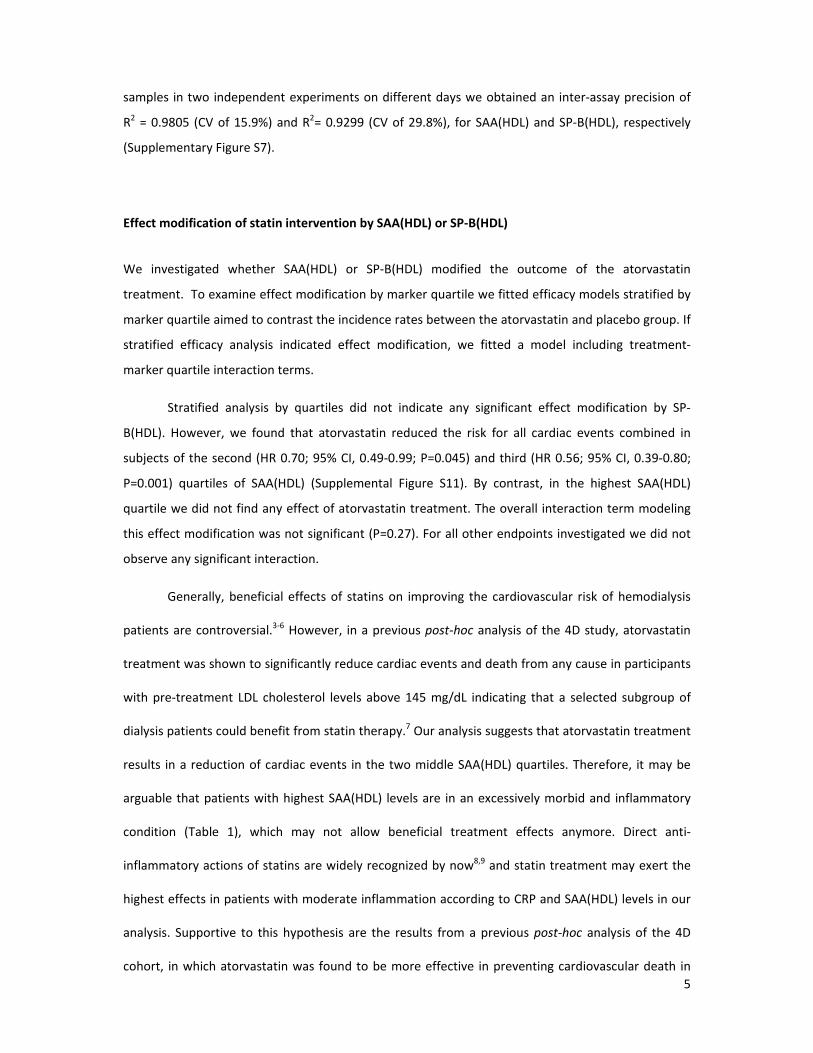
samples in two independent experiments on different days we obtained an inter‐assay precision of
R2 = 0.9805 (CV of 15.9%) and R2= 0.9299 (CV of 29.8%), for SAA(HDL) and SP‐B(HDL), respectively
(Supplementary Figure S7).
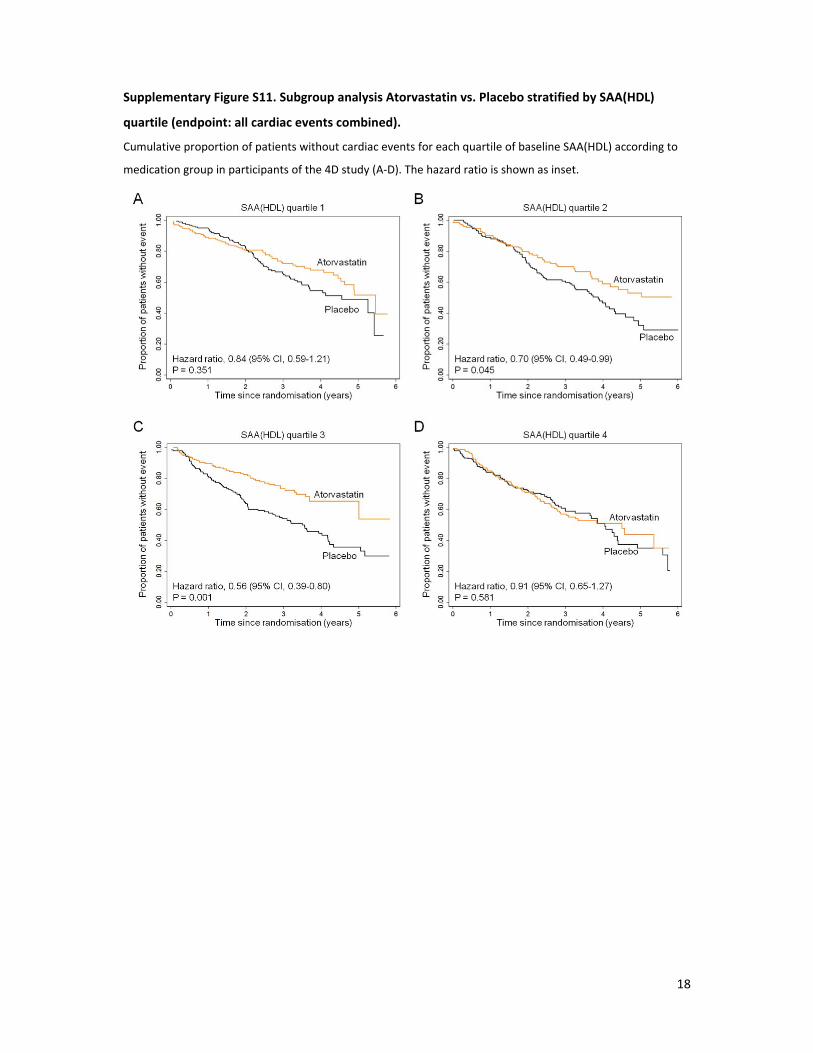
Effect modification of statin intervention by SAA(HDL) or SP‐B(HDL)
We investigated whether SAA(HDL) or SP‐B(HDL) modified the outcome of the atorvastatin
treatment. To examine effect modification by marker quartile we fitted efficacy models stratified by
marker quartile aimed to contrast the incidence rates between the atorvastatin and placebo group. If
stratified efficacy analysis indicated effect modification, we fitted a model including treatment‐
marker quartile interaction terms.
Stratified analysis by quartiles did not indicate any significant effect modification by SP‐
B(HDL). However, we found that atorvastatin reduced the risk for all cardiac events combined in
subjects of the second (HR 0.70; 95% CI, 0.49‐0.99; P=0.045) and third (HR 0.56; 95% CI, 0.39‐0.80;
P=0.001) quartiles of SAA(HDL) (Supplemental Figure S11). By contrast, in the highest SAA(HDL)
quartile we did not find any effect of atorvastatin treatment. The overall interaction term modeling
this effect modification was not significant (P=0.27). For all other endpoints investigated we did not
observe any significant interaction.
Generally, beneficial effects of statins on improving the cardiovascular risk of hemodialysis
patients are controversial.3‐6 However, in a previous post‐hoc analysis of the 4D study, atorvastatin
treatment was shown to significantly reduce cardiac events and death from any cause in participants
with pre‐treatment LDL cholesterol levels above 145 mg/dL indicating that a selected subgroup of
dialysis patients could benefit from statin therapy.7 Our analysis suggests that atorvastatin treatment
results in a reduction of cardiac events in the two middle SAA(HDL) quartiles. Therefore, it may be
arguable that patients with highest SAA(HDL) levels are in an excessively morbid and inflammatory
condition (Table 1), which may not allow beneficial treatment effects anymore. Direct anti‐
inflammatory actions of statins are widely recognized by now8,9 and statin treatment may exert the
highest effects in patients with moderate inflammation according to CRP and SAA(HDL) levels in our
analysis. Supportive to this hypothesis are the results from a previous post‐hoc analysis of the 4D
cohort, in which atorvastatin was found to be more effective in preventing cardiovascular death in

6
patients with intermediate serum CRP levels.10 Our data may suggest a possible stratification strategy
for statin treatment in ESRD patients. Nonetheless, our current secondary analysis of the 4D study
was not designed to identify effect modifications and thus it is critical to extend and validate our
results in independent patient collectives.
7
Supplementary References
1. Weichhart, T, Kopecky, C, Kubicek, M, Haidinger, M, Doller, D, Katholnig, K, Suarna, C, Eller, P, Tolle, M, Gerner, C, Zlabinger, GJ, van der Giet, M, Horl, WH, Stocker, R, Saemann, MD: Serum amyloid A in uremic HDL promotes inflammation. J Am Soc Nephrol, 23: 934‐947, 2012.
2. Khera, AV, Cuchel, M, de la Llera‐Moya, M, Rodrigues, A, Burke, MF, Jafri, K, French, BC, Phillips, JA, Mucksavage, ML, Wilensky, RL, Mohler, ER, Rothblat, GH, Rader, DJ: Cholesterol efflux capacity, high‐density lipoprotein function, and atherosclerosis. N Engl J Med, 364: 127‐135, 2011.
3. Wanner, C, Krane, V, Marz, W, Olschewski, M, Mann, JF, Ruf, G, Ritz, E: Atorvastatin in patients with type 2 diabetes mellitus undergoing hemodialysis. N Engl J Med, 353: 238‐248, 2005.
4. Fellstrom, BC, Jardine, AG, Schmieder, RE, Holdaas, H, Bannister, K, Beutler, J, Chae, DW, Chevaile, A, Cobbe, SM, Gronhagen‐Riska, C, De Lima, JJ, Lins, R, Mayer, G, McMahon, AW, Parving, HH, Remuzzi, G, Samuelsson, O, Sonkodi, S, Sci, D, Suleymanlar, G, Tsakiris, D, Tesar, V, Todorov, V, Wiecek, A, Wuthrich, RP, Gottlow, M, Johnsson, E, Zannad, F, Group, AS: Rosuvastatin and cardiovascular events in patients undergoing hemodialysis. N Engl J Med, 360: 1395‐1407, 2009.
5. Huang, CC, Chan, WL, Chen, YC, Chen, TJ, Chung, CM, Huang, PH, Lin, SJ, Chen, JW, Leu, HB: The beneficial effects of statins in patients undergoing hemodialysis. Int J Cardiol, 168: 4155‐4159, 2013.
6. Heymann, EP, Kassimatis, TI, Goldsmith, DJ: Dyslipidemia, statins, and CKD patients' outcomes ‐ review of the evidence in the post‐sharp era. Journal of nephrology, 25: 460‐472, 2012.
7. Marz, W, Genser, B, Drechsler, C, Krane, V, Grammer, TB, Ritz, E, Stojakovic, T, Scharnagl, H, Winkler, K, Holme, I, Holdaas, H, Wanner, C, German, D, Dialysis Study, I: Atorvastatin and low‐density lipoprotein cholesterol in type 2 diabetes mellitus patients on hemodialysis. Clin J Am Soc Nephrol, 6: 1316‐1325, 2011.
8. Ehrenstein, MR, Jury, EC, Mauri, C: Statins for atherosclerosis‐‐as good as it gets? N Engl J Med, 352: 73‐75, 2005.
9. Quist‐Paulsen, P: Statins and inflammation: an update. Current opinion in cardiology, 25: 399‐405, 2010.
10. Krane, V, Winkler, K, Drechsler, C, Lilienthal, J, Marz, W, Wanner, C, German, D, Dialysis Study, I: Effect of atorvastatin on inflammation and outcome in patients with type 2 diabetes mellitus on hemodialysis. Kidney Int, 74: 1461‐1467, 2008.
8
Supplementary Figure S1. Specificity of the ELISA
To check binding specificity of the HDL‐catching antibody, an ELISA plate was coated with 1µg/ml α‐human HDL
overnight and incubated with serum samples from ESRD patients and controls. After incubation, samples were
obtained directly from the plate, subjected to immunoblot and probed with the indicated antibodies against
HDL (apoA1) and LDL (apoB100).
9
Supplementary Figure S2. Detection of SAA(HDL)
A‐C: The amount of HDL‐bound SAA was measured by ELISA from 10µg/ml samples in our study cohort.
Corresponding samples (10µg HDL/lane) were subjected to immunoblot to confirm the assay results.
10
Supplementary Figure S3. Detection of SP‐B(HDL)
A‐C: The amount of HDL‐bound SP‐B was measured by ELISA from 10µg/ml samples in our study cohort.
Corresponding samples (10µg HDL/lane) were subjected to immunoblot to confirm the assay results.
11
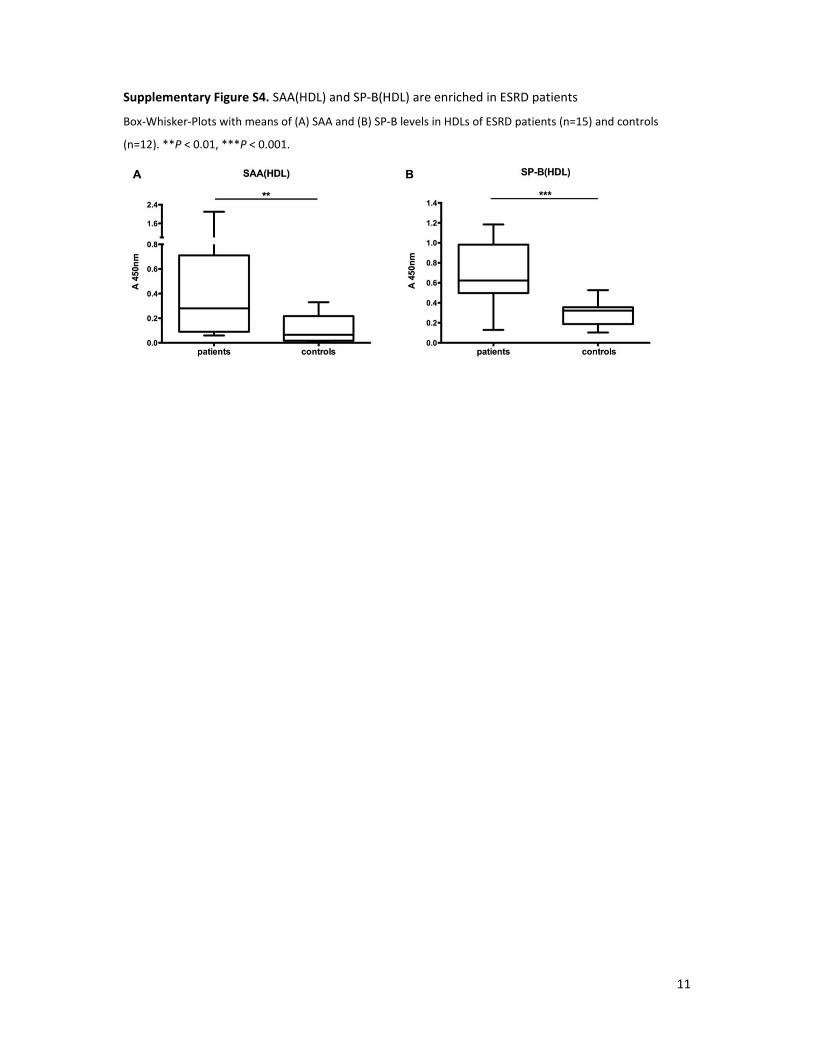
Supplementary Figure S4. SAA(HDL) and SP‐B(HDL) are enriched in ESRD patients
Box‐Whisker‐Plots with means of (A) SAA and (B) SP‐B levels in HDLs of ESRD patients (n=15) and controls
(n=12). **P < 0.01, ***P < 0.001.
12
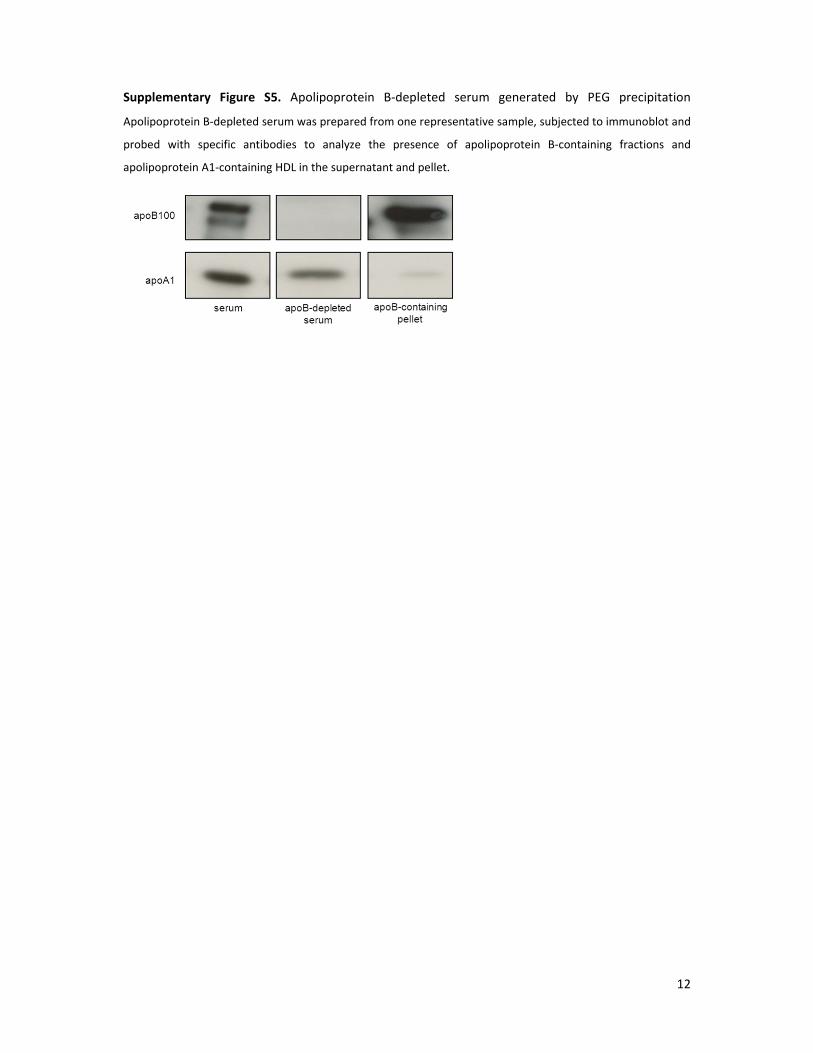
Supplementary Figure S5. Apolipoprotein B‐depleted serum generated by PEG precipitation
Apolipoprotein B‐depleted serum was prepared from one representative sample, subjected to immunoblot and
probed with specific antibodies to analyze the presence of apolipoprotein B‐containing fractions and
apolipoprotein A1‐containing HDL in the supernatant and pellet.
13
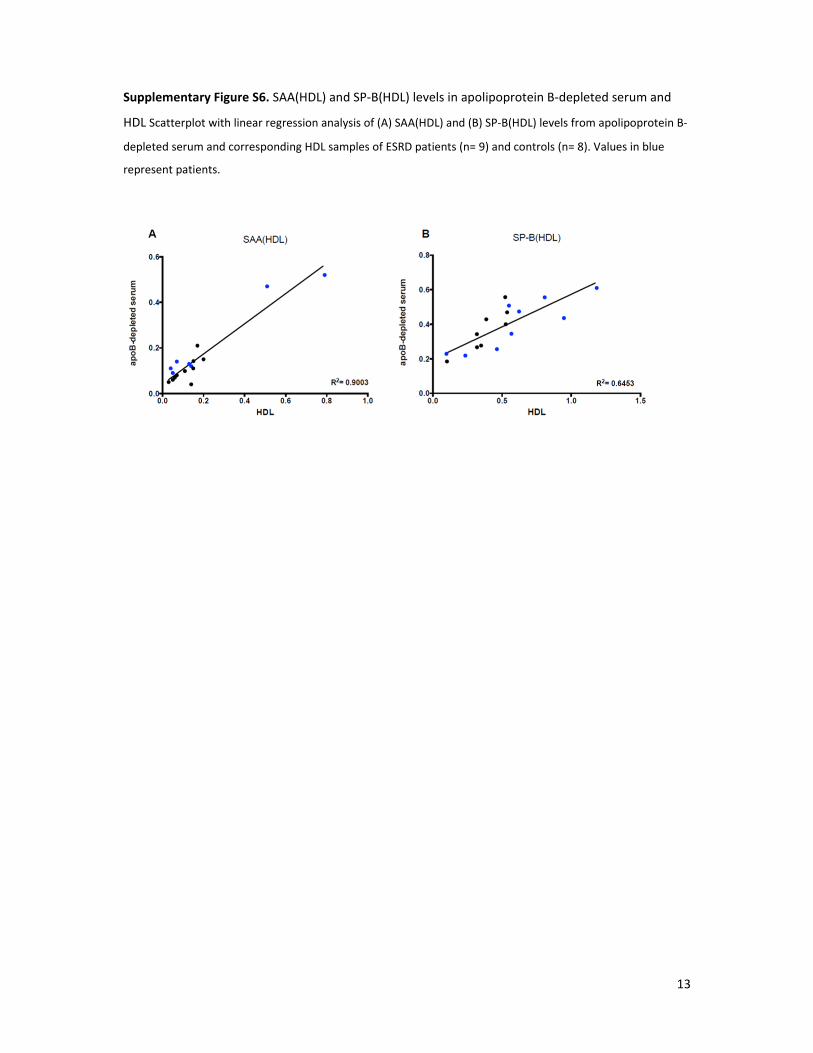
Supplementary Figure S6. SAA(HDL) and SP‐B(HDL) levels in apolipoprotein B‐depleted serum and
HDL Scatterplot with linear regression analysis of (A) SAA(HDL) and (B) SP‐B(HDL) levels from apolipoprotein B‐
depleted serum and corresponding HDL samples of ESRD patients (n= 9) and controls (n= 8). Values in blue
represent patients.
14
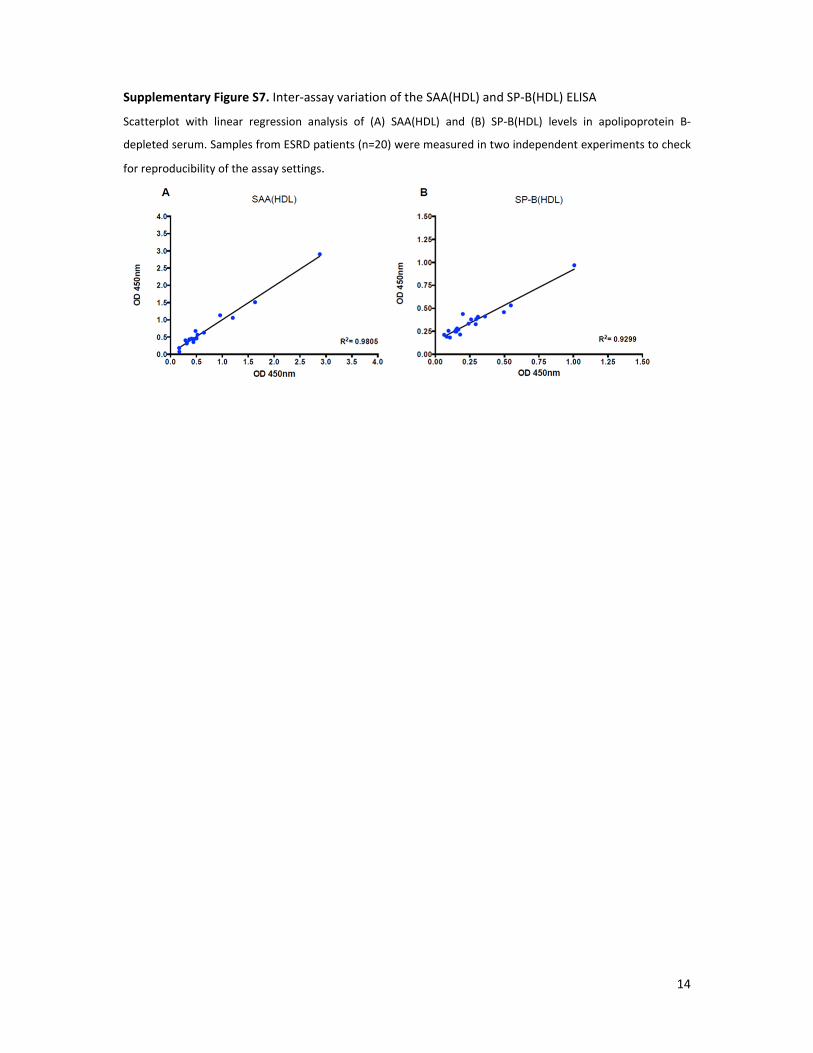
Supplementary Figure S7. Inter‐assay variation of the SAA(HDL) and SP‐B(HDL) ELISA
Scatterplot with linear regression analysis of (A) SAA(HDL) and (B) SP‐B(HDL) levels in apolipoprotein B‐
depleted serum. Samples from ESRD patients (n=20) were measured in two independent experiments to check
for reproducibility of the assay settings.
15
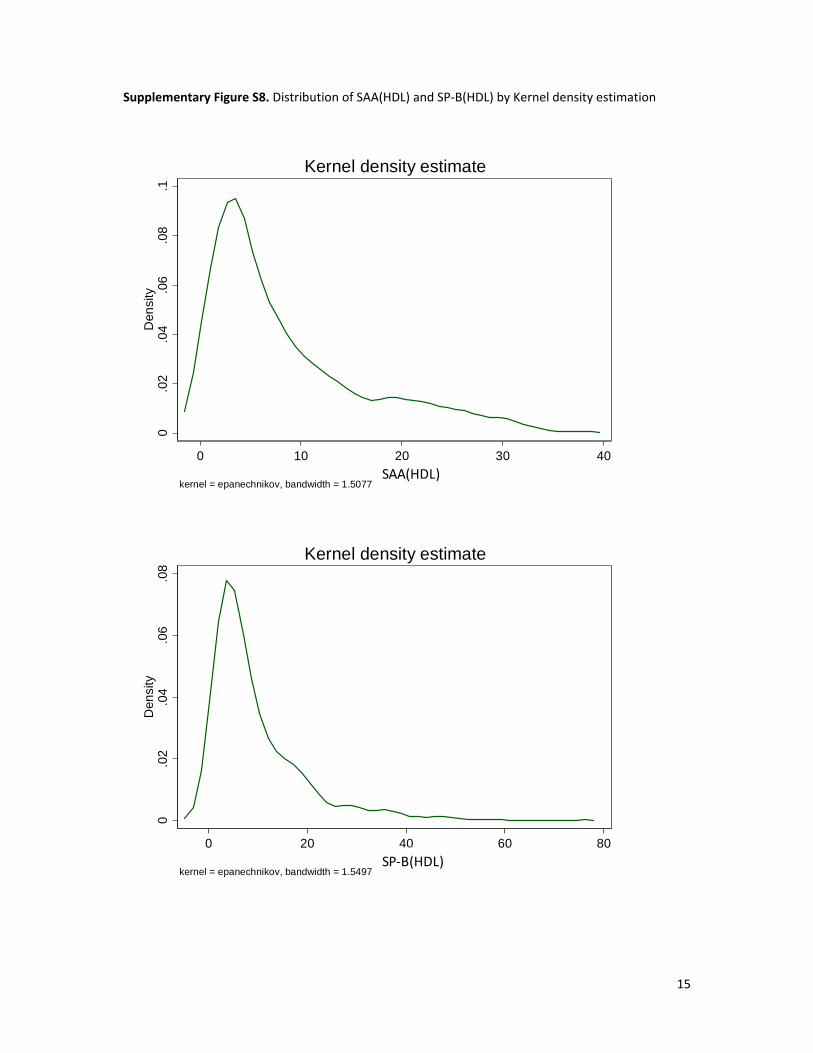
Supplementary Figure S8. Distribution of SAA(HDL) and SP‐B(HDL) by Kernel density estimation
0.0
2.0
4.0
6.0
8.1
Den
sity
0 10 20 30 40SAA
kernel = epanechnikov, bandwidth = 1.5077
Kernel density estimate
SAA(HDL)
0.0
2.0
4.0
6.0
8D
ensi
ty
0 20 40 60 80SP-B
kernel = epanechnikov, bandwidth = 1.5497
Kernel density estimate
SP‐B(HDL)
16
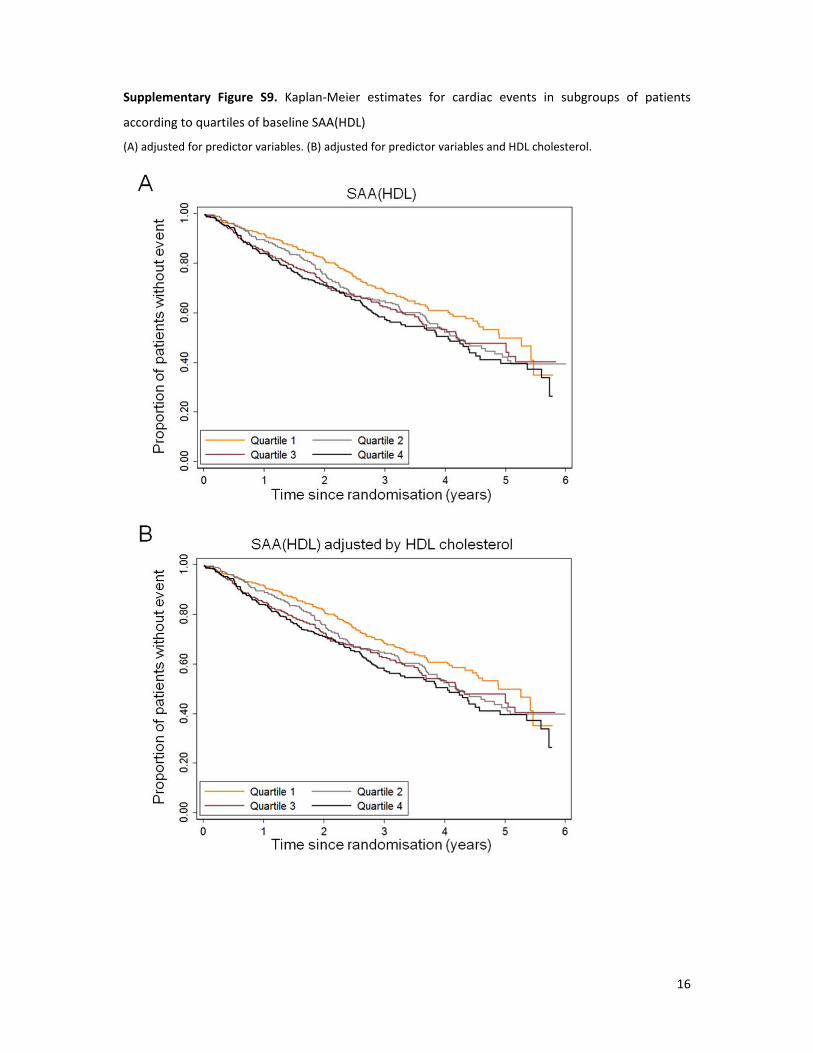
Supplementary Figure S9. Kaplan‐Meier estimates for cardiac events in subgroups of patients
according to quartiles of baseline SAA(HDL)
(A) adjusted for predictor variables. (B) adjusted for predictor variables and HDL cholesterol.
17
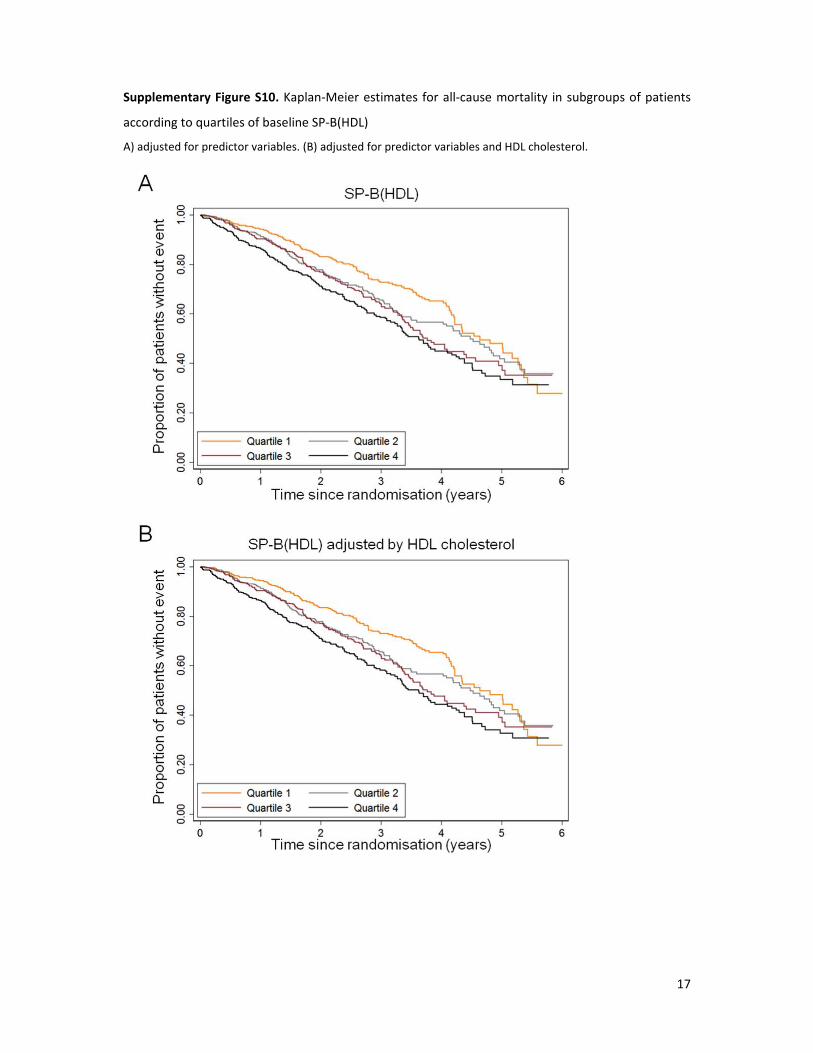
Supplementary Figure S10. Kaplan‐Meier estimates for all‐cause mortality in subgroups of patients
according to quartiles of baseline SP‐B(HDL)
A) adjusted for predictor variables. (B) adjusted for predictor variables and HDL cholesterol.
18
Supplementary Figure S11. Subgroup analysis Atorvastatin vs. Placebo stratified by SAA(HDL)
quartile (endpoint: all cardiac events combined).
Cumulative proportion of patients without cardiac events for each quartile of baseline SAA(HDL) according to
medication group in participants of the 4D study (A‐D). The hazard ratio is shown as inset.
19
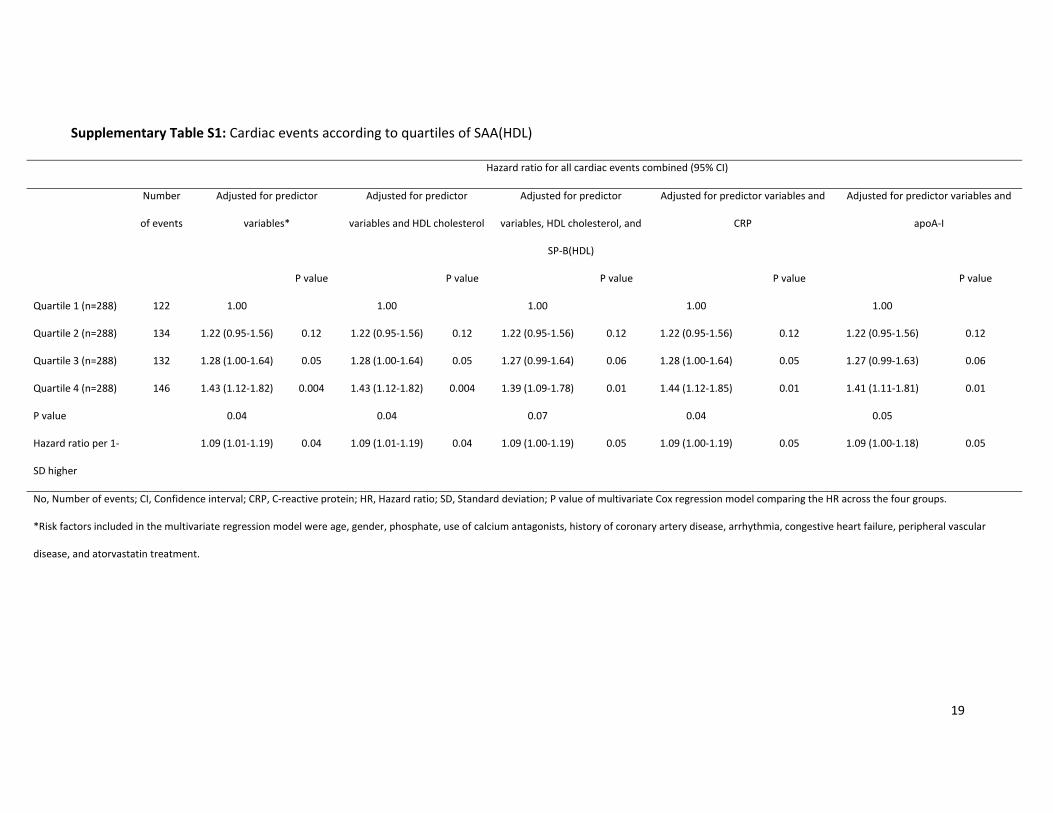
Supplementary Table S1: Cardiac events according to quartiles of SAA(HDL)
Hazard ratio for all cardiac events combined (95% CI)
Number
of events
Adjusted for predictor
variables*
Adjusted for predictor
variables and HDL cholesterol
Adjusted for predictor
variables, HDL cholesterol, and
SP‐B(HDL)
Adjusted for predictor variables and
CRP
Adjusted for predictor variables and
apoA‐I
P value P value P value P value P value
Quartile 1 (n=288) 122 1.00 1.00 1.00 1.00 1.00
Quartile 2 (n=288) 134 1.22 (0.95‐1.56) 0.12 1.22 (0.95‐1.56) 0.12 1.22 (0.95‐1.56) 0.12 1.22 (0.95‐1.56) 0.12 1.22 (0.95‐1.56) 0.12
Quartile 3 (n=288) 132 1.28 (1.00‐1.64) 0.05 1.28 (1.00‐1.64) 0.05 1.27 (0.99‐1.64) 0.06 1.28 (1.00‐1.64) 0.05 1.27 (0.99‐1.63) 0.06
Quartile 4 (n=288) 146 1.43 (1.12‐1.82) 0.004 1.43 (1.12‐1.82) 0.004 1.39 (1.09‐1.78) 0.01 1.44 (1.12‐1.85) 0.01 1.41 (1.11‐1.81) 0.01
P value 0.04 0.04 0.07 0.04 0.05
Hazard ratio per 1‐
SD higher
1.09 (1.01‐1.19) 0.04 1.09 (1.01‐1.19) 0.04 1.09 (1.00‐1.19) 0.05 1.09 (1.00‐1.19) 0.05 1.09 (1.00‐1.18) 0.05
No, Number of events; CI, Confidence interval; CRP, C‐reactive protein; HR, Hazard ratio; SD, Standard deviation; P value of multivariate Cox regression model comparing the HR across the four groups.
*Risk factors included in the multivariate regression model were age, gender, phosphate, use of calcium antagonists, history of coronary artery disease, arrhythmia, congestive heart failure, peripheral vascular
disease, and atorvastatin treatment.
20
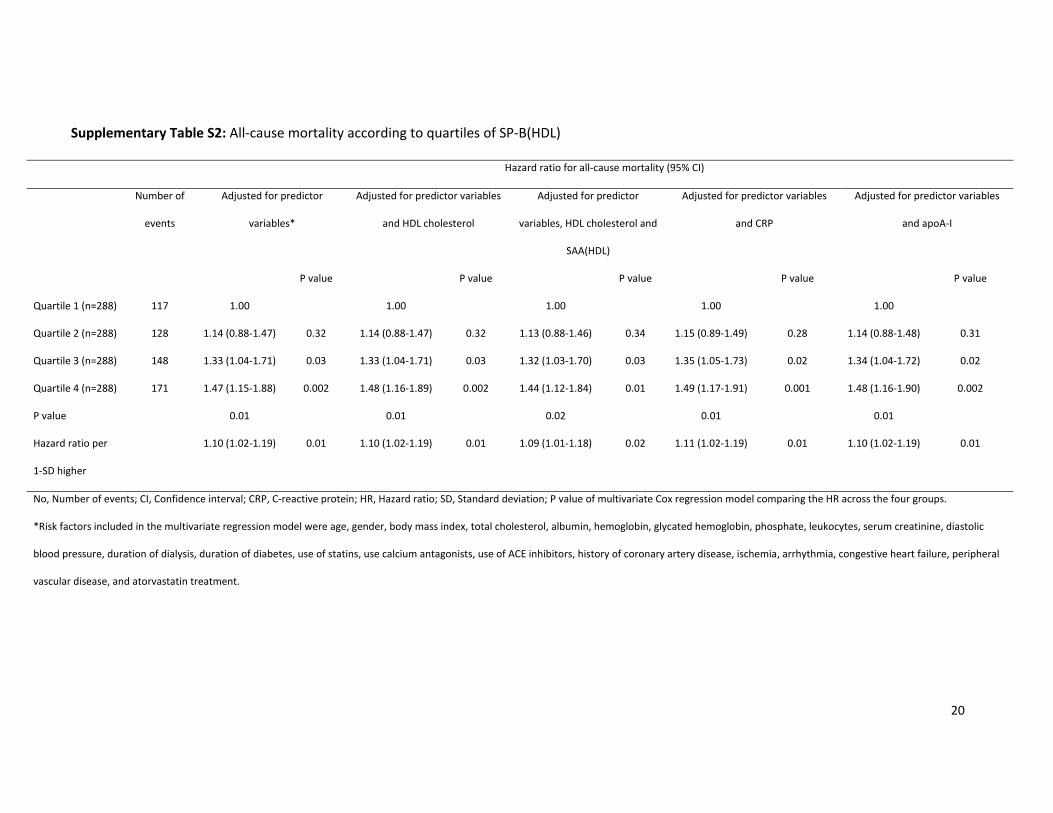
Supplementary Table S2: All‐cause mortality according to quartiles of SP‐B(HDL)
Hazard ratio for all‐cause mortality (95% CI)
Number of
events
Adjusted for predictor
variables*
Adjusted for predictor variables
and HDL cholesterol
Adjusted for predictor
variables, HDL cholesterol and
SAA(HDL)
Adjusted for predictor variables
and CRP
Adjusted for predictor variables
and apoA‐I
P value P value P value P value P value
Quartile 1 (n=288) 117 1.00 1.00 1.00 1.00 1.00
Quartile 2 (n=288) 128 1.14 (0.88‐1.47) 0.32 1.14 (0.88‐1.47) 0.32 1.13 (0.88‐1.46) 0.34 1.15 (0.89‐1.49) 0.28 1.14 (0.88‐1.48) 0.31
Quartile 3 (n=288) 148 1.33 (1.04‐1.71) 0.03 1.33 (1.04‐1.71) 0.03 1.32 (1.03‐1.70) 0.03 1.35 (1.05‐1.73) 0.02 1.34 (1.04‐1.72) 0.02
Quartile 4 (n=288) 171 1.47 (1.15‐1.88) 0.002 1.48 (1.16‐1.89) 0.002 1.44 (1.12‐1.84) 0.01 1.49 (1.17‐1.91) 0.001 1.48 (1.16‐1.90) 0.002
P value 0.01 0.01 0.02 0.01 0.01
Hazard ratio per
1‐SD higher
1.10 (1.02‐1.19) 0.01 1.10 (1.02‐1.19) 0.01 1.09 (1.01‐1.18) 0.02 1.11 (1.02‐1.19) 0.01 1.10 (1.02‐1.19) 0.01
No, Number of events; CI, Confidence interval; CRP, C‐reactive protein; HR, Hazard ratio; SD, Standard deviation; P value of multivariate Cox regression model comparing the HR across the four groups.
*Risk factors included in the multivariate regression model were age, gender, body mass index, total cholesterol, albumin, hemoglobin, glycated hemoglobin, phosphate, leukocytes, serum creatinine, diastolic
blood pressure, duration of dialysis, duration of diabetes, use of statins, use calcium antagonists, use of ACE inhibitors, history of coronary artery disease, ischemia, arrhythmia, congestive heart failure, peripheral
vascular disease, and atorvastatin treatment.