SUPPLEMENTARY INFORMATION - images.nature.com · binding region on CCNA2 (cyclin A2) promoter, g,...
10
SUPPLEMENTARY INFORMATION WWW.NATURE.COM/NATURECELLBIOLOGY 1 DOI: 10.1038/ncb2443 a. b. c. d. e. f. g. Figure S1 a-g, Visualisation of AGO2 ChIP-on-chip data obtained from Nimblegen arrays. a, AGO2 promoter association as detected on chromosome (chr) 16. Note the enrichment of AGO2 on promoters in senescence compared to control. b, AGO2 binding region on PCNA promoter. c, AGO2 binding region on CCNE2 (cyclin E2) promoter. d, AGO2 binding region on CDCA8 promoter. e, AGO2 binding region on CDC2 promoter. f, AGO2 binding region on CCNA2 (cyclin A2) promoter, g, AGO2 binding region on CDC6 promoter . Red peaks represent false discovery rate (FDR) score ≤ 0.05. Orange peaks FDR score ≤ 0,1; Yellow peaks 0,1 < FDR score ≤ 0,2; Grey peaks represent the lowest probability of a peak with FDR score > 0.2. © 2012 Macmillan Publishers Limited. All rights reserved.
-
Upload
truongkien -
Category
Documents
-
view
215 -
download
0
Transcript of SUPPLEMENTARY INFORMATION - images.nature.com · binding region on CCNA2 (cyclin A2) promoter, g,...

S U P P L E M E N TA RY I N F O R M AT I O N
WWW.NATURE.COM/NATURECELLBIOLOGY 1
DOI: 10.1038/ncb2443
Supplementary Information, Fig. S1 a. b.
c. d.
e. f.
g.
Figure S1 a-g, Visualisation of AGO2 ChIP-on-chip data obtained from Nimblegen arrays. a, AGO2 promoter association as detected on chromosome (chr) 16. Note the enrichment of AGO2 on promoters in senescence compared to control. b, AGO2 binding region on PCNA promoter. c, AGO2 binding region on CCNE2 (cyclin E2) promoter. d, AGO2 binding region
on CDCA8 promoter. e, AGO2 binding region on CDC2 promoter. f, AGO2 binding region on CCNA2 (cyclin A2) promoter, g, AGO2 binding region on CDC6 promoter . Red peaks represent false discovery rate (FDR) score ≤ 0.05. Orange peaks FDR score ≤ 0,1; Yellow peaks 0,1 < FDR score ≤ 0,2; Grey peaks represent the lowest probability of a peak with FDR score > 0.2.
© 2012 Macmillan Publishers Limited. All rights reserved.
S U P P L E M E N TA RY I N F O R M AT I O N
2 WWW.NATURE.COM/NATURECELLBIOLOGY
S U P P L E M E N TA RY I N F O R M AT I O N
e.
d.
C S C S C S Input cytoplasm nucleus
AGO2
Lamin B
GAPDH
Supplementary Information, Fig. S2
f.
c.
DAPI AGO2 MERGE
Control
Doxorubicin
Rb-off (TET+)
Rb-on (TET-)
DAPI AGO2 MERGE Rb
a. b.
Adaptor-Ligation
Cellular RNA AGO-RIP
Next Generation Seq
Bioinformatic Analysis
Senescent Cells
H3K9me2-RIP
FH-AGO AGO 1 2 3 4
α-AGO2
α-HA 95
Nuclear mitotic apparatus protein1 Cylindromatosis Geminin mutL homolog1 H2AX Cyclin-dependent Kinase Inhibitor 3 MCM2 Nuclear Protein, ATM locus Ubiquitin-Conjugating Enzyme E2S Ligase I Vacuolar Protein Sorting 24 Homolog 5 (S. Cerevisiae) CDC28 Protein Kinase Regulatory Subunit 1B Rac GTPase Activating Protein 1 Protein Regulator of Cytokinesis 1 Ubiquitin-Conjugating Enzyme E2C Kinesin Family Member C1 Budding Uninhibited by Benzimidazoled 3 Homolog (yeast) Kinesin Family Member 11 CDC25B Homolog (S. pombe) CDCA8 Sperm-Associated Antigen 5 CDC6 Homolog (S. Cerevisiae) Cyclin A2 CDC23 homolog (S. Cerevisiae) CDCA3 Opa-Interacting Protein 5 Nucleolar and Spindle-Associated Protein1 Budding Uninhibited by Benzimidazoled 1 Homolog (yeast) NIMA-Related Kinase 2 Telomeric-Repeat Binding Factor (NIMA-Inetracting) 1 Kinesin Family Member 2C Chromosome 21 Open Reading Frame 45 CENP-F (Mitosin) Budding Uninhibited by Benzimidazoled 1 Homolog Beta (yeast) CENP-E M
itosis C
ell Divison
Cell C
ycle
Figure S2 a, Functional annotation clustering of AGO-bound E2F target genes downregulated in senescence. AGO-binding to downregulated E2F targets shows predilection for cell cycle control genes (colored in blue). Enrichment score is 21,04 and p-value < 0,01 using DAVID gene ontology tool (see also Supplementary Information, Table S2). b, Experimental design for small RNA sequence aquisition using Next-Generation Sequencing (Next-Generation-Seq) and bioinformatic analysis; RIP, RNA immunoprecipitation. c, Anti-Ago2 antibody (9E8.2) is AGO2-specific. Flag/HA(FH)-tagged Ago genes (FH-Ago1 through FH-Ago4) were expressed in Hela cells and cell lysates analysed by immunoblot using mouse monoclonal anti-AGO2 9E8.2 or anti-HA antibodies. d-f, AGO2 accumulates in nucleus of senescent
cancer cells. MCF-7 breast cancer cells were left untreated or treated with 1mM doxorubicin for 24 hrs (MCF-7). Subsequently, doxorubicin was washed out and cells were left unperturbed for 5 days after which cells aquired a senescence phenotype. Tetracyclin was washed out from TET-off Rb-inducible SAOS-2 osteosarcoma cancer cells (-TET) and cell cultures were replenished with fresh medium and left unperturbed for 5 days at which point cells underwent senescence. d, Localisation of AGO2 as determined by preparation of cytosolic and nuclear fractions from cell lysates of MCF-7 cells as described in Material and Methods. Indirect immunofluorescence of AGO2 in pre-extracted e, doxorubicin-induced MCF-7 (scale bar 20mm) and f, Rb-induced SAOS-2 senescent cells 5 days post-treatment; scale bar 15mm.
© 2012 Macmillan Publishers Limited. All rights reserved.
S U P P L E M E N TA RY I N F O R M AT I O N
WWW.NATURE.COM/NATURECELLBIOLOGY 3
Nevus Melanoma
Supplementary Information, Fig. S3
AGO2 macroH2A1.2 AGO2/macroH2A1.2 DAPI MERGE b.
c.
d.
e.
f.
g.
a.
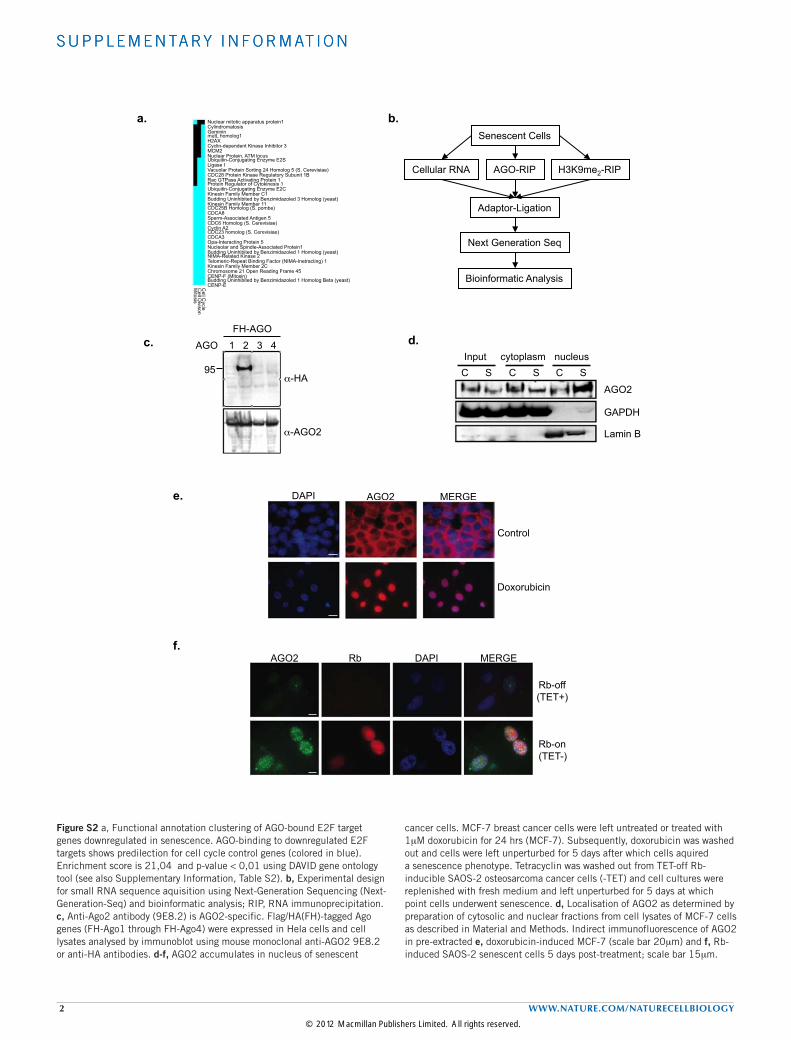
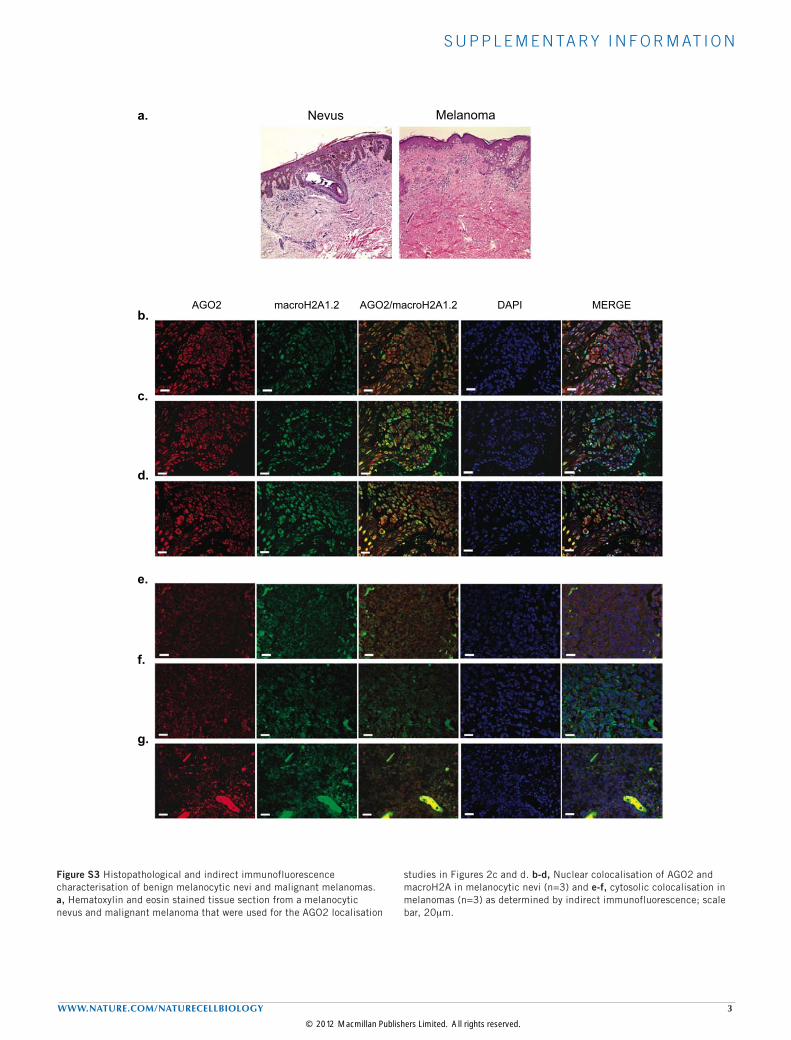
Figure S3 Histopathological and indirect immunofluorescence characterisation of benign melanocytic nevi and malignant melanomas. a, Hematoxylin and eosin stained tissue section from a melanocytic nevus and malignant melanoma that were used for the AGO2 localisation
studies in Figures 2c and d. b-d, Nuclear colocalisation of AGO2 and macroH2A in melanocytic nevi (n=3) and e-f, cytosolic colocalisation in melanomas (n=3) as determined by indirect immunofluorescence; scale bar, 20mm.
© 2012 Macmillan Publishers Limited. All rights reserved.
S U P P L E M E N TA RY I N F O R M AT I O N
4 WWW.NATURE.COM/NATURECELLBIOLOGY
Supplementary Information, Fig. S4
b.
a.
c.
C S
0 0,2 0,4 0,6 0,8
1 1,2 1,4
Rel
. Exp
ress
ion
0
% o
f inp
ut
C S
0,1
0,2
0,3
0,4
0,5
-4 -3 -2 -0 +2 +5 +13
Infection Selection
siRNAs miRs
Antagomir Assays
Time (d)
0
0,4
0,8
1,2
1,6 siC siAGO2
CDC2 CDCA8 PCNA CCNA2
Fold
-enr
icm
ent
d.
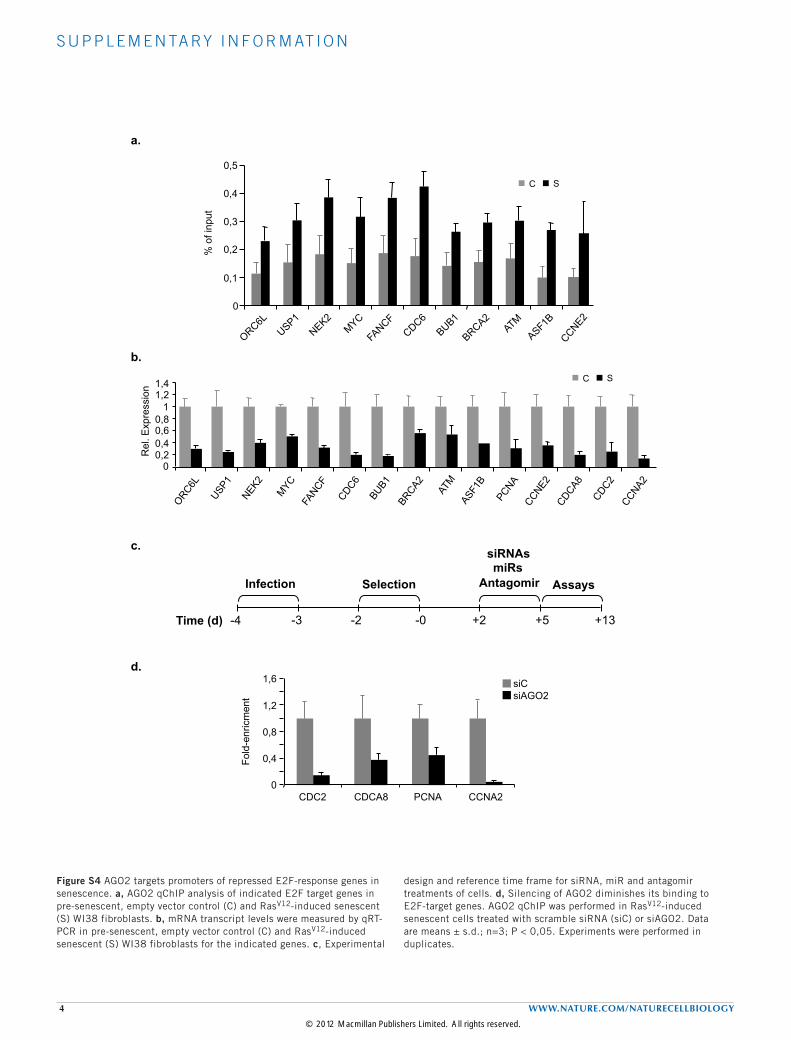
Figure S4 AGO2 targets promoters of repressed E2F-response genes in senescence. a, AGO2 qChIP analysis of indicated E2F target genes in pre-senescent, empty vector control (C) and RasV12-induced senescent (S) WI38 fibroblasts. b, mRNA transcript levels were measured by qRT-PCR in pre-senescent, empty vector control (C) and RasV12-induced senescent (S) WI38 fibroblasts for the indicated genes. c, Experimental
design and reference time frame for siRNA, miR and antagomir treatments of cells. d, Silencing of AGO2 diminishes its binding to E2F-target genes. AGO2 qChIP was performed in RasV12-induced senescent cells treated with scramble siRNA (siC) or siAGO2. Data are means ± s.d.; n=3; P < 0,05. Experiments were performed in duplicates.
© 2012 Macmillan Publishers Limited. All rights reserved.
S U P P L E M E N TA RY I N F O R M AT I O N
WWW.NATURE.COM/NATURECELLBIOLOGY 5
Supplementary Information, Fig. S5
H3K27me3 DAPI MERGE
AGO2 H3K9me3 DAPI MERGE a.
b.
siC siAGO2
Rel
. Gen
e E
xpre
ssio
n
0 0,5
1 1,5
2 2,5
3
USP1 NEK2 MYC FANCF CDC6 BUB1 BRCA2 ATM ASF1B ORC6L
3,5 c.
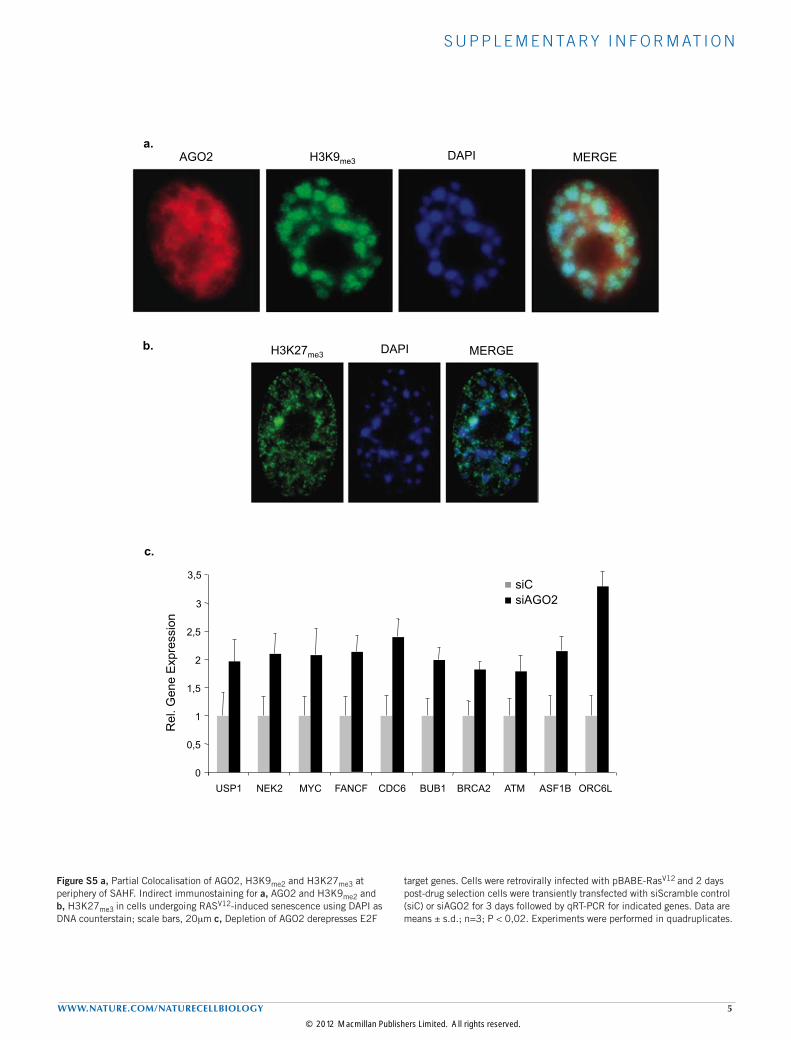
Figure S5 a, Partial Colocalisation of AGO2, H3K9me2 and H3K27me3 at periphery of SAHF. Indirect immunostaining for a, AGO2 and H3K9me2 and b, H3K27me3 in cells undergoing RASV12-induced senescence using DAPI as DNA counterstain; scale bars, 20mm c, Depletion of AGO2 derepresses E2F
target genes. Cells were retrovirally infected with pBABE-RasV12 and 2 days post-drug selection cells were transiently transfected with siScramble control (siC) or siAGO2 for 3 days followed by qRT-PCR for indicated genes. Data are means ± s.d.; n=3; P < 0,02. Experiments were performed in quadruplicates.
© 2012 Macmillan Publishers Limited. All rights reserved.

S U P P L E M E N TA RY I N F O R M AT I O N
6 WWW.NATURE.COM/NATURECELLBIOLOGY
Ras
shA
GO
2-2
shA
GO
2-1
shC
Tub
RasV12
C
Supplementary Information, Fig. S6
0 0,5
1 1,5
Rel
. AG
O2
Exp
ress
ion
AGO2
Tub
shA
GO
2-2
shA
GO
2-1
shC
a.
b.
c.
d.
0 0,5
1 1,5
Rel
. AG
O2
Exp
ress
ion
Figure S6 Depletion of AGO2 delays the onset of RasV12-induced and replicative senescence. a, Immunoblot analysis of lysates from empty vector control cells (C), RasV12-infected cells expressing shControl (shC) or the indicated shAGO2s (as used in Figs. 3e-g) probed for Ras and b-tubulin (Tub) at day 14 of life span study. (b-c), Stable down-regulation of AGO2 by shRNAs expression in cells undergoing RasV12-induced senescence (used
in Figs. 3e-g) as determined by b, qRT-PCR and c, Western blot at day 14 of life span study. Tubulin (Tub) is used as loading control. d, Relative gene expression of AGO2 in control (shC) and AGO2-depleted (shAGO2-1/2) cell populations undergoing replicative senescence as determined by qRT-PCR. Data are means ± s.d.; n=3; P < 0,05. Experiments were performed in duplicates.
© 2012 Macmillan Publishers Limited. All rights reserved.
S U P P L E M E N TA RY I N F O R M AT I O N
WWW.NATURE.COM/NATURECELLBIOLOGY 7
p-value FDR
Geom mean of intensities
Control
Geom mean of intensities
Senescence
Ratio geom means S/C Unique id
0,02 0,21 272,5 1671,4 6,1 hsa-let-7f-2-prec2
0,003 0,16 1107,6 4248,7 3,8 hsa-let-7a-1-prec
0,005 0,16 1083 3848,1 3,5 hsa-let-7c-prec
0,006 0,16 1268,8 4447,1 3,5 hsa-let-7a-2-precNo2
0,007 0,16 846,6 2947,1 3,4 hsa-let-7g-precNo1
0,004 0,16 766,7 2565,8 3,3 hsa-let-7d-prec
0,008 0,16 367,7 1106,5 3,0 hsa-let-7d-v1-prec
0,009 0,16 342,1 983,1 2,8 hsa-let-7f-1-precNo2
0,01 0,17 846,2 2407,4 2,2 hsa-let-7a-3-prec
0,03 0,25 1048,7 2428,9 2,3 hsa-let-7iNo1
0,04 0,34 367,7 765,7 2,0 hsa-let-7d-v1-prec
0,005 0,14 342,1 677,1 1,9 hsa-let-7f-1-precNo2
0,01 0,31 4672,2 3325,7 0,7 hsa-let-7b-prec
0,01 0,17 789,5 276,3 0,35 hsa-let-7d-v2-precNo1
0,006 0,14 789,5 193,9 0,24 hsa-let-7d-v2-precNo1
0,02 0,25 952,3 186,1 0,19 hsa-let-7iNo2
Supplementary Information, Fig. S7
CDC2 -450 Chr 10q21
TSS +1
Luciferase -450 let-7 Wildtype
+51
-410 -388
E2F
-143 -138
Luciferase -386 let-7
+51
E2F
b.
c.
d.
e.
0 1 2 3 4 5 6
C Rb Rb-let7 Rb-Ago2 Rb-Ago2-let7
Fold
-Rep
ress
ion
1 1,1 1,82 1,47
2,97 1,91
4,22
1,91
5,11
2,29
let-7 wt
1,53 1,25
let-7
a.
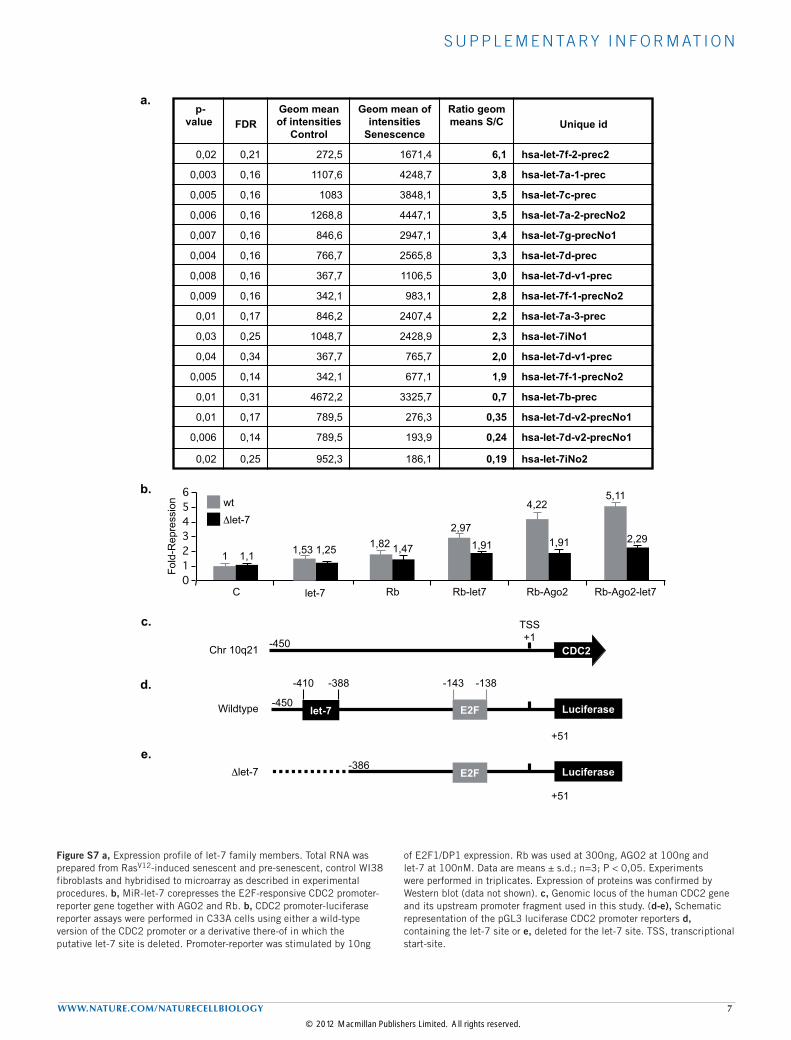
Figure S7 a, Expression profile of let-7 family members. Total RNA was prepared from RasV12-induced senescent and pre-senescent, control WI38 fibroblasts and hybridised to microarray as described in experimental procedures. b, MiR-let-7 corepresses the E2F-responsive CDC2 promoter-reporter gene together with AGO2 and Rb. b, CDC2 promoter-luciferase reporter assays were performed in C33A cells using either a wild-type version of the CDC2 promoter or a derivative there-of in which the putative let-7 site is deleted. Promoter-reporter was stimulated by 10ng
of E2F1/DP1 expression. Rb was used at 300ng, AGO2 at 100ng and let-7 at 100nM. Data are means ± s.d.; n=3; P < 0,05. Experiments were performed in triplicates. Expression of proteins was confirmed by Western blot (data not shown). c, Genomic locus of the human CDC2 gene and its upstream promoter fragment used in this study. (d-e), Schematic representation of the pGL3 luciferase CDC2 promoter reporters d, containing the let-7 site or e, deleted for the let-7 site. TSS, transcriptional start-site.
© 2012 Macmillan Publishers Limited. All rights reserved.
S U P P L E M E N TA RY I N F O R M AT I O N
8 WWW.NATURE.COM/NATURECELLBIOLOGY
f.
% p
ositi
ve c
ells
100 80 60 40 20
Ki67 SA-β-Gal
C Pre-miR-let-7f
a.
0
0,5
1
1,5 mRNA
C Pre-mir-let-7f
CDCA8
CDC2
Fold
Enr
ichm
ent
b.
H3K27me3
C Pre-miR-let-7f 0 1 2 3 4 5 AGO2
C Pre-mir-let-7f
CDCA8
CDC2
Fold
Enr
ichm
ent
g.
100
200
300
0
400
Cel
l Num
ber x
103
siC siC+siAGO2 let-7+siAGO2 let-7+siC
e.
0
100
200
0 5 10
C
pre-miR-let-7f
Cel
l Num
ber x
103
300
time (days)
Supplementary Information, Fig. S8
0
0,5
1
1,5 Biotin-let-7 ChOP
CDCA8 CDC6
Fold
-enr
ichm
ent
d.
siCDCA8
Biotin-miR-185 qChIP-ChOP
0 1 2 3 4
1. α-Control 2. SA
1. α-AGO2 2. SA
c.
Fold
Enr
ichm
ent
Sense ORC6L
ORC6L * miR-target -257/236 -38/31
AGGAGGGAAAGGCAGTGTGTGA!
TGGAGAGAAAGGCAGTTCCTGA!
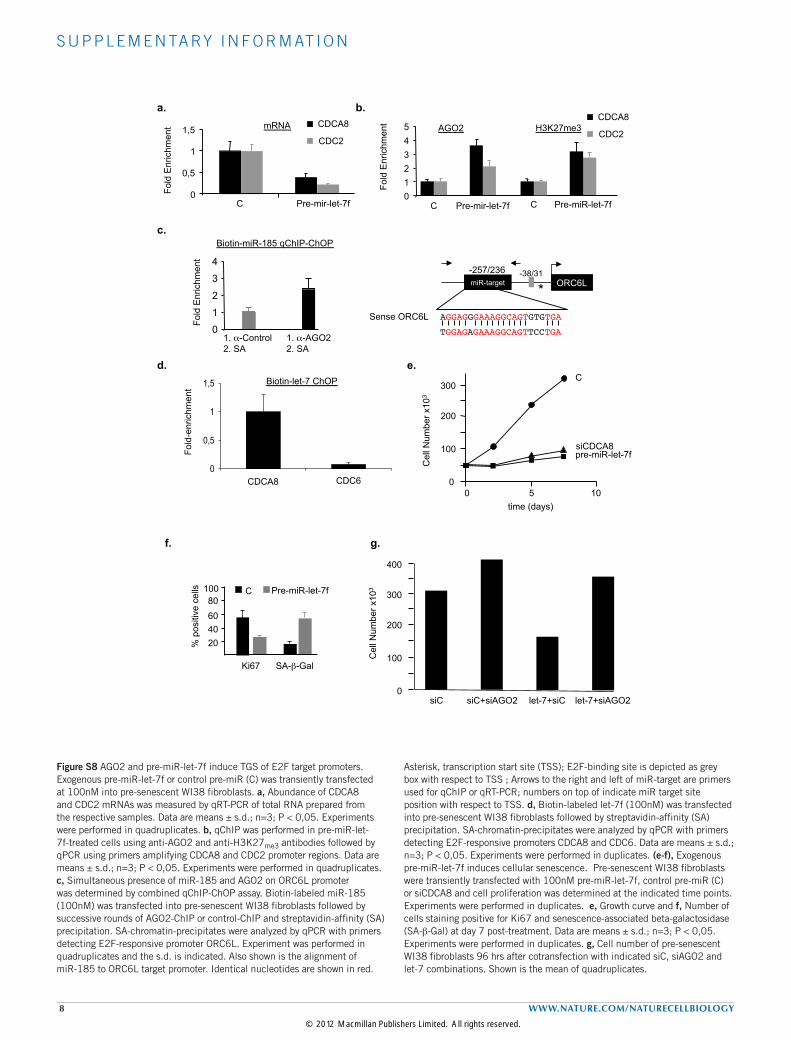
Figure S8 AGO2 and pre-miR-let-7f induce TGS of E2F target promoters. Exogenous pre-miR-let-7f or control pre-miR (C) was transiently transfected at 100nM into pre-senescent WI38 fibroblasts. a, Abundance of CDCA8 and CDC2 mRNAs was measured by qRT-PCR of total RNA prepared from the respective samples. Data are means ± s.d.; n=3; P < 0,05. Experiments were performed in quadruplicates. b, qChIP was performed in pre-miR-let-7f-treated cells using anti-AGO2 and anti-H3K27me3 antibodies followed by qPCR using primers amplifying CDCA8 and CDC2 promoter regions. Data are means ± s.d.; n=3; P < 0,05. Experiments were performed in quadruplicates. c, Simultaneous presence of miR-185 and AGO2 on ORC6L promoter was determined by combined qChIP-ChOP assay. Biotin-labeled miR-185 (100nM) was transfected into pre-senescent WI38 fibroblasts followed by successive rounds of AGO2-ChIP or control-ChIP and streptavidin-affinity (SA) precipitation. SA-chromatin-precipitates were analyzed by qPCR with primers detecting E2F-responsive promoter ORC6L. Experiment was performed in quadruplicates and the s.d. is indicated. Also shown is the alignment of miR-185 to ORC6L target promoter. Identical nucleotides are shown in red.
Asterisk, transcription start site (TSS); E2F-binding site is depicted as grey box with respect to TSS ; Arrows to the right and left of miR-target are primers used for qChIP or qRT-PCR; numbers on top of indicate miR target site position with respect to TSS. d, Biotin-labeled let-7f (100nM) was transfected into pre-senescent WI38 fibroblasts followed by streptavidin-affinity (SA) precipitation. SA-chromatin-precipitates were analyzed by qPCR with primers detecting E2F-responsive promoters CDCA8 and CDC6. Data are means ± s.d.; n=3; P < 0,05. Experiments were performed in duplicates. (e-f), Exogenous pre-miR-let-7f induces cellular senescence. Pre-senescent WI38 fibroblasts were transiently transfected with 100nM pre-miR-let-7f, control pre-miR (C) or siCDCA8 and cell proliferation was determined at the indicated time points. Experiments were performed in duplicates. e, Growth curve and f, Number of cells staining positive for Ki67 and senescence-associated beta-galactosidase (SA-b-Gal) at day 7 post-treatment. Data are means ± s.d.; n=3; P < 0,05. Experiments were performed in duplicates. g, Cell number of pre-senescent WI38 fibroblasts 96 hrs after cotransfection with indicated siC, siAGO2 and let-7 combinations. Shown is the mean of quadruplicates.
© 2012 Macmillan Publishers Limited. All rights reserved.
S U P P L E M E N TA RY I N F O R M AT I O N
WWW.NATURE.COM/NATURECELLBIOLOGY 9
AGO2
Histone H3
AGO2
Lamin B
GAPDH
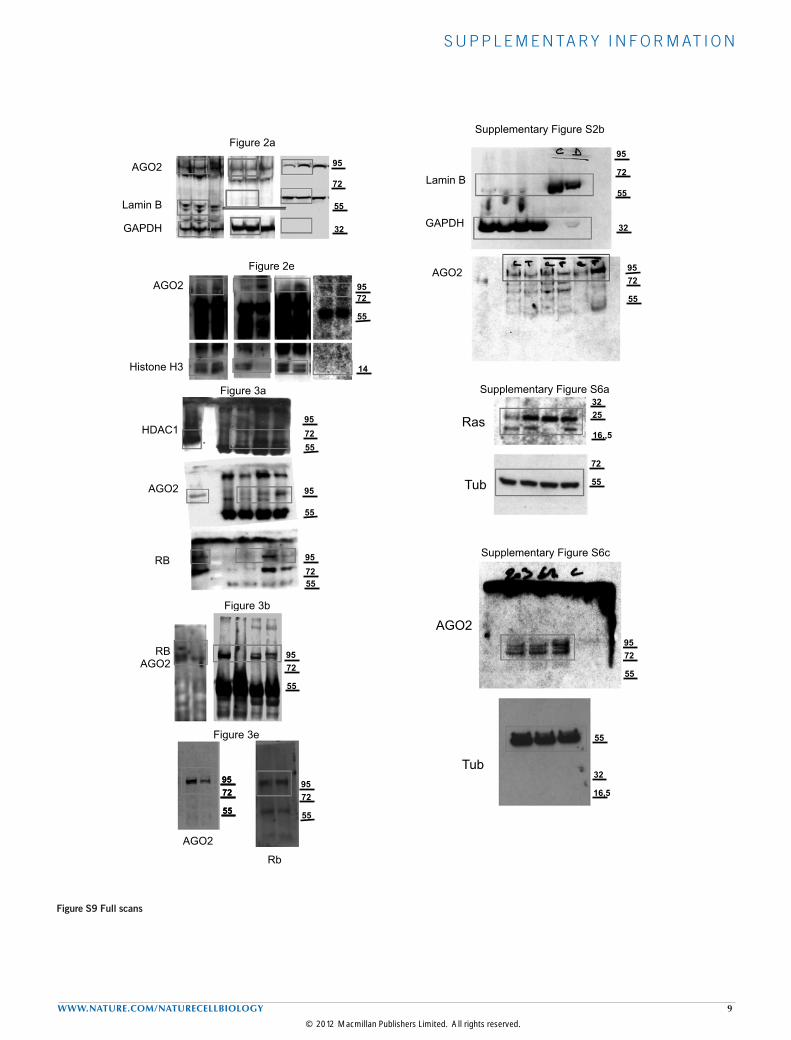
Supplementary_Information_ Fig_S9: Full scans of Figures
Figure 2a
Figure 2e
Figure 3e
AGO2
Rb
RB AGO2
Figure 3b
HDAC1
AGO2
RB
55 72 95
55
95
55 72 95
55
72 95
Figure 3a
55
72 95
55
72 95
AGO2
Lamin B
GAPDH
Supplementary Figure S2b
Ras
Tub
Supplementary Figure S6a
AGO2
Tub
Supplementary Figure S6c
55
16,5
32
55
72 95
55
72
16,,5
25 32
55
72 95
55
72
95
55
72 95
55
72
95
14
32 32
55
72 95
Figure S9 Full scans
© 2012 Macmillan Publishers Limited. All rights reserved.
S U P P L E M E N TA RY I N F O R M AT I O N
10 WWW.NATURE.COM/NATURECELLBIOLOGY
Supplementary Tables
Supplementary Table S1: List of genome-wide AGO2-bound- and AGO2-bound E2F target promoters in pre-senescent, control and oncogenic RASV12-induced senescent cells and their respective expression statuses (up-down; only E2F-targets are shown).
Supplementary Table S2. Annotated gene ontology analysis using DAVID. Depicted is the functional annotation cluster including cell cycle, mitosis and cell division for AGO-bound E2F target genes repressed in senescence showing the highest enrichment score.
Supplementary Table S3. Summary of ILLUMINA Next-Generation Sequencing (NGS). Usable sequence reads are reads after trimming of adapter and selection of reads greater than 17 nucleotides.
Supplementary Table S4. Summary of miRs identified by NGS for all samples analysed.
Supplementary Table S5. Top 10 AGO and H3K9me2-bound miRs in senescent cells. Next-generation sequencing was performed on small RNAs purified by AGO2- and H3K9me2 immunoprecipitation (RIP) from RASV12-induced senescent cells. Shown are cpm obtained for the respective top 10 miRs.
Supplementary Table S6. List of oligonucleotides used in this study.
© 2012 Macmillan Publishers Limited. All rights reserved.