SUPPLEMENTARY FIGURES Figure S1. Manhattan plot for SNP ...
30
SUPPLEMENTARY FIGURES Figure S1. Manhattan plot for SNP effects for delta, theta, alpha, and beta EEG power at the vertex (Cz), occipital alpha power, and occipital alpha peak frequency. Dashed line is the standard threshold for genome-wide significance (5·10 -8 ). Two genome-wide SNP effect were observed for Cz alpha power. On chr 4 rs984924 (p=4.9·10 -8 ) is a SNP intronic to the protein kinase cGMP-dependent type II (PRKG2) gene. On chr 7 rs10231372 (P=2.9·10 -8 ) is an intron variant in the long non-coding RNA gene LINC00996. Figure S2. Regional association/LD plots. Chromosome 3 showed a range of low p-values and significant genes for Cz (and occipital) alpha power from about 52.2 to 52.8 Mbp (hg19/b37). (top) Cz alpha regional association plot with color-coded LD shows that the cluster of large p-values may be partially due to LD in an area spanning from ALAS1 to NEK4. SNP rs7614727 showed top association. Evidence for multiple causal variants may be found in the relatively high –log10(p) values for SNPs with moderate (green) and low (blue) LD with the top SNP in the 52.5 to 52.8 Mb region. (bottom) the same region was implicated for bipolar disorder and schizophrenia (48, 49). The regional association plot for schizophrenia showed LD and p-value patterns similar to Cz alpha power, and also evidence for multiple independent genetic effects (e.g., low p-values in the 52.5 to 52.8 region in low/moderate LD with rs7614727, and low p-values above the 52.8 Mb position with very low LD). Figure S3. Cz alpha Q-Q plots revealed strong inflation for most GTEx brain tissue eQTLs. FDR-corrected significant SNP effects are circled. eQTLs reached FDR significant discovery for frontal and anterior cingulate cortex, and hypothalamus. The genes associated with these eQTLs were ITIH4, GLN3, and MTERF4 for the frontal cortex, and MTERF4 for the hypothalamus and anterior cingulate. Red dashed line is FDR q=0.05. Figure S4. Occipital alpha quantile-quantile plots for GTEx brain tissue eQTLs (as in figure S3). FDR discoveries were eQTLs for immune genes IL18R1 (Hippocampus, Caudate), IL1RL1 (Hippocampus, Caudate, Nucleus Accumbens), as well as CLHC1 (Caudate, Nucleaus Accumbens), ITIH4 (Hippocampus, Caudate) and GLYCTK (Hippocampus). Red dashed line is FDR q=0.05. Figure S5. LD score regression based SNP heritability was significant for EEG power phenotypes, not for occipital peak frequency. A relatively low proportion of total twin/family
Transcript of SUPPLEMENTARY FIGURES Figure S1. Manhattan plot for SNP ...

SUPPLEMENTARY FIGURES
Figure S1. Manhattan plot for SNP effects for delta, theta, alpha, and beta EEG power at the
vertex (Cz), occipital alpha power, and occipital alpha peak frequency. Dashed line is the
standard threshold for genome-wide significance (5·10-8). Two genome-wide SNP effect
were observed for Cz alpha power. On chr 4 rs984924 (p=4.9·10-8) is a SNP intronic to the
protein kinase cGMP-dependent type II (PRKG2) gene. On chr 7 rs10231372 (P=2.9·10-8) is
an intron variant in the long non-coding RNA gene LINC00996.
Figure S2. Regional association/LD plots. Chromosome 3 showed a range of low p-values
and significant genes for Cz (and occipital) alpha power from about 52.2 to 52.8 Mbp
(hg19/b37). (top) Cz alpha regional association plot with color-coded LD shows that the
cluster of large p-values may be partially due to LD in an area spanning from ALAS1 to
NEK4. SNP rs7614727 showed top association. Evidence for multiple causal variants may
be found in the relatively high –log10(p) values for SNPs with moderate (green) and low
(blue) LD with the top SNP in the 52.5 to 52.8 Mb region. (bottom) the same region was
implicated for bipolar disorder and schizophrenia (48, 49). The regional association plot for
schizophrenia showed LD and p-value patterns similar to Cz alpha power, and also evidence
for multiple independent genetic effects (e.g., low p-values in the 52.5 to 52.8 region in
low/moderate LD with rs7614727, and low p-values above the 52.8 Mb position with very low
LD).
Figure S3. Cz alpha Q-Q plots revealed strong inflation for most GTEx brain tissue eQTLs.
FDR-corrected significant SNP effects are circled. eQTLs reached FDR significant discovery
for frontal and anterior cingulate cortex, and hypothalamus. The genes associated with these
eQTLs were ITIH4, GLN3, and MTERF4 for the frontal cortex, and MTERF4 for the
hypothalamus and anterior cingulate. Red dashed line is FDR q=0.05.
Figure S4. Occipital alpha quantile-quantile plots for GTEx brain tissue eQTLs (as in figure
S3). FDR discoveries were eQTLs for immune genes IL18R1 (Hippocampus, Caudate),
IL1RL1 (Hippocampus, Caudate, Nucleus Accumbens), as well as CLHC1 (Caudate,
Nucleaus Accumbens), ITIH4 (Hippocampus, Caudate) and GLYCTK (Hippocampus). Red
dashed line is FDR q=0.05.
Figure S5. LD score regression based SNP heritability was significant for EEG power
phenotypes, not for occipital peak frequency. A relatively low proportion of total twin/family

based heritability estimates are captured by common genetic variants. Error bars represent
95% CI around the null hypothesis.
Figure S6. Biviariate LD score regression estimates of the genetic correlation rG heatmaps
(left) and associated p-values (right; white is not significant) for the EEG phenotypes.
Strong genetic overlap existed between low frequency power (theta and delta), and between
occipital alpha, vertex alpha, and beta power. All power phenotypes showed highly
significant rG except between theta and beta power. Peak frequency showed significant
negative genetic correlations with delta and theta power.
Figure S7. Genetic correlations comparing results with other GWAS results by means of LD
hub. No significant results were obtained after multiple-tests correction. Nominal significance
was obtained for reduced theta power and autism/chronotype, Cz alpha power and ever
smoked/heart rate/chronotype, occipital alpha power and neuroticism, beta power and
generalized epilepsy/college completed/pallidum volume/chronotype, occipital frequency and
femoral neck BMD/ever smoked. The nominally significant rG between beta power and
epilepsy is consistent with GABA influencing both (41, 42, 66, 94). The nominally significant
rG between beta power and globus pallidus volume is consistent with both phenotypes being
associated with the regulation of (voluntary) movement, the involvement of dopamine
pathways, and the links of both to symptoms in Parkinson’s disease (8, 58–60, 121–123).
BMD=Bone Mineral Density.

Figure S1
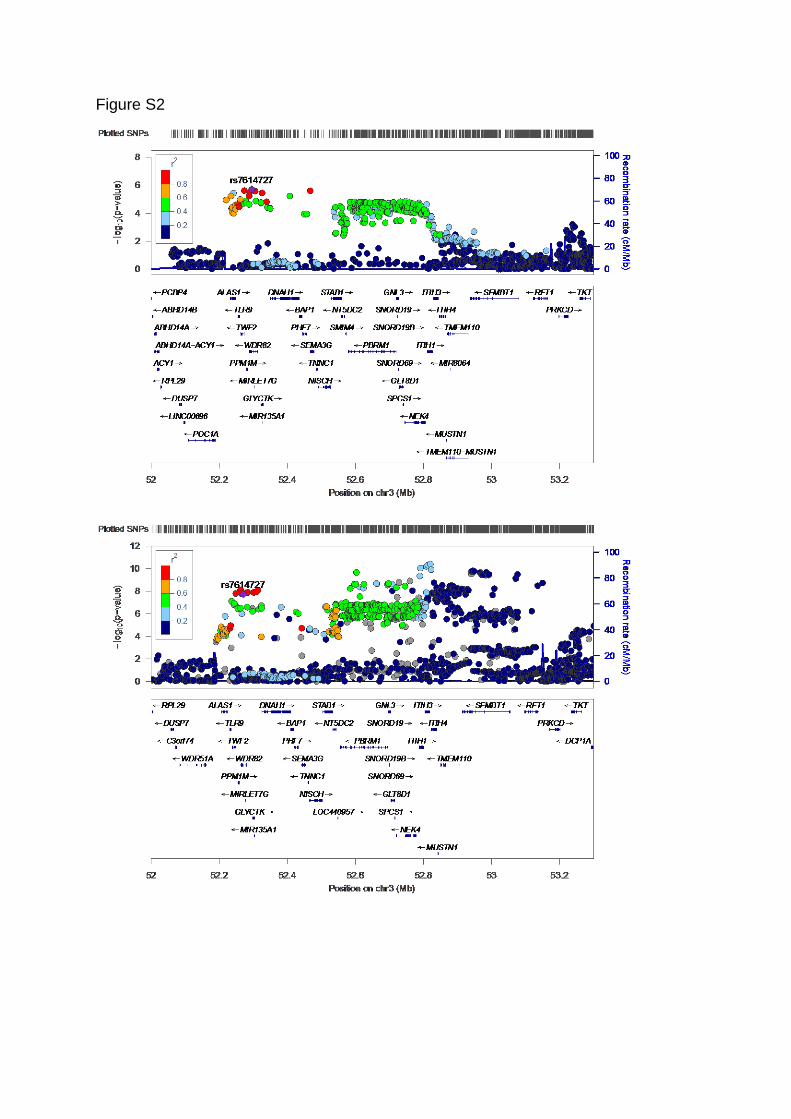
Figure S2

Figure S3: Cz alpha eQTL Q-Q plot

Figure S4: Occipital alpha eQTL Q-Q plot

Figure S5: LD score regression SNP heritability

Figure S6: Genetic correlations between EEG parameters

Figure S7: Genetic correlations with published GWAS results
ENIGMA-EEG Genome-wide association
Supplementary Methods
PART I: Sample description and EEG phenotyping I.a NTR Subjects The EEG data were collected as part of multiple longitudinal studies into the genetics and development of brain function in twin family cohorts (1–3). The studies were approved by the medical ethical review board. Informed consent was obtained from all subjects (in the case of adults), or their parents/guardians. All experiments were conducted in accordance with the Declaration of Helsinki.
A total number of 839 subjects (495 and 398 females and males respectively) had resting EEG and genomics data available out of 1675 twins and siblings who accepted an invitation for extensive EEG measurement and behavioral testing. Subjects were invited in mixed cross-sectional/longitudinal waves (mean ages ~5, ~7, ~16, ~18, ~25, and ~50 years; age range 5.2 to 71.0 years). For the childhood and adolescent age groups only twins participated, while for the adults, their singleton siblings were additionally invited. Between 5–7 and between 16–18 years consisted of longitudinal measurements.
EEG acquisition and preprocessing Due to the long time-span of the project, three different EEG systems were used. The childhood (5 and 7) and adolescent (16 and 18) EEG were recorded with tin electrodes in an ElectroCap connected to a Nihon Koden PV-441A polygraph with time constant 5 s and lowpass of 35 Hz, digitized at 250 Hz using an in-house built 12-bit A/D converter board. Leads were Fp1, Fp2, F7, F3, F4, F8, C3, C4, T5, P3, P4, T6, O1, O2, and bipolar horizontal and vertical EOG derivations. Electrode impedances were kept below 5 kOhm. Following the recommendation by Pivik et al. (4), tin earlobe electrodes (A1, A2) were fed to separate high-impedance pre-amplifiers, after which the electrically linked output signals served as reference to the EEG signals. Sine waves of 100 uV were used for calibration of the amplification/AD conversion before measurement of each subject.
Young adult and middle-aged cohort EEG was recorded with Ag/AgCl electrodes mounted in an ElectroCap. Signal registration was conducted using an AD amplifier developed by Twente Medical Systems (TMS; Enschede, The Netherlands) for 657 subjects and NeuroScan SynAmps 5083 amplifier for 103 subjects. Standard 10-20 positions were F7, F3, F1, Fz, F2, F4, F8, T7, C3, Cz, C4, T8, T5, P3, Pz, P4, T6, O1 and O2. For subjects measured with NeuroScan also Fp1, Fp2, and Oz were recorded. The vertical electro-oculogram (EOG) was recorded bipolarly between two Ag/AgCl electrodes, affixed one cm below the right eye and one cm above the eyebrow of the right eye. The horizontal EOG was recorded bipolarly between two Ag/AgCl electrodes affixed one cm left from the left eye and one cm right from the right eye. An Ag/AgCl electrode placed on the forehead was used as a ground electrode. Impedances of all EEG electrodes were kept below 5 kOhm, and impedances of the EOG electrodes were kept below 10 kOhm.
EEG data consisted of 3–4 minutes of eyes-closed rest recordings. All EEG was sampled at 250 Hz. All EEG was individually inspected. Bad channels or channels with excessive artifacts were removed. Episodes with artifacts and suspected drowsiness (and even sleep) were removed. EEG signals were broadband filtered 1–37 Hz followed by an

ENIGMA-EEG Genome-wide association
extended ICA decomposition using the EEGLAB toolbox in MATLAB (5–7). Components reflecting blinks and eye movement were identified based on visual inspection of the IC trace, high loading onto frontal electrodes, and high correlation with EOG signal, and removed.
Analysis proceeded with power analysis for channels Cz, O1, and O2; and peak frequency analysis for O1 and O2. Conform (8) O1 and O2 were rereferenced against T5 and T6 respectively. The average of C3 and C4 replaced Cz power in the childhood/adolescent subjects, correlating .95 with Cz power in the other subject groups. After cleaning, 1349 EEG recordings were available in 835 subjects (Cz, 463 female) and 834 subjects (O1/O2, 463 female). A minimum of 120 seconds artifact free was required for power estimations. Of the 1625 subject, 30 subjects (all adults) recordings were not completed. EEG cleaning of the remaining 1595 removed a further 95 subjects’ data (6.0%).
Figure. Age histogram for the NTR sample (N=1349 recordings including longitudinal
data).
I.b COGA Subjects COGA recruited DSM-III-R and DSM-IV AD probands from inpatient and outpatient treatment facilities through six participating sites: State University of New York Downstate Medical Center, University of Connecticut Health Science Center, Indiana University School of Medicine, University of Iowa School of Medicine, University of California School of Medicine, and Washington University School of Medicine. Recruitment and assessment procedures, including a clinical interview, neurophysiological assessments and DNA collection have been described previously (Begleiter et al., 1995; Foroud et al., 2000). All participants (proband, family members, and community controls) were administered the Semi-Structured Assessment for the Genetics of Alcoholism (SSAGA), a poly-diagnostic interview (Bucholz et al. 1994; Hesselbrock et al. 1999). Individuals below the age of 18 were administered an adolescent version of the SSAGA. The laboratory and data-collection procedures were identical at each of the sites (Begleiter et al., 1998). Institutional review boards at all sites approved the study.
ENIGMA-EEG Genome-wide association
The analytic sample for the current study consisted of families of European Ancestry (EA fGWAS) with both resting state EEG and GWAS data available: 1,492 individuals (783 females and 709 males; average age: 31.12) from 117 multi-generational families affected with AD. Family sizes ranged from 4 to 39 individuals with an average of 13.4 individuals (with EEG data) per family. In addition, an unrelated case-control sample of alcohol dependent cases and controls (ccGWAS) were also collected, and have been described previously (Edenberg et al., 2010). Both resting state EEG and GWAS data were available on 1,128 unrelated individuals. Subjects included in the ccGWAS who were also part of the EA fGWAS were excluded from the ccGWAS sample, leaving an independent EA ccGWAS sample of 660 unrelated individuals (319 females and 341 males; average age: 42.24) for analysis. Identical phenotypic definitions, covariates, SNP QC standards, MAF thresholds and imputation protocols were used to process the samples. EEG acquisition and preprocessing Prior to neurophysiological assessments, participants were required to have abstained from alcohol for a minimum of 3 weeks. Individual were excluded from neurophysiological assessment if they had any of the following: (1) recent substance or alcohol use (i.e., positive breath-analyzer test); (2) hepatic encephalopathy/cirrhosis of the liver; (3) significant history of head injury, seizures or neurosurgery; (4) uncorrected sensory deficits; (5) taking medication known to influence brain functioning; and (6) other acute/chronic medical illnesses that affect brain function. Participants were seated comfortably in a dimly lit sound-attenuated temperature-regulated booth (Industrial Acoustics, Bronx, NY). They were instructed to keep their eyes closed and remain relaxed, but to not fall asleep. EEG data were collected in the awake, eyes-closed condition for 4.25 minutes. Each participant wore a fitted electrode cap (Electro-Cap International, Eaton, OH) using either the 19-channel montage as specified according to the 10-20 international system (Supplementary Figure 1) or montages with a greater number of electrodes (32 or 64). The nose was used as a reference, and a forehead electrode served as the ground electrode. Electrode impedances were maintained below 5 kΩ. Electrical activity was amplified 10,000 times by Sensorium (Charlotte, VT) EPA-2 electrophysiology amplifiers with either a bandpass between 0.02 and 50 Hz and digitized on a Concurrent (Atlanta, GA) 5550 computer at a sampling rate of 256 Hz or a band pass between 0.02 Hz and 100.0 Hz on a Neuroscan system (Version 4.1 to 4.5) (Neurosoft, Inc., El Paso, TX) at sampling rates of 500 Hz or 512 Hz. All six collection sites used identical experimental procedures and EEG acquisition hardware and software programs. A continuous interval comprising 256 seconds of eyes-closed resting EEG data was analyzed from the CZ, O1, and O2 electrodes. Data was detrended and filtered using a bandpass FIRLS filter spanning .2 Hz to 40 Hz. One second intervals were checked for artifact and absence of signal before being analyzed according to the ENIGMA-EEG protocol which called for power in the delta, theta, alpha, and beta bands and peak frequency in the alpha band obtained from overlapping two second intervals by Fourier transform methods. A minimum of 128 seconds of artifact-free data was required for the inclusion of the subject in the study.

ENIGMA-EEG Genome-wide association
About 5% of the candidate subjects were excluded as a result of excessive artifact or problems in the recording of the data.
Figure. Age histogram for the COGA (a) European Ancestry family sample N=1,492,
and (b) the Case-Control (CC, unrelated) sample N=1,128. (a)
(b)
I.c MTFS Subjects EEG data were collected in two independent age cohorts of twins and their parents being studied in large, ongoing longitudinal studies of the Minnesota Twin Family Study (MTFS) (9, 10). EEG recordings for twins was from their age-17 assessment, representing the intake assessment of one cohort and the second follow-up of the other cohort. EEG data were also collected from the parents, who visited when the twins were minors. Informed consent was obtained from parents regarding their children’s participation as well as their own. Assent was obtained from minor children, consent from those at least 18 years old. The sample consisted of 4,026 subjects with usable EEG data, 2,056 males and 1,970 females. There were 2,383 adolescents (1,230 females; mean age, 17.7; sd, 0.5) and 1,643 parents (740 females; mean age, 45.1; sd, 5.7). The sample for molecular genetic studies consisted of
ENIGMA-EEG Genome-wide association
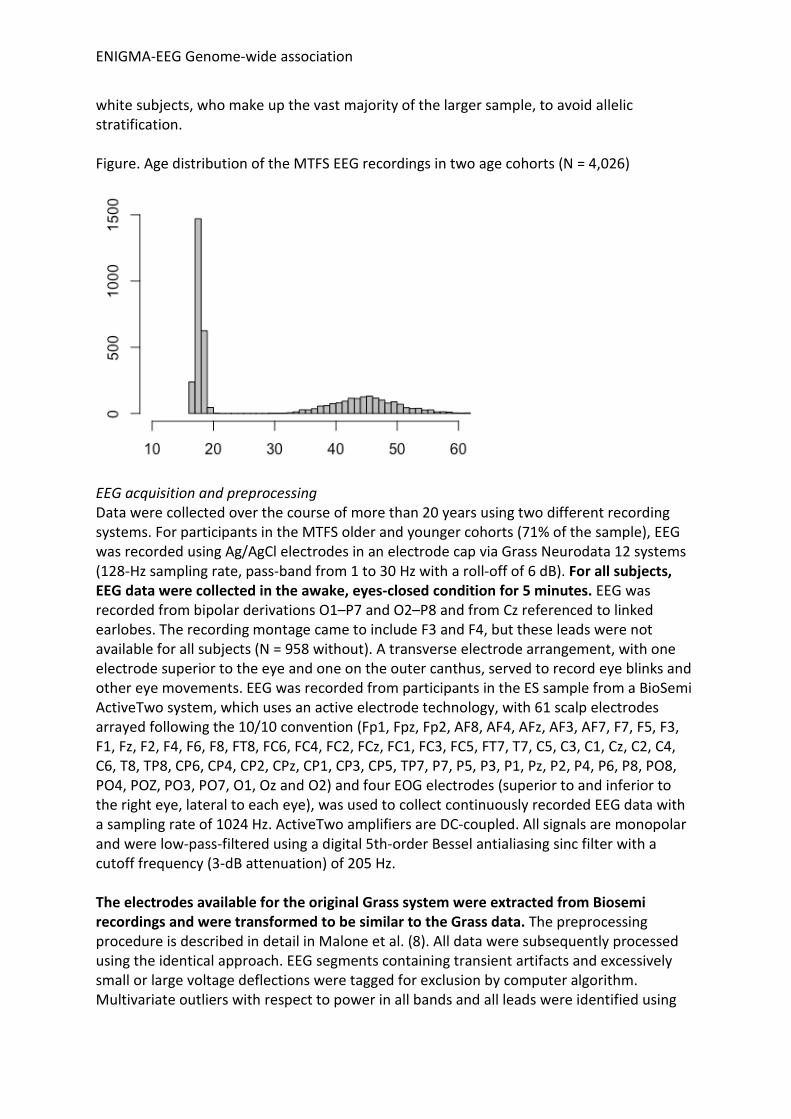
white subjects, who make up the vast majority of the larger sample, to avoid allelic stratification. Figure. Age distribution of the MTFS EEG recordings in two age cohorts (N = 4,026)
EEG acquisition and preprocessing Data were collected over the course of more than 20 years using two different recording systems. For participants in the MTFS older and younger cohorts (71% of the sample), EEG was recorded using Ag/AgCl electrodes in an electrode cap via Grass Neurodata 12 systems (128-Hz sampling rate, pass-band from 1 to 30 Hz with a roll-off of 6 dB). For all subjects, EEG data were collected in the awake, eyes-closed condition for 5 minutes. EEG was recorded from bipolar derivations O1–P7 and O2–P8 and from Cz referenced to linked earlobes. The recording montage came to include F3 and F4, but these leads were not available for all subjects (N = 958 without). A transverse electrode arrangement, with one electrode superior to the eye and one on the outer canthus, served to record eye blinks and other eye movements. EEG was recorded from participants in the ES sample from a BioSemi ActiveTwo system, which uses an active electrode technology, with 61 scalp electrodes arrayed following the 10/10 convention (Fp1, Fpz, Fp2, AF8, AF4, AFz, AF3, AF7, F7, F5, F3, F1, Fz, F2, F4, F6, F8, FT8, FC6, FC4, FC2, FCz, FC1, FC3, FC5, FT7, T7, C5, C3, C1, Cz, C2, C4, C6, T8, TP8, CP6, CP4, CP2, CPz, CP1, CP3, CP5, TP7, P7, P5, P3, P1, Pz, P2, P4, P6, P8, PO8, PO4, POZ, PO3, PO7, O1, Oz and O2) and four EOG electrodes (superior to and inferior to the right eye, lateral to each eye), was used to collect continuously recorded EEG data with a sampling rate of 1024 Hz. ActiveTwo amplifiers are DC-coupled. All signals are monopolar and were low-pass-filtered using a digital 5th-order Bessel antialiasing sinc filter with a cutoff frequency (3-dB attenuation) of 205 Hz. The electrodes available for the original Grass system were extracted from Biosemi recordings and were transformed to be similar to the Grass data. The preprocessing procedure is described in detail in Malone et al. (8). All data were subsequently processed using the identical approach. EEG segments containing transient artifacts and excessively small or large voltage deflections were tagged for exclusion by computer algorithm. Multivariate outliers with respect to power in all bands and all leads were identified using
ENIGMA-EEG Genome-wide association
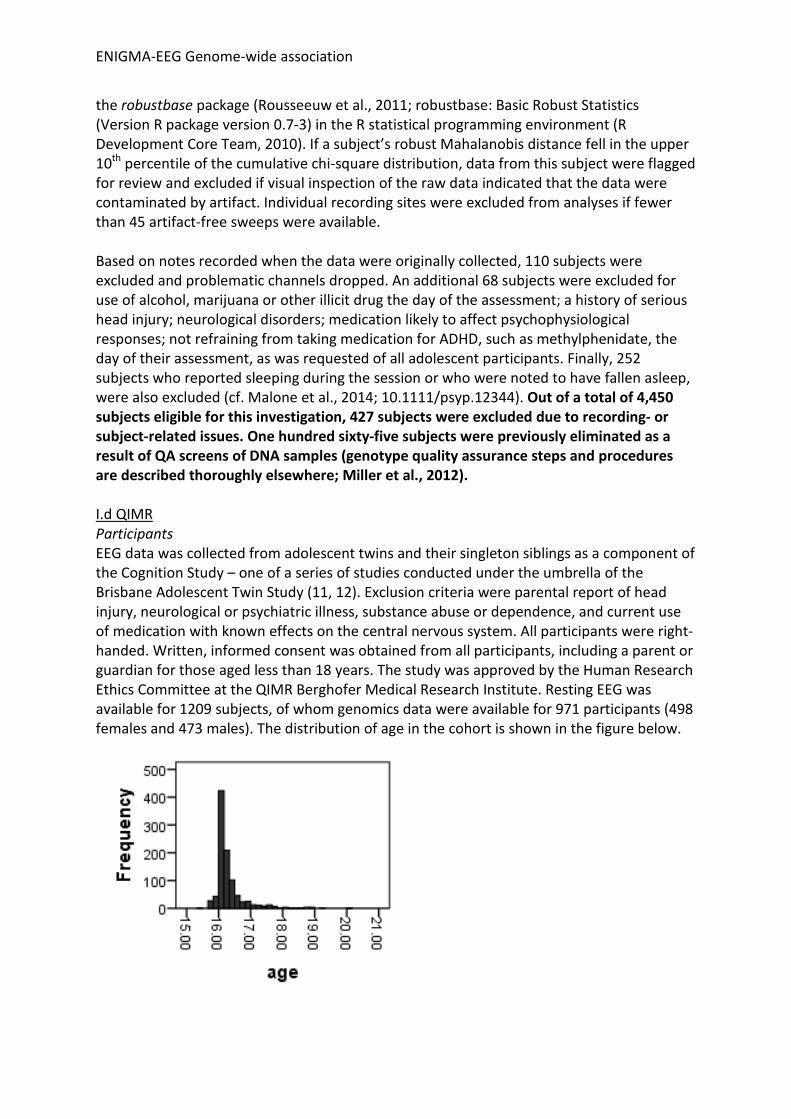
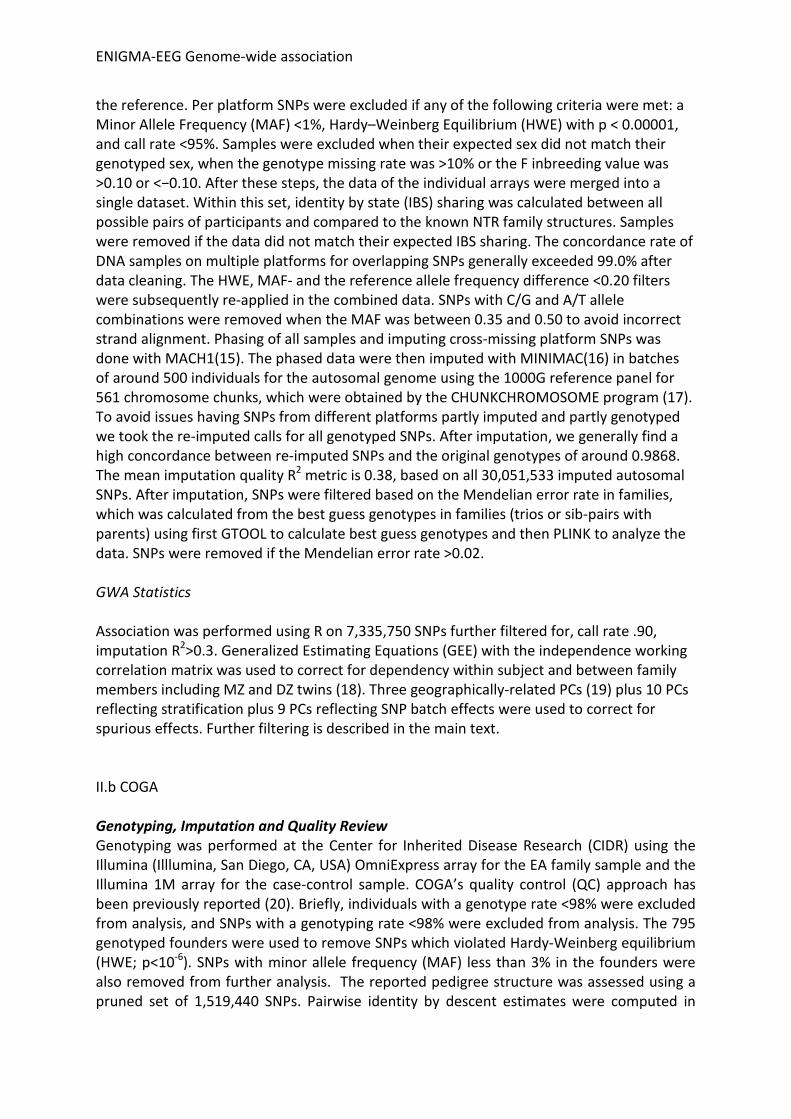
the robustbase package (Rousseeuw et al., 2011; robustbase: Basic Robust Statistics (Version R package version 0.7-3) in the R statistical programming environment (R Development Core Team, 2010). If a subject’s robust Mahalanobis distance fell in the upper 10th percentile of the cumulative chi-square distribution, data from this subject were flagged for review and excluded if visual inspection of the raw data indicated that the data were contaminated by artifact. Individual recording sites were excluded from analyses if fewer than 45 artifact-free sweeps were available. Based on notes recorded when the data were originally collected, 110 subjects were excluded and problematic channels dropped. An additional 68 subjects were excluded for use of alcohol, marijuana or other illicit drug the day of the assessment; a history of serious head injury; neurological disorders; medication likely to affect psychophysiological responses; not refraining from taking medication for ADHD, such as methylphenidate, the day of their assessment, as was requested of all adolescent participants. Finally, 252 subjects who reported sleeping during the session or who were noted to have fallen asleep, were also excluded (cf. Malone et al., 2014; 10.1111/psyp.12344). Out of a total of 4,450 subjects eligible for this investigation, 427 subjects were excluded due to recording- or subject-related issues. One hundred sixty-five subjects were previously eliminated as a result of QA screens of DNA samples (genotype quality assurance steps and procedures are described thoroughly elsewhere; Miller et al., 2012). I.d QIMR Participants EEG data was collected from adolescent twins and their singleton siblings as a component of the Cognition Study – one of a series of studies conducted under the umbrella of the Brisbane Adolescent Twin Study (11, 12). Exclusion criteria were parental report of head injury, neurological or psychiatric illness, substance abuse or dependence, and current use of medication with known effects on the central nervous system. All participants were right-handed. Written, informed consent was obtained from all participants, including a parent or guardian for those aged less than 18 years. The study was approved by the Human Research Ethics Committee at the QIMR Berghofer Medical Research Institute. Resting EEG was available for 1209 subjects, of whom genomics data were available for 971 participants (498 females and 473 males). The distribution of age in the cohort is shown in the figure below.

ENIGMA-EEG Genome-wide association
EEG acquisition and preprocessing Resting EEG comprised two 4 minute recordings (eyes closed, following by eyes open) in a semi-darkened, electrically shielded, and sound-attenuated cubicle. EEG was recorded from 15 scalp locations (Fp1, Fp2, Fz, F3, F4, F7, F8, Cz, C3, C4, Pz, P3, P4, O1, O2) using an electrode cap with tin electrodes arranged according to the International electrode (10-20) placement system, and referenced to physically linked ears, with the ear impedances matched at the beginning of the recording session. The ground lead was located just anterior to the Fz electrode. Ocular potentials (electro-oculogram or EOG) were recorded from single tine electrodes and were located on the outer canthus and the centre of the supraorbital ridge above the left eye. Impedance readings were all below 5 kΩ. EOG, Fp1 and Fp2 were amplified with a factor 5K and all other channels with a factor 20K by Grass preamplifiers (model P511K), and recordings were filtered with a band pass filter of 0.01 to 30 Hz (6dB per octave) and a 50 Hz notch filter.
Software controlling the recording determined that the maximum length of continuously recorded EEG was 12s with a discontinuity of 2s between successive 12s blocks. Twenty 12s blocks were recorded for both eyes closed and eyes open conditions. All EEG was resampled at 250 Hz, and individually visually inspected. Bad channels or channels with excessive artifacts were removed. Episodes with artifacts and suspected drowsiness (and even sleep) were removed. EEG signals were broadband filtered 1–37 Hz followed by an extended ICA decomposition using the EEGLAB toolbox in MATLAB (5–7). Components reflecting blinks and eye movement were identified based on visual inspection of the IC trace, high loading onto frontal electrodes, and high correlation with EOG signal, and removed.
Analysis proceeded with power analysis for channels Cz, O1, and O2; and peak frequency analysis for O1 and O2. Conform (8) O1 and O2 were rereferenced against T5 and T6 respectively. A minimum of 120 s was required for power calculations. After cleaning 1117 out of 1209 subjects remained (7.6% drop out).
PART II: Genome-wide SNP arrays and imputation II.a NTR Genotyping DNA was isolated with the GENTRA Puregene kit (13). Genotyping was done on multiple arrays with a number of overlapping samples following manufacturer protocols. The following arrays were used: Affymetrix Perlegen 5.0 (N=1,718), Illumina 370 (N=424), Illumina 660 (N=1,103), Illumina Omni Express 1 M (N=346) and Affymetrix 6.0 (N=3602). Genotype calls were made with the platform specific software Birdsuite, APT-Genotyper and Beadstudio. Sample and SNP QC was done first within, and then between platforms using the PLINK software (14). With the LiftOver tool (“http://genome.sph.umich.edu/wiki/LiftOver”) the individual SNP markers were lifted over to build 37 (HG19) of the Human reference genome for each platform. All data were then strand aligned with the 1000 Genomes GIANT phase1 release v3 20,101,123 SNPs INDELS SVS ALL reference panel. SNPs were removed if they had ambiguous locations, mismatching alleles with the reference set or the allele frequencies differed more than 0.20 compared to
ENIGMA-EEG Genome-wide association
the reference. Per platform SNPs were excluded if any of the following criteria were met: a Minor Allele Frequency (MAF) <1%, Hardy–Weinberg Equilibrium (HWE) with p < 0.00001, and call rate <95%. Samples were excluded when their expected sex did not match their genotyped sex, when the genotype missing rate was >10% or the F inbreeding value was >0.10 or <−0.10. After these steps, the data of the individual arrays were merged into a single dataset. Within this set, identity by state (IBS) sharing was calculated between all possible pairs of participants and compared to the known NTR family structures. Samples were removed if the data did not match their expected IBS sharing. The concordance rate of DNA samples on multiple platforms for overlapping SNPs generally exceeded 99.0% after data cleaning. The HWE, MAF- and the reference allele frequency difference <0.20 filters were subsequently re-applied in the combined data. SNPs with C/G and A/T allele combinations were removed when the MAF was between 0.35 and 0.50 to avoid incorrect strand alignment. Phasing of all samples and imputing cross-missing platform SNPs was done with MACH1(15). The phased data were then imputed with MINIMAC(16) in batches of around 500 individuals for the autosomal genome using the 1000G reference panel for 561 chromosome chunks, which were obtained by the CHUNKCHROMOSOME program (17). To avoid issues having SNPs from different platforms partly imputed and partly genotyped we took the re-imputed calls for all genotyped SNPs. After imputation, we generally find a high concordance between re-imputed SNPs and the original genotypes of around 0.9868. The mean imputation quality R2 metric is 0.38, based on all 30,051,533 imputed autosomal SNPs. After imputation, SNPs were filtered based on the Mendelian error rate in families, which was calculated from the best guess genotypes in families (trios or sib-pairs with parents) using first GTOOL to calculate best guess genotypes and then PLINK to analyze the data. SNPs were removed if the Mendelian error rate >0.02. GWA Statistics Association was performed using R on 7,335,750 SNPs further filtered for, call rate .90, imputation R2>0.3. Generalized Estimating Equations (GEE) with the independence working correlation matrix was used to correct for dependency within subject and between family members including MZ and DZ twins (18). Three geographically-related PCs (19) plus 10 PCs reflecting stratification plus 9 PCs reflecting SNP batch effects were used to correct for spurious effects. Further filtering is described in the main text. II.b COGA Genotyping, Imputation and Quality Review Genotyping was performed at the Center for Inherited Disease Research (CIDR) using the Illumina (Illlumina, San Diego, CA, USA) OmniExpress array for the EA family sample and the Illumina 1M array for the case-control sample. COGA’s quality control (QC) approach has been previously reported (20). Briefly, individuals with a genotype rate <98% were excluded from analysis, and SNPs with a genotyping rate <98% were excluded from analysis. The 795 genotyped founders were used to remove SNPs which violated Hardy-Weinberg equilibrium (HWE; p<10-6). SNPs with minor allele frequency (MAF) less than 3% in the founders were also removed from further analysis. The reported pedigree structure was assessed using a pruned set of 1,519,440 SNPs. Pairwise identity by descent estimates were computed in

ENIGMA-EEG Genome-wide association
PLINK (14) to detect pairs of individuals whose allele sharing was not consistent with the reported family relationship. Family structures were altered as needed, and then SNP genotypes were tested for Mendelian inconsistencies (Pedcheck) (21) with the revised family structure. The cleaned genotype data were imputed to 1000 genomes (EUR and AFR, Phase 3, b37, October 2014) with build hg19 using SHAPEIT (https://mathgen.stats.ox.ac.uk/genetics_software/shapeit/shapeit.html) and IMPUTE2 (https://mathgen.stats.ox.ac.uk/impute/impute_v2.html). To avoid ambiguities in strand designation, SNPs with A/T or C/G alleles were removed. After imputation, genotype probabilities ≥ 0.90 were changed to genotypes. Mendelian errors in the imputed SNPs were reviewed and resolved as described in Wetherill et al., 2015 (20). All SNPs with imputation genotyping rate < 98% and MAF < 0.03 were excluded from association analyses. Further filtering is reported in the main text. GWA Statistics Association was performed on 12,972,748 SNPs SNPs pre-filtered for HWE 1E-6, call rate .90, imputation R2>0.3. Generalized Estimating Equations (GEE) with the independence working correlation matrix was used to correct for dependency within subject and between family members (18). Sex, log-transformed age at the time of EEG recording, and 10 PCs reflecting stratification were used as covariates. Given COGA’s study design and the previous associations observed among EEG and alcohol dependence, analyses also included DSM-IV alcohol dependence as a covariate. II.c MTFS Genotyping Genotyping was conducted using the Illumina 660W Quad array. The pipeline for extracting and processing DNA and for quality control has been described in detail (22). Problematic markers identified by Illumina were dropped. In addition, the following filters were used: call rate less than 99%; mismatches in duplicate samples; minor allele frequency (MAF) than 1%; a significant deviation from Hardy-Weinberg genotype frequencies or Mendelian inconsistencies across families; a significant association with participant gender or processing batch; excessive heterozygous calls for markers on the X chromosome in males or in mitochondrial DNA in the sample. The 527,829 markers surviving quality control filters were imputed using minimac (16) after genotypes had been phased in Beagle (23), which uses known familial structure to improve phasing accuracy, and 9,331,500 SNPs imputed using 1000 Genomes reference haplotypes. The MAF exceeded .001 and the imputation r2 exceeded .30 for 9,160,194 SNPs. GWA Statistics Genome-wide association was conducted on these SNPs using rapid feasible generalized least squares (RFGLS) implemented in an R package developed for molecular genetic analysis of family data (24). RFGLS is a computationally efficient form of generalized least squares, which accommodates correlated data (25). The matrix of within-family correlations was estimated separately for MZ and DZ twin families. To minimize the number of parameters to be estimated, parent-offspring correlations were constrained across sex of

ENIGMA-EEG Genome-wide association
parent and were equal for both twins. Variances were constrained equal for both twins and were identical for MZ and DZ twins. Step-parents were considered independent observations. Chronological age, age cohort (adolescent or parent), sex, lab (Biosemi or Grass), and 10 PCs derived using EIGENSTRAT to control for residual ethnic stratification in the otherwise white sample served as covariates. Accounting for the distinct age groups (adolescents and their middle-aged parents) obviated the need to account for anything other than a linear effect of age. II.d QIMR Genotyping Participants were genotyped on the Illumina Human610-Quad SNP chips. These samples were genotyped in the context of a larger genome-wide association project that resulted in the genotyping of 15,945 individuals using the Illumina 317, 370, 610, 660 SNP chips which included data from twins, their siblings and their parents. Genotype data were screened for genotyping quality (GenCall < 0.7), SNP and individual call rates (< 0.95), HWE failure (P < 10-6) and MAF (< 0.01). As these samples were genotyped in the context of a larger project, the data were integrated with the larger QIMR genotype project and the data were checked for pedigree, sex and Mendelian errors and for non-European ancestry. Individuals were imputed to the 1000 Genomes Project phase 3 version 5 references using a set of SNPs common to the first generation genotyping platforms (N ~ 278,000). Imputation was performed using MACH. GWA Statistics GWAS analyses were conducted using merlin-offline which uses known pedigree and zygosity information to explicitly correct for relatedness (http://www.sph.umich.edu/csg/abecasis/Merlin/). Analyses included 10 Ancestry based principal components and corrections for Sex, Age and Age2.
PART III: Covariate effects
NTR

ENIGMA-EEG Genome-wide association

ENIGMA-EEG Genome-wide association
COGA
ENIGMA-EEG Genome-wide association
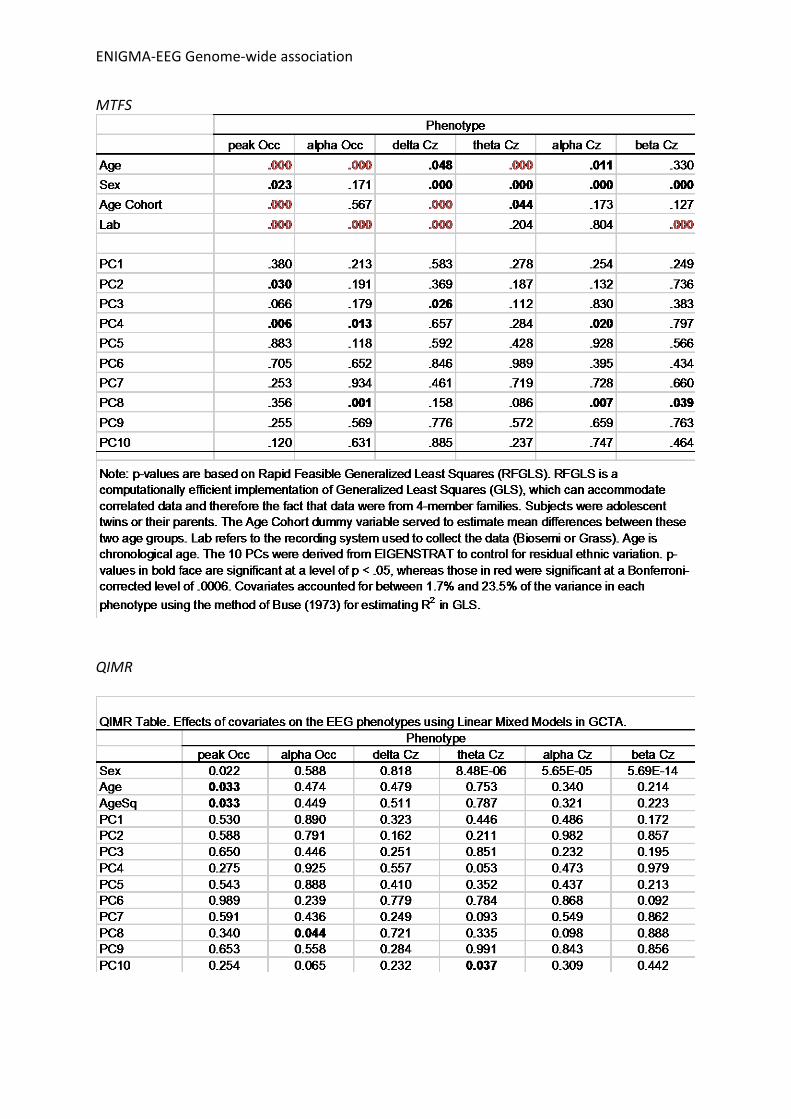
MTFS
QIMR
ENIGMA-EEG Genome-wide association
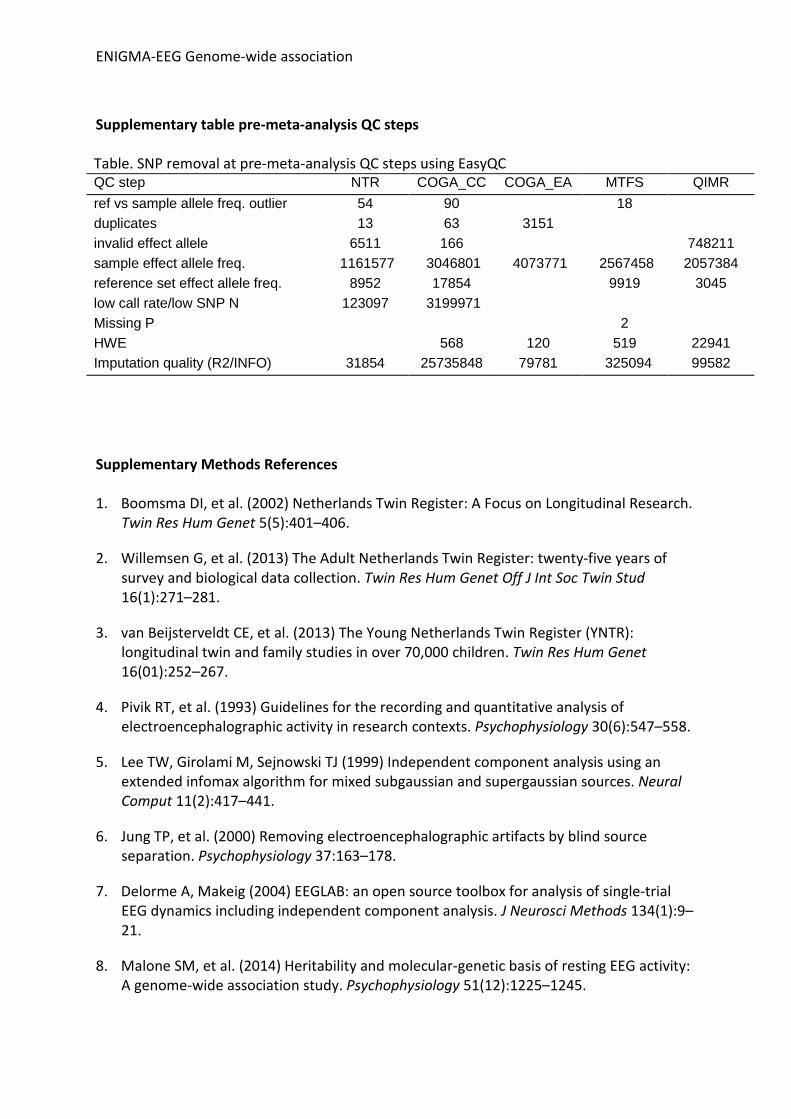
Supplementary table pre-meta-analysis QC steps Table. SNP removal at pre-meta-analysis QC steps using EasyQC QC step NTR COGA_CC COGA_EA MTFS QIMR ref vs sample allele freq. outlier 54 90 18 duplicates 13 63 3151 invalid effect allele 6511 166 748211 sample effect allele freq. 1161577 3046801 4073771 2567458 2057384 reference set effect allele freq. 8952 17854 9919 3045 low call rate/low SNP N 123097 3199971 Missing P 2 HWE 568 120 519 22941 Imputation quality (R2/INFO) 31854 25735848 79781 325094 99582
Supplementary Methods References 1. Boomsma DI, et al. (2002) Netherlands Twin Register: A Focus on Longitudinal Research.
Twin Res Hum Genet 5(5):401–406.
2. Willemsen G, et al. (2013) The Adult Netherlands Twin Register: twenty-five years of survey and biological data collection. Twin Res Hum Genet Off J Int Soc Twin Stud 16(1):271–281.
3. van Beijsterveldt CE, et al. (2013) The Young Netherlands Twin Register (YNTR): longitudinal twin and family studies in over 70,000 children. Twin Res Hum Genet 16(01):252–267.
4. Pivik RT, et al. (1993) Guidelines for the recording and quantitative analysis of electroencephalographic activity in research contexts. Psychophysiology 30(6):547–558.
5. Lee TW, Girolami M, Sejnowski TJ (1999) Independent component analysis using an extended infomax algorithm for mixed subgaussian and supergaussian sources. Neural Comput 11(2):417–441.
6. Jung TP, et al. (2000) Removing electroencephalographic artifacts by blind source separation. Psychophysiology 37:163–178.
7. Delorme A, Makeig (2004) EEGLAB: an open source toolbox for analysis of single-trial EEG dynamics including independent component analysis. J Neurosci Methods 134(1):9–21.
8. Malone SM, et al. (2014) Heritability and molecular-genetic basis of resting EEG activity: A genome-wide association study. Psychophysiology 51(12):1225–1245.

ENIGMA-EEG Genome-wide association
9. Iacono WG, Carlson SR, Taylor J, Elkins IJ, McGue M (1999) Behavioral disinhibition and the development of substance-use disorders: findings from the Minnesota Twin Family Study. Dev Psychopathol 11(4):869–900.
10. Keyes MA, et al. (2009) The Enrichment Study of the Minnesota Twin Family Study: Increasing the Yield of Twin Families at High Risk for Externalizing Psychopathology. Twin Res Hum Genet 12(5):489–501.
11. Wright M, et al. (2001) Genetics of cognition: outline of a collaborative twin study. Twin Res 4(1):48–56.
12. Wright MJ, Martin NG (2004) Brisbane Adolescent Twin Study: Outline of study methods and research projects. Aust J Psychol 56(2):65–78.
13. Boomsma DI, et al. (2008) Genome-wide association of major depression: description of samples for the GAIN Major Depressive Disorder Study: NTR and NESDA biobank projects. Eur J Hum Genet 16(3):335–342.
14. Purcell S, et al. (2007) PLINK: A Tool Set for Whole-Genome Association and Population-Based Linkage Analyses. Am J Hum Genet 81(3):559–575.
15. Li Y, Willer CJ, Ding J, Scheet P, Abecasis GR (2010) MaCH: Using Sequence and Genotype Data to Estimate Haplotypes and Unobserved Genotypes. Genet Epidemiol 34(8):816–834.
16. Howie BN, Donnelly P, Marchini J (2009) A Flexible and Accurate Genotype Imputation Method for the Next Generation of Genome-Wide Association Studies. PLOS Genet 5(6):e1000529.
17. Liu EY, Li M, Wang W, Li Y (2013) MaCH-Admix: Genotype Imputation for Admixed Populations. Genet Epidemiol 37(1):25–37.
18. Minică CC, Boomsma DI, Vink JM, Dolan CV (2014) MZ twin pairs or MZ singletons in population family-based GWAS? More power in pairs. Mol Psychiatry 19(11):1154–1155.
19. Abdellaoui A, et al. (2013) Population structure, migration, and diversifying selection in the Netherlands. Eur J Hum Genet 21(11):1277–1285.
20. Wetherill L, et al. (2015) Association of substance dependence phenotypes in the COGA sample. Addict Biol 20(3):617–27.
21. O’Connell JR, Weeks DE (1998) PedCheck: A Program for Identification of Genotype Incompatibilities in Linkage Analysis. Am J Hum Genet 63(1):259–266.
22. Miller MB, et al. (2012) The Minnesota Center for Twin and Family Research Genome-Wide Association Study. Twin Res Hum Genet 15(6):767–774.

ENIGMA-EEG Genome-wide association
23. Browning SR, Browning BL (2007) Rapid and Accurate Haplotype Phasing and Missing-Data Inference for Whole-Genome Association Studies By Use of Localized Haplotype Clustering. Am J Hum Genet 81(5):1084–1097.
24. Li X, Basu S, Miller MB, Iacono WG, McGue M (2011) A rapid generalized least squares model for a genome-wide quantitative trait association analysis in families. Hum Hered 71(1):67–82.
25. IACONO WG, MALONE SM, VAIDYANATHAN U, VRIEZE SI (2014) Genome-wide scans of genetic variants for psychophysiological endophenotypes: A methodological overview. Psychophysiology 51(12):1207–1224.
Supplementary acknowledgements and references for main text LD Hub acknowledges the following consortia: “We gratefully acknowledge all the studies and databases that made GWAS summary data available: ADIPOGen (Adiponectin genetics consortium), C4D (Coronary Artery Disease Genetics Consortium), CARDIoGRAM (Coronary ARtery DIsease Genome wide Replication and Meta-analysis), CKDGen (Chronic Kidney Disease Genetics consortium), dbGAP (database of Genotypes and Phenotypes), DIAGRAM (DIAbetes Genetics Replication And Meta-analysis), ENIGMA (Enhancing Neuro Imaging Genetics through Meta Analysis), EAGLE (EArly Genetics & Lifecourse Epidemiology Eczema Consortium, excluding 23andMe), EGG (Early Growth Genetics Consortium), GABRIEL (A Multidisciplinary Study to Identify the Genetic and Environmental Causes of Asthma in the European Community), GCAN (Genetic Consortium for Anorexia Nervosa), GEFOS (GEnetic Factors for OSteoporosis Consortium), GIANT (Genetic Investigation of ANthropometric Traits), GIS (Genetics of Iron Status consortium), GLGC (Global Lipids Genetics Consortium), GPC (Genetics of Personality Consortium), GUGC (Global Urate and Gout consortium), HaemGen (haemotological and platelet traits genetics consortium), HRgene (Heart Rate consortium), IIBDGC (International Inflammatory Bowel Disease Genetics Consortium), ILCCO (International Lung Cancer Consortium), IMSGC (International Multiple Sclerosis Genetic Consortium), MAGIC (Meta-Analyses of Glucose and Insulin-related traits Consortium), MESA (Multi-Ethnic Study of Atherosclerosis), PGC (Psychiatric Genomics Consortium), Project MinE consortium, ReproGen (Reproductive Genetics Consortium), SSGAC (Social Science Genetics Association Consortium) and TAG (Tobacco and Genetics Consortium), TRICL (Transdisciplinary Research in Cancer of the Lung consortium), UK Biobank. “We gratefully acknowledge the contributions of Alkes Price (the systemic lupus erythematosus GWAS and primary biliary cirrhosis GWAS) and Johannes Kettunen (lipids metabolites GWAS).” GWAS References for LD Hub obtained from https://academic.oup.com/bioinformatics/article/33/2/272/2525718

ENIGMA-EEG Genome-wide association
Anderson,C. et al. (2011) Meta-analysis identifies 29 additional ulcerative colitis risk loci, increasing the number of confirmed associations to 47. Nature Genetics, 43, 246-252. Bentham,J. et al. (2015) Genetic association analyses implicate aberrant regulation of innate and adaptive immunity genes in the pathogenesis of systemic lupus erythematosus. Nature Genetics, 47, 1457-1464. Benyamin,B. et al. (2013) Childhood intelligence is heritable, highly polygenic and associated with FNBP1L. Molecular Psychiatry, 19, 253-258. Berndt,S. et al. (2013) Genome-wide meta-analysis identifies 11 new loci for anthropometric traits and provides insights into genetic architecture. Nature Genetics, 45, 501-512. Boger,C. et al. (2011) CUBN Is a Gene Locus for Albuminuria. Journal of the American Society of Nephrology, 22, 555-570. Boraska,V. et al. (2014) A genome-wide association study of anorexia nervosa. Molecular Psychiatry, 19, 1085-1094. Bradfield,J. et al. (2012) A genome-wide association meta-analysis identifies new childhood obesity loci. Nature Genetics, 44, 526-531. Cordell HJ, et al. (2015). International genome-wide meta-analysis identifies new primary biliary cirrhosis risk loci and targetable pathogenic pathways. Nat Commun. 6:8019. Dastani Z et al. (2012). Novel loci for adiponectin levels and their influence on type 2 diabetes and metabolic traits: a multi-ethnic meta-analysis of 45,891 individuals. PLoS Genet. 8(3):e1002607. de Moor,M. et al. (2010) Meta-analysis of genome-wide association studies for personality. Molecular Psychiatry, 17, 337-349. Dubois,P. et al. (2010) Multiple common variants for celiac disease influencing immune gene expression. Nature Genetics, 42, 295-302. Dupuis,J. et al. (2010) New genetic loci implicated in fasting glucose homeostasis and their impact on type 2 diabetes risk. Nature Genetics, 42, 105-116. Estrada,K. et al. (2012) Genome-wide meta-analysis identifies 56 bone mineral density loci and reveals 14 loci associated with risk of fracture. Nature Genetics, 44, 491-501. Franke,A. et al. (2010) Genome-wide meta-analysis increases to 71 the number of confirmed Crohn's disease susceptibility loci. Nature Genetics, 42, 1118-1125. Furberg,H. et al. (2010) Genome-wide meta-analyses identify multiple loci associated with smoking behavior. Nature Genetics, 42, 441-447. Horikoshi,M. et al. (2012) New loci associated with birth weight identify genetic links between intrauterine growth and adult height and metabolism. Nature Genetics, 45, 76-82. Huffman,J. et al. (2015) Modulation of Genetic Associations with Serum Urate Levels by Body-Mass-Index in Humans. PLOS ONE, 10, e0119752. Identification of risk loci with shared effects on five major psychiatric disorders: a genome-wide analysis (2013) The Lancet, 381, 1371-1379. KÃttgen,A. et al. (2010) New loci associated with kidney function and chronic kidney disease. Nature Genetics, 42, 376-384. Lambert,J. et al. (2013) Meta-analysis of 74,046 individuals identifies 11 new susceptibility loci for Alzheimer's disease. Nature Genetics, 45, 1452-1458. Lango Allen,H. et al. (2010) Hundreds of variants clustered in genomic loci and biological pathways affect human height. Nature, 467, 832-838. Liu JZ, et al. (2015). Association analyses identify 38 susceptibility loci for inflammatory bowel disease and highlight shared genetic risk across populations. Nat Genet. 47(9):979-86.

ENIGMA-EEG Genome-wide association
Mahajan,A. et al. (2014) Genome-wide trans-ancestry meta-analysis provides insight into the genetic architecture of type 2 diabetes susceptibility. Nature Genetics, 46, 234-244. Manning,A. et al. (2012) A genome-wide approach accounting for body mass index identifies genetic variants influencing fasting glycemic traits and insulin resistance. Nature Genetics, 44, 659-669. Morris,A. et al. (2012) Large-scale association analysis provides insights into the genetic architecture and pathophysiology of type 2 diabetes. Nature Genetics, 44, 981-990. Moffatt MF, et al. (2007). Genetic variants regulating ORMDL3 expression contribute to the risk of childhood asthma. Nature. 448(7152):470-3. Neale,B. et al. (2010) Meta-Analysis of Genome-Wide Association Studies of Attention-Deficit/Hyperactivity Disorder. Journal of the American Academy of Child & Adolescent Psychiatry, 49, 884-897. Okada,Y. et al. (2013) Genetics of rheumatoid arthritis contributes to biology and drug discovery. Nature, 506, 376-381. Perry,J. et al. (2014) Parent-of-origin-specific allelic associations among 106 genomic loci for age at menarche. Nature, 514, 92-97. Prokopenko,I. et al. (2014) A Central Role for GRB10 in Regulation of Islet Function in Man. PLoS Genetics, 10, e1004235. Rietveld,C. et al. (2014) Common genetic variants associated with cognitive performance identified using the proxy-phenotype method. Proceedings of the National Academy of Sciences, 111, 13790-13794. Rietveld,C. et al. (2013) GWAS of 126,559 Individuals Identifies Genetic Variants Associated with Educational Attainment. Science, 340, 1467-1471. Ripke,S. et al. (2012) A mega-analysis of genome-wide association studies for major depressive disorder. Molecular Psychiatry, 18, 497-511. Ripke,S. et al. (2014) Biological insights from 108 schizophrenia-associated genetic loci. Nature, 511, 421-427. Sawcer,S. et al. (2011) Genetic risk and a primary role for cell-mediated immune mechanisms in multiple sclerosis. Nature, 476, 214-219. Saxena,R. et al. (2010) Genetic variation in GIPR influences the glucose and insulin responses to an oral glucose challenge. Nature Genetics, 42, 142-148. Schunkert,H. et al. (2011) Large-scale association analysis identifies 13 new susceptibility loci for coronary artery disease. Nature Genetics, 43, 333-338. Shin,S. et al. (2014) An atlas of genetic influences on human blood metabolites. Nature Genetics, 46, 543-550. Shungin,D. et al. (2015) New genetic loci link adipose and insulin biology to body fat distribution. Nature, 518, 187-196. Simón-Sánchez,J. et al. (2009) Genome-wide association study reveals genetic risk underlying Parkinson's disease. Nature Genetics, 41, 1308-1312. Sklar,P. et al. (2011) Large-scale genome-wide association analysis of bipolar disorder identifies a new susceptibility locus near ODZ4. Nature Genetics, 43, 977-983. Soranzo,N. et al. (2010) Common Variants at 10 Genomic Loci Influence Hemoglobin A1C Levels via Glycemic and Nonglycemic Pathways. Diabetes, 59, 3229-3239. Speliotes,E. et al. (2010) Association analyses of 249,796 individuals reveal 18 new loci associated with body mass index. Nature Genetics, 42, 937-948. Stahl,E. et al. (2010) Genome-wide association study meta-analysis identifies seven new rheumatoid arthritis risk loci. Nature Genetics, 42, 508-514.

ENIGMA-EEG Genome-wide association
Taal,H. et al. (2012) Common variants at 12q15 and 12q24 are associated with infant head circumference. Nature Genetics, 44, 532-538. Teslovich,T. et al. (2010) Biological, clinical and population relevance of 95 loci for blood lipids. Nature, 466, 707-713. van den Berg,S. et al. (2014) Harmonization of Neuroticism and Extraversion phenotypes across inventories and cohorts in the Genetics of Personality Consortium: an application of Item Response Theory. Behav Genet, 44, 295-313. van der Valk,R. et al. (2014) A novel common variant in DCST2 is associated with length in early life and height in adulthood. Human Molecular Genetics, 24, 1155-1168. Yang,J. et al. (2012) FTO genotype is associated with phenotypic variability of body mass index. Nature, 490, 267-272.
SUPPLEMENTARY NOTE Full acknowledgement University of Minnesota: Funding by National Institutes of Health (NIH) DA 05147, DA 36216, DA 024417, AA 09367, DA 13240
COGA: The Collaborative Study on the Genetics of Alcoholism (COGA), Principal Investigators B. Porjesz, V. Hesselbrock, H. Edenberg, L. Bierut, includes eleven different centers: University of Connecticut (V. Hesselbrock); Indiana University (H.J. Edenberg, J. Nurnberger Jr., T. Foroud); University of Iowa (S. Kuperman, J. Kramer); SUNY Downstate (B. Porjesz); Washington University in St. Louis (L. Bierut, J. Rice, K. Bucholz, A. Agrawal); University of California at San Diego (M. Schuckit); Rutgers University (J. Tischfield, A. Brooks); Department of Biomedical and Health Informatics, The Children’s Hospital of Philadelphia; Department of Genetics, Perelman School of Medicine, University of Pennsylvania, Philadelphia PA (L. Almasy), Virginia Commonwealth University (D. Dick), Icahn School of Medicine at Mount Sinai (A. Goate), and Howard University (R. Taylor). Other COGA collaborators include: L. Bauer (University of Connecticut); J. McClintick, L. Wetherill, X. Xuei, Y. Liu, D. Lai, S. O’Connor, M. Plawecki, S. Lourens (Indiana University); G. Chan (University of Iowa; University of Connecticut); J. Meyers, D. Chorlian, C. Kamarajan, A. Pandey, J. Zhang (SUNY Downstate); J.-C. Wang, M. Kapoor, S. Bertelsen (Icahn School of Medicine at Mount Sinai); A. Anokhin, V. McCutcheon, S. Saccone (Washington University); J. Salvatore, F. Aliev, B. Cho (Virginia Commonwealth University); and Mark Kos (University of Texas Rio Grande Valley). A. Parsian and M. Reilly are the NIAAA Staff Collaborators. We continue to be inspired by our memories of Henri Begleiter and Theodore Reich, founding PI and Co-PI of COGA, and also owe a debt of gratitude to other past organizers of COGA, including Ting-Kai Li, P. Michael Conneally, Raymond Crowe, and Wendy Reich, for their critical contributions. This national collaborative study is supported by NIH Grant U10AA008401 from the National Institute on Alcohol Abuse and Alcoholism (NIAAA) and the National Institute on Drug Abuse (NIDA). Funding for GWAS genotyping, which was performed at the Johns Hopkins University Center for Inherited Disease Research, was provided by NIAAA, the NIH GEI (U01HG004438) and the NIH contract ‘High through-put genotyping for studying the genetic contributions to human disease’ (HHSN268200782096C). Netherlands Twin Registry/Vrije Universiteit: Funding by Netherlands Organization for Scientific Research (NWO) and The Netherlands Organisation for Health Research and Development (ZonMW) grants 904-61-090, 985-10-002, 912-10-020, 904-61-193,480-04-004, 463-06-001, 451-04-034, 400-05-717, Addiction-31160008, Middelgroot-911-09-032, Spinozapremie 56-464-14192, Biobanking and Biomolecular Resources Research Infrastructure (BBMRI –NL, 184.021.007, NWO-Groot 480-15-001/674). VU Institute for Health and Care Research (EMGO+ ); the European Community's Seventh Framework Program (FP7/2007-2013), ENGAGE (HEALTH-F4-2007-201413); the European Research Council (ERC Advanced, 230374, ERC Starting grant 284167), Rutgers University Cell and DNA Repository (NIMH U24 MH068457-06), the Avera Institute, Sioux Falls, South Dakota (USA) and the National Institutes of Health (NIH, R01D0042157-01A, MH081802; R01 DK092127-04, Grand Opportunity grants 1RC2 MH089951 and 1RC2 MH089995). Part of the genotyping and analyses were funded by the Genetic Association Information Network (GAIN) of the Foundation for the National Institutes of Health. Computing was supported by BiG Grid, the Dutch e-Science Grid, which is financially supported by NWO.
Personal funding: Netherlands Organisation for Scientific Research NWO 480-04- 004, NWO/SPI 56-464-14192, and NWO 911-09- 032 to D.B., NWO/MagW VENI-451-08-026 to D.S.; European Research Council ERC-230374 to D.B.; BBR Foundation (NARSAD) Young

Investigator grant 21668 to D.S.; VU University VU-USF 96/22 to D.B.; Human Frontiers of Science Program RG0154/1998-B to D.B., and E.d.G.; KNAW Academy Professor Award (PAH/6635) to D.B.; Australian Research Council (A79600334, A79906588, A79801419, DP0212016) to N.M. and M.W.; National Health and Medical Research Council (Medical Bioinformatics Genomics Proteomics Program 389891) to N.M.; Fellowship APP1103623 to S.M.; NIH K01DA037914 to J.L.M.