Supplementary Figure 1 - Theranosticsthno.org/v08/p4649/thnov08p4649s1.pdf20501202 hsa-miR-362-3p...
20
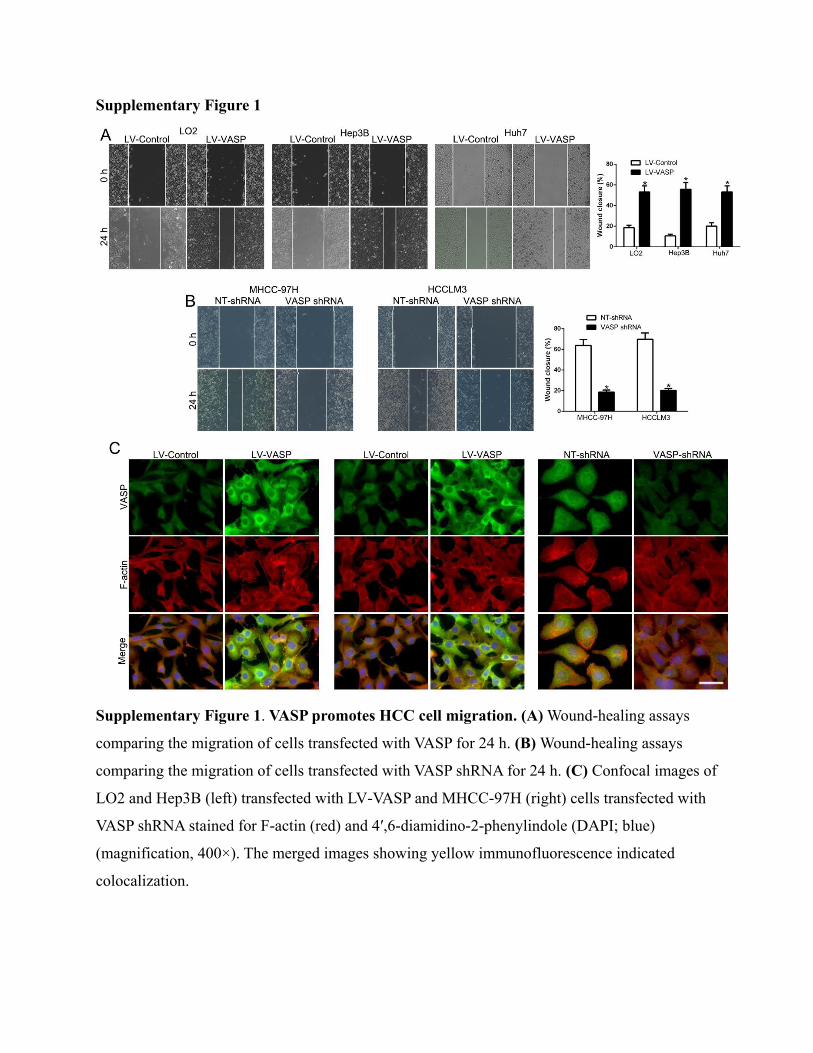
Supplementary Figure 1 Supplementary Figure 1. VASP promotes HCC cell migration. (A) Wound-healing assays comparing the migration of cells transfected with VASP for 24 h. (B) Wound-healing assays comparing the migration of cells transfected with VASP shRNA for 24 h. (C) Confocal images of LO2 and Hep3B (left) transfected with LV-VASP and MHCC-97H (right) cells transfected with VASP shRNA stained for F-actin (red) and 4′,6-diamidino-2-phenylindole (DAPI; blue) (magnification, 400×). The merged images showing yellow immunofluorescence indicated colocalization.
Transcript of Supplementary Figure 1 - Theranosticsthno.org/v08/p4649/thnov08p4649s1.pdf20501202 hsa-miR-362-3p...
Supplementary Figure 1
Supplementary Figure 1. VASP promotes HCC cell migration. (A) Wound-healing assays
comparing the migration of cells transfected with VASP for 24 h. (B) Wound-healing assays
comparing the migration of cells transfected with VASP shRNA for 24 h. (C) Confocal images of
LO2 and Hep3B (left) transfected with LV-VASP and MHCC-97H (right) cells transfected with
VASP shRNA stained for F-actin (red) and 4′,6-diamidino-2-phenylindole (DAPI; blue)
(magnification, 400×). The merged images showing yellow immunofluorescence indicated
colocalization.

Supplementary Figure 2
Supplementary Figure 2. VASP knockdown inhibits HCC cell migration and invasion.
Transwell assays was used to show that VASP knockdown inhibits HCCLM3 cell migration (A)
and invasion (B). (C) Wound healing assays showed that VASP knockdown suppresses
HCCLM3 cell migration. (D) Representative hematoxylin and eosin (H&E) images of metastatic
nodules from the mouse lung tissue sections of the HCCLM3 NT-shRNA group (left) and
HCCLM3 VASP-shRNA#1 group (right). *P<0.05.

Supplementary Figure 3
Supplementary Figure 3. VASP induces EMT and β-catenin nuclear translocation. (A)
Quantitative analysis of the expression of EMT-associated markers after VASP alteration. (B)
Quantitative analysis of levels of β-catenin in nuclear and cytosolic fraction detected by Western
blotting. (C) Top/Fop flash assays detected the β-catenin transcription activity. (D) Quantitative
analysis of levels of β-catenin in nuclear and cytosolic fraction detected by IF. (E) Quantitative
analysis of levels in Hep3B LV-VASP or Huh7 LV-VASP cells transfected with siRNA targeting
Twist1 (Twist1 siRNA) or scrambled siRNA (Control siRNA). (F) Immunoblots were performed
to detect expression of indicated proteins in Hep3B LV-VASP or Huh7 LV-VASP cells
transfected with siRNA targeting Snail (Snail siRNA) or scrambled siRNA (Control siRNA).

Supplementary Figure 4
Supplementary Figure 4. Zymography detects activities of MMP2 and MMP9. The bottom
histogram shows the average optical density from three repeated experiments.

Supplementary Figure 5
Supplementary Figure 5. VASP promotes metastasis of HCC cells in vivo and positively
correlates with EMT markers in HCC tissues. (A) Representative images of metastatic tumors
of liver, kidney, and mesentery are shown. (B) Immunohistochemical analysis of E-cadherin, N-
cadherin, and Vimentin in HCC samples. In cases of low VASP expression (right), there is strong
E-cadherin and no detectable N-cadherin and Vimentin protein expression in the same tissue
section. In contrast, in the case of high VASP expression (left), there is no detectable E-cadherin
and strong N-cadherin and Vimentin protein expression. Values are depicted as Mean ± SEM; *P
< 0.05 by t-test.

Supplementary Figure 6
Supplementary Figure 6. Western blotting detects estimated amounts of VASP in AKT,
ERK, JNK, MAPK, and NF-κB pathways in indicated cells

Supplementary Figure 7
Supplementary Figure 7. CRKL dynamically interacts with VASP and mediates its
functional effects. (A) Co-IP analysis of the interaction between VASP protein and CRKL
protein in HCC cells. (B) Co-IP analysis of the interaction between VASP protein and CRKL
protein in adjacent non-tumor tissues. (C) Transwell assay for migration and invasion was
performed in the cells overexpressing VASP and corresponding cells in control group which were
transfected with CRKL siRNA or control siRNA. The assay was carried out 48 h after
transfection. (D) Western blotting detected Rac1 expression in the cells overexpressing VASP.
The cells in the control group were transfected with CRKL siRNA or control siRNA and the
analysis was performed 48 h after transfection. (E) Quantitative analysis of the protein in cells
overexpressing VASP and corresponding cells in the control group transfected with CRKL
siRNA or control siRNA. Cells were subjected to Western blotting for EMT markers 48 h after
transfection

Supplementary Figure 8
Supplementary Figure 8. HIF-1α mediates hypoxia-induced VASP overexpression on EMT.
(A) HIF-1α siRNA was transfected into LO2, Hep3B, and Huh7 cells to knock down HIF-1α in
hypoxic condition. The Transwell assays for migration and invasion (A) were performed and (B)
quantitative analysis of the EMT protein markers detected by Western blotting.

Supplementary Figure 9
Supplementary Figure 9. Restoration of miR-204 reversed the hypoxia-induced effects on
HCC cells. (A) MiR-204 and its putative binding sequence in the 3’-UTR of VASP. (B) qRT-
PCR was performed to confirm the overexpression or knockdown of miR-204. *, P<0.05 by t-
test. (C-D) LO2, Hep3B, and Huh7 cells cultured in normoxic or hypoxic condition were
transduced with miR-204 vector and were subjected to the Transwell assay for migration and
invasion (C) and (D) quantitative analysis of the EMT protein markers detected by Western
blotting.

Supplementary Figure 10
Supplementary Figure 10. The p-Smad3 inhibitor abolished the effects of hypoxia on HCC
cells. (A) LO2, Hep3B, and Huh7 cells cultured under the normoxic or hypoxic condition were
treated with p-Smad3 inhibitor, SIS3, and were subjected to the Transwell for migration and
invasion. (B) p-Smad3 inhibitor, SB431542, significantly inhibited the numbers of lung
metastases.

Supplementary Figure 11
Supplementary Figure 11. The publicly available database showed the relationship between
VASP and EMT associated factors. (A) The publicly available database compiled in The
Human Protein Atlas showed that high expression of VASP had a worse overall survival. (B-I)
Data from R2: Genomics Analysis and Visualization Platform database showed that VASP
expression has a positive correlation with the expression of different proteins.

Supplementary Figure 12
Supplementary Figure 12. Working model for the oncogenic function of VASP and its
upstream and downstream pathways. VASP promotes the metastasis of HCC cells by
activating AKT and ERK pathways. Hypoxia/HIF-1α signaling upregulates VASP expression in
HCC cells by multiple mechanisms.

Supplementary table 1. Clinical correlation of VASP expression in HCC (n = 126).
Clinical parameters Cases
(n)
Expression level P value
(* p<0.05) VASPhigh
(n=65) VASPlow
(n=61)
Age(years)
< 60 years
≥60 years
74
52
38
27
36
25
0.950
Gender
Male 101 51 50 0.622
Female 25 14 11
Tumor size (cm) 0.486
<5cm 66 36 30
≥5cm 60 29 31
Tumor number 0.006*
solitary 106 49 57
multiple 20 16 4
Edmondson 0.065
Ⅰ+Ⅱ 32 12 20
Ⅲ+Ⅳ 94 53 41
TNM stage 0.004*
Ⅰ+Ⅱ 95 42 53
Ⅲ+Ⅳ 31 23 8
Venous infiltration 0.004*
Present 26 20 6
Absent 100 45 55
AFP 0.930
<400ng/ml 48 25 23
≥400ng/ml 78 40 38
HBsAg 0.623
positive 114 58 56
negative 12 7 5
HCC, hepatocellular carcinoma; AFP, alpha-fetoprotein; TNM, tumor-node-metastasis. *Statistically
significant.

Supplementary table 2. Cox proportional hazard regression analyses for 5-year survival.
Variables Univariate analysis Multivariate analysis
HR 95% CI P HR 95% CI P
Age 0.845 0.352-1.869 0.658 1.128 0.706-1.759 0.632
Gender 0.678 0.308-1.462 0.316 1.013 0.548-1.863 0.972
TNM stage 2.565 1.413-4.687 0.002* 3.347 1.479-7.528 0.004*
NO. of tumor nodule 9.906 3.235-20.328 0.000 9.215 2.806-25.462 0.000
Venous infiltration 2.546 1.114-5.526 0.017 0.925 0.385-2.987 0.915
VASP upregulation 5.203 2.310-11.403 0.000 4.958 1.945-12.654 0.001
HR, hazard ratio; CI, confidence interval; * statistically significant.

Supplementary Table 3. The sequences of walking primers of HIF-1α combines the promoter of
VASP.
Primer Sequence
HRE1F TGGTGAAATCCCATCTCTACTA
HRE1R TGTAGTCTCTCGCTGTCACC
HRE2F TTAGTCTACCCATTCTCCCA
HRE2R ATGTTGTCCTGACCTCCTTT
HRE3F CCCAGGTAAAGGAGGTCAGG
HRE3R GGAAAGCCACCAAGGTCTG
HRE4F GCGCGACCAAATCAGTGA
HRE4R CGGAGGACAGCAGGATCA
HRE5F TTACACACCAAAGAAGCCG
HRE5R AAGGTGAGGAGGAAGTGGG
HRE6F GCGGTGTTCCGAAGATGG
HRE6R CTTCCTAGTTCGCTCCCAC
HRE7F GAACCTCTCATCAGACCGCC
HRE7R ATGGCTGCTCGGCGGGCGGG

Supplementary Table 4. Significantly deregulated miRNAs (> 2fold) comparing Control-
MHCC-97L cells and Hypoxia-treated MHCC-97L cells by miRNA array.
ProbeSet miRNAs Normalized expression Fold
change
(FC)
Log
FC Hypoxia Nomoxia
20525587 hsa-miR-6813-5p 5.056 2.135 7.573 2.921
20525591 hsa-miR-6815-5p 4.241 1.931 4.958 2.310
20519413 hsa-miR-4638-5p 4.436 2.288 4.433 2.148
20525731 hsa-miR-6885-5p 3.274 1.228 4.129 2.046
20501202 hsa-miR-362-3p 4.214 2.246 3.912 1.968
20525392 hsa-miR-6721-5p 4.087 2.194 3.713 1.893
20506818 hsa-miR-1290 5.798 3.937 3.630 1.860
20517817 hsa-miR-3610 3.149 1.299 3.606 1.850
20518785 hsa-miR-4417 4.659 2.888 3.413 1.771
20500483 hsa-miR-221-5p 4.482 2.784 3.245 1.698
20501177 hsa-miR-99b-3p 0.971 2.663 -3.232 -1.692
20504326 hsa-miR-590-5p 3.123 1.447 3.196 1.676
20525440 hsa-miR-6739-5p 5.918 7.576 -3.157 -1.659
20518455 hsa-miR-3927-3p 2.394 4.04 -3.129 -1.646
20525563 hsa-miR-6801-5p 2.668 1.033 3.107 1.636
20501278 hsa-miR-328-3p 1.153 2.785 -3.099 -1.632
20536811 hsa-mir-4531 2.246 0.627 3.071 1.619
20500197 hsa-miR-16-2-3p 4.240 2.675 2.959 1.565
20525502 hsa-miR-6770-3p 2.129 0.598 2.889 1.531
20525739 hsa-miR-6889-5p 5.533 4.016 2.861 1.517
20515536 hsa-miR-378b 4.987 3.474 2.854 1.513
20519609 hsa-miR-4750-5p 6.453 4.952 2.830 1.501
20506847 hsa-miR-1254 3.770 2.308 2.755 1.462
20519488 hsa-miR-4684-3p 2.828 1.376 2.736 1.452
20526182 hsa-miR-7112-5p 4.982 3.544 2.710 1.438
20504564 hsa-miR-1296-5p 2.358 3.792 -2.702 -1.434
20500443 hsa-miR-34a-3p 2.150 0.728 2.679 1.421
20525695 hsa-miR-6867-5p 3.094 4.495 -2.641 -1.401
20525479 hsa-miR-6759-5p 2.668 1.273 2.631 1.396
20529134 hsa-miR-6516-5p 2.357 0.964 2.626 1.393
20518870 hsa-miR-4479 2.353 0.967 2.612 1.385
20515632 hsa-miR-3192-5p 1.986 0.617 2.583 1.369
20518825 hsa-miR-4448 4.308 2.943 2.577 1.365
20518838 hsa-miR-4458 4.000 2.641 2.565 1.359
20517838 hsa-miR-3622b-5p 2.738 1.387 2.550 1.351
20518926 hsa-miR-4526 4.348 3.006 2.535 1.342
20525434 hsa-miR-6736-5p 2.961 4.293 -2.518 -1.332
20503883 hsa-miR-503-3p 1.674 0.346 2.510 1.328
20525492 hsa-miR-6765-3p 3.421 2.095 2.507 1.326
20520218 hsa-miR-5010-5p 2.782 1.465 2.490 1.316

20504186 hsa-miR-455-5p 2.023 0.746 2.424 1.278
20506835 hsa-miR-1244 3.693 4.969 -2.422 -1.276
20505790 hsa-miR-885-3p 5.331 4.062 2.410 1.269
20519472 hsa-miR-4672 3.015 1.754 2.397 1.261
20525706 hsa-miR-6872-3p 1.743 0.490 2.384 1.253
20522012 hsa-miR-5681a 1.223 2.476 -2.382 -1.252
20515610 hsa-miR-3180-3p 6.872 5.622 2.378 1.250
20517706 hsa-miR-4257 3.911 2.672 2.359 1.238
20525446 hsa-miR-6742-5p 2.696 1.469 2.341 1.227
20504407 hsa-miR-652-5p 2.807 4.013 -2.308 -1.206
20525555 hsa-miR-6797-5p 4.863 3.660 2.303 1.203
20517836 hsa-miR-3622a-5p 5.723 4.525 2.294 1.198
20500142 hsa-miR-21-3p 3.660 2.467 2.287 1.194
20520329 hsa-miR-5090 1.400 2.594 -2.287 -1.193
20518425 hsa-miR-3180 6.964 5.776 2.278 1.188
20502446 hsa-miR-451a 4.042 5.211 -2.249 -1.169
20500155 hsa-miR-26b-3p 1.603 0.435 2.248 1.169
20506862 hsa-miR-1266-5p 1.197 2.362 -2.243 -1.165
20520574 hsa-miR-5194 1.186 2.351 -2.242 -1.165
20505608 hsa-miR-675-5p 4.701 3.544 2.230 1.157
20503879 hsa-miR-502-5p 1.601 0.450 2.220 1.151
20500720 hsa-miR-23b-5p 2.913 4.050 -2.200 -1.138
20509235 hsa-miR-1914-3p 4.715 3.578 2.200 1.137
20529784 hsa-miR-8074 2.416 3.544 -2.185 -1.128
20518895 hsa-miR-4499 2.603 3.727 -2.180 -1.124
20518850 hsa-miR-4465 1.957 0.840 2.169 1.117
20521825 hsa-miR-5585-3p 1.202 2.314 -2.161 -1.112
20504581 hsa-miR-769-3p 2.215 1.113 2.146 1.102
20521811 hsa-miR-664b-3p 5.075 3.975 2.143 1.100
20534752 hsa-mir-155 0.820 1.916 -2.138 -1.097
20517696 hsa-miR-4314 1.710 0.631 2.112 1.079
20515635 hsa-miR-3194-5p 1.591 0.520 2.101 1.071
20517709 hsa-miR-4260 1.899 0.830 2.099 1.069
20519554 hsa-miR-4721 7.669 6.614 2.078 1.055
20519457 hsa-miR-4665-5p 7.288 6.234 2.077 1.054
20518852 hsa-miR-4467 8.675 7.622 2.075 1.053
20500186 hsa-miR-101-3p 2.738 1.692 2.065 1.046
20506880 hsa-miR-1278 2.244 1.200 2.062 1.044
20500170 hsa-miR-92a-1-5p 3.200 2.160 2.057 1.040
20515578 hsa-miR-3157-3p 0.673 1.713 -2.056 -1.040
20501228 hsa-miR-370-3p 2.839 1.806 2.046 1.033
20525679 hsa-miR-6859-5p 1.196 2.225 -2.040 -1.028
20529788 hsa-miR-8078 2.139 1.114 2.035 1.025
20500460 hsa-miR-204-5p 1.050 2.072 -2.031 -1.022
20519695 hsa-miR-4797-5p 3.460 4.482 -2.030 -1.022

20537880 hsa-mir-7162 0.532 1.550 -2.026 -1.019
20517745 hsa-miR-4286 6.832 5.816 2.022 1.016
20522034 hsa-miR-5699-5p 1.259 2.273 -2.020 -1.015
20504310 hsa-miR-582-3p 4.135 3.122 2.018 1.013
Supplementary Table 5. The sequences of walking primers of p-Smad3 combines the promoter
of VASP.
Primer Sequence
Site1F GGGTGACAGCGAGAGACTAC
Site1R AGGCCAAGCTTTGACATTAA
Site2F TTCTGGGGGCTCAGGCAA
Site2R GCTTCCGCAGCGTGTCT
Supplementary Table 6. Antibodies used in this study
Antigens Manufacturers Application
VASP 610447, BD transduction Laboratory,
San Jose, CA
1:500 for IF, 1:5000 for
WB (46kDa), 1:300 for
IHC
GAPDH AM4300, Invitrogen, Carlsbad, CA,
USA
1:10000 for WB
E-cadherin #14472, Cell Signaling Technology,
Beverly, MA, USA
1:1000 for WB, 1:400 for
IF, 1:300 for IHC
N-cadherin #13116, Cell Signaling Technology,
Beverly, MA, USA
1:1000 for WB, 1:400 for
IF, 1:300 for IHC
α-E-catenin #3236, Cell Signaling Technology,
Beverly, MA, USA
1:1000 for WB

β-catenin #8480, Cell Signaling Technology,
Beverly, MA, USA
1:1000 for WB, 1:400 for
IF
Fibronectin Ab2413, Cambridge, MA, USA 1:1000 for WB
Vimentin #5741, Cell Signaling Technology,
Beverly, MA, USA
1:1000 for WB, 1:300 for
IHC
Snail #3879, Cell Signaling Technology,
Beverly, MA, USA
1:1000 for WB
Twist1 #46702, Cell Signaling Technology,
Beverly, MA, USA
1:1000 for WB
TIMP1 #8946, Cell Signaling Technology,
Beverly, MA, USA
1:1000 for WB
TIMP2 #5738, Cell Signaling Technology,
Beverly, MA, USA
1:1000 for WB
MMP2 #13132, Cell Signaling Technology,
Beverly, MA, USA
1:1000 for WB
MMP9
#13667, Cell Signaling Technology,
Beverly, MA, USA
1:1000 for WB, 1:300 for
IHC
Histone H3 Ab4729, Cambridge, MA, USA 1:3000 for WB
CRKL Ab15179, Cambridge, MA, USA 1:1000 for WB, 1:400 for
IF
HIF-1α #36169, Cell Signaling Technology,
Beverly, MA, USA
1:1000 for WB
HIF-2α #7096, Cell Signaling Technology,
Beverly, MA, USA
1:1000 for WB
AKT #9272, Cell Signaling Technology,
Beverly, MA, USA
1:1000 for WB
p-AKT #4060, Cell Signaling Technology,
Beverly, MA, USA
1:1000 for WB
ERK #4695, Cell Signaling Technology,
Beverly, MA, USA
1:1000 for WB
p-ERK #4370, Cell Signaling Technology, 1:1000 for WB

Beverly, MA, USA
JNK #9252, Cell Signaling Technology,
Beverly, MA, USA
1:1000 for WB
p-JNK #9255, Cell Signaling Technology,
Beverly, MA, USA
1:1000 for WB
P38 #8690, Cell Signaling Technology,
Beverly, MA, USA
1:1000 for WB
p-P38 #4511, Cell Signaling Technology,
Beverly, MA, USA
1:1000 for WB
NF-κB #8242, Cell Signaling Technology,
Beverly, MA, USA
1:1000 for WB
p-NF-κB #3033, Cell Signaling Technology,
Beverly, MA, USA
1:1000 for WB
p-SMAD2 #18338, Cell Signaling Technology,
Beverly, MA, USA
1:1000 for WB
p-SMAD3 #9520, Cell Signaling Technology,
Beverly, MA, USA
1:1000 for WB
Rac1 #4651, Cell Signaling Technology,
Beverly, MA, USA
1:1000 for WB
F-actin Ab205, Cambridge, MA, USA 1:400 for IF
WB, western blotting; IHC, immunochemistry; IF, immunofluorescence; IP, immunoprepiation