Supplemental Materials: 1. Table S1. Primers used in the...
13
1 Supplemental Materials: 1. Table S1. Primers used in the study 2. Supplemental Figure legends 3. Supplemental Figures
-
Upload
nguyentruc -
Category
Documents
-
view
215 -
download
0
Transcript of Supplemental Materials: 1. Table S1. Primers used in the...

1
Supplemental Materials: 1. Table S1. Primers used in the study 2. Supplemental Figure legends 3. Supplemental Figures
2
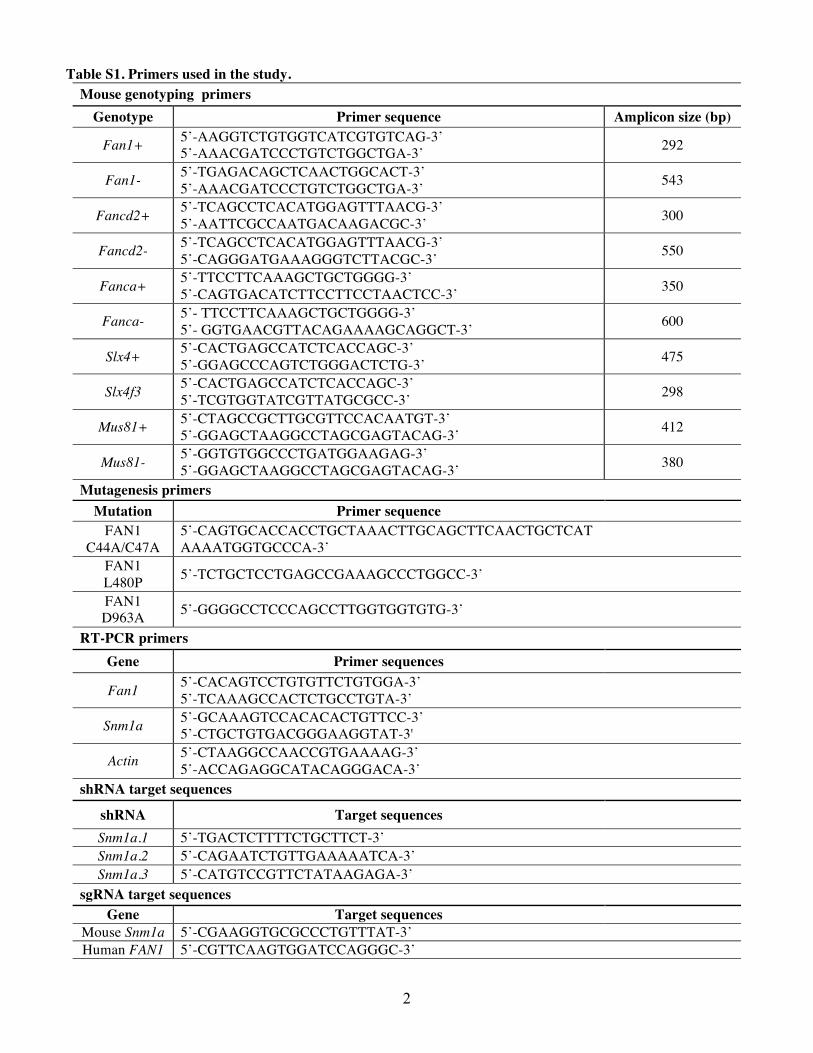
Table S1. Primers used in the study.
Mouse genotyping primers Genotype Primer sequence Amplicon size (bp)
Fan1+ 5’-AAGGTCTGTGGTCATCGTGTCAG-3’ 5’-AAACGATCCCTGTCTGGCTGA-3’ 292
Fan1- 5’-TGAGACAGCTCAACTGGCACT-3’ 5’-AAACGATCCCTGTCTGGCTGA-3’ 543
Fancd2+ 5’-TCAGCCTCACATGGAGTTTAACG-3’ 5’-AATTCGCCAATGACAAGACGC-3’ 300
Fancd2- 5’-TCAGCCTCACATGGAGTTTAACG-3’ 5’-CAGGGATGAAAGGGTCTTACGC-3’ 550
Fanca+ 5’-TTCCTTCAAAGCTGCTGGGG-3’ 5’-CAGTGACATCTTCCTTCCTAACTCC-3’ 350
Fanca- 5’- TTCCTTCAAAGCTGCTGGGG-3’ 5’- GGTGAACGTTACAGAAAAGCAGGCT-3’ 600
Slx4+ 5’-CACTGAGCCATCTCACCAGC-3’ 5’-GGAGCCCAGTCTGGGACTCTG-3’ 475
Slx4f3 5’-CACTGAGCCATCTCACCAGC-3’ 5’-TCGTGGTATCGTTATGCGCC-3’ 298
Mus81+ 5’-CTAGCCGCTTGCGTTCCACAATGT-3’ 5’-GGAGCTAAGGCCTAGCGAGTACAG-3’ 412
Mus81- 5’-GGTGTGGCCCTGATGGAAGAG-3’ 5’-GGAGCTAAGGCCTAGCGAGTACAG-3’ 380
Mutagenesis primers Mutation Primer sequence
FAN1 C44A/C47A
5’-CAGTGCACCACCTGCTAAACTTGCAGCTTCAACTGCTCAT AAAATGGTGCCCA-3’
FAN1 L480P 5’-TCTGCTCCTGAGCCGAAAGCCCTGGCC-3’
FAN1 D963A 5’-GGGGCCTCCCAGCCTTGGTGGTGTG-3’
RT-PCR primers Gene Primer sequences
Fan1 5’-CACAGTCCTGTGTTCTGTGGA-3’ 5’-TCAAAGCCACTCTGCCTGTA-3’
Snm1a 5’-GCAAAGTCCACACACTGTTCC-3’ 5’-CTGCTGTGACGGGAAGGTAT-3'
Actin 5’-CTAAGGCCAACCGTGAAAAG-3’ 5’-ACCAGAGGCATACAGGGACA-3’
shRNA target sequences
shRNA Target sequences Snm1a.1 5’-TGACTCTTTTCTGCTTCT-3’ Snm1a.2 5’-CAGAATCTGTTGAAAAATCA-3’ Snm1a.3 5’-CATGTCCGTTCTATAAGAGA-3’
sgRNA target sequences Gene Target sequences
Mouse Snm1a 5’-CGAAGGTGCGCCCTGTTTAT-3’ Human FAN1 5’-CGTTCAAGTGGATCCAGGGC-3’
3
Supplemental Figure Legends
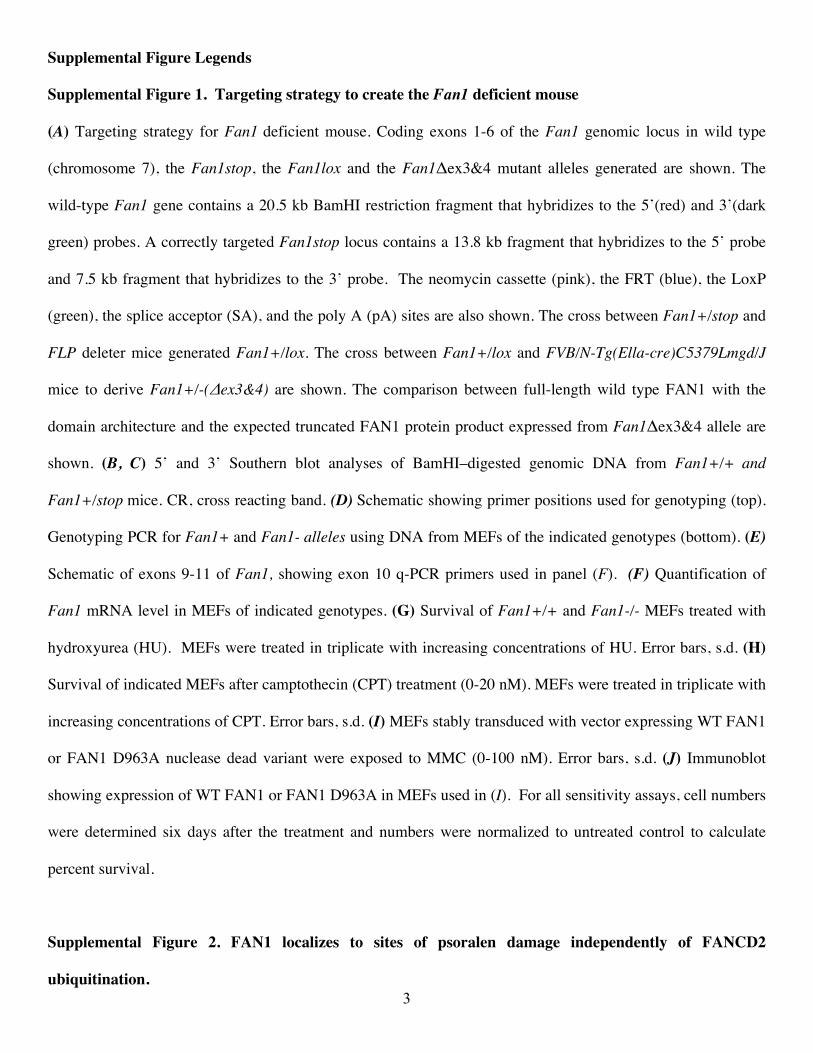
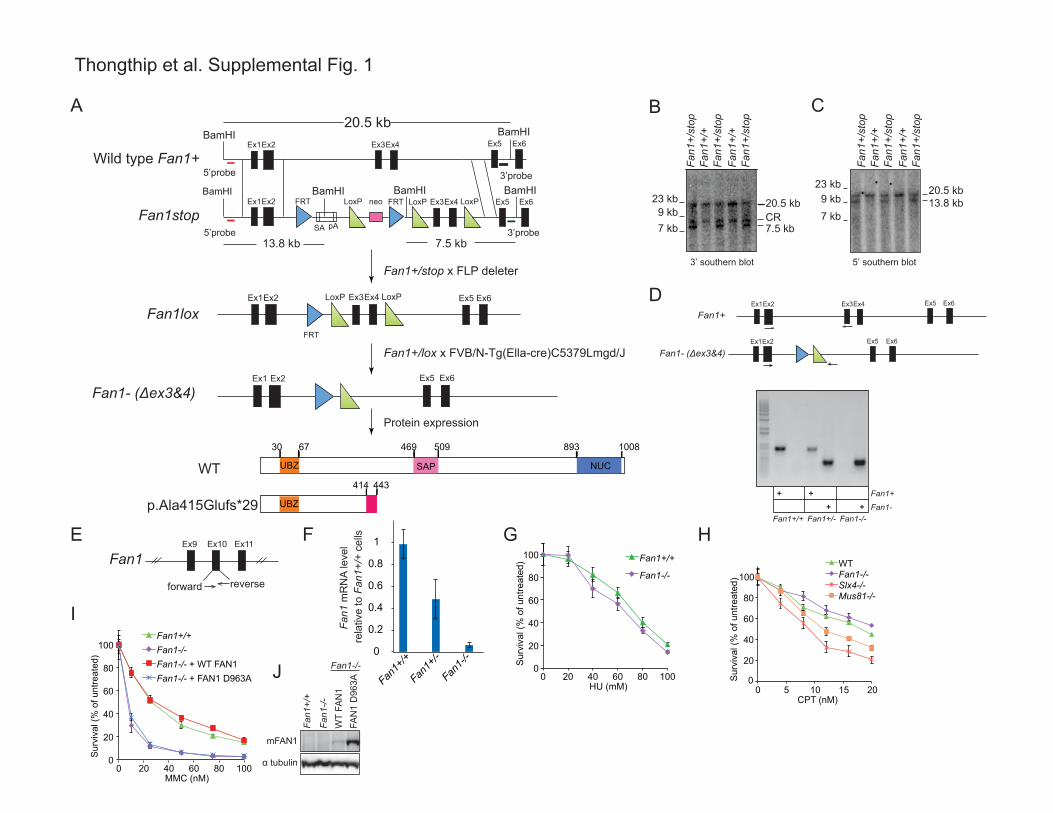
Supplemental Figure 1. Targeting strategy to create the Fan1 deficient mouse
(A) Targeting strategy for Fan1 deficient mouse. Coding exons 1-6 of the Fan1 genomic locus in wild type
(chromosome 7), the Fan1stop, the Fan1lox and the Fan1Δex3&4 mutant alleles generated are shown. The
wild-type Fan1 gene contains a 20.5 kb BamHI restriction fragment that hybridizes to the 5’(red) and 3’(dark
green) probes. A correctly targeted Fan1stop locus contains a 13.8 kb fragment that hybridizes to the 5’ probe
and 7.5 kb fragment that hybridizes to the 3’ probe. The neomycin cassette (pink), the FRT (blue), the LoxP
(green), the splice acceptor (SA), and the poly A (pA) sites are also shown. The cross between Fan1+/stop and
FLP deleter mice generated Fan1+/lox. The cross between Fan1+/lox and FVB/N-Tg(Ella-cre)C5379Lmgd/J
mice to derive Fan1+/-(Δex3&4) are shown. The comparison between full-length wild type FAN1 with the
domain architecture and the expected truncated FAN1 protein product expressed from Fan1Δex3&4 allele are
shown. (B, C) 5’ and 3’ Southern blot analyses of BamHI–digested genomic DNA from Fan1+/+ and
Fan1+/stop mice. CR, cross reacting band. (D) Schematic showing primer positions used for genotyping (top).
Genotyping PCR for Fan1+ and Fan1- alleles using DNA from MEFs of the indicated genotypes (bottom). (E)
Schematic of exons 9-11 of Fan1, showing exon 10 q-PCR primers used in panel (F). (F) Quantification of
Fan1 mRNA level in MEFs of indicated genotypes. (G) Survival of Fan1+/+ and Fan1-/- MEFs treated with
hydroxyurea (HU). MEFs were treated in triplicate with increasing concentrations of HU. Error bars, s.d. (H)
Survival of indicated MEFs after camptothecin (CPT) treatment (0-20 nM). MEFs were treated in triplicate with
increasing concentrations of CPT. Error bars, s.d. (I) MEFs stably transduced with vector expressing WT FAN1
or FAN1 D963A nuclease dead variant were exposed to MMC (0-100 nM). Error bars, s.d. (J) Immunoblot
showing expression of WT FAN1 or FAN1 D963A in MEFs used in (I). For all sensitivity assays, cell numbers
were determined six days after the treatment and numbers were normalized to untreated control to calculate
percent survival.
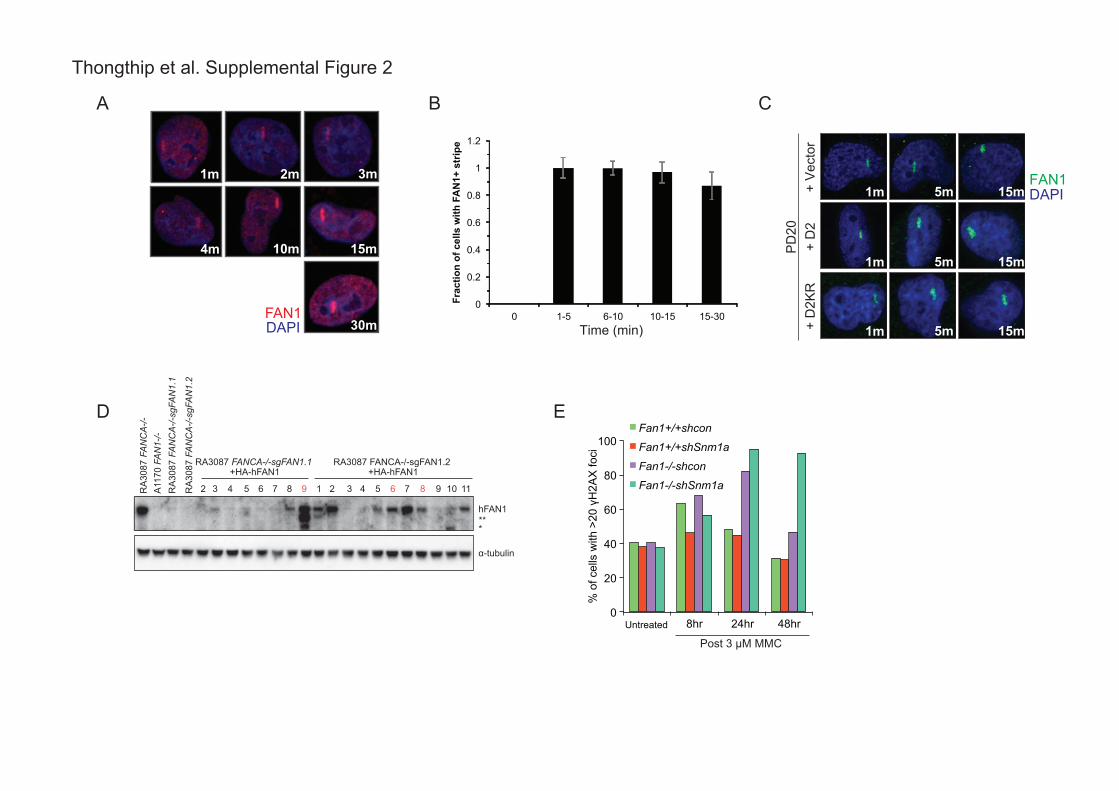
Supplemental Figure 2. FAN1 localizes to sites of psoralen damage independently of FANCD2
ubiquitination.
4
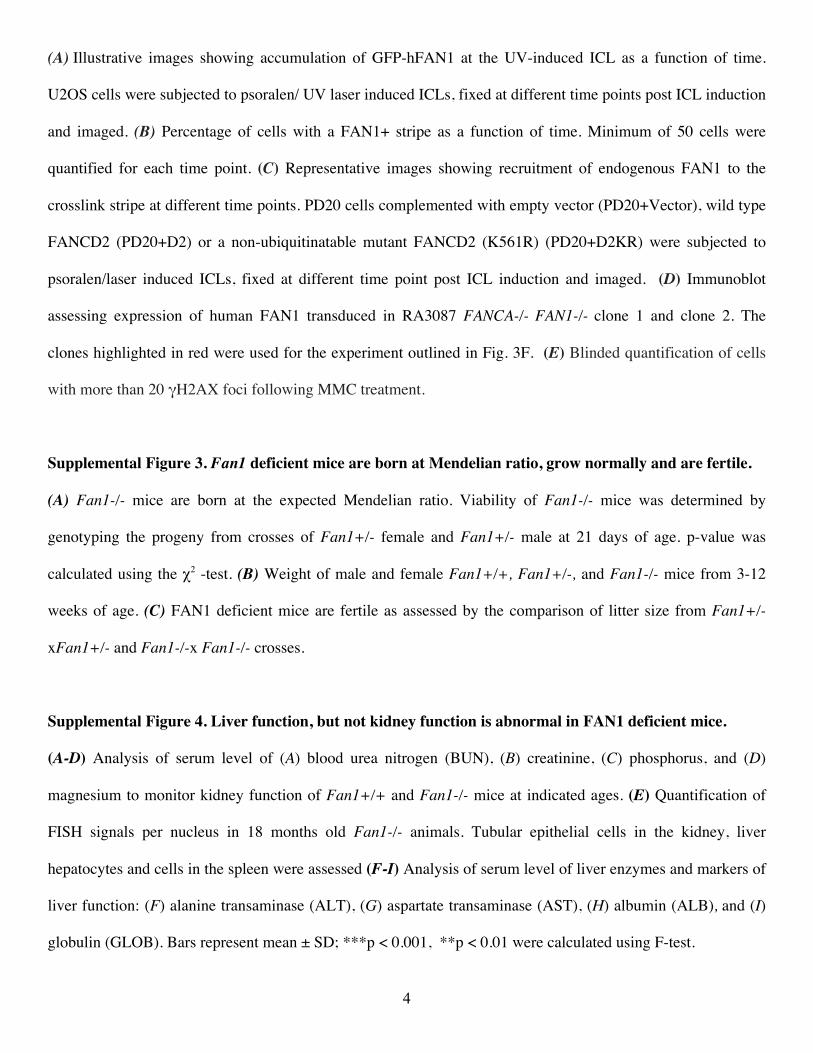
(A) Illustrative images showing accumulation of GFP-hFAN1 at the UV-induced ICL as a function of time.
U2OS cells were subjected to psoralen/ UV laser induced ICLs, fixed at different time points post ICL induction
and imaged. (B) Percentage of cells with a FAN1+ stripe as a function of time. Minimum of 50 cells were
quantified for each time point. (C) Representative images showing recruitment of endogenous FAN1 to the
crosslink stripe at different time points. PD20 cells complemented with empty vector (PD20+Vector), wild type
FANCD2 (PD20+D2) or a non-ubiquitinatable mutant FANCD2 (K561R) (PD20+D2KR) were subjected to
psoralen/laser induced ICLs, fixed at different time point post ICL induction and imaged. (D) Immunoblot
assessing expression of human FAN1 transduced in RA3087 FANCA-/- FAN1-/- clone 1 and clone 2. The
clones highlighted in red were used for the experiment outlined in Fig. 3F. (E) Blinded quantification of cells
with more than 20 γH2AX foci following MMC treatment.
Supplemental Figure 3. Fan1 deficient mice are born at Mendelian ratio, grow normally and are fertile.
(A) Fan1-/- mice are born at the expected Mendelian ratio. Viability of Fan1-/- mice was determined by
genotyping the progeny from crosses of Fan1+/- female and Fan1+/- male at 21 days of age. p-value was
calculated using the χ2 -test. (B) Weight of male and female Fan1+/+, Fan1+/-, and Fan1-/- mice from 3-12
weeks of age. (C) FAN1 deficient mice are fertile as assessed by the comparison of litter size from Fan1+/-
xFan1+/- and Fan1-/-x Fan1-/- crosses.
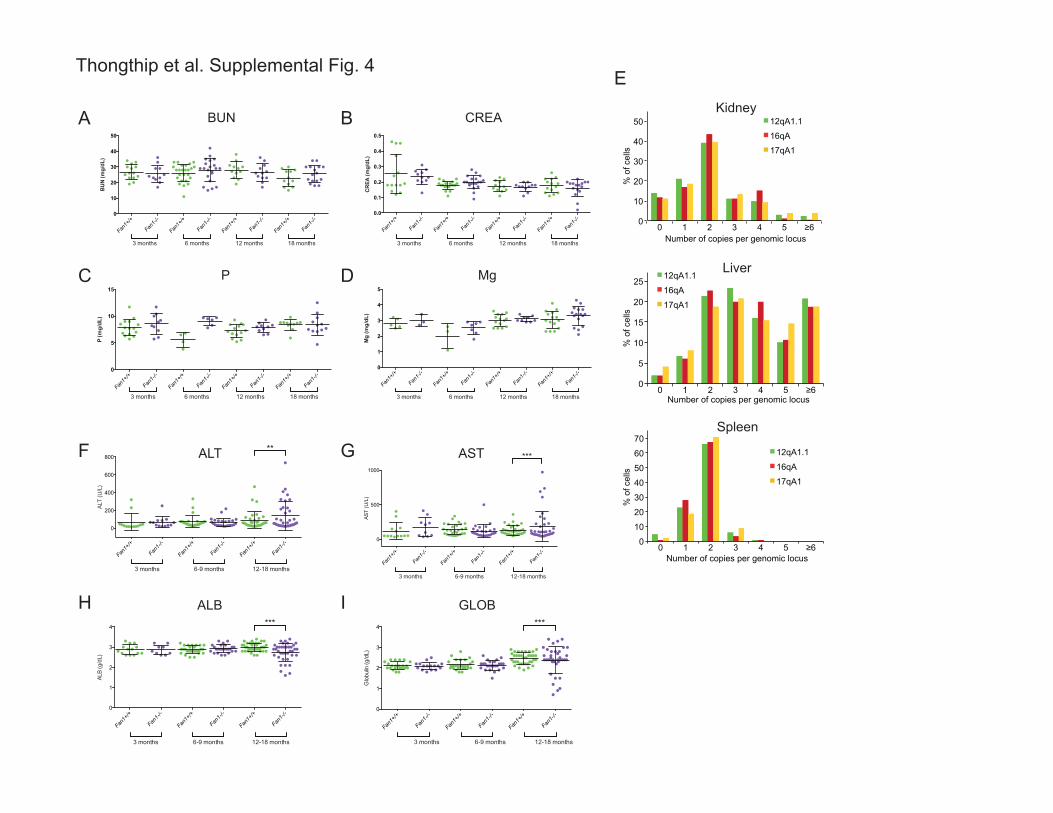
Supplemental Figure 4. Liver function, but not kidney function is abnormal in FAN1 deficient mice.
(A-D) Analysis of serum level of (A) blood urea nitrogen (BUN), (B) creatinine, (C) phosphorus, and (D)
magnesium to monitor kidney function of Fan1+/+ and Fan1-/- mice at indicated ages. (E) Quantification of
FISH signals per nucleus in 18 months old Fan1-/- animals. Tubular epithelial cells in the kidney, liver
hepatocytes and cells in the spleen were assessed (F-I) Analysis of serum level of liver enzymes and markers of
liver function: (F) alanine transaminase (ALT), (G) aspartate transaminase (AST), (H) albumin (ALB), and (I)
globulin (GLOB). Bars represent mean ± SD; ***p < 0.001, **p < 0.01 were calculated using F-test.
5
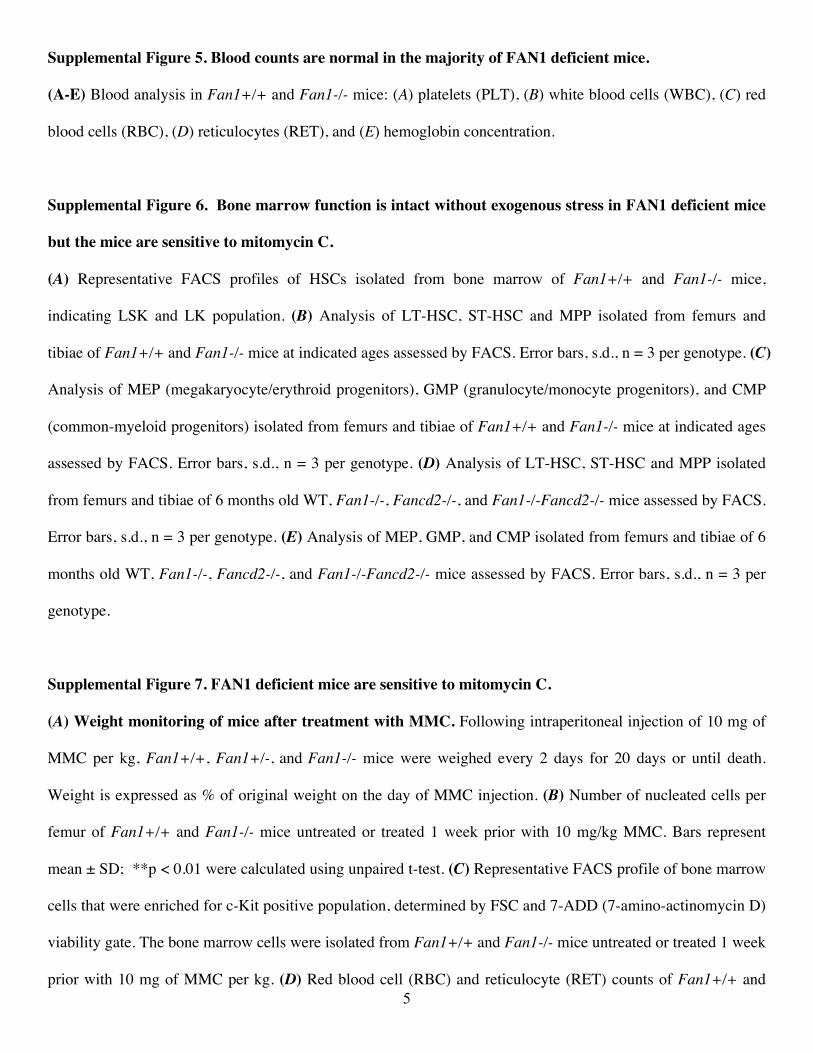
Supplemental Figure 5. Blood counts are normal in the majority of FAN1 deficient mice.
(A-E) Blood analysis in Fan1+/+ and Fan1-/- mice: (A) platelets (PLT), (B) white blood cells (WBC), (C) red
blood cells (RBC), (D) reticulocytes (RET), and (E) hemoglobin concentration.
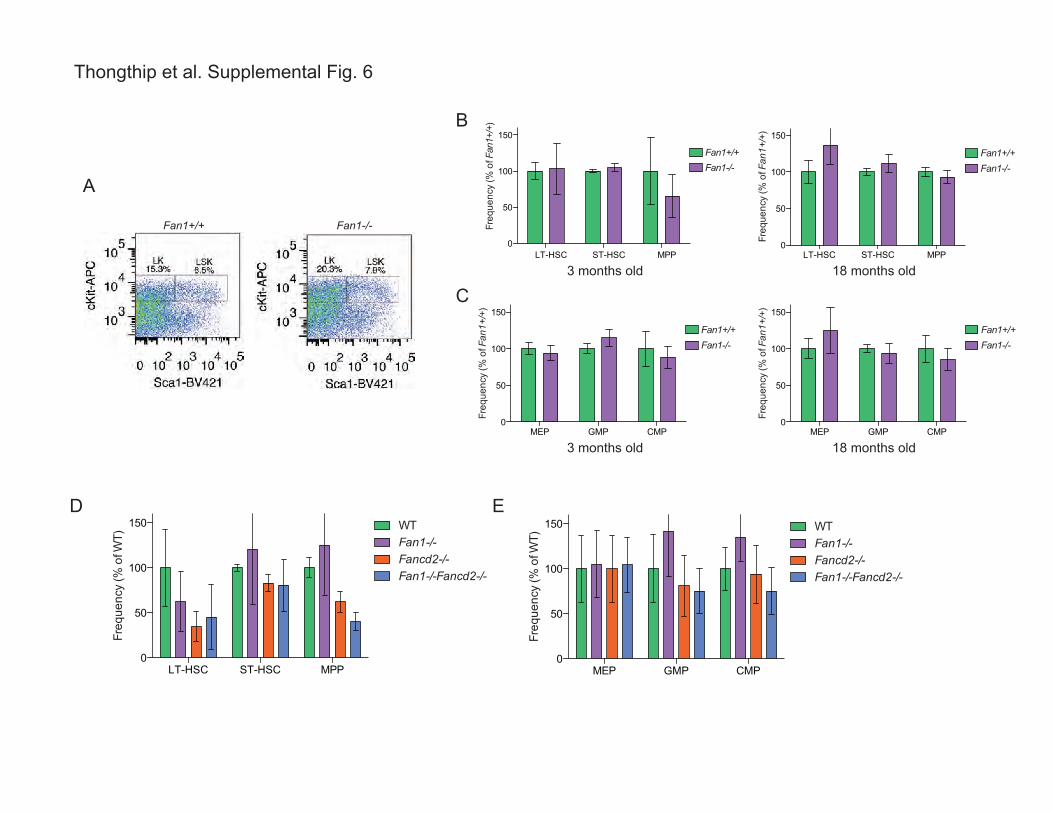
Supplemental Figure 6. Bone marrow function is intact without exogenous stress in FAN1 deficient mice
but the mice are sensitive to mitomycin C.
(A) Representative FACS profiles of HSCs isolated from bone marrow of Fan1+/+ and Fan1-/- mice,
indicating LSK and LK population. (B) Analysis of LT-HSC, ST-HSC and MPP isolated from femurs and
tibiae of Fan1+/+ and Fan1-/- mice at indicated ages assessed by FACS. Error bars, s.d., n = 3 per genotype. (C)
Analysis of MEP (megakaryocyte/erythroid progenitors), GMP (granulocyte/monocyte progenitors), and CMP
(common-myeloid progenitors) isolated from femurs and tibiae of Fan1+/+ and Fan1-/- mice at indicated ages
assessed by FACS. Error bars, s.d., n = 3 per genotype. (D) Analysis of LT-HSC, ST-HSC and MPP isolated
from femurs and tibiae of 6 months old WT, Fan1-/-, Fancd2-/-, and Fan1-/-Fancd2-/- mice assessed by FACS.
Error bars, s.d., n = 3 per genotype. (E) Analysis of MEP, GMP, and CMP isolated from femurs and tibiae of 6
months old WT, Fan1-/-, Fancd2-/-, and Fan1-/-Fancd2-/- mice assessed by FACS. Error bars, s.d., n = 3 per
genotype.
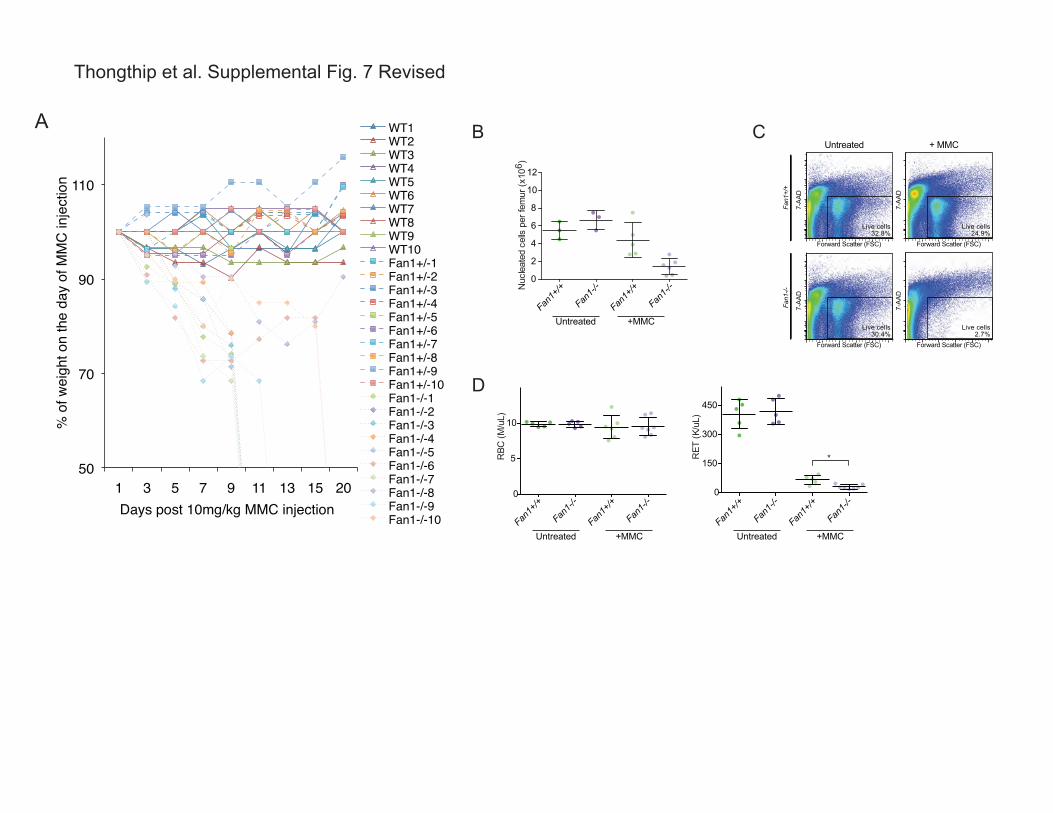
Supplemental Figure 7. FAN1 deficient mice are sensitive to mitomycin C.
(A) Weight monitoring of mice after treatment with MMC. Following intraperitoneal injection of 10 mg of
MMC per kg, Fan1+/+, Fan1+/-, and Fan1-/- mice were weighed every 2 days for 20 days or until death.
Weight is expressed as % of original weight on the day of MMC injection. (B) Number of nucleated cells per
femur of Fan1+/+ and Fan1-/- mice untreated or treated 1 week prior with 10 mg/kg MMC. Bars represent
mean ± SD; **p < 0.01 were calculated using unpaired t-test. (C) Representative FACS profile of bone marrow
cells that were enriched for c-Kit positive population, determined by FSC and 7-ADD (7-amino-actinomycin D)
viability gate. The bone marrow cells were isolated from Fan1+/+ and Fan1-/- mice untreated or treated 1 week
prior with 10 mg of MMC per kg. (D) Red blood cell (RBC) and reticulocyte (RET) counts of Fan1+/+ and

6
Fan1-/- mice untreated or treated 1 week prior with 10 mg of MMC per kg. Bars represent mean ± SD; *p <
0.05 was calculated using unpaired t-test.
Thongthip et al. Supplemental Fig. 1
A CB
Fan1
+/st
opFa
n1+/
+Fa
n1+/
stop
Fan1
+/+
Fan1
+/st
op
23 kb 9 kb 7 kb
3’ southern blot
7.5 kb
20.5 kbCR
5’ southern blot
23 kb 9 kb 7 kb
Fan1
+/st
opFa
n1+/
+Fa
n1+/
stop
Fan1
+/+
Fan1
+/st
op
13.8 kb20.5 kb
Fan1+/stop x FLP deleter
Ex1 Ex2 Ex5 Ex6
p.Ala415Glufs*29
100830 67 469 509 893
NUCUBZ SAPWT414
UBZ
443
Fan1+/lox x FVB/N-Tg(Ella-cre)C5379Lmgd/J
Fan1- (Δex3&4)
Ex1Ex2
Ex1Ex2
Wild type Fan1+
Fan1stopFRT FRTLoxP Ex3Ex4 LoxPLoxP Ex5 Ex6
Ex3Ex4 Ex5 Ex6
neo
SA pA
BamHI
BamHI
BamHI
BamHI
BamHI BamHI
5’probe
5’probe 3’probe
3’probe
20.5 kb
13.8 kb 7.5 kb
Fan1loxEx1Ex2 Ex3Ex4 LoxPLoxP Ex5 Ex6
FRT
Protein expression
Fan1Ex9 Ex10 Ex11
forward reverse
E F
0
0.2
0.4
0.6
0.8
1
Fan1+
/+
Fan1+
/-
Fan1-/
-
Fan1
mR
NA
leve
l re
lativ
e to
Fan
1+/+
cel
lsEx1Ex2 Ex5 Ex6
Ex1Ex2 Ex3Ex4 Ex5 Ex6
Fan1- (Δex3&4)
Fan1+
D
+ Fan1+ ++ + Fan1-
Fan1+/+ Fan1+/- Fan1-/-
0
20
40
60
80
100
0 20 40 60 80 100
Sur
viva
l (%
of u
ntre
ated
)
MMC (nM)
Fan1+/+ Fan1-/- Fan1-/- + WT FAN1 Fan1-/- + FAN1 D963A
I
mFAN1
Fan1
-/-
Fan1
+/+
α tubulin
WT
FAN
1FA
N1
D96
3A
Fan1-/-J
G
0 20 40 60 80 100HU (mM)
0
20
40
60
80
100
Sur
viva
l (%
of u
ntre
ated
) Fan1+/+
Fan1-/-
H
0 5 10 15 20CPT (nM)
0
20
40
60
80
100
Sur
viva
l (%
of u
ntre
ated
)
WTFan1-/- Slx4-/-Mus81-/-
Thongthip et al. Supplemental Figure 2
BA
FAN1DAPI
1m 2m 3m
4m 10m
30m0
0.2
0.4
0.6
0.8
1
1.2
0 1-5 6-10 10-15 15-30
Frac
tion
of c
ells
with
FA
N1+
str
ipe
15m
Time (min)
FAN1DAPI+
Vec
tor
1m 5m 15m
+ D
2
1m 5m 15m
PD
20+
D2K
R
1m 5m 15m
C
RA
3087
FA
NC
A-/-
A11
70 F
AN
1-/-
RA3087 FANCA-/-sgFAN1.1 +HA-hFAN1
2 3 4 5 6 7 8 9
α-tubulin
hFAN1***
RA3087 FANCA-/-sgFAN1.2 +HA-hFAN1
3 4 5 6 7 8 9 10RA
3087
FA
NC
A-/-
sgFA
N1.
1
RA
3087
FA
NC
A-/-
sgFA
N1.
2
1 2 11
D E
0
20
40
60
80
100
Untreated 8hr 24hr 48hr
% o
f cel
ls w
ith >
20
H2A
X fo
ci
Fan1+/+shcon
Fan1+/+shSnm1a
Fan1-/-shcon
Fan1-/-shSnm1a
Post 3 μM MMC

Genotype # of pups Observed ratio
Expected Ratio
Fan1+/+ 49 0.24 0.25
Fan1+/- 107 0.51 0.50
Fan1-/- 51 0.25 0.25
Total number 207 p-value 0.8714
Thongthip et al. Supplemental Figure. 3
B
C
A
Maternal genotype
Paternal genotype
Number of Mating tested
Number of litters
Number of pups
Pups/litters
Fan1+/- Fan1+/- 15 15 110 7.3
Fan1-/- Fan1-/- 8 8 65 8.1
5
10
15
20
25
30
3 4 5 6 7 8 9 10 11 12
Wei
ght (
g)
Age (weeks)
Fan1+/+ (n=12)Fan1+/- (n=12)Fan1-/- (n=10)
5
10
15
20
25
30
3 4 5 6 7 8 9 10 11 12
Wei
ght (
g)
Age (weeks)
Fan1+/+ (n=10)Fan1+/- (n=10)Fan1-/- (n=10)
Male Female
Thongthip et al. Supplemental Fig. 4
BA
C D
F G
H I
Fan1+
/+
Fan
1-/-
Fan1+
/+
Fan
1-/-
Fan1+
/+
Fan
1-/-
Fan1+
/+
Fan
1-/-
0
1
2
3
4
5
Mg
(mg/
dL)
3 months 6 months 12 months 18 monthsFan
1+/+
Fan
1-/-
Fan1+
/+
Fan
1-/-
Fan1+
/+
Fan
1-/-
Fan1+
/+
Fan
1-/-
0
5
10
15
P (m
g/dL
)
3 months 6 months 12 months 18 months
Fan1+
/+
Fan
1-/-
Fan1+
/+
Fan
1-/-
Fan1+
/+
Fan
1-/-
Fan1+
/+
Fan
1-/-
0.0
0.1
0.2
0.3
0.4
0.5
CR
EA (m
g/dL
)
3 months 6 months 12 months 18 months
Fan1+
/+
Fan
1-/-
Fan1+
/+
Fan
1-/-
Fan1+
/+
Fan
1-/-
Fan1+
/+
Fan
1-/-
0
10
20
30
40
50
BU
N (m
g/dL
)
3 months 6 months 12 months 18 months
BUN CREA
P Mg
Fan1+
/+
Fan
1-/-
Fan1+
/+
Fan
1-/-
Fan1+
/+
Fan
1-/-
0
500
1000
AST
(U/L
)
3 months 6-9 months 12-18 months
***AST
Fan1+
/+
Fan
1-/-
Fan1+
/+
Fan
1-/-
Fan1+
/+
Fan
1-/-
0
200
400
600
800
ALT
(U/L
)
3 months 6-9 months 12-18 months
**
Fan1+
/+
Fan
1-/-
Fan1+
/+
Fan
1-/-
Fan1+
/+
Fan
1-/-
0
1
2
3
4
ALB
(g/d
L)
3 months 6-9 months 12-18 months
***
ALT
ALB
Fan1+
/+
Fan
1-/-
Fan1+
/+
Fan
1-/-
Fan1+
/+
Fan
1-/-
0
1
2
3
4
Glo
bulin
(g/d
L)
3 months 6-9 months 12-18 months
***
GLOB
E
0
10
20
30
40
50
0 1 2 3 4 5 6
% o
f cel
ls
Number of copies per genomic locus
12qA1.1
16qA
17qA1
Kidney
0
5
10
15
20
25
0 1 2 3 4 5 6
% o
f cel
ls
Number of copies per genomic locus
12qA1.1
16qA
17qA1
Liver
0
10
20
30
40
50
60
70
0 1 2 3 4 5 6
% o
f cel
ls
Number of copies per genomic locus
12qA1.1
16qA
17qA1
Spleen

Fan1+
/+
Fan1-/
-
Fan1+
/+
Fan1-/
-0
1000
2000
3000
PLT
(K/u
L)
3 months 18 months
Fan1+
/+
Fan1-/
-
Fan1+
/+
Fan1-/
-0
5
10
15
RBC
(M/u
L)
3 months 18 months
Fan1+
/+
Fan1-/
-
Fan1+
/+
Fan1-/
-0
5
10
15
WBC
(K/u
L)
3 months 18 months
Fan1+
/+
Fan1-/
-
Fan1+
/+
Fan1-/
-0
1000
2000
RET
# (K
/uL)
3 months 18 months
Fan1+
/+
Fan1-/
-
Fan1+
/+
Fan1-/
-
5
10
15
HG
B (g
/dL)
3 months 18 months
A B C
D E
Thongthip et al. Supplemental Fig. 5
PLT WBC RBC
RET HGB
LT-HSC ST-HSC MPP0
50
100
150
Freq
uenc
y (%
of W
T)
WTFan1-/-Fancd2-/-Fan1-/-Fancd2-/-
MEP GMP CMP0
50
100
150Fr
eque
ncy
(% o
f WT)
WTFan1-/-Fancd2-/-Fan1-/-Fancd2-/-
MEP GMP CMP0
50
100
150
Freq
uenc
y (%
of F
an1+
/+)
Fan1+/+Fan1-/-
B
C
D E
LT-HSC ST-HSC MPP0
50
100
150
Freq
uenc
y (%
of F
an1+
/+)
Fan1+/+Fan1-/-
3 months old
3 months oldMEP GMP CMP
0
50
100
150
Freq
uenc
y (%
of F
an1+
/+)
Fan1+/+Fan1-/-
18 months old
LT-HSC ST-HSC MPP0
50
100
150
Freq
uenc
y (%
of F
an1+
/+)
Fan1+/+Fan1-/-
18 months old
Thongthip et al. Supplemental Fig. 6
A
Fan1+/+ Fan1-/-
50
70
90
110
1 3 5 7 9 11 13 15 20
% o
f wei
ght o
n th
e da
y of
MM
C in
ject
ion
Days post 10mg/kg MMC injection
WT1WT2WT3WT4WT5WT6WT7WT8WT9WT10Fan1+/-1Fan1+/-2Fan1+/-3Fan1+/-4Fan1+/-5Fan1+/-6Fan1+/-7Fan1+/-8Fan1+/-9Fan1+/-10Fan1-/-1Fan1-/-2Fan1-/-3Fan1-/-4Fan1-/-5Fan1-/-6Fan1-/-7Fan1-/-8Fan1-/-9Fan1-/-10
A
Thongthip et al. Supplemental Fig. 7 Revised
B
Forward Scatter (FSC)
7-AA
D
30.4%Live cells
Forward Scatter (FSC)
7-AA
D
2.7%Live cells
Forward Scatter (FSC)
7-AA
D
24.9%Live cells
Forward Scatter (FSC)
7-AA
D
32.8%Live cells
Untreated + MMC
Fan1
+/+
Fan1
-/-
RET
(K/u
L)
0
150
300
450
RBC
(M/u
L)0
5
10
Fan1+
/+
Fan1-/
-
Fan1+
/+
Fan1-/
-
Untreated +MMCFan
1+/+
Fan1-/
-
Fan1+
/+
Fan1-/
-
Untreated +MMC
D
0
2
4
6
8
10
12
Nuc
leat
ed c
ells
per
fem
ur (x
106 )
Fan1+
/+
Fan1-/
-
Fan1+
/+
Fan1-/
-
Untreated +MMC
C
*