Supplemental Information Q3 2017/media/Files/O/Omega-HealthCare/... · 1 Supplemental Information...
21
1 Supplemental Informaon Q3 2017 TABLE OF CONTENTS Page Porolio Investment Summary ............................................. 3 Revenue Summary ................................................. 3 Operator Payor Mix and Coverage Summary ....... 3 Rent/Interest Concentraon by Operator ............ 4 Lease and Mortgage Expiraons ........................... 4 Diversificaon Operator Geographic Diversificaon .................... 5 Selected Metrics Occupancy by State................................................ 5 EBITDARM & EBITDAR Coverage Straficaon .... 6 EBITDAR Coverages less than 1.0x ........................ 6 Investment Acvity ................................................ 7 New Builds, Major Renovaons, & Capex ............ 7 Capitalizaon Capital Structure and Rates ................................... 8 Debt Maturity Schedule......................................... 8 Senior Unsecured Debt Rangs............................. 8 Selected Covenants and Raos ............................. 9 Equity Issuance Summary ....................................10 Book and Market Capitalizaon ..........................11 Financial Performance Historical AFFO, FAD and Dividends....................12 Current Year Guidance ........................................13 Quarterly Financials Income Statements ..............................................14 Balance Sheets .....................................................15 Statements of Cash Flow .....................................16 Non-GAAP Reconciliaons Net Income, FFO, Adjusted FFO and FAD ...........17 EBITDA and Debt Coverage Raos ......................19 EBITDA and FC and Interest Coverage Raos .....20 Selected Definions .............................................21 Execuve Officers Taylor Picke, President and Chief Execuve Officer Dan Booth, Chief Operang Officer Steven Insoſt, Chief Corporate Development Officer Bob Stephenson, Chief Financial Officer Mike Ritz, Chief Accounng Officer Board of Directors Craig R. Callen, Chairman Craig M. Bernfield Edward Lowenthal Norman R. Bobins Stephen D. Plavin Barbara B. Hill Ben W. Perks Bernard J. Korman Taylor Picke Analysts Omega Healthcare Investors, Inc. is a Real Estate Investment Trust ("REIT") providing financing and capital to the long-term healthcare industry with a parcular focus on skilled nursing facilies located in the United States. As of September 30, 2017, Omega has a porolio of investments that includes approximately 1,000 properes located in 42 states and the UK (53 facilies) and operated by 77 different operators (includes the Manhaan 2nd Avenue project). As a source of capital to the healthcare industry, Omega connually evaluates the opportunies, trends and challenges affecng the industry. Our goal is to idenfy long-term investments in quality healthcare properes with outstanding operators that provide the most favorable risk/reward rao to our investors. Stock Symbol: OHI Shares & Units Outstanding September 30, 2017: 206,836,429 Exchange: NYSE CUSIP Number: 681936100 Contact Information Omega Healthcare Investors, Inc. Transfer Agent Correspondence 303 International Circle Computershare, Inc. Suite 200 P.O. Box 505000 Hunt Valley, MD 21030 Louisville, KY 40233 (410) 427-1700 (Main) (800) 368-5948 (866) 996-6342 (Investor Relations) www.omegahealthcare.com www.computershare.com Bank of America/Merrill Lynch............ Juan Sanabria........ 646-855-1589 BTIG....................................................... Michael Gorman... 646-562-1320 Capital One Securities.......................... Daniel Bernstein.... 571-835-7202 Goldman Sachs...................................... Andrew Rosivach... 212-902-2796 Green Street Advisors........................... Michael Knott........ 949-640-8780 Hilliard Lyons......................................... John Roberts......... 502-588-1165 Jeffries................................................... Tayo Okusanya...... 212-336-7076 JMP Securities....................................... Peter Martin.......... 415-835-8900 Stifel Nicolaus........................................ Chad Vanacore...... 518-587-2581 SunTrust................................................ Eric Fleming........... 617-345-6536 UBS......................................................... Nicholas Yulico...... 212-713-3402 Wells Fargo............................................ Todd Stender......... 212-214-8067
Transcript of Supplemental Information Q3 2017/media/Files/O/Omega-HealthCare/... · 1 Supplemental Information...
1
Supplemental Information Q3 2017
TABLE OF CONTENTS
Page
Portfolio
Investment Summary ............................................. 3 Revenue Summary ................................................. 3 Operator Payor Mix and Coverage Summary ....... 3 Rent/Interest Concentration by Operator ............ 4 Lease and Mortgage Expirations ........................... 4
Diversification Operator Geographic Diversification .................... 5 Selected Metrics Occupancy by State................................................ 5 EBITDARM & EBITDAR Coverage Stratification .... 6 EBITDAR Coverages less than 1.0x ........................ 6 Investment Activity ................................................ 7 New Builds, Major Renovations, & Capex ............ 7
Capitalization
Capital Structure and Rates ................................... 8 Debt Maturity Schedule ......................................... 8 Senior Unsecured Debt Ratings ............................. 8 Selected Covenants and Ratios ............................. 9 Equity Issuance Summary .................................... 10 Book and Market Capitalization .......................... 11
Financial Performance
Historical AFFO, FAD and Dividends .................... 12 Current Year Guidance ........................................ 13
Quarterly Financials Income Statements .............................................. 14 Balance Sheets ..................................................... 15 Statements of Cash Flow ..................................... 16 Non-GAAP Reconciliations
Net Income, FFO, Adjusted FFO and FAD ........... 17 EBITDA and Debt Coverage Ratios ...................... 19 EBITDA and FC and Interest Coverage Ratios ..... 20 Selected Definitions ............................................. 21
Executive Officers
Taylor Pickett, President and Chief Executive Officer Dan Booth, Chief Operating Officer Steven Insoft, Chief Corporate Development Officer Bob Stephenson, Chief Financial Officer Mike Ritz, Chief Accounting Officer
Board of Directors
Craig R. Callen, Chairman Craig M. Bernfield Edward Lowenthal Norman R. Bobins Stephen D. Plavin Barbara B. Hill Ben W. Perks Bernard J. Korman Taylor Pickett
Analysts
Omega Healthcare Investors, Inc. is a Real Estate Investment Trust ("REIT") providing financing and capital to the long-term healthcare industry with a particular focus on skilled nursing facilities located in the United States.
As of September 30, 2017, Omega has a portfolio of investments that includes approximately 1,000 properties located in 42 states and the UK (53 facilities) and operated by 77 different operators (includes the Manhattan 2nd Avenue project).
As a source of capital to the healthcare industry, Omega continually evaluates the opportunities, trends and challenges affecting the industry. Our goal is to identify long-term investments in quality healthcare properties with outstanding operators that provide the most favorable risk/reward ratio to our investors.
Stock Symbol: OHI Shares & Units Outstanding September 30, 2017: 206,836,429
Exchange: NYSE CUSIP Number: 681936100
Contact Information
Omega Healthcare Investors, Inc. Transfer Agent Correspondence
303 International Circle Computershare, Inc.
Suite 200 P.O. Box 505000
Hunt Valley, MD 21030 Louisville, KY 40233
(410) 427-1700 (Main) (800) 368-5948
(866) 996-6342 (Investor Relations)
www.omegahealthcare.com www.computershare.com
Bank of America/Merrill Lynch............ Juan Sanabria........ 646-855-1589BTIG....................................................... Michael Gorman... 646-562-1320Capital One Securities.......................... Daniel Bernstein.... 571-835-7202Goldman Sachs...................................... Andrew Rosivach... 212-902-2796Green Street Advisors........................... Michael Knott........ 949-640-8780Hilliard Lyons......................................... John Roberts......... 502-588-1165Jeffries................................................... Tayo Okusanya...... 212-336-7076JMP Securities....................................... Peter Martin.......... 415-835-8900Stifel Nicolaus........................................ Chad Vanacore...... 518-587-2581SunTrust................................................ Eric Fleming........... 617-345-6536UBS......................................................... Nicholas Yulico...... 212-713-3402
Wells Fargo............................................ Todd Stender......... 212-214-8067

2
Disclaimers
This supplement includes forward-looking statements within the meaning of Section 27A of the Securities Act of 1933, as amended, and Section 21E of the Securities Exchange Act of 1934, as amended. All statements regarding Omega’s or its ten-ants’, operators’, borrowers’ or managers’ expected future financial condition, results of operations, cash flows, funds from operations, dividends and dividend plans, financing opportunities and plans, capital markets transactions, business strategy, budgets, projected costs, operating metrics, capital expenditures, competitive positions, acquisitions, investment opportunities, dispositions, facility transitions, growth opportunities, expected lease income, continued qualification as a REIT, plans and ob-jectives of management for future operations and statements that include words such as “anticipate,” “if,” “believe,” “plan,” “estimate,” “expect,” “intend,” “may,” “could,” “should,” “will” and other similar expressions are forward-looking statements. These forward-looking statements are inherently uncertain, and actual results may differ from Omega’s expectations. Omega does not undertake a duty to update these forward-looking statements, which speak only as of the date on which they are made.
Omega’s actual results may differ materially from those reflected in such forward-looking statements as a result of a variety of factors, including, among other things: (i) uncertainties relating to the business operations of the operators of Omega ’s proper-ties, including those relating to reimbursement by third-party payors, regulatory matters and occupancy levels; (ii) regulatory and other changes in the healthcare sector; (iii) changes in the financial position of Omega’s operators; (iv) the ability of any of Omega’s operators in bankruptcy to reject unexpired lease obligations, modify the terms of Omega’s mortgages and impede the ability of to collect unpaid rent or interest during the pendency of a bankruptcy proceeding and retain security deposits for the debtor's obligations; (v) the availability and cost of capital; (vi) changes in Omega’s credit ratings and the ratings of its debt securities; (vii) competition in the financing of healthcare facilities; (viii) Omega’s ability to maintain its status as a REIT; (ix) Omega’s ability to sell assets held for sale on a timely basis and on terms that allow Omega to realize the carrying value of these assets; (x) Omega’s ability to re-lease, otherwise transition or sell underperforming assets (including the Orianna portfo-lio) on a timely basis and on terms that allow Omega to realize the carrying value of these assets; (xi) the effect of economic and market conditions generally, and particularly in the healthcare industry; (xii) the potential impact of changes in the SNF and ALF market or local real estate conditions on the Company’s ability to dispose of assets held for sale for the anticipated proceeds or on a timely basis, or to redeploy the proceeds therefrom on favorable terms and (xiii) other factors identified in Omega’s filings with the Securities and Exchange Commission. Statements regarding future events and developments and Omega’s future performance, as well as management's expectations, beliefs, plans, estimates or projections relating to the future, are forward looking statements. Omega undertakes no obligation to update any forward-looking statements contained in this supplement.
Operator Information: This supplement includes information regarding the operators of our facilities such as EBITDAR and EBITDARM coverage ratios. The information related to operators that is provided in this supplement has been provided by the operators. We have not independently verified this information. We are providing this data for informational purposes only.
Non-GAAP Information: This supplement also contains certain non-GAAP financial information including EBITDA, Adjusted Total Debt (or Funded Debt), Adjusted Book Capitalization, FFO, Adjusted FFO, Funds Available for Distribution (“FAD”), Total Cash Fixed Charges and certain related ratios. A reconciliation of these non-GAAP disclosures is available in the Financial Per-formance section of this supplement.
Information is provided as of September 30, 2017, unless specifically stated otherwise. We assume no duty to update or sup-plement the information provided.
3
Portfolio: Summary by Asset and Property Type
Revenue Summary
Operator Payor Mix and Coverage Summary
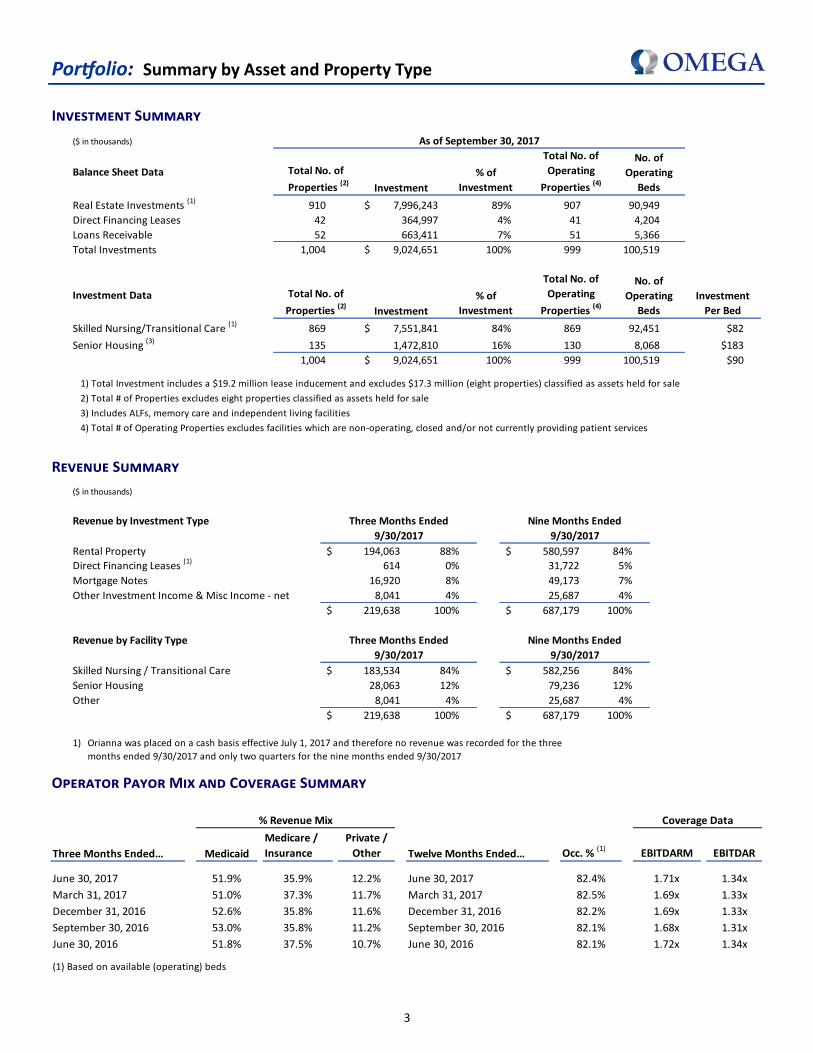
Investment Summary
($ in thousands)
Balance Sheet Data Total No. of
Properties (2)Investment
% of
Investment
Total No. of
Operating
Properties (4)
No. of
Operating
Beds
Real Estate Investments (1) 910 7,996,243$ 89% 907 90,949
Direct Financing Leases 42 364,997 4% 41 4,204
Loans Receivable 52 663,411 7% 51 5,366
Total Investments 1,004 9,024,651$ 100% 999 100,519
Investment Data Total No. of
Properties (2)Investment
% of
Investment
Total No. of
Operating
Properties (4)
No. of
Operating
Beds
Investment
Per Bed
Skilled Nursing/Transitional Care (1) 869 7,551,841$ 84% 869 92,451 $82
Senior Housing (3) 135 1,472,810 16% 130 8,068 $183
1,004 9,024,651$ 100% 999 100,519 $90
1) Total Investment includes a $19.2 million lease inducement and excludes $17.3 million (eight properties) classified as assets held for sale
2) Total # of Properties excludes eight properties classified as assets held for sale
3) Includes ALFs, memory care and independent living facilities
4) Total # of Operating Properties excludes facilities which are non-operating, closed and/or not currently providing patient services
As of September 30, 2017
% Revenue Mix Coverage Data
Three Months Ended… Medicaid
Medicare /
Insurance
Private /
Other Twelve Months Ended… Occ. % (1)
EBITDARM EBITDAR
June 30, 2017 51.9% 35.9% 12.2% June 30, 2017 82.4% 1.71x 1.34x
March 31, 2017 51.0% 37.3% 11.7% March 31, 2017 82.5% 1.69x 1.33x
December 31, 2016 52.6% 35.8% 11.6% December 31, 2016 82.2% 1.69x 1.33x
September 30, 2016 53.0% 35.8% 11.2% September 30, 2016 82.1% 1.68x 1.31x
June 30, 2016 51.8% 37.5% 10.7% June 30, 2016 82.1% 1.72x 1.34x
(1) Based on available (operating) beds
($ in thousands)
Revenue by Investment Type Three Months Ended Nine Months Ended
9/30/2017 9/30/2017
Rental Property 194,063$ 88% 580,597$ 84%
Direct Financing Leases (1)
614 0% 31,722 5%
Mortgage Notes 16,920 8% 49,173 7%
Other Investment Income & Misc Income - net 8,041 4% 25,687 4%
219,638$ 100% 687,179$ 100%
Revenue by Facility Type Three Months Ended Nine Months Ended
9/30/2017 9/30/2017
Skilled Nursing / Transitional Care 183,534$ 84% 582,256$ 84%
Senior Housing 28,063 12% 79,236 12%
Other 8,041 4% 25,687 4%
219,638$ 100% 687,179$ 100%
1) Orianna was placed on a cash basis effective July 1, 2017 and therefore no revenue was recorded for the three
months ended 9/30/2017 and only two quarters for the nine months ended 9/30/2017
4
Portfolio: Operator Diversification and Lease Maturities
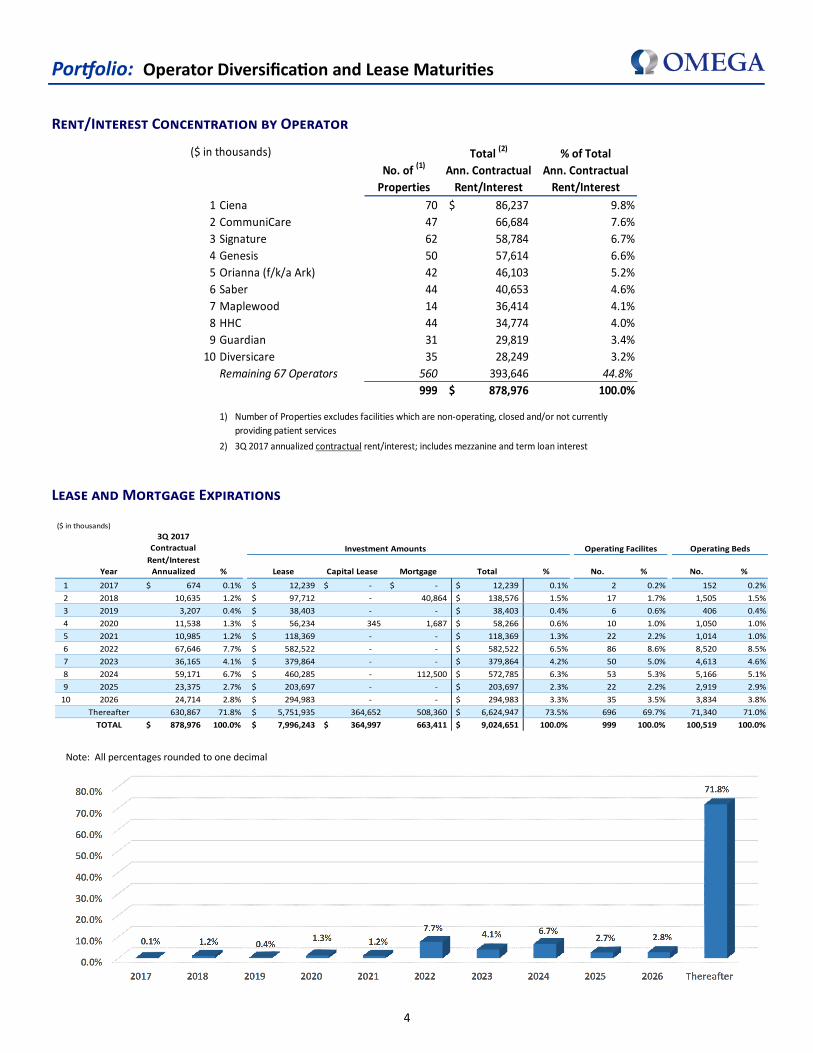
Rent/Interest Concentration by Operator
Lease and Mortgage Expirations
($ in thousands)
3Q 2017
Contractual Investment Amounts Operating Facilites Operating Beds
Year
Rent/Interest
Annualized % Lease Capital Lease Mortgage Total % No. % No. %
1 2017 674$ 0.1% 12,239$ -$ -$ 12,239$ 0.1% 2 0.2% 152 0.2%
2 2018 10,635 1.2% 97,712$ - 40,864 138,576$ 1.5% 17 1.7% 1,505 1.5%
3 2019 3,207 0.4% 38,403$ - - 38,403$ 0.4% 6 0.6% 406 0.4%
4 2020 11,538 1.3% 56,234$ 345 1,687 58,266$ 0.6% 10 1.0% 1,050 1.0%
5 2021 10,985 1.2% 118,369$ - - 118,369$ 1.3% 22 2.2% 1,014 1.0%
6 2022 67,646 7.7% 582,522$ - - 582,522$ 6.5% 86 8.6% 8,520 8.5%
7 2023 36,165 4.1% 379,864$ - - 379,864$ 4.2% 50 5.0% 4,613 4.6%
8 2024 59,171 6.7% 460,285$ - 112,500 572,785$ 6.3% 53 5.3% 5,166 5.1%
9 2025 23,375 2.7% 203,697$ - - 203,697$ 2.3% 22 2.2% 2,919 2.9%
10 2026 24,714 2.8% 294,983$ - - 294,983$ 3.3% 35 3.5% 3,834 3.8%
Thereafter 630,867 71.8% 5,751,935$ 364,652 508,360 6,624,947$ 73.5% 696 69.7% 71,340 71.0%
TOTAL 878,976$ 100.0% 7,996,243$ 364,997$ 663,411 9,024,651$ 100.0% 999 100.0% 100,519 100.0%
Note: All percentages rounded to one decimal
($ in thousands)
No. of (1)
Properties
Total (2)
Ann. Contractual
Rent/Interest
% of Total
Ann. Contractual
Rent/Interest
1 Ciena 70 86,237$ 9.8%
2 CommuniCare 47 66,684 7.6%
3 Signature 62 58,784 6.7%
4 Genesis 50 57,614 6.6%
5 Orianna (f/k/a Ark) 42 46,103 5.2%
6 Saber 44 40,653 4.6%
7 Maplewood 14 36,414 4.1%
8 HHC 44 34,774 4.0%
9 Guardian 31 29,819 3.4%
10 Diversicare 35 28,249 3.2%
Remaining 67 Operators 560 393,646 44.8%
999 878,976$ 100.0%
1)
2)
Number of Properties excludes facilities which are non-operating, closed and/or not currently
providing patient services
3Q 2017 annualized contractual rent/interest; includes mezzanine and term loan interest

5
Portfolio: Operator Geographic Diversification at September 30, 2017
Geographic Concentration by Investment
<10 facilities
10 to 20 facilities
>20 facilities
State Concentration Key
Operators: 77 (1) Facilities: 999(2) States: 42 (3) Foreign Countries: 1 (UK)
1) Many operators have facilities in multiple states 2) Excludes non-operating facilities, closed and/or not cur-
rently providing patient services 3) Includes New York City 2nd Avenue development project
($ in thousands) As of September 30, 2017
No. of
Properties (1)
Total
Investment(2)%
Investment
%
Occupancy (4)
Ohio 86 844,799$ 9.4% 84.0%
Florida 95 800,588 8.9% 87.7%
Texas 109 776,633 8.6% 71.6%
Michigan 49 623,781 6.9% 84.7%
Indiana 74 617,491 6.8% 82.1%
California 54 496,980 5.5% 92.5%
Pennsylvania 43 469,608 5.2% 87.5%
Tennessee 41 327,289 3.6% 71.6%
North Carolina 32 264,951 2.9% 83.3%
Virginia 17 262,205 2.9% 86.9%
Remaining 32 states (3) 351 3,136,485 34.8% 80.1%
951 8,620,810$ 95.5%
United Kingdom 53 403,841 4.5% 91.9%
Total 1,004 9,024,651$ 100.0% 82.4%
2) Includes a $19.2 million lease inducement and excludes $17.3 million (eight properties) classified as AHS
3) Includes New York City 2nd Avenue development project
4) As of June 30, 2017, TTM
1) Excludes eight properties classified as assets held for sale (AHS)
6
0
0.1
0.2
0.3
0.4
0.5
0.6
0.7
0.8
<1.0x 1.0x - 1.2x 1.2x - 1.8x >=1.8x
% of Rent/Debt Service
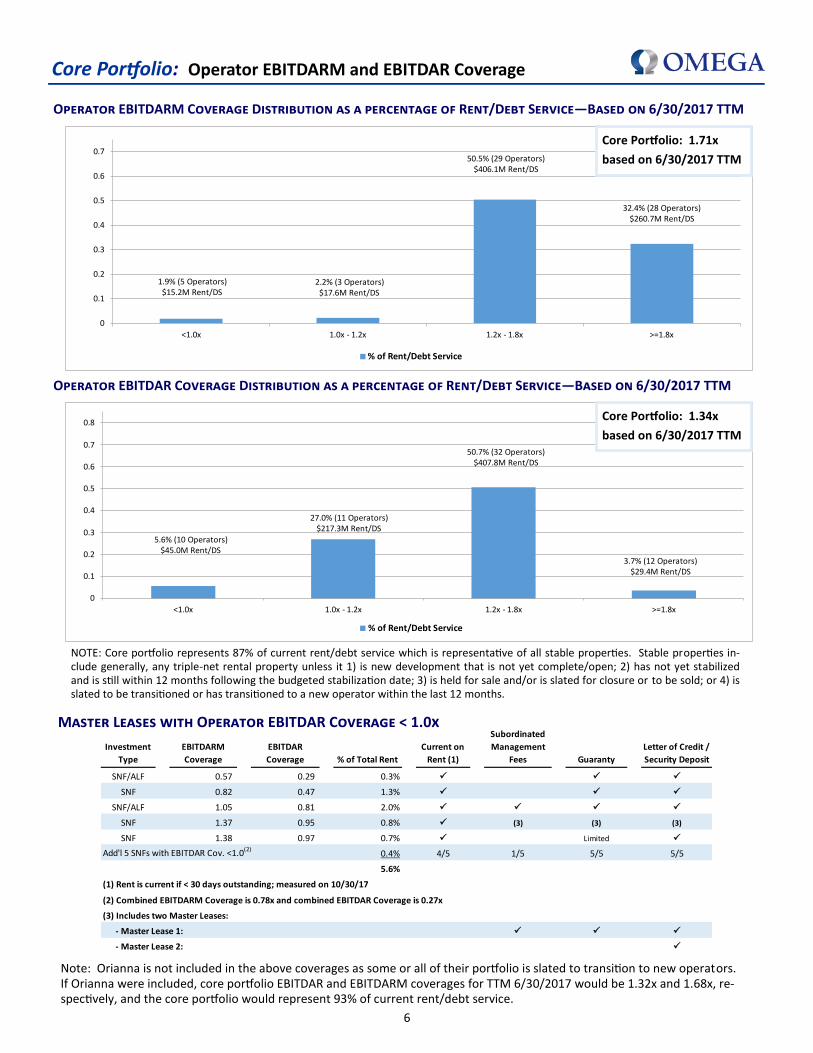
5.6% (10 Operators)$45.0M Rent/DS
27.0% (11 Operators)$217.3M Rent/DS
50.7% (32 Operators)$407.8M Rent/DS
3.7% (12 Operators)$29.4M Rent/DS
0
0.1
0.2
0.3
0.4
0.5
0.6
0.7
<1.0x 1.0x - 1.2x 1.2x - 1.8x >=1.8x
% of Rent/Debt Service
1.9% (5 Operators)$15.2M Rent/DS
2.2% (3 Operators)$17.6M Rent/DS
50.5% (29 Operators)$406.1M Rent/DS
32.4% (28 Operators)$260.7M Rent/DS
Core Portfolio: Operator EBITDARM and EBITDAR Coverage
Operator EBITDARM Coverage Distribution as a percentage of Rent/Debt Service—Based on 6/30/2017 TTM
Operator EBITDAR Coverage Distribution as a percentage of Rent/Debt Service—Based on 6/30/2017 TTM
Master Leases with Operator EBITDAR Coverage < 1.0x
Core Portfolio: 1.71x
based on 6/30/2017 TTM
Core Portfolio: 1.34x
based on 6/30/2017 TTM
NOTE: Core portfolio represents 87% of current rent/debt service which is representative of all stable properties. Stable properties in-clude generally, any triple-net rental property unless it 1) is new development that is not yet complete/open; 2) has not yet stabilized and is still within 12 months following the budgeted stabilization date; 3) is held for sale and/or is slated for closure or to be sold; or 4) is slated to be transitioned or has transitioned to a new operator within the last 12 months.
Investment
Type
EBITDARM
Coverage
EBITDAR
Coverage % of Total Rent
Current on
Rent (1)
Subordinated
Management
Fees Guaranty
Letter of Credit /
Security Deposit
SNF/ALF 0.57 0.29 0.3% ✓ ✓ ✓
SNF 0.82 0.47 1.3% ✓ ✓ ✓
SNF/ALF 1.05 0.81 2.0% ✓ ✓ ✓ ✓
SNF 1.37 0.95 0.8% ✓ (3) (3) (3)
SNF 1.38 0.97 0.7% ✓ Limited ✓
Add'l 5 SNFs with EBITDAR Cov. <1.0(2)0.4% 4/5 1/5 5/5 5/5
5.6%
(1) Rent is current if < 30 days outstanding; measured on 10/30/17
(2) Combined EBITDARM Coverage is 0.78x and combined EBITDAR Coverage is 0.27x
(3) Includes two Master Leases:
- Master Lease 1: ✓ ✓ ✓
- Master Lease 2: ✓
Note: Orianna is not included in the above coverages as some or all of their portfolio is slated to transition to new operators. If Orianna were included, core portfolio EBITDAR and EBITDARM coverages for TTM 6/30/2017 would be 1.32x and 1.68x, re-spectively, and the core portfolio would represent 93% of current rent/debt service.

7
Portfolio: Investment Activity—Last Five Years
New Builds, Major Renovations and CAPEX Investments
Fac. #
Commitment
Year Location
# of
Projects
Property
Type
Initial
Cash
Yield
Beds /
Units
Investment
Commitment
Inception to Date
Funding (1)Remaining
Commitment
Estimated In
Service Date
Estimated
Additional
Quarterly
Rent (2)
1058 2013 Elk Grove, CA 1 TBI 9.50% 6 1,440,659$ 1,367,904$ 72,755$ Nov-17 32,488$
1503 2014 Middleburg, FL 1 SNF 9.00% 120 17,750,000 4,547,850 13,202,150 Apr-18 102,327
1436 2015 2nd Ave, NY 1 ALF / MC 7.00% 214 249,628,480 143,066,129 106,562,351 Nov-19 2,503,657
1438 2015 Baton Rouge, LA 1 ALF 8.75% 50 11,700,000 9,916,479 1,783,521 In Service Q1 -
1445 2015 Five Forks, GA 1 ALF 8.75% 48 10,600,000 9,164,185 1,435,815 In Service Q1 -
1444 2015 Watkins, VA 1 ALF 8.75% 48 11,700,000 7,088,731 4,611,269 Jan-18 -
1435 2015 Pensacola, FL 1 SNF 8.75% 90 21,171,638 16,894,680 4,276,958 Dec-17 369,571
1502 2015 Polk County, FL 1 SNF 9.00% 120 18,000,000 9,119,880 8,880,120 Mar-18 205,197
1484 2016 Brunswick, NC 1 SNF 9.00% 100 11,650,000 9,823,017 1,826,983 Jan-18 221,018
1542 2016 Pensacola, FL 1 SNF 8.75% 90 19,500,000 1,522,067 17,977,933 Dec-18 33,295
1506 2016 Viera, FL 1 SNF 8.75% 131 26,500,000 4,468,179 22,031,821 Nov-18 97,746
1562 2017 Darien, CT 1 ALF 9.00% 34 15,684,889 2,612,329 13,072,560 Apr-19 58,777
1563 2017 Southport, CT 1 ALF 9.00% 98 36,146,285 3,531,152 32,615,133 May-19 79,451
1568 2017 St. Clair Shores, MI 1 SNF 9.50% 101 17,000,000 4,738,404 12,261,596 Mar-19 -
14 1,250 468,471,951$ 227,860,986$ 240,610,965$ 3,703,527$
Additional Capex (excluding New Builds) (3) 109 286,190,634 202,414,107 83,776,527
Total: 123 1,250 754,662,585$ 430,275,093$ 324,387,492$
1) Includes land2) Inception to date funding multiplied by initial cash yield divided by four3) Current quarter revenue already reflects fundings to date
($ in Thousands) Investment Facility Types Totals
Amount SNF Beds ALF Beds Rehab Beds ILU Units Facilities Beds/Uts
2012 Total Investments 509,558$ 39 4,832 6 601 - - 6 259 51 5,692
2013 Total Investments 620,858$ 59 5,769 2 152 - - - - 61 5,921
2014 Total Investments 565,510$ 25 2,684 7 541 - - - - 32 3,225
2015 Total Investments 506,944$ 12 1,367 27 1,212 - - - - 39 2,579
2016
Acquisition 1/18/2016 8,270$ UK - - 1 52 - - - - 1 52
Acquisition 2/1/2016 169,000 MI, OH, VA 10 985 - - - - - - 10 985
Acquisition 3/1/2016 20,200 GA - - 2 164 - - - - 2 164
Acquisition 3/15/2016 6,134 UK - - 1 33 - - - - 1 33
Acquisition 3/1/2016 212,500 NC, VA 21 2,446 - - - - - - 21 2,446
Acquisition 4/1/2016 113,816 UK - - 10 775 - - - - 10 775
Acquisition 4/20/2016 66,000 TX - - 3 367 - - - - 3 367
Acquisition 4/29/2016 31,790 CO, MO 3 338 - - - - - - 3 338
Acquisition 7/29/2016 4,300 FL - - 1 114 - - - - 1 114
Acquisition 8/31/2016 16,500 FL - - 1 175 - - - - 1 175
Acquisition 8/31/2016 2,500 GA - - 1 46 - - - - 1 46
Acquisition 9/30/2016 10,100 SC 1 144 - - - - - - 1 144
Acquisition 9/30/2016 9,000 OH 1 96 - - - - - - 1 96
Acquisition 9/30/2016 300,000 FL, KY, TN 31 4,047 - - - - - - 31 4,047
Total Acquisitions & Mortgages 970,110$ 67 8,056 20 1,726 - - - - 87 9,782
Construction-in-Progress 62,197
CAPEX Funding and Other 72,515
Mezz, Term Loans, DFL & Other 223,447
2016 Total Investments 1,328,269$
2017
Acquisition 1/31/2017 7,574$ VA - - 1 60 - - - - 1 60
Acquisition 5/8/2017 114,803 UK - - 18 992 - - - - 18 992
Acquisition 6/22/2017 8,600 NC 1 100 - - - - - - 1 100
Mortgage 6/30/2017 11,000 MI 3 271 - - - - - - 3 271
Acquisition 8/11/2017 2,294 TX - - 1 48 - - - - 1 48
Acquisition 8/31/2017 191,000 IN 15 2,074 - - - - - - 15 2,074
Total Acquisitions & Mortgages 335,271$ 19 2,445 20 1,100 - - - - 39 3,545
Construction-in-Progress 63,371
CAPEX Funding and Other 43,574
Direct Financing Leases & Other 16,393
2017 Total Investments 458,609$

8
Capitalization: Capital Structure and Rates
Capital Structure
Debt Maturities
Senior Unsecured Credit Ratings Rating Information
CUSIP # S&P Moody's Fitch
Common Stock 681936 10 0
Senior Unsecured Debt
$700M, 4.375% 2023 Notes 681936 BJ 8 BBB- Baa3 BBB-
$400M, 4.950% 2024 Notes 681936 BB 5 BBB- Baa3 BBB-
$400M, 4.500% 2025 Notes 681936 BD 1 BBB- Baa3 BBB-
$600M, 5.250% 2026 Notes 681936 BH 2 BBB- Baa3 BBB-
$700M, 4.500% 2027 Notes 681936 BF 6 BBB- Baa3 BBB-
$550M, 4.750% 2028 Notes 681936 BK 5 BBB- Baa3 BBB-
BBB-
Stable Stable Stable
Michael Souers Lori Marks Peter Siciliano
(212) 438-2508 (212) 553-1098 (646) 582-4760
Corporate Rating................................................................
Outlook...............................................................................
Analyst(s)............................................................................
($ in thousands) Secured Debt Unsecured Debt
Year
HUD
Mortgages (1)
Line of Credit &
Term Loans (2)(3) Senior Notes(4) Sub Notes (5)Total
Debt Maturities
2017 - - - - -
2018 - - - - -
2019 - - - - -
2020 - - - - -
2021 - 1,250,000 - 20,000 1,270,000
2022 908,980 908,980
2023 - - 700,000 - 700,000
Thereafter 53,992 - 2,650,000 - 2,703,992
53,992 2,158,980 3,350,000 20,000 5,582,972
1) Mortgages guaranteed by HUD (excludes net deferred financing costs of $0.6 million)
2) Reflected at 100% borrowing capacity; does not reflect extension options 4) Excludes net discounts, deferred financing costs and a
$1.5 million promissory note
5) Excludes $0.4 million of fair market valuation adjustments
3) $1.25 billion excludes a $700 million accordion feature and $6.0 million net
deferred financing costs. The $909 million is comprised of a: $425 million U.S.
Dollar term loan, £100 million term loan (equivalent to $134.0 million in US
dollars), $100 million term loan to Omega’s operating partnership and $250
million 2015 term loan (excludes $5.8 million net deferred financing costs)
3Q 2017
Funded Debt/
Debt Capacity Month Adj. Proforma
Secured in USD Ending Interest Latest Yrs to Borrowed as of % of AnnualizedFinancial Instrument (Y/N) 9/30/2017 Rate Type Pay Dates Maturity Maturity 9/30/2017 Total EBITDA
Credit Facility:Revolver - USD N 900,000,000 2.486% V
(1)5/25/22
(2)4.6 Yrs 365,000,000 7.8%
Revolver - USD & Alternate Currency N 350,000,000 2.486% V (1) 5/25/22 (2) 4.6 Yrs - 0.0%$425MM U.S Term Loan N 425,000,000 2.685% V 5/25/22 4.6 Yrs 425,000,000 9.0%$100MM OHI LP Term Loan N 100,000,000 2.685% V 5/25/22 4.6 Yrs 100,000,000 2.1%£100MM Sterling Term Loan (3) N 133,980,000 1.701% V 5/25/22 4.6 Yrs 133,980,000 2.9%
$250MM Term N 250,000,000 3.800% F (4) 12/16/22 5.1 Yrs 250,000,000 5.3%$20M Sub-Notes N 20,000,000 9.000% F 6/1 12/1 12/21/21 4.1 Yrs 20,000,000 0.4%$700M 4.375% Notes N 700,000,000 4.375% F 2/1 8/1 8/1/23 5.8 Yrs 700,000,000 14.9%$400M 4.95% Notes N 400,000,000 4.950% F 4/1 10/1 4/1/24 6.4 Yrs 400,000,000 8.5%$400M 4.50% Notes N 400,000,000 4.500% F 1/15 7/15 1/15/25 7.2 Yrs 400,000,000 8.5%$600M 5.25% Notes N 600,000,000 5.250% F 1/15 7/15 1/15/26 8.2 Yrs 600,000,000 12.8%$700M 4.50% Notes N 700,000,000 4.500% F 10/1 4/1 4/1/27 9.4 Yrs 700,000,000 14.9%$550M 4.75% Notes N 550,000,000 4.750% F 1/15 7/15 1/15/28 10.2 Yrs 550,000,000 11.7%HUD (12 Loan Summary) Y 53,992,192 3.063% F 7/1/44 26.7 Yrs 53,992,192 1.1%
100.0%Total Debt 5,582,972,192$ 4,697,972,192$ 5.08 x
Weighted Averages 3.90% 7.3 Yrs 4.17%
Common Stock: 198,064,922 shares at $31.91 per share: 6,320,251,661Operating Units: 8,771,507 units at $31.91 per unit: 279,898,788
Total Market Capitalization 11,298,122,642$
Note: At September 30, 2017, Omega held approximately $24.3MM of net cash and short-term investments
1) Excludes 0.25% annual Facility Fee on the full commitment 3) Equivalent USD amount shown using exchange rate as of last day of month
2) Includes options for two, six-month extensions from 5/25/2021 4) Swapped to fixed beginning 12/30/2016

9
Capitalization: Selected Covenants and Ratios
Selected Credit Facility and Unsecured Note Covenants (1)
Selected Credit Statistics
1) EBITDA is adjusted for non-cash and one-time items, and for leverage ratios includes proforma revenue for investments made in quarter/year; Total Net Funded Debt excludes outstanding L/C's, if any, premium on bonds, fair market valuations & FIN46 consolidations and net of cash & cash equivalents. EBITDA for "Qtr. Ending" periods are annualized
2) Fixed charges includes scheduled amortizations, amortization of deferred financing charges and capitalized interest
(1) Covenants are based on calculations as defined in the Company’s Credit Agreement and Senior Note Indentures
NOTE: See the Non-GAAP reconciliations provided at the end of this supplement and on our website at www.omegahealthcare.com under “Financial Information” then “Non-GAAP Financial Measures”
Consolidated
Quarter Ending
Leverage
Ratio
Secured
Leverage
Ratio
Unsecured
Leverage
Ratio
Fixed
Charge Cov.
Ratio
Unsecured
Interest Cov.
Ratio
Tangible
Net Worth
Requirement: <= 60% <=30% <= 60% >=1.50 to 1 >=2.00 to 1 >$3,375MM
December 31, 2016 46% 1% 50% 5.3 4.5 Pass
March 31, 2017 46% 1% 50% 5.2 4.3 Pass
June 30, 2017 48% 1% 49% 4.9 4.2 Pass
September 30, 2017 54% 1% 55% 4.8 4.3 Pass
Status Pass Pass Pass Pass Pass Pass
Quarter Ending
Debt / Adj.
Total Assets
Unencumbered
Assets /
Unsecured Debt
Secured Debt / Adj.
Total Assets
Requirement: <= 60% >= 150% <= 40%
December 31, 2016 47% 207% 0%
March 31, 2017 47% 206% 0%
June 30, 2017 48% 200% 0%
September 30, 2017 50% 191% 0%
Status Pass Pass Pass
Credit Facility
Unsecured Notes
20173Q 2Q 1Q 2016YE 2015YE 2014YE 2013YE
Funded Debt / Adj. Pro Forma EBITDA (1) 5.1 4.8 4.7 4.7 4.5 4.6 4.4
Secured Debt / Adjusted EBITDA (1) 0.1 0.1 0.1 0.1 0.3 0.5 0.6
Fixed Charge Coverage (2) 4.2 4.3 4.5 5.1 4.7 4.1 4.0
Balance Sheet Cash ($ 000) 24,318 21,031 40,349 93,687 5,424 4,489 2,616

10
Capitalization: Equity Issuance Summary
Equity Issuance Summary
ESP/ATM Program 2017
2012 2013 2014 2015 2016 Q1 Q2 Q3 Q4 YTD
Number of Shares (000s) 3,398 6,504 1,848 - 656 228 - 490 - 718
Average Price per Share 23.47$ 30.48$ 34.33$ -$ 31.10$ 31.12$ -$ 32.62$ -$ 32.14
Gross Proceeds (000s) 79,749$ 198,220$ 63,452$ -$ 20,392$ 7,079$ -$ 15,995$ -$ 23,074
DRSPP and Waiver Program 2017
2012 2013 2014 2015 YTD Q1 Q2 Q3 Q4 YTD
Number of Shares (000s) 5,062 1,930 2,083 4,184 7,215 239 375 343 - 957
Average Price per Share 22.11$ 28.94$ 34.32$ 36.06$ 33.27$ 30.67$ 33.02$ 30.39$ -$ 31.49
Gross Proceeds (000s) 111,941$ 55,872$ 71,502$ 150,871$ 240,041$ 7,335$ 12,386$ 10,415$ -$ 30,136
Secondary 2017
2012 2013 2014 2015 YTD Q1 Q2 Q3 Q4 YTD
Number of Shares (000s) - 2,875 - 10,925 - - - - - -
Average Price per Share -$ 29.48$ -$ 42.00$ -$ -$ -$ -$ -$ -
Gross Proceeds (000s) -$ 84,755$ -$ 458,850$ -$ -$ -$ -$ -$ -
Totals 2017
2012 2013 2014 2015 YTD Q1 Q2 Q3 Q4 YTD
Number of Shares (000s) 8,460 11,309 3,932 15,109 7,871 467 375 833 - 1,675
Average Price per Share 22.66$ 29.96$ 34.32$ 40.36$ 33.09$ 30.89$ 33.02$ 31.70$ -$ 31.77
Gross Proceeds (000s) 191,690$ 338,847$ 134,954$ 609,721$ 260,433$ 14,415$ 12,386$ 26,410$ -$ 53,210

11
Capitalization: Book and Market Capitalization with Ratios
Percentages of adjusted total debt to adjusted book capitalization and adjusted total debt to total market capitalization at Sep-
tember 30, 2017 were 54.4% and 41.6%, respectively. Adjusted total debt is total debt plus the discount or less the premium
derived from the sale of unsecured borrowings, deferred financing costs (net) and fair market value adjustment of assumed
debt. Adjusted book capitalization is defined as adjusted total debt plus stockholders' equity and noncontrolling interest. Ad-
justed total debt, adjusted book capitalization and related ratios are non-GAAP financial measures. Total market capitalization is
the total market value of our securities as of September 30, 2017 plus adjusted total debt.
At
September 30, 2017
Revolving line of credit.................................................................................... 365,000$
Term loans........................................................................................................ 908,980
Secured borrowings......................................................................................... 53,992
Unsecured borrowings..................................................................................... 3,371,500
FMV adjustment of assumption of debt ......................................................... 403
Premium/(discount) unsecured borrowings (net)........................................... (22,112)
Deferred financing costs (net).......................................................................... (33,235)
Total debt..................................................................................................... 4,644,528$
Deduct FMV adjustment of assumption of debt .......................................... (403)
Add back discount (deduct premium) on unsecured borrowings (net)........ 22,112
Add back deferred financing costs (net)........................................................ 33,235
Adjusted total debt...................................................................................... 4,699,472$
BOOK CAPITALIZATION....................................................................................
Adjusted total debt.......................................................................................... 4,699,472$
Omega stockholders' equity............................................................................ 3,606,828
Noncontrolling interest ................................................................................... 336,011
Adjusted book capitalization....................................................................... 8,642,311$
MARKET CAPITALIZATION...............................................................................
Omega common shares and OP units outstanding at 9/30/2017................... 206,837
Market price of common stock at 9/30/2017.................................................. 31.91$
Market capitalization of common stock at 9/30/2017................................ 6,600,169
Market capitalization of publicly traded securities........................................ 6,600,169
Add adjusted total debt................................................................................. 4,699,472
Total market capitalization.......................................................................... 11,299,641$
Adjusted total debt / adjusted book capitalization....................................... 54.4%
Adjusted total debt / total market capitalization.......................................... 41.6%
Unaudited
(In thousands)

12
Financial Performance: Historical AFFO, FAD and Dividends
NOTE: See the Non-GAAP reconciliations provided at the end of this supplement and on our website at www.omegahealthcare.com
under “Financial Information” then “Non-GAAP Financial Measures”
Revised 2017 Guidance: AFFO: $3.27—$3.28
FAD: $2.96—$2.97
Quarterly Annually
Quarter Ended
Ending
Share
Price
Div. *
Yield
AFFO/
Share Dividend
Payout
Ratio
FAD/
Share
FAD
Payout
Ratio
Omega AFFO
Guidance
AFFO/
Share
%
Change
FAD/
Share
%
Change
Annual
Dividend
%
Change
2007 3/31/2007 $17.15 6.1% 0.3375$ 0.27$ 80.0% 0.3111$ 86.8% $1.32 - $1.36
6/30/2007 $15.83 6.8% 0.3365$ 0.27 80.2% 0.3141$ 86.0%
9/30/2007 $15.53 7.0% 0.3528$ 0.28 80.0% 0.3299$ 84.9%
12/31/2007 $16.05 7.0% 0.3535$ 0.29 82.0% 0.3387$ 85.6% $1.38 11.3% $1.29 9.8% $1.11 13.3%
2008 3/31/2008 $17.36 6.7% 0.3639$ 0.30$ 82.4% 0.3612$ 83.1% $1.41 - $1.43
6/30/2008 $16.65 7.2% 0.3816$ 0.30 78.6% 0.3709$ 80.9%
9/30/2008 $19.66 6.1% 0.3387$ 0.30 88.6% 0.3079$ 97.4%
12/31/2008 $15.97 7.5% 0.3702$ 0.30 81.0% 0.3354$ 89.4% $1.45 5.4% $1.38 6.3% $1.20 8.1%
2009 3/31/2009 $14.08 8.5% 0.3701$ 0.30$ 81.1% 0.3550$ 84.5% $1.47 - $1.50
6/30/2009 $15.52 7.7% 0.3714$ 0.30 80.8% 0.3569$ 84.1%
9/30/2009 $16.02 7.5% 0.3657$ 0.30 82.0% 0.3529$ 85.0%
12/31/2009 $19.45 6.2% 0.3604$ 0.32 88.8% 0.3401$ 94.1% $1.47 0.9% $1.40 2.1% $1.22 1.7%
2010 3/31/2010 $19.49 6.6% 0.3766$ 0.32$ 85.0% 0.3704$ 86.4% $1.60 - $1.68
6/30/2010 $19.93 6.4% 0.3652$ 0.36 98.6% 0.3957$ 91.0%
9/30/2010 $22.45 6.4% 0.4531$ 0.37 81.7% 0.4218$ 87.7%
12/31/2010 $22.44 6.6% 0.4566$ 0.37 81.0% 0.4074$ 90.8% $1.65 12.5% $1.60 13.6% $1.42 16.4%
2011 3/31/2011 $22.34 6.6% 0.4432$ 0.38$ 85.7% 0.4009$ 94.8% $1.80 - $1.86
6/30/2011 $21.01 7.2% 0.4748$ 0.40 84.2% 0.4345$ 92.1%
9/30/2011 $15.93 10.0% 0.4769$ 0.40 83.9% 0.4392$ 91.1%
12/31/2011 $19.35 8.3% 0.4963$ 0.41 82.6% 0.4623$ 88.7% $1.89 14.5% $1.74 8.9% $1.59 12.0%
2012 3/31/2012 $21.26 7.7% 0.5469$ 0.42$ 76.8% 0.4738$ 88.6% $2.06 - $2.12
6/30/2012 $22.50 7.5% 0.5252$ 0.42 80.0% 0.4535$ 92.6%
9/30/2012 $22.73 7.4% 0.5353$ 0.44 82.2% 0.4702$ 93.6%
12/31/2012 $23.85 7.4% 0.5776$ 0.45 77.9% 0.5236$ 85.9% $2.18 15.3% $1.92 10.6% $1.73 8.8%
2013 3/31/2013 $30.36 5.9% 0.6313$ 0.46$ 72.9% 0.5739$ 80.2% $2.45 - $2.50
6/30/2013 $31.02 5.9% 0.6227$ 0.47 75.5% 0.5614$ 83.7%
9/30/2013 $29.87 6.3% 0.6260$ 0.48 76.7% 0.5682$ 84.5%
12/31/2013 $29.80 6.4% 0.6471$ 0.49 75.7% 0.5861$ 83.6% $2.53 15.9% $2.29 19.2% $1.90 9.8%
2014 3/31/2014 $33.52 5.8% 0.7112$ 0.50$ 70.3% 0.6506$ 76.9% $2.69 - $2.72
6/30/2014 $36.86 5.4% 0.6859$ 0.51 74.4% 0.6257$ 81.5%
9/30/2014 $34.19 6.0% 0.7320$ 0.52 71.0% 0.6690$ 77.7%
12/31/2014 $39.07 5.3% 0.7232$ 0.53 73.3% 0.6621$ 80.0% $2.85 12.9% $2.61 13.9% $2.06 8.4%
2015 3/31/2015 $40.57 5.2% 0.7084$ 0.54$ 76.2% 0.6492$ 83.2% $2.98 - $3.04
6/30/2015 $34.33 6.3% 0.7696$ 0.55 71.5% 0.7000$ 78.6%
9/30/2015 $35.15 6.3% 0.7913$ 0.56 70.8% 0.7168$ 78.1%
12/31/2015 $34.98 6.4% 0.8067$ 0.57 70.7% 0.7237$ 78.8% $3.08 7.8% $2.79 7.0% $2.22 7.8%
2016 3/31/2016 $35.30 6.5% 0.8336$ 0.58$ 69.6% 0.7488$ 77.5% $3.25 - $3.30
6/30/2016 $33.95 6.8% 0.8684$ 0.60 69.1% 0.7731$ 77.6%
9/30/2016 $35.45 6.8% 0.8327$ 0.61 73.3% 0.7477$ 81.6%
12/31/2016 $31.26 7.8% 0.8803$ 0.62 70.4% 0.7965$ 77.8% $3.42 11.0% $3.07 9.9% $2.41 8.6%
2017 3/31/2017 $32.99 7.5% 0.8569$ 0.63$ 73.5% 0.7730$ 81.5% $3.40 - $3.44
6/30/2017 $33.02 7.6% 0.8661$ 0.64 73.9% 0.7838$ 81.7%
9/30/2017 $31.91 8.0% 0.7918$ 0.65 82.1% 0.7285$ 89.2%
* Based on the annualized dividend announced the previous quarter
No. of consecutive quarterly dividends paid since 2003: 57
No. of quarterly dividend increases since 2003: 43
No. of consecutive quarterly dividend increases: 21

13
Financial Performance: 2017 Revised Guidance
2017 AFFO and FAD Guidance and Reconciliation
The Company has revised its 2017 annual Adjusted FFO available to common stockholders to be between $3.27 and $3.28 per diluted share and its 2017 FAD guidance to be between $2.96 and $2.97 per diluted share. The following table presents a rec-onciliation of Omega’s guidance regarding Adjusted FFO and FAD to projected GAAP earnings.
1. The Company's Adjusted FFO guidance for 2017 includes approximately $459 million of actual new investments com-pleted to date; however, it excludes the impact of potential additional new investments. It assumes the Company will not be recording revenue related to its Orianna portfolio for the fourth quarter of 2017. It also excludes the impact of gains and losses from the sale of assets, revenue from divestitures, certain revenue and expense items, interest refi-nancing expense, capital transactions, acquisition costs, and additional provision for uncollectible accounts. The Com-pany may, from time to time, update its publicly announced Adjusted FFO guidance, but it is not obligated to do so.
The Company's guidance is based on a number of assumptions, which are subject to change and many of which are out-side the Company’s control. If actual results vary from these assumptions, the Company's expectations may change. Without limiting the generality of the foregoing, the timing and completion of acquisitions, divestitures, capital and fi-nancing transactions, and variations in stock-based compensation expense may cause actual results to vary materially from our current expectations. There can be no assurance that the Company will achieve its projected results.
2017 Annual Adjusted FFO and FAD Guidance Range (1)
Note: All per share numbers rounded to two decimals.
Full Year
Net Income $0.62 - $0.63
Depreciation 1.37
Gain on assets sold (0.04)
Real estate impairment 0.17
FFO $2.12 - $2.13
Adjustments:
Provision for impairment on direct
financing leases 0.96
Provision for uncollectible accounts 0.07
Contractual settlement (0.05)
Transaction costs 0.00
Interest – refinancing costs 0.11
Other revenue (0.01)
Stock-based compensation expense 0.07
Adjusted FFO $3.27 - $3.28
Non-cash interest expense 0.05
Capitalized interest (0.04)
Non-cash revenue (0.32)
FAD $2.96 - $2.97

14
Financial Performance: Income Statements
Unaudited (in thousands, except per share amounts)
Revenue
Rental income .......................................................................... $194,063 $185,837 $580,597 $548,994
Income from direct financing leases .......................................... 614 15,611 31,722 46,574
Mortgage interest income ........................................................ 16,920 15,996 49,173 53,973
Other investment income – net ................................................ 7,245 6,229 21,437 14,642
Miscellaneous income .............................................................. 796 965 4,250 2,158
Total operating revenues .......................................................... 219,638 224,638 687,179 666,341
Expenses
Depreciation and amortization ................................................. 71,925 68,316 212,268 196,254
General and administrative ...................................................... 11,560 12,428 35,625 34,715
Acquisition costs ...................................................................... - 2,309 (22) 9,584
Impairment loss on real estate properties ................................. 17,837 17,275 35,610 58,726
Impairment on direct financing leases ...................................... 194,659 - 197,968 -
Provision for uncollectible accounts .......................................... 11,899 (3) 13,667 3,967
Total operating expenses ......................................................... 307,880 100,325 495,116 303,246
(Loss) income before other income and expense ...................... (88,242) 124,313 192,063 363,095
Other income (expense)
Interest income ........................................................................ 4 157 262 169
Interest expense ...................................................................... (47,383) (42,855) (140,509) (119,728)
Interest – amortization of deferred financing costs ................... (2,228) (2,502) (7,273) (6,844)
Interest – refinancing costs ....................................................... - (1,815) (21,965) (2,113)
Contractual settlement ............................................................. - - 10,412 -
Realized gain (loss) on foreign exchange ................................... 95 (222) 235 (244)
Total other expense ................................................................. (49,512) (47,237) (158,838) (128,760)
(Loss) income before gain on assets sold .................................. (137,754) 77,076 33,225 234,335
Gain on assets sold – net .......................................................... 693 5,139 7,491 19,931
(Loss) income from continuing operations ................................ (137,061) 82,215 40,716 254,266
Income taxes ........................................................................... (999) ? (81) (2,690) (782)
Income from unconsolidated joint venture ............................... 545 ? - 1,728 -
Net (loss) income ..................................................................... (137,515) 82,134 39,754 253,484
Net loss (income) attributable to noncontrolling interest .......... 5,837 (3,585) (1,735) (11,328)
Net (loss) income available to common stockholders ................ ($131,678) $78,549 $38,019 $242,156
Earnings per common share available to common stockholders:
Basic:
Net (loss) income available to common stockholders .............. (0.67) $0.40 $0.19 $1.27
Diluted:
Net (loss) income ................................................................... (0.67) $0.40 $0.19 $1.26
Dividends declared per common share ..................................... $0.64 $0.60 $1.89 $1.75
Weighted-average shares outstanding, basic ............................. 197,890 194,123 197,445 190,444
Weighted-average shares outstanding, diluted .......................... 206,662 204,078 206,502 200,528
2017 2016 2016
Three Months Ended Nine Months Ended
September 30, September 30,
2017

15
Financial Performance: Balance Sheets
Unaudited (in thousands)
September 30, December 31,
2017 2016
(Unaudited)
ASSETS
Real estate properties
Real estate investments ............................................... $ 7,977,043 $ 7,566,358
Less accumulated depreciation .................................... (1,432,154) (1,240,336)
Real estate investments – net .................................... 6,544,889 6,326,022
Investments in direct financing leases – net .................. 364,997 601,938
Mortgage notes receivable – net .................................. 666,606 639,343
7,576,492 7,567,303
Other investments – net ................................................... 273,821 256,846
Investment in unconsolidated joint venture ...................... 37,733 48,776
Assets held for sale – net .................................................. 17,324 52,868
Total investments ........................................................ 7,905,370 7,925,793
Cash and cash equivalents ................................................ 24,318 93,687
Restricted cash ................................................................ 10,596 13,589
Accounts receivable – net ................................................. 269,746 240,035
Goodwill .......................................................................... 644,571 643,474
Other assets ..................................................................... 36,045 32,682
Total assets ................................................................. $ 8,890,646 $ 8,949,260
LIABILITIES AND EQUITY
Revolving line of credit ...................................................... $ 365,000 $ 190,000
Term loans – net .............................................................. 903,221 1,094,343
Secured borrowings – net ................................................. 53,419 54,365
Unsecured borrowings – net ............................................. 3,322,888 3,028,146
Accrued expenses and other liabilities ............................... 285,690 360,514
Deferred income taxes ..................................................... 17,589 9,906
Total liabilities ............................................................. 4,947,807 4,737,274
Equity:
Common stock $.10 par value authorized – 350,000
shares, issued and outstanding – 198,065 shares as of
September 30, 2017 and 196,142 as of December 31, 2016 19,806 19,614
Common stock – additional paid-in capital ........................ 4,925,908 4,861,408
Cumulative net earnings ................................................... 1,776,956 1,738,937
Cumulative dividends paid ................................................ (3,080,999) (2,707,387)
Accumulated other comprehensive loss ............................ (34,843) (53,827)
Total stockholders’ equity ........................................... 3,606,828 3,858,745
Noncontrolling interest ..................................................... 336,011 353,241
Total equity ................................................................. 3,942,839 4,211,986
Total liabilities and equity ............................................ $ 8,890,646 $ 8,949,260
16
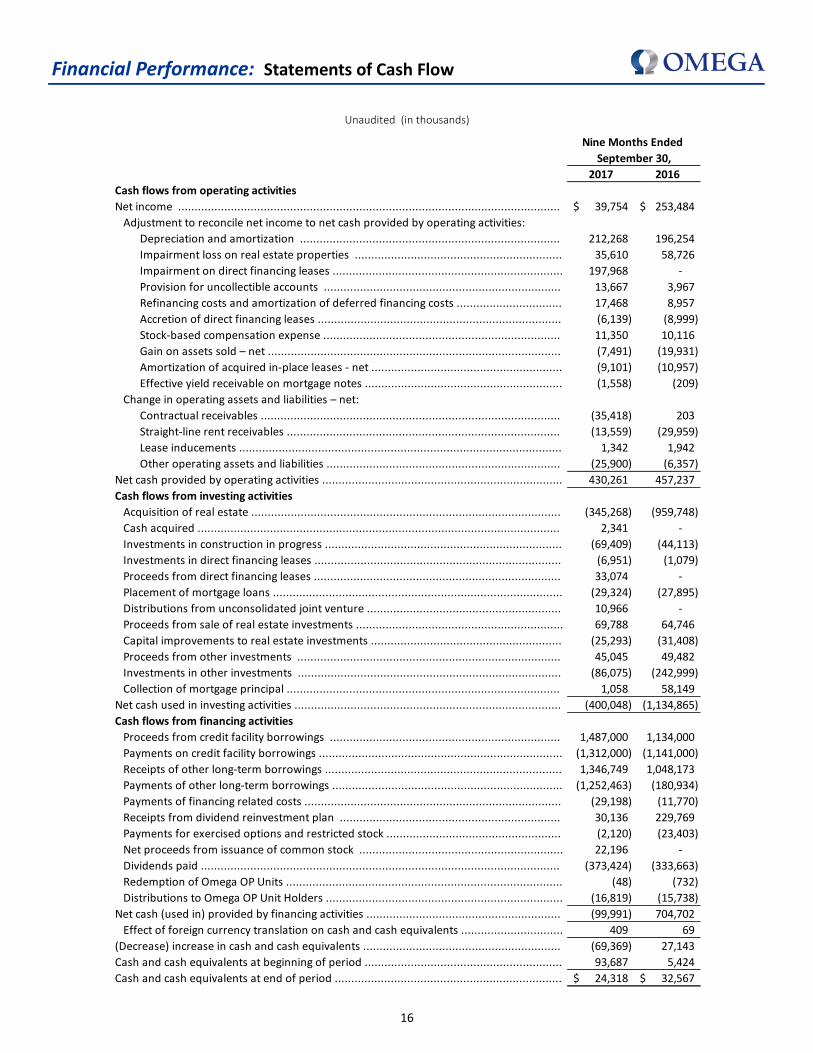
Financial Performance: Statements of Cash Flow
Unaudited (in thousands)
Nine Months Ended
September 30,
2017 2016
Cash flows from operating activities
Net income .................................................................................................................... 39,754$ 253,484$
Adjustment to reconcile net income to net cash provided by operating activities:
Depreciation and amortization ............................................................................... 212,268 196,254
Impairment loss on real estate properties ............................................................... 35,610 58,726
Impairment on direct financing leases ...................................................................... 197,968 -
Provision for uncollectible accounts ........................................................................ 13,667 3,967
Refinancing costs and amortization of deferred financing costs ................................ 17,468 8,957
Accretion of direct financing leases .......................................................................... (6,139) (8,999)
Stock-based compensation expense ........................................................................ 11,350 10,116
Gain on assets sold – net ......................................................................................... (7,491) (19,931)
Amortization of acquired in-place leases - net .......................................................... (9,101) (10,957)
Effective yield receivable on mortgage notes ............................................................ (1,558) (209)
Change in operating assets and liabilities – net:
Contractual receivables ........................................................................................... (35,418) 203
Straight-line rent receivables ................................................................................... (13,559) (29,959)
Lease inducements .................................................................................................. 1,342 1,942
Other operating assets and liabilities ....................................................................... (25,900) (6,357)
Net cash provided by operating activities ......................................................................... 430,261 457,237
Cash flows from investing activities
Acquisition of real estate .............................................................................................. (345,268) (959,748)
Cash acquired .............................................................................................................. 2,341 -
Investments in construction in progress ........................................................................ (69,409) (44,113)
Investments in direct financing leases ........................................................................... (6,951) (1,079)
Proceeds from direct financing leases ........................................................................... 33,074 -
Placement of mortgage loans ........................................................................................ (29,324) (27,895)
Distributions from unconsolidated joint venture ........................................................... 10,966 -
Proceeds from sale of real estate investments ............................................................... 69,788 64,746
Capital improvements to real estate investments .......................................................... (25,293) (31,408)
Proceeds from other investments ................................................................................ 45,045 49,482
Investments in other investments ................................................................................ (86,075) (242,999)
Collection of mortgage principal ................................................................................... 1,058 58,149
Net cash used in investing activities ................................................................................. (400,048) (1,134,865)
Cash flows from financing activities
Proceeds from credit facility borrowings ...................................................................... 1,487,000 1,134,000
Payments on credit facility borrowings .......................................................................... (1,312,000) (1,141,000)
Receipts of other long-term borrowings ........................................................................ 1,346,749 1,048,173
Payments of other long-term borrowings ...................................................................... (1,252,463) (180,934)
Payments of financing related costs .............................................................................. (29,198) (11,770)
Receipts from dividend reinvestment plan ................................................................... 30,136 229,769
Payments for exercised options and restricted stock ..................................................... (2,120) (23,403)
Net proceeds from issuance of common stock .............................................................. 22,196 -
Dividends paid ............................................................................................................. (373,424) (333,663)
Redemption of Omega OP Units .................................................................................... (48) (732)
Distributions to Omega OP Unit Holders ........................................................................ (16,819) (15,738)
Net cash (used in) provided by financing activities ........................................................... (99,991) 704,702
Effect of foreign currency translation on cash and cash equivalents ............................... 409 69
(Decrease) increase in cash and cash equivalents ............................................................ (69,369) 27,143
Cash and cash equivalents at beginning of period ............................................................ 93,687 5,424
Cash and cash equivalents at end of period ..................................................................... 24,318$ 32,567$

17
Financial Performance: Non-GAAP Reconciliations
Net Income, FFO, Adjusted FFO and FAD
(unaudited)
(in thousands, except per share data)
Three Months Ended Nine Months Ended
September 30, September 30,
2017 2016 2017 2016
Net (loss) income .................................................................................................... $ (137,515) $ 82,134 $ 39,754 $ 253,484
Deduct gain from real estate dispositions.............................................................. (693) (5,139) (7,491) (19,931)
Sub – total ...................................................................................................... (138,208) 76,995 32,263 233,553
Elimination of non-cash items included in net income:
Depreciation and amortization ........................................................................ 71,925 68,316 212,268 196,254
Depreciation - unconsolidated joint venture .................................................... 1,657 - 4,973 -
Add back non-cash provision for impairments on real estate properties............ 17,837 17,275 35,610 58,726
Funds from operations (“FFO”) ............................................................................... $ (46,789) $ 162,586 $ 285,114 $ 488,533
Weighted-average common shares outstanding, basic ............................................. 197,890 194,123 197,445 190,444
Restricted stock and PRSUs ................................................................................... - 1,093 271 1,174
Omega OP Units ................................................................................................... 8,772 8,862 8,786 8,910
Weighted-average common shares outstanding, diluted .......................................... 206,662 204,078 206,502 200,528
Funds from operations available per share ............................................................. $ (0.24) $ 0.80 $ 1.38 $ 2.44
Adjustments to calculate adjusted funds from operations:......................................
Funds from operations.......................................................................................... $ (46,789) $ 162,586 $ 285,114 $ 488,533
Deduct other revenue .......................................................................................... - (448) (1,881) (683)
Deduct prepayment fee income from early termination of mortgages ................... - - - (5,390)
Deduct contractual settlement .............................................................................. - - (10,412) -
Add back impairment for direct financing leases ................................................... 194,659 - 197,968 -
Add back (deduct) provision for uncollectible accounts ......................................... 11,899 (3) 13,667 3,967
Add back (deduct) acquisition costs ...................................................................... - 2,309 (22) 9,584
Add back interest refinancing expense .................................................................. - 1,815 23,539 2,113
Add back non-cash stock-based compensation expense ........................................ 3,872 3,673 11,350 10,116
Adjusted funds from operations (“AFFO”) .............................................................. $ 163,641 $ 169,932 $ 519,323 $ 508,240
Adjustments to calculate funds available for distribution:........................................
Non-cash interest expense ................................................................................... 2,200 2,555 7,861 6,834
Capitalized interest .............................................................................................. (1,972) (1,640) (5,867) (4,765)
Non-cash revenues .............................................................................................. (13,314) (18,251) (49,399) (55,226)
Funds available for distribution (“FAD”) .................................................................. $ 150,555 $ 152,596 $ 471,918 $ 455,083

18
Financial Performance: Non-GAAP Reconciliations
Funds From Operations (“FFO”), Adjusted FFO and Funds Available for Distribution (“FAD”) are non-GAAP financial measures. For purposes of the Securities and Exchange Commission’s Regulation G, a non-GAAP financial measure is a numerical meas-ure of a company’s historical or future financial performance, financial position or cash flows that exclude amounts, or is sub-ject to adjustments that have the effect of excluding amounts, that are included in the most directly comparable financial measure calculated and presented in accordance with GAAP in the statement of operations, balance sheet or statement of cash flows (or equivalent statements) of the company, or include amounts, or is subject to adjustments that have the effect of including amounts, that are excluded from the most directly comparable financial measure so calculated and presented. As used in this press release, GAAP refers to generally accepted accounting principles in the United States of America. Pursuant to the requirements of Regulation G, the Company has provided reconciliations of the non-GAAP financial measures to the most directly comparable GAAP financial measures.
The Company calculates and reports FFO in accordance with the definition and interpretive guidelines issued by the National Association of Real Estate Investment Trusts ("NAREIT"), and consequently, FFO is defined as net income (computed in ac-cordance with GAAP), adjusted for the effects of asset dispositions and certain non-cash items, primarily depreciation and amortization and impairments on real estate assets, and after adjustments for unconsolidated partnerships and joint ven-tures. Adjustments for unconsolidated partnerships and joint ventures will be calculated to reflect funds from operations on the same basis. The Company believes that FFO, Adjusted FFO and FAD are important supplemental measures of its oper-ating performance. Because the historical cost accounting convention used for real estate assets requires depreciation (except on land), such accounting presentation implies that the value of real estate assets diminishes predictably over time, while real estate values instead have historically risen or fallen with market conditions. The term FFO was designed by the real estate industry to address this issue. FFO described herein is not necessarily comparable to FFO of other real estate in-vestment trusts, or REITs, that do not use the same definition or implementation guidelines or interpret the standards differ-ently from the Company.
Adjusted FFO is calculated as FFO excluding the impact of non-cash stock-based compensation and certain revenue and ex-pense items identified above. FAD is calculated as Adjusted FFO less non-cash interest expense and non-cash revenue, such as straight-line rent. The Company believes these measures provide an enhanced measure of the operating performance of the Company’s core portfolio as a REIT. The Company’s computation of Adjusted FFO and FAD are not comparable to the NAREIT definition of FFO or to similar measures reported by other REITs, but the Company believes that they are appropriate measures for this Company.
The Company uses these non-GAAP measures among the criteria to measure the operating performance of its business. The Company also uses Adjusted FFO among the performance metrics for performance-based compensation of officers. The Com-pany further believes that by excluding the effect of depreciation, amortization, impairments on real estate assets and gains or losses from sales of real estate, all of which are based on historical costs and which may be of limited relevance in evalu-ating current performance, FFO can facilitate comparisons of operating performance between periods and between other REITs. The Company offers these measures to assist the users of its financial statements in analyzing its operating perfor-mance and not as measures of liquidity or cash flow. These non-GAAP measures are not measures of financial performance under GAAP and should not be considered as measures of liquidity, alternatives to net income or indicators of any other per-formance measure determined in accordance with GAAP. Investors and potential investors in the Company’s securities should not rely on these non-GAAP measures as substitutes for any GAAP measure, including net income.
For information regarding Adjusted Total Debt and Adjusted Book Capitalization, see the “Capitalization: Book and Market Capitalization with Ratios” section of this supplement.
19
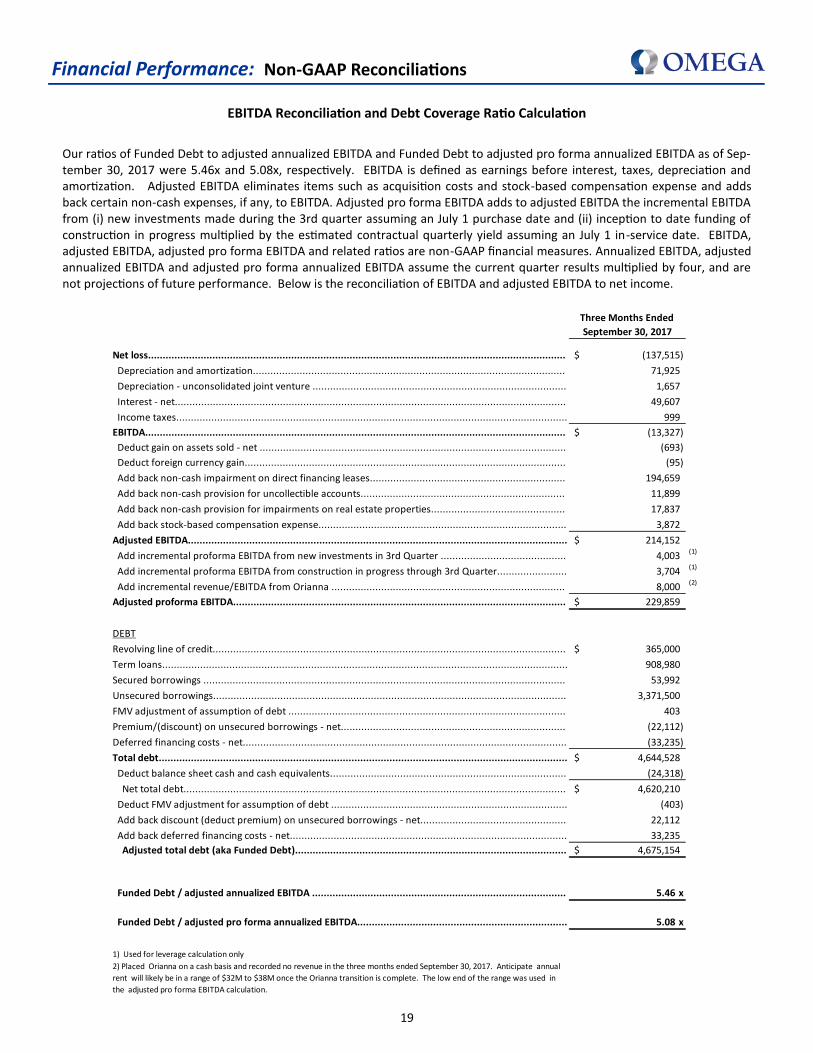
Our ratios of Funded Debt to adjusted annualized EBITDA and Funded Debt to adjusted pro forma annualized EBITDA as of Sep-tember 30, 2017 were 5.46x and 5.08x, respectively. EBITDA is defined as earnings before interest, taxes, depreciation and amortization. Adjusted EBITDA eliminates items such as acquisition costs and stock-based compensation expense and adds back certain non-cash expenses, if any, to EBITDA. Adjusted pro forma EBITDA adds to adjusted EBITDA the incremental EBITDA from (i) new investments made during the 3rd quarter assuming an July 1 purchase date and (ii) inception to date funding of construction in progress multiplied by the estimated contractual quarterly yield assuming an July 1 in-service date. EBITDA, adjusted EBITDA, adjusted pro forma EBITDA and related ratios are non-GAAP financial measures. Annualized EBITDA, adjusted annualized EBITDA and adjusted pro forma annualized EBITDA assume the current quarter results multiplied by four, and are not projections of future performance. Below is the reconciliation of EBITDA and adjusted EBITDA to net income.
Financial Performance: Non-GAAP Reconciliations
EBITDA Reconciliation and Debt Coverage Ratio Calculation
Three Months Ended
September 30, 2017
Net loss............................................................................................................................................... (137,515)$
Depreciation and amortization........................................................................................................... 71,925
Depreciation - unconsolidated joint venture ....................................................................................... 1,657
Interest - net...................................................................................................................................... 49,607
Income taxes...................................................................................................................................... 999
EBITDA................................................................................................................................................ (13,327)$
Deduct gain on assets sold - net ......................................................................................................... (693)
Deduct foreign currency gain.............................................................................................................. (95)
Add back non-cash impairment on direct financing leases................................................................... 194,659
Add back non-cash provision for uncollectible accounts...................................................................... 11,899
Add back non-cash provision for impairments on real estate properties.............................................. 17,837
Add back stock-based compensation expense..................................................................................... 3,872
Adjusted EBITDA.................................................................................................................................. 214,152$
Add incremental proforma EBITDA from new investments in 3rd Quarter ........................................... 4,003 (1)
Add incremental proforma EBITDA from construction in progress through 3rd Quarter........................ 3,704 (1)
Add incremental revenue/EBITDA from Orianna ................................................................................ 8,000 (2)
Adjusted proforma EBITDA.................................................................................................................. 229,859$
DEBT
Revolving line of credit......................................................................................................................... 365,000$
Term loans........................................................................................................................................... 908,980
Secured borrowings ............................................................................................................................ 53,992
Unsecured borrowings......................................................................................................................... 3,371,500
FMV adjustment of assumption of debt ............................................................................................... 403
Premium/(discount) on unsecured borrowings - net............................................................................. (22,112)
Deferred financing costs - net............................................................................................................... (33,235)
Total debt............................................................................................................................................ 4,644,528$
Deduct balance sheet cash and cash equivalents................................................................................. (24,318)
Net total debt................................................................................................................................... 4,620,210$
Deduct FMV adjustment for assumption of debt ................................................................................. (403)
Add back discount (deduct premium) on unsecured borrowings - net.................................................. 22,112
Add back deferred financing costs - net............................................................................................... 33,235
Adjusted total debt (aka Funded Debt)............................................................................................. 4,675,154$
Funded Debt / adjusted annualized EBITDA ....................................................................................... 5.46 x
Funded Debt / adjusted pro forma annualized EBITDA........................................................................ 5.08 x
1) Used for leverage calculation only
2) Placed Orianna on a cash basis and recorded no revenue in the three months ended September 30, 2017. Anticipate annual
rent will likely be in a range of $32M to $38M once the Orianna transition is complete. The low end of the range was used in
the adjusted pro forma EBITDA calculation.
20
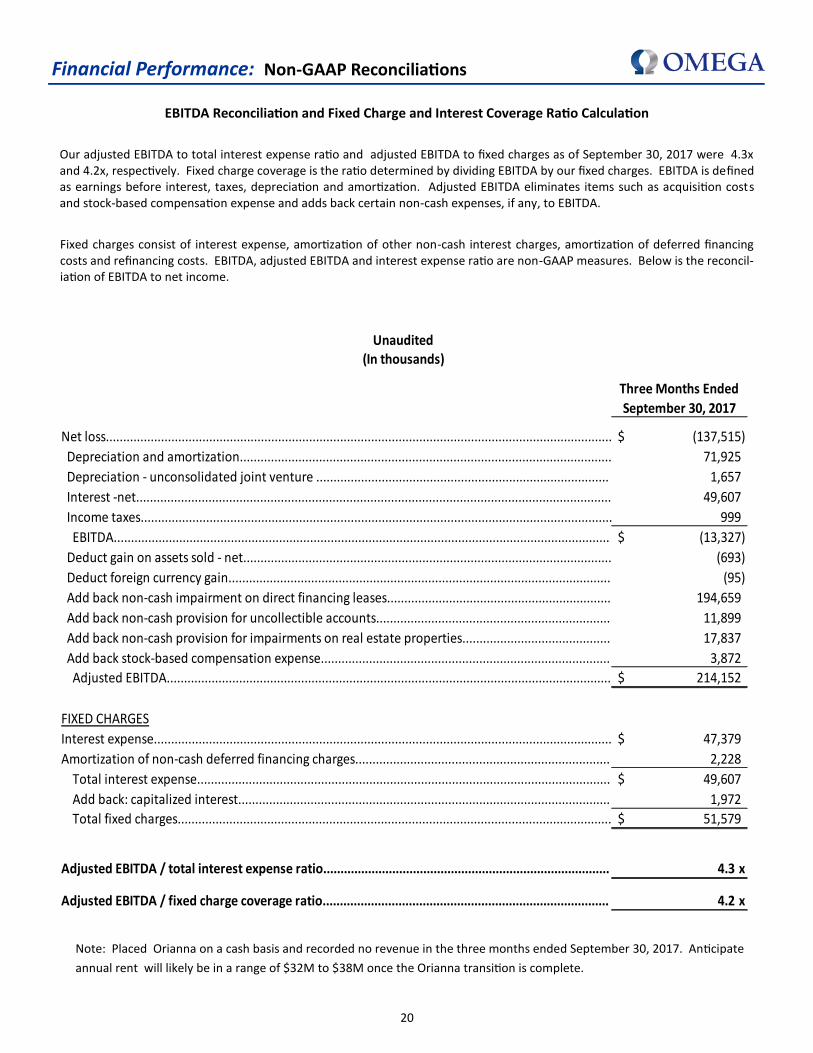
Financial Performance: Non-GAAP Reconciliations
EBITDA Reconciliation and Fixed Charge and Interest Coverage Ratio Calculation
Our adjusted EBITDA to total interest expense ratio and adjusted EBITDA to fixed charges as of September 30, 2017 were 4.3x and 4.2x, respectively. Fixed charge coverage is the ratio determined by dividing EBITDA by our fixed charges. EBITDA is defined as earnings before interest, taxes, depreciation and amortization. Adjusted EBITDA eliminates items such as acquisition costs and stock-based compensation expense and adds back certain non-cash expenses, if any, to EBITDA.
Fixed charges consist of interest expense, amortization of other non-cash interest charges, amortization of deferred financing costs and refinancing costs. EBITDA, adjusted EBITDA and interest expense ratio are non-GAAP measures. Below is the reconcil-iation of EBITDA to net income.
Three Months Ended
September 30, 2017
Net loss................................................................................................................................................... (137,515)$
Depreciation and amortization............................................................................................................ 71,925
Depreciation - unconsolidated joint venture ..................................................................................... 1,657
Interest -net.......................................................................................................................................... 49,607
Income taxes......................................................................................................................................... 999
EBITDA................................................................................................................................................ (13,327)$
Deduct gain on assets sold - net........................................................................................................... (693)
Deduct foreign currency gain............................................................................................................... (95)
Add back non-cash impairment on direct financing leases................................................................. 194,659
Add back non-cash provision for uncollectible accounts.................................................................... 11,899
Add back non-cash provision for impairments on real estate properties........................................... 17,837
Add back stock-based compensation expense.................................................................................... 3,872
Adjusted EBITDA................................................................................................................................. 214,152$
FIXED CHARGES
Interest expense..................................................................................................................................... 47,379$
Amortization of non-cash deferred financing charges.......................................................................... 2,228
Total interest expense........................................................................................................................ 49,607$
Add back: capitalized interest............................................................................................................ 1,972
Total fixed charges.............................................................................................................................. 51,579$
Adjusted EBITDA / total interest expense ratio................................................................................... 4.3 x
Adjusted EBITDA / fixed charge coverage ratio................................................................................... 4.2 x
Unaudited(In thousands)
Note: Placed Orianna on a cash basis and recorded no revenue in the three months ended September 30, 2017. Anticipate
annual rent will likely be in a range of $32M to $38M once the Orianna transition is complete.

21
Selected Definitions
Portfolio Metrics
EBITDARM Coverage: Represents EBITDARM of our operators, defined as earnings before interest, taxes, depreciation, amorti-zation, Rent expense and management fees for the applicable period, divided by the total Rent paid to the Company by its operators during such period.
EBITDAR Coverage: Represents EBITDAR of our operators, defined as earnings before interest, taxes, depreciation, amortiza-tion, and Rent expense for the applicable period, divided by the total Rent paid to the Company by its operators during such period. Assumes a management fee of 4%.
Portfolio Occupancy: Represents the average daily number of beds at the Company’s properties that are occupied during the applicable period divided by the total number of total operating beds at the Company’s properties that are available for use during the applicable period.
Property Type: ALF = assisted living facility; SNF = skilled nursing facility
Portfolio metrics and other statistics are not derived from Omega’s financial statements but are operating statistics that the Company derives from reports that it receives from its operators pursuant to Omega’s triple-net leases and mortgages. As a result, the Company’s portfolio metrics typically lag its own financial statements by approximately one quarter. Portfolio met-rics exclude assets held for sale, closed properties, properties under construction and, with certain exceptions for shorter peri-ods, properties within 24 months of completion of construction.
Rent: Refers to the total monthly rent and mortgage interest due under all of the Company’s lease and mortgage agreements as of the date specified, calculated based on the first full month following the specified date. Omega calculates “annualized rent” for properties during a period by utilizing the amount of rent under contract as of the last day of the period and assumes that amount of rent was received in respect of such property throughout the entire period.
Non-GAAP Financial Measures
FFO: Funds from Operations (FFO), is defined as net income (computed in accordance with GAAP), adjusted for the effects of asset dispositions and certain non-cash items, primarily depreciation and amortization and impairments on real estate assets, and after adjustments for unconsolidated partnerships and joint ventures.
AFFO: Adjusted FFO (AFFO) is calculated as FFO excluding the impact of non-cash stock-based compensation and certain reve-nue and expense items identified above.
FAD: Funds Available for Distribution (FAD) is calculated as AFFO less non-cash interest expense and non-cash revenue, such as straight-line rent.
A further discussion of the Non-GAAP Financial Measures defined above is provided on page 18 of this supplement.


![MARCH 2016 [FY2015] Q3 FINANCIAL RESULT SUMMARY · MARCH 2016 [FY2015] Q3 FINANCIAL RESULT SUMMARY February 2016 1) Summary of Result and Forecast (Unit: Billion Yen) Q1 Q2 Q3 Total](https://static.fdocuments.in/doc/165x107/5fcc43cdfc3b99546a3a9ae2/march-2016-fy2015-q3-financial-result-summary-march-2016-fy2015-q3-financial.jpg)