Summary Financial Information Ratio Analysis Supplemental Ratios
20
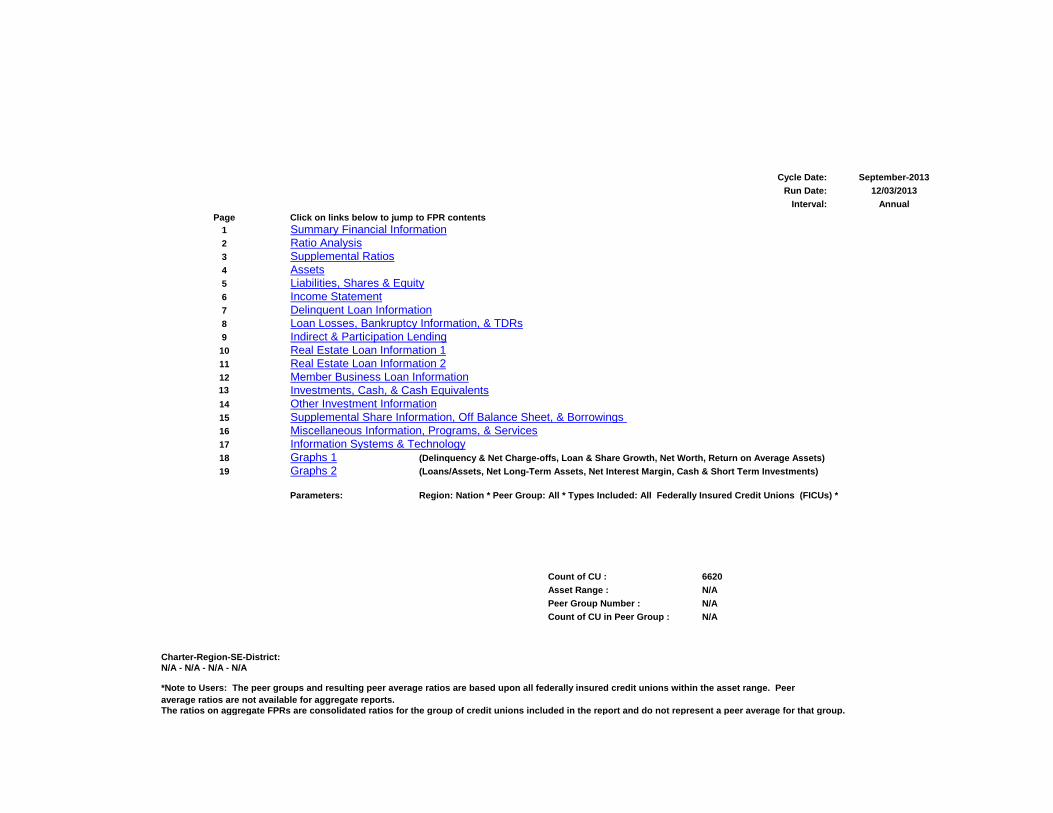
Cycle Date: September-2013 Run Date: 12/03/2013 Interval: Annual Page Click on links below to jump to FPR contents 1 Summary Financial Information 2 Ratio Analysis 3 Supplemental Ratios 4 Assets 5 Liabilities, Shares & Equity 6 Income Statement 7 Delinquent Loan Information 8 Loan Losses, Bankruptcy Information, & TDRs 9 Indirect & Participation Lending 10 Real Estate Loan Information 1 11 Real Estate Loan Information 2 12 Member Business Loan Information 13 Investments, Cash, & Cash Equivalents 14 Other Investment Information 15 Supplemental Share Information, Off Balance Sheet, & Borrowings 16 Miscellaneous Information, Programs, & Services 17 Information Systems & Technology 18 Graphs 1 (Delinquency & Net Charge-offs, Loan & Share Growth, Net Worth, Return on Average Assets) 19 Graphs 2 (Loans/Assets, Net Long-Term Assets, Net Interest Margin, Cash & Short Term Investments) Parameters: Count of CU : 6620 Asset Range : N/A Peer Group Number : N/A Count of CU in Peer Group : N/A Charter-Region-SE-District: N/A - N/A - N/A - N/A The ratios on aggregate FPRs are consolidated ratios for the group of credit unions included in the report and do not represent a peer average for that group. *Note to Users: The peer groups and resulting peer average ratios are based upon all federally insured credit unions within the asset range. Peer average ratios are not available for aggregate reports. Region: Nation * Peer Group: All * Types Included: All Federally Insured Credit Unions (FICUs) *
Transcript of Summary Financial Information Ratio Analysis Supplemental Ratios
Cycle Date: September-2013Run Date: 12/03/2013
Interval: AnnualPage Click on links below to jump to FPR contents
1 Summary Financial Information2 Ratio Analysis3 Supplemental Ratios4 Assets5 Liabilities, Shares & Equity6 Income Statement7 Delinquent Loan Information8 Loan Losses, Bankruptcy Information, & TDRs9 Indirect & Participation Lending
10 Real Estate Loan Information 111 Real Estate Loan Information 212 Member Business Loan Information13 Investments, Cash, & Cash Equivalents14 Other Investment Information15 Supplemental Share Information, Off Balance Sheet, & Borrowings 16 Miscellaneous Information, Programs, & Services17 Information Systems & Technology18 Graphs 1 (Delinquency & Net Charge-offs, Loan & Share Growth, Net Worth, Return on Average Assets)19 Graphs 2 (Loans/Assets, Net Long-Term Assets, Net Interest Margin, Cash & Short Term Investments)
Parameters:
Count of CU : 6620Asset Range : N/APeer Group Number : N/ACount of CU in Peer Group : N/A
Charter-Region-SE-District:N/A - N/A - N/A - N/A
The ratios on aggregate FPRs are consolidated ratios for the group of credit unions included in the report and do not represent a peer average for that group.
*Note to Users: The peer groups and resulting peer average ratios are based upon all federally insured credit unions within the asset range. Peer average ratios are not available for aggregate reports.
Region: Nation * Peer Group: All * Types Included: All Federally Insured Credit Unions (FICUs) *

Summary Financial InformationReturn to cover For Charter : N/A12/03/2013 Count of CU : 6620CU Name: N/A Asset Range : N/APeer Group: N/A Criteria :
N/A
Dec-2009 Dec-2010 % Chg Dec-2011 % Chg Dec-2012 % Chg Sep-2013 % ChgASSETS: Amount Amount Amount Amount Amount Cash & Equivalents 67,567,260,969 74,427,858,469 10.2 95,188,196,736 27.9 100,926,480,967 6.0 86,756,176,605 -14.0TOTAL INVESTMENTS 210,751,233,708 238,918,886,902 13.4 256,887,481,728 7.5 280,433,152,473 9.2 293,522,591,418 4.7 Loans Held for Sale 2,264,461,472 3,212,162,789 41.9 3,304,422,035 2.9 5,144,710,451 55.7 2,903,443,674 -43.6
Real Estate Loans 309,645,220,594 309,644,164,401 0.0 313,044,279,755 1.1 320,188,764,394 2.3 333,131,513,736 4.0 Unsecured Loans 60,407,162,577 61,428,297,763 1.7 64,442,938,970 4.9 68,394,884,606 6.1 71,476,304,166 4.5 Other Loans 202,390,934,927 193,635,184,820 -4.3 194,007,266,593 0.2 208,938,222,380 7.7 226,883,410,612 8.6 TOTAL LOANS 572,443,318,098 564,707,646,984 -1.4 571,494,485,318 1.2 597,521,871,380 4.6 631,491,228,514 5.7 (Allowance for Loan & Lease Losses) (8,847,960,252) (9,424,079,292) 6.5 (8,856,255,275) -6.0 (8,102,848,056) -8.5 (7,529,859,117) -7.1 Land And Building 16,146,829,848 16,778,850,022 3.9 17,211,295,011 2.6 17,660,702,048 2.6 18,040,032,678 2.1 Other Fixed Assets 3,549,370,569 3,354,194,527 -5.5 3,366,283,300 0.4 3,462,758,425 2.9 3,534,284,641 2.1 NCUSIF Deposit 7,035,680,285 7,469,341,871 6.2 7,784,935,164 4.2 8,295,737,945 6.6 8,423,621,556 1.5 All Other Assets 13,697,687,037 14,895,810,131 8.7 15,327,718,322 2.9 16,434,648,474 7.2 19,455,041,306 18.4 TOTAL ASSETS 884,607,881,734 914,340,672,403 3.4 961,708,562,339 5.2 1,021,777,214,107 6.2 1,056,596,561,275 3.4LIABILITIES & CAPITAL: Dividends Payable 495,869,040 372,974,645 -24.8 318,763,345 -14.5 267,491,202 -16.1 204,278,985 -23.6 Notes & Interest Payable 37,458,132,908 28,640,440,070 -23.5 26,261,683,940 -8.3 26,730,516,302 1.8 29,852,397,920 11.7 Accounts Payable & Other Liabilities 7,274,615,674 7,702,034,583 5.9 9,511,126,374 23.5 10,190,400,410 7.1 11,258,300,436 10.5Uninsured Secondary Capital and Subordinated Debt Included in Net Worth3 79,042,300 156,160,823 97.6 247,667,157 58.6 244,805,956 -1.2 243,566,961 -0.5 TOTAL LIABILITIES 45,307,659,922 36,871,610,121 -18.6 36,339,240,816 -1.4 37,433,213,870 3.0 41,558,544,302 11.0 Share Drafts 85,302,112,139 89,875,101,057 5.4 100,639,232,062 12.0 111,419,299,483 10.7 117,011,458,884 5.0 Regular shares 199,909,175,627 220,522,133,570 10.3 244,974,948,723 11.1 275,294,889,865 12.4 295,405,090,194 7.3 All Other Shares & Deposits 467,460,021,411 476,006,515,385 1.8 481,795,508,076 1.2 491,189,834,529 1.9 493,499,542,451 0.5 TOTAL SHARES & DEPOSITS 752,671,309,177 786,403,750,012 4.5 827,409,688,861 5.2 877,904,023,877 6.1 905,916,091,529 3.2 Regular Reserve 18,890,171,722 19,114,305,383 1.2 19,152,150,828 0.2 19,268,875,831 0.6 19,362,725,173 0.5 Other Reserves 8,209,806,206 9,230,527,976 12.4 11,412,707,658 23.6 13,027,101,595 14.1 10,781,813,739 -17.2 Undivided Earnings 59,528,934,707 62,720,478,911 5.4 67,394,774,176 7.5 74,143,998,934 10.0 78,977,386,532 6.5 TOTAL EQUITY 86,628,912,635 91,065,312,270 5.1 97,959,632,662 7.6 106,439,976,360 8.7 109,121,925,444 2.5 TOTAL LIABILITIES, SHARES, & EQUITY 884,607,881,734 914,340,672,403 3.4 961,708,562,339 5.2 1,021,777,214,107 6.2 1,056,596,561,275 3.4INCOME & EXPENSE Loan Income* 35,740,883,981 34,463,412,787 -3.6 32,710,330,527 -5.1 31,666,233,248 -3.2 23,258,009,648 -2.1 Investment Income* 6,263,461,937 5,626,462,157 -10.2 5,226,594,536 -7.1 4,545,233,074 -13.0 3,086,202,703 -9.5 Other Income* 11,499,753,018 11,965,723,458 4.1 12,156,853,178 1.6 14,201,236,234 16.8 10,764,229,711 1.1 Total Employee Compensation & Benefits* 13,686,961,519 13,993,195,406 2.2 14,485,361,135 3.5 15,505,197,646 7.0 12,096,733,101 4.0 Temporary Corporate CU Stabilization Expense & NCUSIF Premiums*/2 3,079,129,333 1,974,534,096 -35.9 1,893,655,127 -4.1 779,742,413 -58.8 648,889,910 11.0 Total Other Operating Expenses* 13,313,626,439 13,624,916,287 2.3 14,202,923,154 4.2 15,279,614,995 7.6 11,776,788,745 2.8 Non-operating Income & (Expense)* -996,744,297 -2,608,786 99.7 125,566,273 4,913.2 429,613,166 242.1 283,641,134 -12.0 NCUSIF Stabilization Income* 3,404,721,277 1,011,452 -100.0 0 -100.0 0 N/A 0 N/A Provision for Loan/Lease Losses* 9,556,354,653 7,038,623,190 -26.3 4,675,763,620 -33.6 3,576,580,300 -23.5 2,029,802,821 -24.3 Cost of Funds* 14,790,180,714 10,886,013,648 -26.4 8,687,455,958 -20.2 7,235,753,820 -16.7 4,616,944,217 -14.9NET INCOME (LOSS) EXCLUDING STABILIZATION EXPENSE & NCUSIF PREMIUM */1 4,564,952,591 6,510,241,085 42.6 8,167,840,647 25.5 9,245,168,961 13.2 6,871,814,312 -0.9 Net Income (Loss)* 1,485,823,258 4,536,718,441 205.3 6,274,185,520 38.3 8,465,426,548 34.9 6,222,924,402 -2.0TOTAL CU's 7,554 7,339 -2.8 7,094 -3.3 6,819 -3.9 6,620 -2.9* Income/Expense items are year-to-date while the related %change ratios are annualized.# Means the number is too large to display in the cell
3 December 2011 and forward includes "Subordinated Debt Included in Net Worth." 1. Summary Financial
Count of CU in Peer Group :Region: Nation * Peer Group: All * Types Included: All Federally Insured Credit Unions (FICUs) *
1 Prior to September 2010, this account was named Net Income (Loss) Before NCUSIF Stabilization Expense. From December 2010 forward, NCUSIF Stabilization Income, if any, is excluded.2 Prior to September 2010, this account was named NCUSIF Stabilization Expense. For December 2010 and forward, this account includes Temporary Corporate CU Stabilization Expense and NCUSIF Premiums.
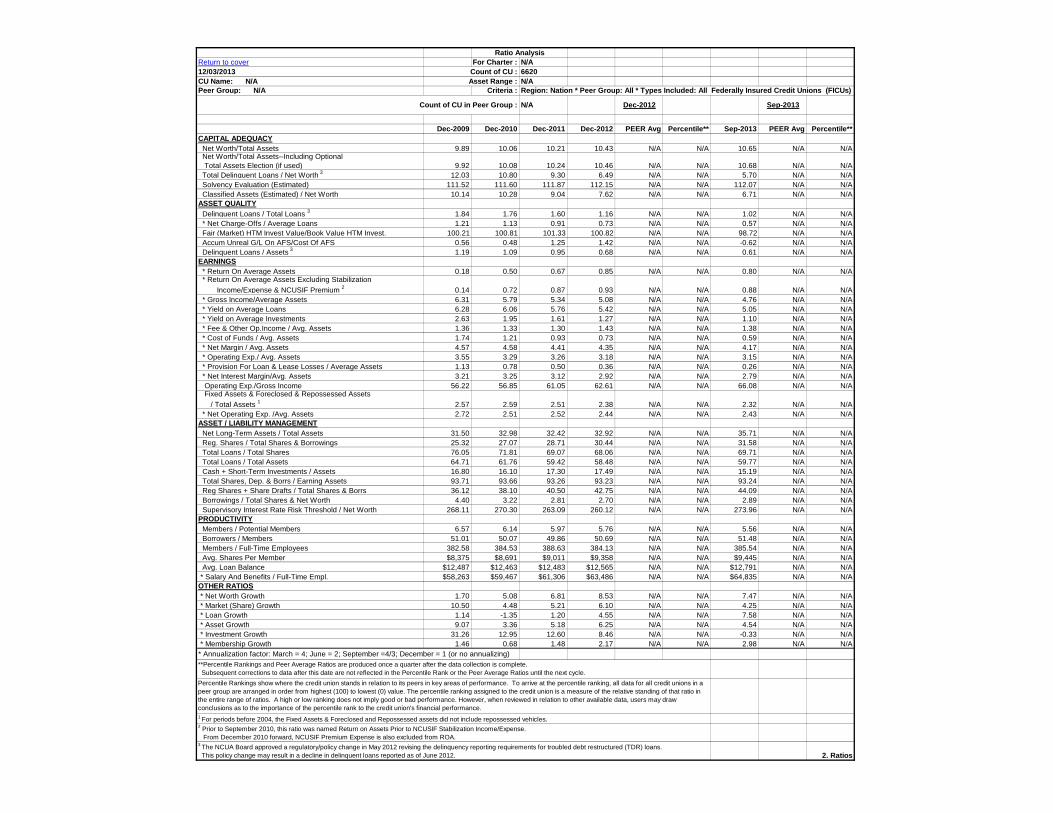
Ratio AnalysisReturn to cover For Charter : N/A12/03/2013 Count of CU : 6620CU Name: N/A Asset Range : N/APeer Group: N/A Criteria :
Count of CU in Peer Group : N/A Dec-2012 Sep-2013
Dec-2009 Dec-2010 Dec-2011 Dec-2012 PEER Avg Percentile** Sep-2013 PEER Avg Percentile**CAPITAL ADEQUACY Net Worth/Total Assets 9.89 10.06 10.21 10.43 N/A N/A 10.65 N/A N/A Net Worth/Total Assets--Including Optional Total Assets Election (if used) 9.92 10.08 10.24 10.46 N/A N/A 10.68 N/A N/A Total Delinquent Loans / Net Worth 3 12.03 10.80 9.30 6.49 N/A N/A 5.70 N/A N/A Solvency Evaluation (Estimated) 111.52 111.60 111.87 112.15 N/A N/A 112.07 N/A N/A Classified Assets (Estimated) / Net Worth 10.14 10.28 9.04 7.62 N/A N/A 6.71 N/A N/AASSET QUALITY Delinquent Loans / Total Loans 3 1.84 1.76 1.60 1.16 N/A N/A 1.02 N/A N/A * Net Charge-Offs / Average Loans 1.21 1.13 0.91 0.73 N/A N/A 0.57 N/A N/A Fair (Market) HTM Invest Value/Book Value HTM Invest. 100.21 100.81 101.33 100.82 N/A N/A 98.72 N/A N/A Accum Unreal G/L On AFS/Cost Of AFS 0.56 0.48 1.25 1.42 N/A N/A -0.62 N/A N/A Delinquent Loans / Assets 3 1.19 1.09 0.95 0.68 N/A N/A 0.61 N/A N/AEARNINGS * Return On Average Assets 0.18 0.50 0.67 0.85 N/A N/A 0.80 N/A N/A * Return On Average Assets Excluding Stabilization Income/Expense & NCUSIF Premium 2 0.14 0.72 0.87 0.93 N/A N/A 0.88 N/A N/A * Gross Income/Average Assets 6.31 5.79 5.34 5.08 N/A N/A 4.76 N/A N/A * Yield on Average Loans 6.28 6.06 5.76 5.42 N/A N/A 5.05 N/A N/A * Yield on Average Investments 2.63 1.95 1.61 1.27 N/A N/A 1.10 N/A N/A * Fee & Other Op.Income / Avg. Assets 1.36 1.33 1.30 1.43 N/A N/A 1.38 N/A N/A * Cost of Funds / Avg. Assets 1.74 1.21 0.93 0.73 N/A N/A 0.59 N/A N/A * Net Margin / Avg. Assets 4.57 4.58 4.41 4.35 N/A N/A 4.17 N/A N/A * Operating Exp./ Avg. Assets 3.55 3.29 3.26 3.18 N/A N/A 3.15 N/A N/A * Provision For Loan & Lease Losses / Average Assets 1.13 0.78 0.50 0.36 N/A N/A 0.26 N/A N/A * Net Interest Margin/Avg. Assets 3.21 3.25 3.12 2.92 N/A N/A 2.79 N/A N/A Operating Exp./Gross Income 56.22 56.85 61.05 62.61 N/A N/A 66.08 N/A N/A Fixed Assets & Foreclosed & Repossessed Assets / Total Assets 1 2.57 2.59 2.51 2.38 N/A N/A 2.32 N/A N/A * Net Operating Exp. /Avg. Assets 2.72 2.51 2.52 2.44 N/A N/A 2.43 N/A N/AASSET / LIABILITY MANAGEMENT Net Long-Term Assets / Total Assets 31.50 32.98 32.42 32.92 N/A N/A 35.71 N/A N/A Reg. Shares / Total Shares & Borrowings 25.32 27.07 28.71 30.44 N/A N/A 31.58 N/A N/A Total Loans / Total Shares 76.05 71.81 69.07 68.06 N/A N/A 69.71 N/A N/A Total Loans / Total Assets 64.71 61.76 59.42 58.48 N/A N/A 59.77 N/A N/A Cash + Short-Term Investments / Assets 16.80 16.10 17.30 17.49 N/A N/A 15.19 N/A N/A Total Shares, Dep. & Borrs / Earning Assets 93.71 93.66 93.26 93.23 N/A N/A 93.24 N/A N/A Reg Shares + Share Drafts / Total Shares & Borrs 36.12 38.10 40.50 42.75 N/A N/A 44.09 N/A N/A Borrowings / Total Shares & Net Worth 4.40 3.22 2.81 2.70 N/A N/A 2.89 N/A N/A Supervisory Interest Rate Risk Threshold / Net Worth 268.11 270.30 263.09 260.12 N/A N/A 273.96 N/A N/APRODUCTIVITY Members / Potential Members 6.57 6.14 5.97 5.76 N/A N/A 5.56 N/A N/A Borrowers / Members 51.01 50.07 49.86 50.69 N/A N/A 51.48 N/A N/A Members / Full-Time Employees 382.58 384.53 388.63 384.13 N/A N/A 385.54 N/A N/A Avg. Shares Per Member $8,375 $8,691 $9,011 $9,358 N/A N/A $9,445 N/A N/A Avg. Loan Balance $12,487 $12,463 $12,483 $12,565 N/A N/A $12,791 N/A N/A * Salary And Benefits / Full-Time Empl. $58,263 $59,467 $61,306 $63,486 N/A N/A $64,835 N/A N/AOTHER RATIOS * Net Worth Growth 1.70 5.08 6.81 8.53 N/A N/A 7.47 N/A N/A * Market (Share) Growth 10.50 4.48 5.21 6.10 N/A N/A 4.25 N/A N/A * Loan Growth 1.14 -1.35 1.20 4.55 N/A N/A 7.58 N/A N/A * Asset Growth 9.07 3.36 5.18 6.25 N/A N/A 4.54 N/A N/A * Investment Growth 31.26 12.95 12.60 8.46 N/A N/A -0.33 N/A N/A * Membership Growth 1.46 0.68 1.48 2.17 N/A N/A 2.98 N/A N/A* Annualization factor: March = 4; June = 2; September =4/3; December = 1 (or no annualizing)
2. Ratios
Percentile Rankings show where the credit union stands in relation to its peers in key areas of performance. To arrive at the percentile ranking, all data for all credit unions in a peer group are arranged in order from highest (100) to lowest (0) value. The percentile ranking assigned to the credit union is a measure of the relative standing of that ratio in the entire range of ratios. A high or low ranking does not imply good or bad performance. However, when reviewed in relation to other available data, users may draw conclusions as to the importance of the percentile rank to the credit union's financial performance.
Region: Nation * Peer Group: All * Types Included: All Federally Insured Credit Unions (FICUs)
**Percentile Rankings and Peer Average Ratios are produced once a quarter after the data collection is complete. Subsequent corrections to data after this date are not reflected in the Percentile Rank or the Peer Average Ratios until the next cycle.
1 For periods before 2004, the Fixed Assets & Foreclosed and Repossessed assets did not include repossessed vehicles.2 Prior to September 2010, this ratio was named Return on Assets Prior to NCUSIF Stabilization Income/Expense. From December 2010 forward, NCUSIF Premium Expense is also excluded from ROA.3 The NCUA Board approved a regulatory/policy change in May 2012 revising the delinquency reporting requirements for troubled debt restructured (TDR) loans. This policy change may result in a decline in delinquent loans reported as of June 2012.
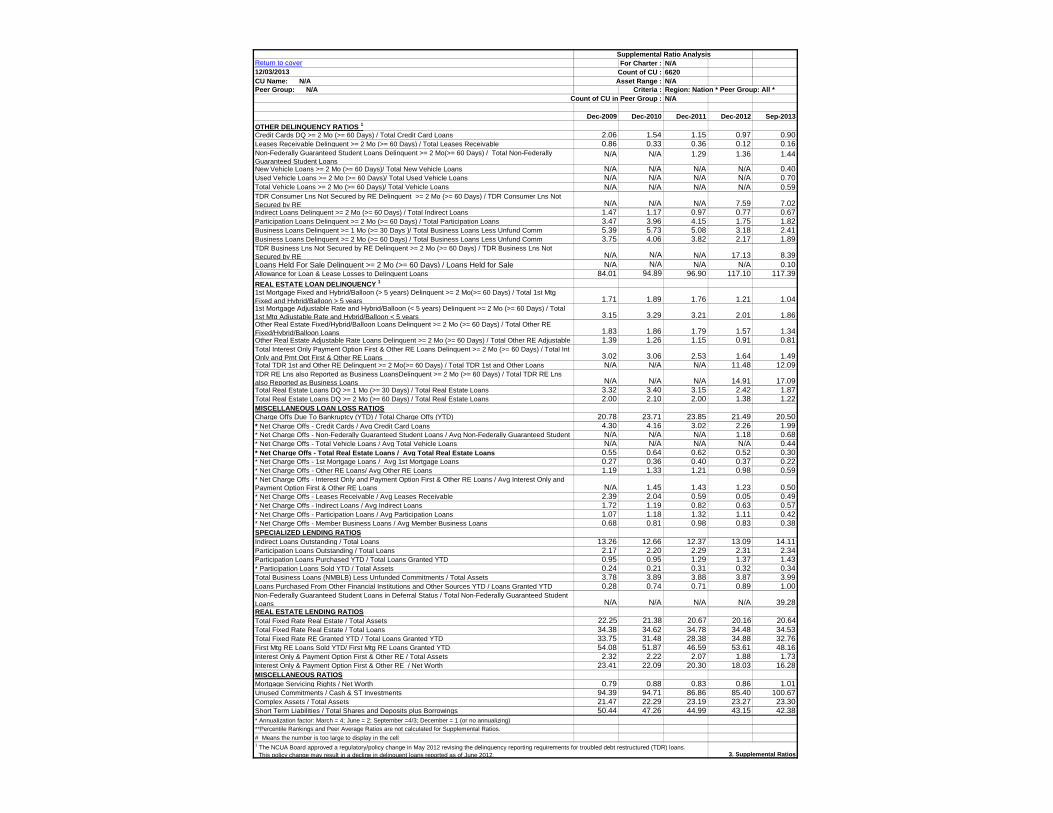
Supplemental Ratio AnalysisReturn to cover For Charter : N/A12/03/2013 Count of CU : 6620CU Name: N/A Asset Range : N/APeer Group: N/A Criteria :
Count of CU in Peer Group : N/A
Dec-2009 Dec-2010 Dec-2011 Dec-2012 Sep-2013OTHER DELINQUENCY RATIOS 1Credit Cards DQ >= 2 Mo (>= 60 Days) / Total Credit Card Loans 2.06 1.54 1.15 0.97 0.90Leases Receivable Delinquent >= 2 Mo (>= 60 Days) / Total Leases Receivable 0.86 0.33 0.36 0.12 0.16Non-Federally Guaranteed Student Loans Delinquent >= 2 Mo(>= 60 Days) / Total Non-Federally Guaranteed Student Loans
N/A N/A 1.29 1.36 1.44
New Vehicle Loans >= 2 Mo (>= 60 Days)/ Total New Vehicle Loans N/A N/A N/A N/A 0.40Used Vehicle Loans >= 2 Mo (>= 60 Days)/ Total Used Vehicle Loans N/A N/A N/A N/A 0.70Total Vehicle Loans >= 2 Mo (>= 60 Days)/ Total Vehicle Loans N/A N/A N/A N/A 0.59TDR Consumer Lns Not Secured by RE Delinquent >= 2 Mo (>= 60 Days) / TDR Consumer Lns Not Secured by RE N/A N/A N/A 7.59 7.02Indirect Loans Delinquent >= 2 Mo (>= 60 Days) / Total Indirect Loans 1.47 1.17 0.97 0.77 0.67Participation Loans Delinquent >= 2 Mo (>= 60 Days) / Total Participation Loans 3.47 3.96 4.15 1.75 1.82Business Loans Delinquent >= 1 Mo (>= 30 Days )/ Total Business Loans Less Unfund Comm 5.39 5.73 5.08 3.18 2.41Business Loans Delinquent >= 2 Mo (>= 60 Days) / Total Business Loans Less Unfund Comm 3.75 4.06 3.82 2.17 1.89TDR Business Lns Not Secured by RE Delinquent >= 2 Mo (>= 60 Days) / TDR Business Lns Not Secured by RE N/A N/A N/A 17.13 8.39Loans Held For Sale Delinquent >= 2 Mo (>= 60 Days) / Loans Held for Sale N/A N/A N/A N/A 0.10Allowance for Loan & Lease Losses to Delinquent Loans 84.01 94.89 96.90 117.10 117.39REAL ESTATE LOAN DELINQUENCY 11st Mortgage Fixed and Hybrid/Balloon (> 5 years) Delinquent >= 2 Mo(>= 60 Days) / Total 1st Mtg Fixed and Hybrid/Balloon > 5 years 1.71 1.89 1.76 1.21 1.041st Mortgage Adjustable Rate and Hybrid/Balloon (< 5 years) Delinquent >= 2 Mo (>= 60 Days) / Total 1st Mtg Adjustable Rate and Hybrid/Balloon < 5 years 3.15 3.29 3.21 2.01 1.86Other Real Estate Fixed/Hybrid/Balloon Loans Delinquent >= 2 Mo (>= 60 Days) / Total Other RE Fixed/Hybrid/Balloon Loans 1.83 1.86 1.79 1.57 1.34Other Real Estate Adjustable Rate Loans Delinquent >= 2 Mo (>= 60 Days) / Total Other RE Adjustable
1.39 1.26 1.15 0.91 0.81
Total Interest Only Payment Option First & Other RE Loans Delinquent >= 2 Mo (>= 60 Days) / Total Int Only and Pmt Opt First & Other RE Loans 3.02 3.06 2.53 1.64 1.49Total TDR 1st and Other RE Delinquent >= 2 Mo(>= 60 Days) / Total TDR 1st and Other Loans N/A N/A N/A 11.48 12.09TDR RE Lns also Reported as Business LoansDelinquent >= 2 Mo (>= 60 Days) / Total TDR RE Lns also Reported as Business Loans N/A N/A N/A 14.91 17.09Total Real Estate Loans DQ >= 1 Mo (>= 30 Days) / Total Real Estate Loans 3.32 3.40 3.15 2.42 1.87Total Real Estate Loans DQ >= 2 Mo (>= 60 Days) / Total Real Estate Loans 2.00 2.10 2.00 1.38 1.22MISCELLANEOUS LOAN LOSS RATIOSCharge Offs Due To Bankruptcy (YTD) / Total Charge Offs (YTD) 20.78 23.71 23.85 21.49 20.50* Net Charge Offs - Credit Cards / Avg Credit Card Loans 4.30 4.16 3.02 2.26 1.99* Net Charge Offs - Non-Federally Guaranteed Student Loans / Avg Non-Federally Guaranteed Student N/A N/A N/A 1.18 0.68* Net Charge Offs - Total Vehicle Loans / Avg Total Vehicle Loans N/A N/A N/A N/A 0.44* Net Charge Offs - Total Real Estate Loans / Avg Total Real Estate Loans 0.55 0.64 0.62 0.52 0.30* Net Charge Offs - 1st Mortgage Loans / Avg 1st Mortgage Loans 0.27 0.36 0.40 0.37 0.22* Net Charge Offs - Other RE Loans/ Avg Other RE Loans 1.19 1.33 1.21 0.98 0.59* Net Charge Offs - Interest Only and Payment Option First & Other RE Loans / Avg Interest Only and Payment Option First & Other RE Loans N/A 1.45 1.43 1.23 0.50* Net Charge Offs - Leases Receivable / Avg Leases Receivable 2.39 2.04 0.59 0.05 0.49* Net Charge Offs - Indirect Loans / Avg Indirect Loans 1.72 1.19 0.82 0.63 0.57* Net Charge Offs - Participation Loans / Avg Participation Loans 1.07 1.18 1.32 1.11 0.42* Net Charge Offs - Member Business Loans / Avg Member Business Loans 0.68 0.81 0.98 0.83 0.38SPECIALIZED LENDING RATIOSIndirect Loans Outstanding / Total Loans 13.26 12.66 12.37 13.09 14.11Participation Loans Outstanding / Total Loans 2.17 2.20 2.29 2.31 2.34Participation Loans Purchased YTD / Total Loans Granted YTD 0.95 0.95 1.29 1.37 1.43* Participation Loans Sold YTD / Total Assets 0.24 0.21 0.31 0.32 0.34Total Business Loans (NMBLB) Less Unfunded Commitments / Total Assets 3.78 3.89 3.88 3.87 3.99Loans Purchased From Other Financial Institutions and Other Sources YTD / Loans Granted YTD 0.28 0.74 0.71 0.89 1.00Non-Federally Guaranteed Student Loans in Deferral Status / Total Non-Federally Guaranteed Student Loans N/A N/A N/A N/A 39.28REAL ESTATE LENDING RATIOSTotal Fixed Rate Real Estate / Total Assets 22.25 21.38 20.67 20.16 20.64Total Fixed Rate Real Estate / Total Loans 34.38 34.62 34.78 34.48 34.53Total Fixed Rate RE Granted YTD / Total Loans Granted YTD 33.75 31.48 28.38 34.88 32.76First Mtg RE Loans Sold YTD/ First Mtg RE Loans Granted YTD 54.08 51.87 46.59 53.61 48.16Interest Only & Payment Option First & Other RE / Total Assets 2.32 2.22 2.07 1.88 1.73Interest Only & Payment Option First & Other RE / Net Worth 23.41 22.09 20.30 18.03 16.28MISCELLANEOUS RATIOSMortgage Servicing Rights / Net Worth 0.79 0.88 0.83 0.86 1.01Unused Commitments / Cash & ST Investments 94.39 94.71 86.86 85.40 100.67Complex Assets / Total Assets 21.47 22.29 23.19 23.27 23.30Short Term Liabilities / Total Shares and Deposits plus Borrowings 50.44 47.26 44.99 43.15 42.38* Annualization factor: March = 4; June = 2; September =4/3; December = 1 (or no annualizing)**Percentile Rankings and Peer Average Ratios are not calculated for Supplemental Ratios.# Means the number is too large to display in the cell
3. Supplemental Ratios
Region: Nation * Peer Group: All *
1 The NCUA Board approved a regulatory/policy change in May 2012 revising the delinquency reporting requirements for troubled debt restructured (TDR) loans. This policy change may result in a decline in delinquent loans reported as of June 2012.

AssetsReturn to cover For Charter : N/A12/03/2013 Count of CU : 6620CU Name: N/A Asset Range : N/APeer Group: N/A Criteria :
Count of CU in Peer Group : N/A
Dec-2009 Dec-2010 % Chg Dec-2011 % Chg Dec-2012 % Chg Sep-2013 % ChgASSETSCASH: Cash On Hand 7,556,842,953 7,666,034,660 1.4 7,930,565,820 3.5 8,269,642,451 4.3 7,888,092,942 -4.6 Cash On Deposit 53,277,253,045 60,647,446,626 13.8 81,789,541,375 34.9 86,836,313,284 6.2 73,929,152,772 -14.9 Cash Equivalents 6,733,164,971 6,114,377,183 -9.2 5,468,089,541 -10.6 5,820,525,232 6.4 4,938,930,891 -15.1TOTAL CASH & EQUIVALENTS 67,567,260,969 74,427,858,469 10.2 95,188,196,736 27.9 100,926,480,967 6.0 86,756,176,605 -14.0
INVESTMENTS: Trading Securities 956,703,729 953,534,441 -0.3 1,194,477,918 25.3 1,239,399,097 3.8 978,018,453 -21.1 Available for Sale Securities 97,231,392,503 129,768,351,486 33.5 149,170,042,953 15.0 165,768,749,703 11.1 175,169,405,859 5.7 Held-to-Maturity Securities 34,808,926,541 42,547,641,062 22.2 49,340,766,837 16.0 54,168,709,077 9.8 58,354,683,931 7.7 Deposits in Commercial Banks, S&Ls, Savings Banks 36,961,330,960 42,084,761,500 13.9 43,705,512,818 3.9 47,089,748,529 7.7 46,276,874,499 -1.7Loans to, Deposits in, and Investments in Natural Person Credit Unions 2 1,963,458,072 2,127,836,210 8.4 2,309,385,511 8.5 2,485,785,469 7.6 2,731,852,453 9.9 Total MCSD/Nonperpetual Contributed Capital and PIC/Perpetual Contributed Capital 1,364,848,683 1,058,410,752 -22.5 1,477,622,445 39.6 1,567,025,093 6.1 1,509,316,087 -3.7 All Other Investments in Corporate Cus 32,173,961,533 15,999,111,491 -50.3 4,643,064,769 -71.0 2,321,112,740 -50.0 2,367,822,943 2.0 All Other Investments 2 5,290,611,687 4,379,239,960 -17.2 5,046,608,477 15.2 5,792,622,765 14.8 6,134,617,193 5.9TOTAL INVESTMENTS 210,751,233,708 238,918,886,902 13.4 256,887,481,728 7.5 280,433,152,473 9.2 293,522,591,418 4.7
LOANS HELD FOR SALE 2,264,461,472 3,212,162,789 41.9 3,304,422,035 2.9 5,144,710,451 55.7 2,903,443,674 -43.6 LOANS AND LEASES: Unsecured Credit Card Loans 34,865,760,517 35,945,062,481 3.1 37,382,404,294 4.0 39,519,263,998 5.7 40,711,836,390 3.0 All Other Unsecured Loans/Lines of Credit 25,541,402,060 25,469,948,754 -0.3 25,556,877,061 0.3 26,834,657,470 5.0 28,232,041,238 5.2 Short-Term, Small Amount Loans (STS) (FCUs only) N/A 13,286,528 18,480,889 39.1 21,266,442 15.1 22,413,747 5.4 Non-Federally Guaranteed Student Loans N/A N/A 1,485,176,726 2,019,696,696 36.0 2,510,012,791 24.3 New Vehicle Loans 75,233,140,158 62,872,028,885 -16.4 58,267,876,944 -7.3 63,285,991,721 8.6 69,006,822,002 9.0 Used Vehicle Loans 98,172,016,892 101,541,355,132 3.4 106,800,995,224 5.2 115,198,598,913 7.9 124,987,716,033 8.5 1st Mortgage Real Estate Loans/Lines of Credit 217,309,088,806 223,279,387,134 2.7 233,176,398,602 4.4 246,235,189,170 5.6 262,283,009,854 6.5 Other Real Estate Loans/Lines of Credit 92,336,131,788 86,364,777,267 -6.5 79,867,881,153 -7.5 73,953,575,224 -7.4 70,848,503,882 -4.2 Leases Receivable 600,743,902 452,135,399 -24.7 435,669,350 -3.6 543,126,597 24.7 716,402,419 31.9 Total All Other Loans/Lines of Credit 28,385,033,975 28,769,665,404 1.4 28,502,725,075 -0.9 29,910,505,149 4.9 32,172,470,158 7.6TOTAL LOANS 572,443,318,098 564,707,646,984 -1.4 571,494,485,318 1.2 597,521,871,380 4.6 631,491,228,514 5.7(ALLOWANCE FOR LOAN & LEASE LOSSES) (8,847,960,252) (9,424,079,292) 6.5 (8,856,255,275) -6.0 (8,102,848,056) -8.5 (7,529,859,117) -7.1 Foreclosed Real Estate 1,160,746,171 1,612,654,896 38.9 1,586,973,571 -1.6 1,330,940,761 -16.1 1,073,762,177 -19.3 Repossessed Autos 302,046,542 208,997,324 -30.8 176,404,866 -15.6 161,640,451 -8.4 170,466,182 5.5 Foreclosed and Repossessed Other Assets 38,499,115 33,496,857 -13.0 33,020,844 -1.4 21,602,526 -34.6 21,147,833 -2.1TOTAL FORECLOSED and REPOSSESSED ASSETS 1 1,501,291,828 1,855,149,077 23.6 1,796,399,281 -3.2 1,514,183,738 -15.7 1,265,376,192 -16.4Land and Building 16,146,829,848 16,778,850,022 3.9 17,211,295,011 2.6 17,660,702,048 2.6 18,040,032,678 2.1Other Fixed Assets 3,549,370,569 3,354,194,527 -5.5 3,366,283,300 0.4 3,462,758,425 2.9 3,534,284,641 2.1NCUA Share Insurance Capitalization Deposit 7,035,680,285 7,469,341,871 6.2 7,784,935,164 4.2 8,295,737,945 6.6 8,423,621,556 1.5
Identifiable Intangible Assets 137,848,144 211,040,636 53.1 200,679,424 -4.9 195,683,842 -2.5 181,260,023 -7.4 Goodwill 337,607,015 510,645,524 51.3 643,361,861 26.0 691,514,863 7.5 697,329,971 0.8TOTAL INTANGIBLE ASSETS 475,455,159 721,686,160 51.8 844,041,285 17.0 887,198,705 5.1 878,589,994 -1.0 Accrued Interest on Loans 2,109,066,504 2,019,107,468 -4.3 1,949,712,687 -3.4 1,906,520,702 -2.2 1,894,913,622 -0.6 Accrued Interest on Investments 974,105,082 893,863,162 -8.2 887,702,234 -0.7 855,012,097 -3.7 840,827,886 -1.7 All Other Assets 8,637,768,464 9,406,004,264 8.9 9,849,862,835 4.7 11,271,733,232 14.4 14,575,333,612 29.3TOTAL OTHER ASSETS 11,720,940,050 12,318,974,894 5.1 12,687,277,756 3.0 14,033,266,031 10.6 17,311,075,120 23.4
TOTAL ASSETS 884,607,881,734 914,340,672,403 3.4 961,708,562,339 5.2 1,021,777,214,107 6.2 1,056,596,561,275 3.4TOTAL CU's 7,554 7,339 -2.8 7,094 -3.3 6,819 -3.9 6,620 -2.9
4. Assets
Region: Nation * Peer Group: All * Types Included: All Federally Insured Credit Unions (FICUs) *
# Means the number is too large to display in the cell1 OTHER RE OWNED PRIOR TO 2004 2 LOANS TO, DEPOSITS IN, AND INVESTMENTS IN NATURAL PERSON CUs INCLUDED IN ALL OTHER INVESTMENTS PRIOR TO JUNE 2006 FOR SHORT FORM FILERS
Liabilities, Shares & EquityReturn to cover For Charter : N/A12/03/2013 Count of CU : 6620CU Name: N/A Asset Range : N/APeer Group: N/A Criteria :
Count of CU in Peer Group : N/A
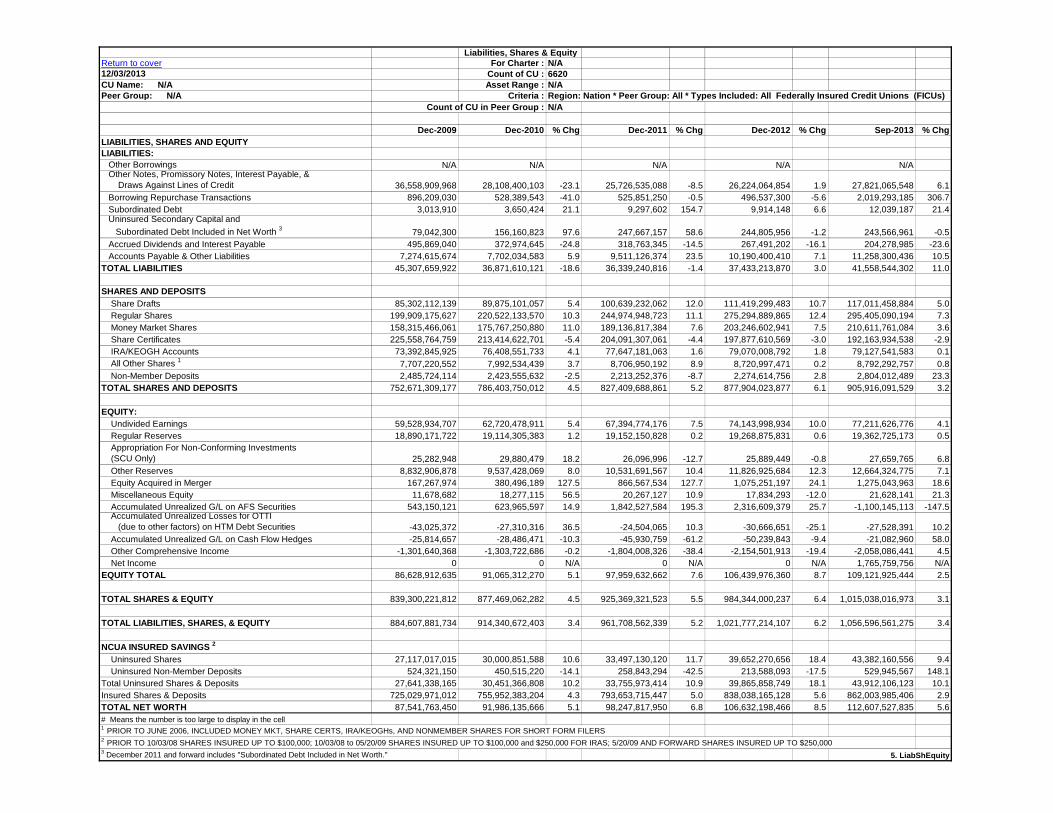
Dec-2009 Dec-2010 % Chg Dec-2011 % Chg Dec-2012 % Chg Sep-2013 % ChgLIABILITIES, SHARES AND EQUITYLIABILITIES: Other Borrowings N/A N/A N/A N/A N/A Other Notes, Promissory Notes, Interest Payable, & Draws Against Lines of Credit 36,558,909,968 28,108,400,103 -23.1 25,726,535,088 -8.5 26,224,064,854 1.9 27,821,065,548 6.1 Borrowing Repurchase Transactions 896,209,030 528,389,543 -41.0 525,851,250 -0.5 496,537,300 -5.6 2,019,293,185 306.7 Subordinated Debt 3,013,910 3,650,424 21.1 9,297,602 154.7 9,914,148 6.6 12,039,187 21.4 Uninsured Secondary Capital and Subordinated Debt Included in Net Worth 3 79,042,300 156,160,823 97.6 247,667,157 58.6 244,805,956 -1.2 243,566,961 -0.5 Accrued Dividends and Interest Payable 495,869,040 372,974,645 -24.8 318,763,345 -14.5 267,491,202 -16.1 204,278,985 -23.6 Accounts Payable & Other Liabilities 7,274,615,674 7,702,034,583 5.9 9,511,126,374 23.5 10,190,400,410 7.1 11,258,300,436 10.5TOTAL LIABILITIES 45,307,659,922 36,871,610,121 -18.6 36,339,240,816 -1.4 37,433,213,870 3.0 41,558,544,302 11.0
SHARES AND DEPOSITS Share Drafts 85,302,112,139 89,875,101,057 5.4 100,639,232,062 12.0 111,419,299,483 10.7 117,011,458,884 5.0 Regular Shares 199,909,175,627 220,522,133,570 10.3 244,974,948,723 11.1 275,294,889,865 12.4 295,405,090,194 7.3 Money Market Shares 158,315,466,061 175,767,250,880 11.0 189,136,817,384 7.6 203,246,602,941 7.5 210,611,761,084 3.6 Share Certificates 225,558,764,759 213,414,622,701 -5.4 204,091,307,061 -4.4 197,877,610,569 -3.0 192,163,934,538 -2.9 IRA/KEOGH Accounts 73,392,845,925 76,408,551,733 4.1 77,647,181,063 1.6 79,070,008,792 1.8 79,127,541,583 0.1 All Other Shares 1 7,707,220,552 7,992,534,439 3.7 8,706,950,192 8.9 8,720,997,471 0.2 8,792,292,757 0.8 Non-Member Deposits 2,485,724,114 2,423,555,632 -2.5 2,213,252,376 -8.7 2,274,614,756 2.8 2,804,012,489 23.3TOTAL SHARES AND DEPOSITS 752,671,309,177 786,403,750,012 4.5 827,409,688,861 5.2 877,904,023,877 6.1 905,916,091,529 3.2
EQUITY: Undivided Earnings 59,528,934,707 62,720,478,911 5.4 67,394,774,176 7.5 74,143,998,934 10.0 77,211,626,776 4.1 Regular Reserves 18,890,171,722 19,114,305,383 1.2 19,152,150,828 0.2 19,268,875,831 0.6 19,362,725,173 0.5 Appropriation For Non-Conforming Investments (SCU Only) 25,282,948 29,880,479 18.2 26,096,996 -12.7 25,889,449 -0.8 27,659,765 6.8 Other Reserves 8,832,906,878 9,537,428,069 8.0 10,531,691,567 10.4 11,826,925,684 12.3 12,664,324,775 7.1 Equity Acquired in Merger 167,267,974 380,496,189 127.5 866,567,534 127.7 1,075,251,197 24.1 1,275,043,963 18.6 Miscellaneous Equity 11,678,682 18,277,115 56.5 20,267,127 10.9 17,834,293 -12.0 21,628,141 21.3 Accumulated Unrealized G/L on AFS Securities 543,150,121 623,965,597 14.9 1,842,527,584 195.3 2,316,609,379 25.7 -1,100,145,113 -147.5 Accumulated Unrealized Losses for OTTI (due to other factors) on HTM Debt Securities -43,025,372 -27,310,316 36.5 -24,504,065 10.3 -30,666,651 -25.1 -27,528,391 10.2 Accumulated Unrealized G/L on Cash Flow Hedges -25,814,657 -28,486,471 -10.3 -45,930,759 -61.2 -50,239,843 -9.4 -21,082,960 58.0 Other Comprehensive Income -1,301,640,368 -1,303,722,686 -0.2 -1,804,008,326 -38.4 -2,154,501,913 -19.4 -2,058,086,441 4.5 Net Income 0 0 N/A 0 N/A 0 N/A 1,765,759,756 N/AEQUITY TOTAL 86,628,912,635 91,065,312,270 5.1 97,959,632,662 7.6 106,439,976,360 8.7 109,121,925,444 2.5
TOTAL SHARES & EQUITY 839,300,221,812 877,469,062,282 4.5 925,369,321,523 5.5 984,344,000,237 6.4 1,015,038,016,973 3.1
TOTAL LIABILITIES, SHARES, & EQUITY 884,607,881,734 914,340,672,403 3.4 961,708,562,339 5.2 1,021,777,214,107 6.2 1,056,596,561,275 3.4
NCUA INSURED SAVINGS 2
Uninsured Shares 27,117,017,015 30,000,851,588 10.6 33,497,130,120 11.7 39,652,270,656 18.4 43,382,160,556 9.4 Uninsured Non-Member Deposits 524,321,150 450,515,220 -14.1 258,843,294 -42.5 213,588,093 -17.5 529,945,567 148.1Total Uninsured Shares & Deposits 27,641,338,165 30,451,366,808 10.2 33,755,973,414 10.9 39,865,858,749 18.1 43,912,106,123 10.1Insured Shares & Deposits 725,029,971,012 755,952,383,204 4.3 793,653,715,447 5.0 838,038,165,128 5.6 862,003,985,406 2.9TOTAL NET WORTH 87,541,763,450 91,986,135,666 5.1 98,247,817,950 6.8 106,632,198,466 8.5 112,607,527,835 5.6# Means the number is too large to display in the cell1 PRIOR TO JUNE 2006, INCLUDED MONEY MKT, SHARE CERTS, IRA/KEOGHs, AND NONMEMBER SHARES FOR SHORT FORM FILERS2 PRIOR TO 10/03/08 SHARES INSURED UP TO $100,000; 10/03/08 to 05/20/09 SHARES INSURED UP TO $100,000 and $250,000 FOR IRAS; 5/20/09 AND FORWARD SHARES INSURED UP TO $250,0003 December 2011 and forward includes "Subordinated Debt Included in Net Worth." 5. LiabShEquity
Region: Nation * Peer Group: All * Types Included: All Federally Insured Credit Unions (FICUs)
Income StatementReturn to cover For Charter : N/A12/03/2013 Count of CU : 6620CU Name: N/A Asset Range : N/APeer Group: N/A Criteria :
Count of CU in Peer Group : N/A
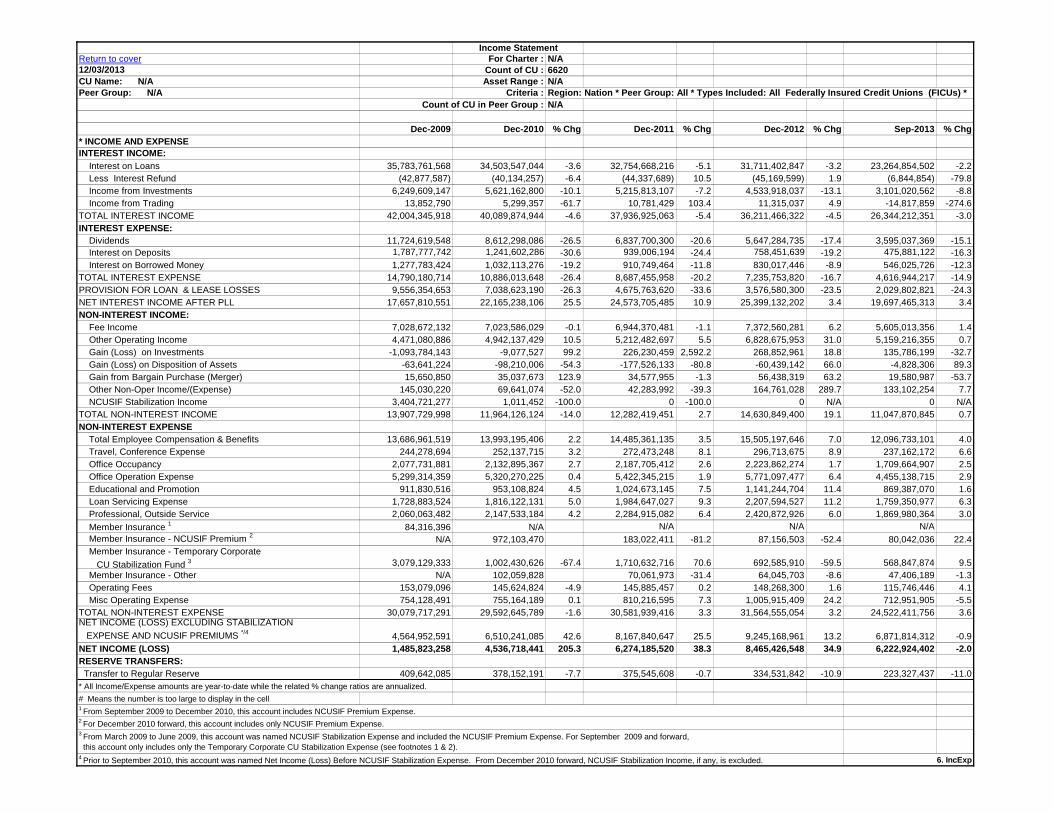
Dec-2009 Dec-2010 % Chg Dec-2011 % Chg Dec-2012 % Chg Sep-2013 % Chg* INCOME AND EXPENSEINTEREST INCOME: Interest on Loans 35,783,761,568 34,503,547,044 -3.6 32,754,668,216 -5.1 31,711,402,847 -3.2 23,264,854,502 -2.2 Less Interest Refund (42,877,587) (40,134,257) -6.4 (44,337,689) 10.5 (45,169,599) 1.9 (6,844,854) -79.8 Income from Investments 6,249,609,147 5,621,162,800 -10.1 5,215,813,107 -7.2 4,533,918,037 -13.1 3,101,020,562 -8.8 Income from Trading 13,852,790 5,299,357 -61.7 10,781,429 103.4 11,315,037 4.9 -14,817,859 -274.6TOTAL INTEREST INCOME 42,004,345,918 40,089,874,944 -4.6 37,936,925,063 -5.4 36,211,466,322 -4.5 26,344,212,351 -3.0INTEREST EXPENSE: Dividends 11,724,619,548 8,612,298,086 -26.5 6,837,700,300 -20.6 5,647,284,735 -17.4 3,595,037,369 -15.1 Interest on Deposits 1,787,777,742 1,241,602,286 -30.6 939,006,194 -24.4 758,451,639 -19.2 475,881,122 -16.3 Interest on Borrowed Money 1,277,783,424 1,032,113,276 -19.2 910,749,464 -11.8 830,017,446 -8.9 546,025,726 -12.3TOTAL INTEREST EXPENSE 14,790,180,714 10,886,013,648 -26.4 8,687,455,958 -20.2 7,235,753,820 -16.7 4,616,944,217 -14.9PROVISION FOR LOAN & LEASE LOSSES 9,556,354,653 7,038,623,190 -26.3 4,675,763,620 -33.6 3,576,580,300 -23.5 2,029,802,821 -24.3NET INTEREST INCOME AFTER PLL 17,657,810,551 22,165,238,106 25.5 24,573,705,485 10.9 25,399,132,202 3.4 19,697,465,313 3.4NON-INTEREST INCOME: Fee Income 7,028,672,132 7,023,586,029 -0.1 6,944,370,481 -1.1 7,372,560,281 6.2 5,605,013,356 1.4 Other Operating Income 4,471,080,886 4,942,137,429 10.5 5,212,482,697 5.5 6,828,675,953 31.0 5,159,216,355 0.7 Gain (Loss) on Investments -1,093,784,143 -9,077,527 99.2 226,230,459 2,592.2 268,852,961 18.8 135,786,199 -32.7 Gain (Loss) on Disposition of Assets -63,641,224 -98,210,006 -54.3 -177,526,133 -80.8 -60,439,142 66.0 -4,828,306 89.3 Gain from Bargain Purchase (Merger) 15,650,850 35,037,673 123.9 34,577,955 -1.3 56,438,319 63.2 19,580,987 -53.7 Other Non-Oper Income/(Expense) 145,030,220 69,641,074 -52.0 42,283,992 -39.3 164,761,028 289.7 133,102,254 7.7 NCUSIF Stabilization Income 3,404,721,277 1,011,452 -100.0 0 -100.0 0 N/A 0 N/ATOTAL NON-INTEREST INCOME 13,907,729,998 11,964,126,124 -14.0 12,282,419,451 2.7 14,630,849,400 19.1 11,047,870,845 0.7NON-INTEREST EXPENSE Total Employee Compensation & Benefits 13,686,961,519 13,993,195,406 2.2 14,485,361,135 3.5 15,505,197,646 7.0 12,096,733,101 4.0 Travel, Conference Expense 244,278,694 252,137,715 3.2 272,473,248 8.1 296,713,675 8.9 237,162,172 6.6 Office Occupancy 2,077,731,881 2,132,895,367 2.7 2,187,705,412 2.6 2,223,862,274 1.7 1,709,664,907 2.5 Office Operation Expense 5,299,314,359 5,320,270,225 0.4 5,422,345,215 1.9 5,771,097,477 6.4 4,455,138,715 2.9 Educational and Promotion 911,830,516 953,108,824 4.5 1,024,673,145 7.5 1,141,244,704 11.4 869,387,070 1.6 Loan Servicing Expense 1,728,883,524 1,816,122,131 5.0 1,984,647,027 9.3 2,207,594,527 11.2 1,759,350,977 6.3 Professional, Outside Service 2,060,063,482 2,147,533,184 4.2 2,284,915,082 6.4 2,420,872,926 6.0 1,869,980,364 3.0 Member Insurance 1 84,316,396 N/A N/A N/A N/A Member Insurance - NCUSIF Premium 2 N/A 972,103,470 183,022,411 -81.2 87,156,503 -52.4 80,042,036 22.4 Member Insurance - Temporary Corporate CU Stabilization Fund 3 3,079,129,333 1,002,430,626 -67.4 1,710,632,716 70.6 692,585,910 -59.5 568,847,874 9.5 Member Insurance - Other N/A 102,059,828 70,061,973 -31.4 64,045,703 -8.6 47,406,189 -1.3 Operating Fees 153,079,096 145,624,824 -4.9 145,885,457 0.2 148,268,300 1.6 115,746,446 4.1 Misc Operating Expense 754,128,491 755,164,189 0.1 810,216,595 7.3 1,005,915,409 24.2 712,951,905 -5.5TOTAL NON-INTEREST EXPENSE 30,079,717,291 29,592,645,789 -1.6 30,581,939,416 3.3 31,564,555,054 3.2 24,522,411,756 3.6NET INCOME (LOSS) EXCLUDING STABILIZATION EXPENSE AND NCUSIF PREMIUMS */4 4,564,952,591 6,510,241,085 42.6 8,167,840,647 25.5 9,245,168,961 13.2 6,871,814,312 -0.9NET INCOME (LOSS) 1,485,823,258 4,536,718,441 205.3 6,274,185,520 38.3 8,465,426,548 34.9 6,222,924,402 -2.0RESERVE TRANSFERS: Transfer to Regular Reserve 409,642,085 378,152,191 -7.7 375,545,608 -0.7 334,531,842 -10.9 223,327,437 -11.0* All Income/Expense amounts are year-to-date while the related % change ratios are annualized.# Means the number is too large to display in the cell
6. IncExp
Region: Nation * Peer Group: All * Types Included: All Federally Insured Credit Unions (FICUs) *
4 Prior to September 2010, this account was named Net Income (Loss) Before NCUSIF Stabilization Expense. From December 2010 forward, NCUSIF Stabilization Income, if any, is excluded.
2 For December 2010 forward, this account includes only NCUSIF Premium Expense.
1 From September 2009 to December 2010, this account includes NCUSIF Premium Expense.
3 From March 2009 to June 2009, this account was named NCUSIF Stabilization Expense and included the NCUSIF Premium Expense. For September 2009 and forward, this account only includes only the Temporary Corporate CU Stabilization Expense (see footnotes 1 & 2).
Delinquent Loan InformationReturn to cover For Charter : N/A12/03/2013 Count of CU : 6620CU Name: N/A Asset Range : N/APeer Group: N/A Criteria :
Count of CU in Peer Group : N/A
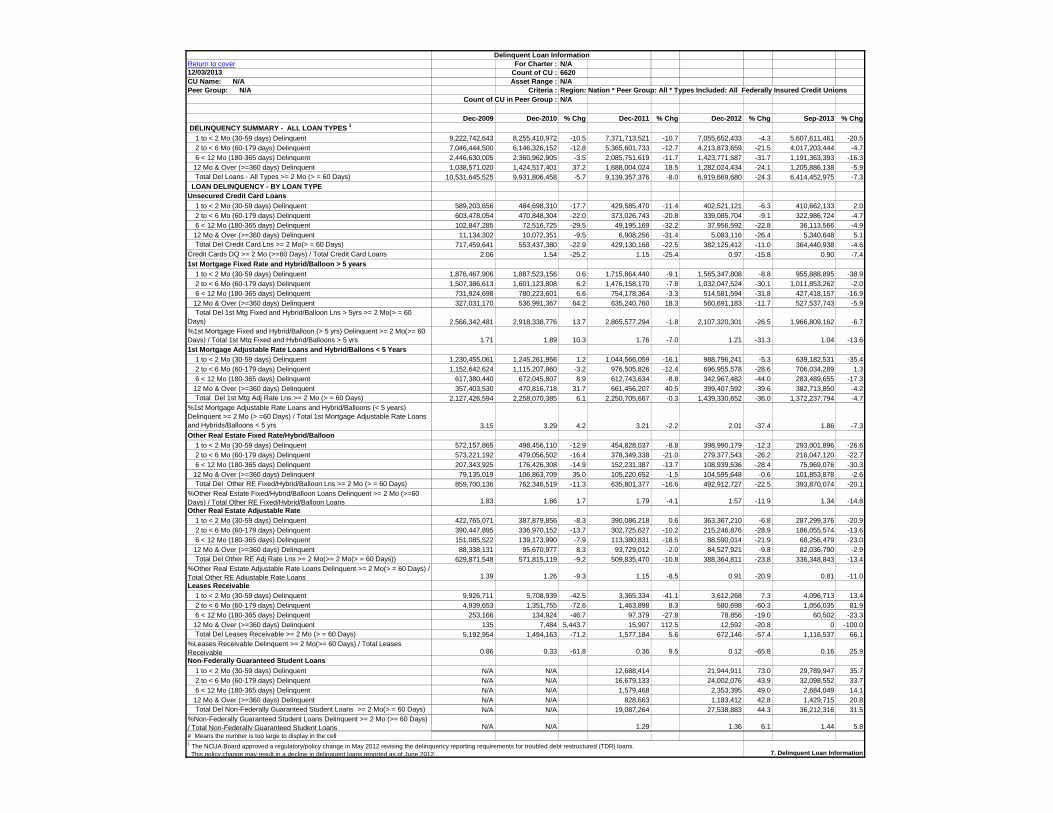
Dec-2009 Dec-2010 % Chg Dec-2011 % Chg Dec-2012 % Chg Sep-2013 % Chg DELINQUENCY SUMMARY - ALL LOAN TYPES 1
1 to < 2 Mo (30-59 days) Delinquent 9,222,742,643 8,255,410,972 -10.5 7,371,713,521 -10.7 7,055,652,433 -4.3 5,607,611,461 -20.5 2 to < 6 Mo (60-179 days) Delinquent 7,046,444,500 6,146,326,152 -12.8 5,365,601,733 -12.7 4,213,873,659 -21.5 4,017,203,444 -4.7 6 < 12 Mo (180-365 days) Delinquent 2,446,630,005 2,360,962,905 -3.5 2,085,751,619 -11.7 1,423,771,587 -31.7 1,191,363,393 -16.3 12 Mo & Over (>=360 days) Delinquent 1,038,571,020 1,424,517,401 37.2 1,688,004,024 18.5 1,282,024,434 -24.1 1,205,886,138 -5.9 Total Del Loans - All Types >= 2 Mo (> = 60 Days) 10,531,645,525 9,931,806,458 -5.7 9,139,357,376 -8.0 6,919,669,680 -24.3 6,414,452,975 -7.3 LOAN DELINQUENCY - BY LOAN TYPEUnsecured Credit Card Loans 1 to < 2 Mo (30-59 days) Delinquent 589,203,656 484,698,310 -17.7 429,585,470 -11.4 402,521,121 -6.3 410,662,133 2.0 2 to < 6 Mo (60-179 days) Delinquent 603,478,054 470,848,304 -22.0 373,026,743 -20.8 339,085,704 -9.1 322,986,724 -4.7 6 < 12 Mo (180-365 days) Delinquent 102,847,285 72,516,725 -29.5 49,195,169 -32.2 37,956,592 -22.8 36,113,566 -4.9 12 Mo & Over (>=360 days) Delinquent 11,134,302 10,072,351 -9.5 6,908,256 -31.4 5,083,116 -26.4 5,340,648 5.1 Total Del Credit Card Lns >= 2 Mo(> = 60 Days) 717,459,641 553,437,380 -22.9 429,130,168 -22.5 382,125,412 -11.0 364,440,938 -4.6Credit Cards DQ >= 2 Mo (>=60 Days) / Total Credit Card Loans 2.06 1.54 -25.2 1.15 -25.4 0.97 -15.8 0.90 -7.41st Mortgage Fixed Rate and Hybrid/Balloon > 5 years 1 to < 2 Mo (30-59 days) Delinquent 1,876,467,906 1,887,523,156 0.6 1,715,864,440 -9.1 1,565,347,808 -8.8 955,888,895 -38.9 2 to < 6 Mo (60-179 days) Delinquent 1,507,386,613 1,601,123,808 6.2 1,476,158,170 -7.8 1,032,047,524 -30.1 1,011,853,262 -2.0 6 < 12 Mo (180-365 days) Delinquent 731,924,698 780,223,601 6.6 754,178,364 -3.3 514,581,594 -31.8 427,418,157 -16.9 12 Mo & Over (>=360 days) Delinquent 327,031,170 536,991,367 64.2 635,240,760 18.3 560,691,183 -11.7 527,537,743 -5.9 Total Del 1st Mtg Fixed and Hybrid/Balloon Lns > 5yrs >= 2 Mo(> = 60 Days) 2,566,342,481 2,918,338,776 13.7 2,865,577,294 -1.8 2,107,320,301 -26.5 1,966,809,162 -6.7%1st Mortgage Fixed and Hybrid/Balloon (> 5 yrs) Delinquent >= 2 Mo(>= 60 Days) / Total 1st Mtg Fixed and Hybrid/Balloons > 5 yrs 1.71 1.89 10.3 1.76 -7.0 1.21 -31.3 1.04 -13.61st Mortgage Adjustable Rate Loans and Hybrid/Ballons < 5 Years 1 to < 2 Mo (30-59 days) Delinquent 1,230,455,061 1,245,261,956 1.2 1,044,566,059 -16.1 988,796,241 -5.3 639,182,531 -35.4 2 to < 6 Mo (60-179 days) Delinquent 1,152,642,624 1,115,207,860 -3.2 976,505,826 -12.4 696,955,578 -28.6 706,034,289 1.3 6 < 12 Mo (180-365 days) Delinquent 617,380,440 672,045,807 8.9 612,743,634 -8.8 342,967,482 -44.0 283,489,655 -17.3 12 Mo & Over (>=360 days) Delinquent 357,403,530 470,816,718 31.7 661,456,207 40.5 399,407,592 -39.6 382,713,850 -4.2 Total Del 1st Mtg Adj Rate Lns >= 2 Mo (> = 60 Days) 2,127,426,594 2,258,070,385 6.1 2,250,705,667 -0.3 1,439,330,652 -36.0 1,372,237,794 -4.7%1st Mortgage Adjustable Rate Loans and Hybrid/Balloons (< 5 years) Delinquent >= 2 Mo (> =60 Days) / Total 1st Mortgage Adjustable Rate Loans and Hybrids/Balloons < 5 yrs 3.15 3.29 4.2 3.21 -2.2 2.01 -37.4 1.86 -7.3Other Real Estate Fixed Rate/Hybrid/Balloon 1 to < 2 Mo (30-59 days) Delinquent 572,157,865 498,456,110 -12.9 454,828,037 -8.8 398,990,179 -12.3 293,001,896 -26.6 2 to < 6 Mo (60-179 days) Delinquent 573,221,192 479,056,502 -16.4 378,349,338 -21.0 279,377,543 -26.2 216,047,120 -22.7 6 < 12 Mo (180-365 days) Delinquent 207,343,925 176,426,308 -14.9 152,231,387 -13.7 108,939,536 -28.4 75,969,076 -30.3 12 Mo & Over (>=360 days) Delinquent 79,135,019 106,863,709 35.0 105,220,652 -1.5 104,595,648 -0.6 101,853,878 -2.6 Total Del Other RE Fixed/Hybrid/Balloon Lns >= 2 Mo (> = 60 Days) 859,700,136 762,346,519 -11.3 635,801,377 -16.6 492,912,727 -22.5 393,870,074 -20.1%Other Real Estate Fixed/Hybrid/Balloon Loans Delinquent >= 2 Mo (>=60 Days) / Total Other RE Fixed/Hybrid/Balloon Loans 1.83 1.86 1.7 1.79 -4.1 1.57 -11.9 1.34 -14.8Other Real Estate Adjustable Rate 1 to < 2 Mo (30-59 days) Delinquent 422,765,071 387,879,856 -8.3 390,086,218 0.6 363,367,210 -6.8 287,299,376 -20.9 2 to < 6 Mo (60-179 days) Delinquent 390,447,895 336,970,152 -13.7 302,725,627 -10.2 215,246,876 -28.9 186,055,574 -13.6 6 < 12 Mo (180-365 days) Delinquent 151,085,522 139,173,990 -7.9 113,380,831 -18.5 88,590,014 -21.9 68,256,479 -23.0 12 Mo & Over (>=360 days) Delinquent 88,338,131 95,670,977 8.3 93,729,012 -2.0 84,527,921 -9.8 82,036,790 -2.9 Total Del Other RE Adj Rate Lns >= 2 Mo(>= 2 Mo(> = 60 Days)) 629,871,548 571,815,119 -9.2 509,835,470 -10.8 388,364,811 -23.8 336,348,843 -13.4%Other Real Estate Adjustable Rate Loans Delinquent >= 2 Mo(> = 60 Days) / Total Other RE Adjustable Rate Loans 1.39 1.26 -9.3 1.15 -8.5 0.91 -20.9 0.81 -11.0Leases Receivable 1 to < 2 Mo (30-59 days) Delinquent 9,926,711 5,708,939 -42.5 3,365,334 -41.1 3,612,268 7.3 4,096,713 13.4 2 to < 6 Mo (60-179 days) Delinquent 4,939,653 1,351,755 -72.6 1,463,898 8.3 580,698 -60.3 1,056,035 81.9 6 < 12 Mo (180-365 days) Delinquent 253,166 134,924 -46.7 97,379 -27.8 78,856 -19.0 60,502 -23.3 12 Mo & Over (>=360 days) Delinquent 135 7,484 5,443.7 15,907 112.5 12,592 -20.8 0 -100.0 Total Del Leases Receivable >= 2 Mo (> = 60 Days) 5,192,954 1,494,163 -71.2 1,577,184 5.6 672,146 -57.4 1,116,537 66.1%Leases Receivable Delinquent >= 2 Mo(>= 60 Days) / Total Leases Receivable 0.86 0.33 -61.8 0.36 9.5 0.12 -65.8 0.16 25.9Non-Federally Guaranteed Student Loans 1 to < 2 Mo (30-59 days) Delinquent N/A N/A 12,688,414 21,944,911 73.0 29,789,947 35.7 2 to < 6 Mo (60-179 days) Delinquent N/A N/A 16,679,133 24,002,076 43.9 32,098,552 33.7 6 < 12 Mo (180-365 days) Delinquent N/A N/A 1,579,468 2,353,395 49.0 2,684,049 14.1 12 Mo & Over (>=360 days) Delinquent N/A N/A 828,663 1,183,412 42.8 1,429,715 20.8 Total Del Non-Federally Guaranteed Student Loans >= 2 Mo(> = 60 Days) N/A N/A 19,087,264 27,538,883 44.3 36,212,316 31.5%Non-Federally Guaranteed Student Loans Delinquent >= 2 Mo (>= 60 Days) / Total Non-Federally Guaranteed Student Loans N/A N/A 1.29 1.36 6.1 1.44 5.8# Means the number is too large to display in the cell
7. Delinquent Loan Information
Region: Nation * Peer Group: All * Types Included: All Federally Insured Credit Unions
1 The NCUA Board approved a regulatory/policy change in May 2012 revising the delinquency reporting requirements for troubled debt restructured (TDR) loans. This policy change may result in a decline in delinquent loans reported as of June 2012.
Loan Losses, Bankruptcy Information, and Troubled Debt Restructured LoansReturn to cover For Charter : N/A12/03/2013 Count of CU : 6620CU Name: N/A Asset Range : N/APeer Group: N/A Criteria :
Count of CU in Peer Group : N/A
Dec-2009 Dec-2010 % Chg Dec-2011 % Chg Dec-2012 % Chg Sep-2013 % Chg
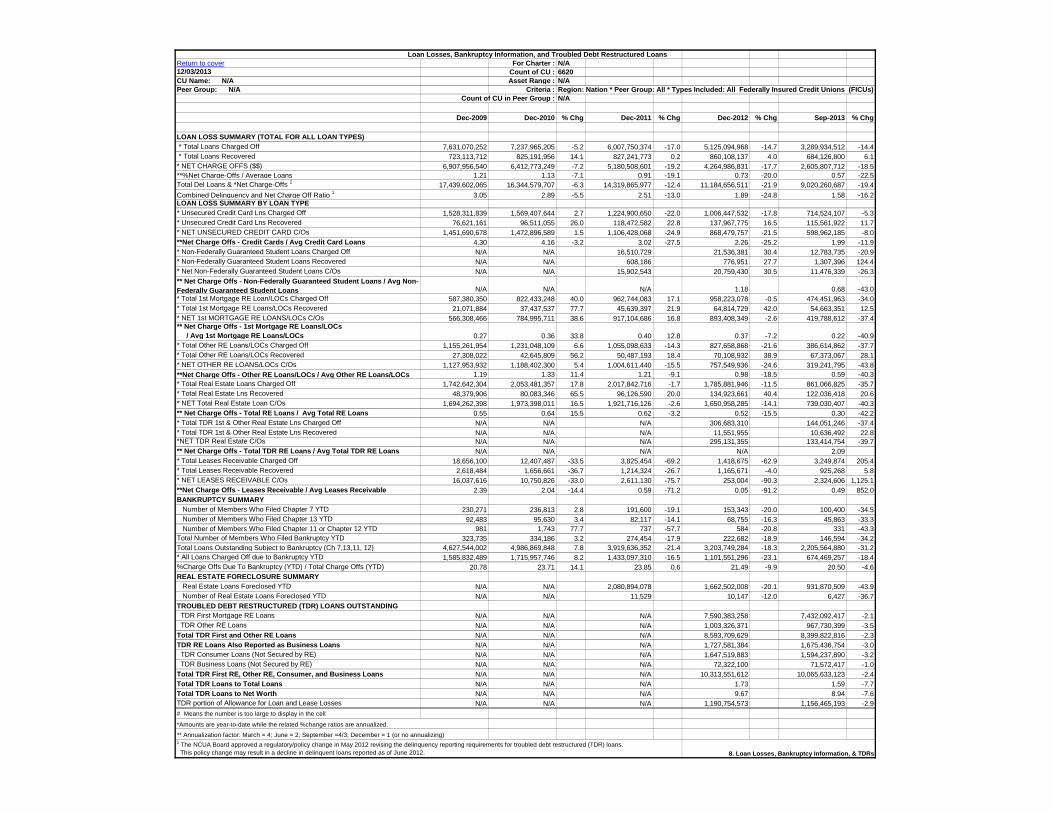
LOAN LOSS SUMMARY (TOTAL FOR ALL LOAN TYPES) * Total Loans Charged Off 7,631,070,252 7,237,965,205 -5.2 6,007,750,374 -17.0 5,125,094,968 -14.7 3,289,934,512 -14.4 * Total Loans Recovered 723,113,712 825,191,956 14.1 827,241,773 0.2 860,108,137 4.0 684,126,800 6.1* NET CHARGE OFFS ($$) 6,907,956,540 6,412,773,249 -7.2 5,180,508,601 -19.2 4,264,986,831 -17.7 2,605,807,712 -18.5**%Net Charge-Offs / Average Loans 1.21 1.13 -7.1 0.91 -19.1 0.73 -20.0 0.57 -22.5Total Del Loans & *Net Charge-Offs 1 17,439,602,065 16,344,579,707 -6.3 14,319,865,977 -12.4 11,184,656,511 -21.9 9,020,260,687 -19.4Combined Delinquency and Net Charge Off Ratio 1 3.05 2.89 -5.5 2.51 -13.0 1.89 -24.8 1.58 -16.2LOAN LOSS SUMMARY BY LOAN TYPE * Unsecured Credit Card Lns Charged Off 1,528,311,839 1,569,407,644 2.7 1,224,900,650 -22.0 1,006,447,532 -17.8 714,524,107 -5.3* Unsecured Credit Card Lns Recovered 76,621,161 96,511,055 26.0 118,472,582 22.8 137,967,775 16.5 115,561,922 11.7* NET UNSECURED CREDIT CARD C/Os 1,451,690,678 1,472,896,589 1.5 1,106,428,068 -24.9 868,479,757 -21.5 598,962,185 -8.0**Net Charge Offs - Credit Cards / Avg Credit Card Loans 4.30 4.16 -3.2 3.02 -27.5 2.26 -25.2 1.99 -11.9* Non-Federally Guaranteed Student Loans Charged Off N/A N/A 16,510,729 21,536,381 30.4 12,783,735 -20.9* Non-Federally Guaranteed Student Loans Recovered N/A N/A 608,186 776,951 27.7 1,307,396 124.4* Net Non-Federally Guaranteed Student Loans C/Os N/A N/A 15,902,543 20,759,430 30.5 11,476,339 -26.3** Net Charge Offs - Non-Federally Guaranteed Student Loans / Avg Non-Federally Guaranteed Student Loans N/A N/A N/A 1.18 0.68 -43.0* Total 1st Mortgage RE Loan/LOCs Charged Off 587,380,350 822,433,248 40.0 962,744,083 17.1 958,223,078 -0.5 474,451,963 -34.0* Total 1st Mortgage RE Loans/LOCs Recovered 21,071,884 37,437,537 77.7 45,639,397 21.9 64,814,729 42.0 54,663,351 12.5* NET 1st MORTGAGE RE LOANS/LOCs C/Os 566,308,466 784,995,711 38.6 917,104,686 16.8 893,408,349 -2.6 419,788,612 -37.4** Net Charge Offs - 1st Mortgage RE Loans/LOCs / Avg 1st Mortgage RE Loans/LOCs 0.27 0.36 33.8 0.40 12.8 0.37 -7.2 0.22 -40.9* Total Other RE Loans/LOCs Charged Off 1,155,261,954 1,231,048,109 6.6 1,055,098,633 -14.3 827,658,868 -21.6 386,614,862 -37.7* Total Other RE Loans/LOCs Recovered 27,308,022 42,645,809 56.2 50,487,193 18.4 70,108,932 38.9 67,373,067 28.1* NET OTHER RE LOANS/LOCs C/Os 1,127,953,932 1,188,402,300 5.4 1,004,611,440 -15.5 757,549,936 -24.6 319,241,795 -43.8**Net Charge Offs - Other RE Loans/LOCs / Avg Other RE Loans/LOCs 1.19 1.33 11.4 1.21 -9.1 0.98 -18.5 0.59 -40.3* Total Real Estate Loans Charged Off 1,742,642,304 2,053,481,357 17.8 2,017,842,716 -1.7 1,785,881,946 -11.5 861,066,825 -35.7* Total Real Estate Lns Recovered 48,379,906 80,083,346 65.5 96,126,590 20.0 134,923,661 40.4 122,036,418 20.6* NET Total Real Estate Loan C/Os 1,694,262,398 1,973,398,011 16.5 1,921,716,126 -2.6 1,650,958,285 -14.1 739,030,407 -40.3** Net Charge Offs - Total RE Loans / Avg Total RE Loans 0.55 0.64 15.5 0.62 -3.2 0.52 -15.5 0.30 -42.2* Total TDR 1st & Other Real Estate Lns Charged Off N/A N/A N/A 306,683,310 144,051,246 -37.4* Total TDR 1st & Other Real Estate Lns Recovered N/A N/A N/A 11,551,955 10,636,492 22.8*NET TDR Real Estate C/Os N/A N/A N/A 295,131,355 133,414,754 -39.7** Net Charge Offs - Total TDR RE Loans / Avg Total TDR RE Loans N/A N/A N/A N/A 2.09 * Total Leases Receivable Charged Off 18,656,100 12,407,487 -33.5 3,825,454 -69.2 1,418,675 -62.9 3,249,874 205.4* Total Leases Receivable Recovered 2,618,484 1,656,661 -36.7 1,214,324 -26.7 1,165,671 -4.0 925,268 5.8* NET LEASES RECEIVABLE C/Os 16,037,616 10,750,826 -33.0 2,611,130 -75.7 253,004 -90.3 2,324,606 1,125.1**Net Charge Offs - Leases Receivable / Avg Leases Receivable 2.39 2.04 -14.4 0.59 -71.2 0.05 -91.2 0.49 852.0BANKRUPTCY SUMMARY Number of Members Who Filed Chapter 7 YTD 230,271 236,813 2.8 191,600 -19.1 153,343 -20.0 100,400 -34.5 Number of Members Who Filed Chapter 13 YTD 92,483 95,630 3.4 82,117 -14.1 68,755 -16.3 45,863 -33.3 Number of Members Who Filed Chapter 11 or Chapter 12 YTD 981 1,743 77.7 737 -57.7 584 -20.8 331 -43.3Total Number of Members Who Filed Bankruptcy YTD 323,735 334,186 3.2 274,454 -17.9 222,682 -18.9 146,594 -34.2Total Loans Outstanding Subject to Bankruptcy (Ch 7,13,11, 12) 4,627,544,002 4,986,869,848 7.8 3,919,636,352 -21.4 3,203,749,284 -18.3 2,205,564,880 -31.2* All Loans Charged Off due to Bankruptcy YTD 1,585,832,489 1,715,957,746 8.2 1,433,097,310 -16.5 1,101,551,296 -23.1 674,469,257 -18.4%Charge Offs Due To Bankruptcy (YTD) / Total Charge Offs (YTD) 20.78 23.71 14.1 23.85 0.6 21.49 -9.9 20.50 -4.6REAL ESTATE FORECLOSURE SUMMARY Real Estate Loans Foreclosed YTD N/A N/A 2,080,894,078 1,662,502,008 -20.1 931,870,509 -43.9 Number of Real Estate Loans Foreclosed YTD N/A N/A 11,529 10,147 -12.0 6,427 -36.7TROUBLED DEBT RESTRUCTURED (TDR) LOANS OUTSTANDING TDR First Mortgage RE Loans N/A N/A N/A 7,590,383,258 7,432,092,417 -2.1 TDR Other RE Loans N/A N/A N/A 1,003,326,371 967,730,399 -3.5Total TDR First and Other RE Loans N/A N/A N/A 8,593,709,629 8,399,822,816 -2.3TDR RE Loans Also Reported as Business Loans N/A N/A N/A 1,727,581,384 1,675,436,754 -3.0 TDR Consumer Loans (Not Secured by RE) N/A N/A N/A 1,647,519,883 1,594,237,890 -3.2 TDR Business Loans (Not Secured by RE) N/A N/A N/A 72,322,100 71,572,417 -1.0Total TDR First RE, Other RE, Consumer, and Business Loans N/A N/A N/A 10,313,551,612 10,065,633,123 -2.4Total TDR Loans to Total Loans N/A N/A N/A 1.73 1.59 -7.7Total TDR Loans to Net Worth N/A N/A N/A 9.67 8.94 -7.6TDR portion of Allowance for Loan and Lease Losses N/A N/A N/A 1,190,754,573 1,156,465,193 -2.9# Means the number is too large to display in the cell
** Annualization factor: March = 4; June = 2; September =4/3; December = 1 (or no annualizing)
Region: Nation * Peer Group: All * Types Included: All Federally Insured Credit Unions (FICUs)
*Amounts are year-to-date while the related %change ratios are annualized.
8. Loan Losses, Bankruptcy Information, & TDRs
1 The NCUA Board approved a regulatory/policy change in May 2012 revising the delinquency reporting requirements for troubled debt restructured (TDR) loans. This policy change may result in a decline in delinquent loans reported as of June 2012.
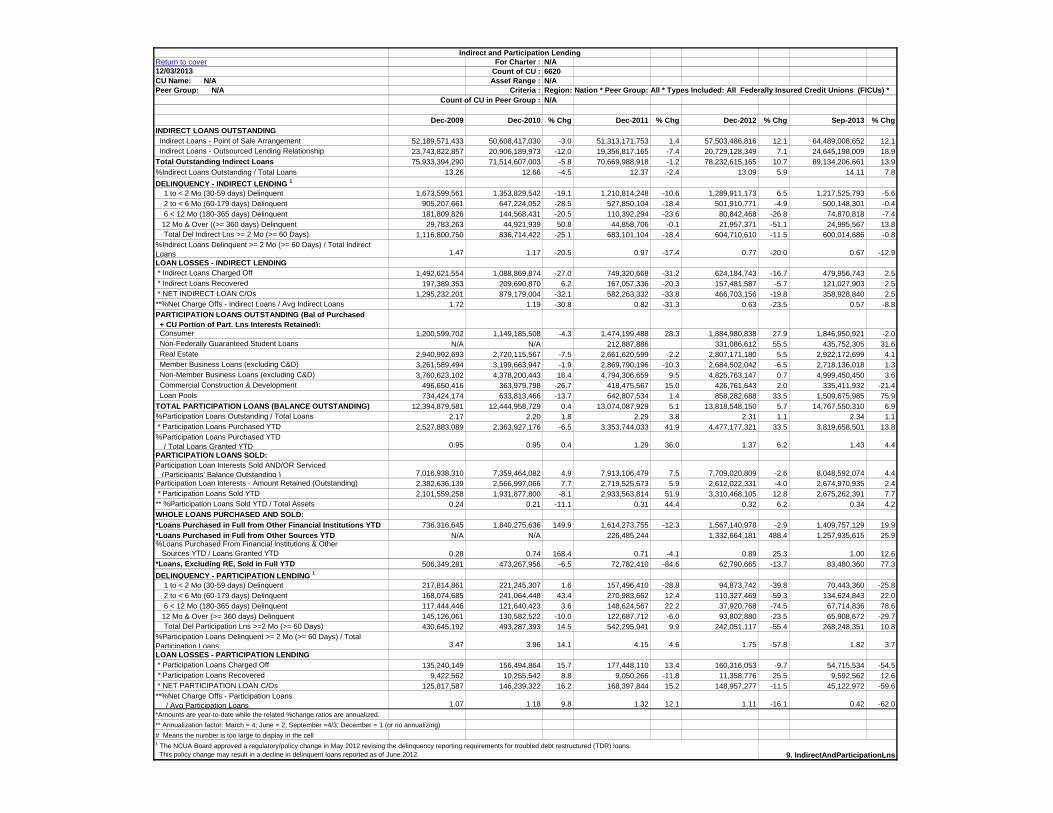
Indirect and Participation LendingReturn to cover For Charter : N/A12/03/2013 Count of CU : 6620CU Name: N/A Asset Range : N/APeer Group: N/A Criteria :
Count of CU in Peer Group : N/A
Dec-2009 Dec-2010 % Chg Dec-2011 % Chg Dec-2012 % Chg Sep-2013 % ChgINDIRECT LOANS OUTSTANDING Indirect Loans - Point of Sale Arrangement 52,189,571,433 50,608,417,030 -3.0 51,313,171,753 1.4 57,503,486,816 12.1 64,489,008,652 12.1 Indirect Loans - Outsourced Lending Relationship 23,743,822,857 20,906,189,973 -12.0 19,356,817,165 -7.4 20,729,128,349 7.1 24,645,198,009 18.9Total Outstanding Indirect Loans 75,933,394,290 71,514,607,003 -5.8 70,669,988,918 -1.2 78,232,615,165 10.7 89,134,206,661 13.9%Indirect Loans Outstanding / Total Loans 13.26 12.66 -4.5 12.37 -2.4 13.09 5.9 14.11 7.8DELINQUENCY - INDIRECT LENDING 1
1 to < 2 Mo (30-59 days) Delinquent 1,673,599,561 1,353,829,542 -19.1 1,210,814,248 -10.6 1,289,911,173 6.5 1,217,525,793 -5.6 2 to < 6 Mo (60-179 days) Delinquent 905,207,661 647,224,052 -28.5 527,850,104 -18.4 501,910,771 -4.9 500,148,301 -0.4 6 < 12 Mo (180-365 days) Delinquent 181,809,826 144,568,431 -20.5 110,392,294 -23.6 80,842,468 -26.8 74,870,818 -7.4 12 Mo & Over ((>= 360 days) Delinquent 29,783,263 44,921,939 50.8 44,858,706 -0.1 21,957,371 -51.1 24,995,567 13.8 Total Del Indirect Lns >= 2 Mo (>= 60 Days) 1,116,800,750 836,714,422 -25.1 683,101,104 -18.4 604,710,610 -11.5 600,014,686 -0.8%Indirect Loans Delinquent >= 2 Mo (>= 60 Days) / Total Indirect Loans 1.47 1.17 -20.5 0.97 -17.4 0.77 -20.0 0.67 -12.9LOAN LOSSES - INDIRECT LENDING * Indirect Loans Charged Off 1,492,621,554 1,088,869,874 -27.0 749,320,668 -31.2 624,184,743 -16.7 479,956,743 2.5 * Indirect Loans Recovered 197,389,353 209,690,870 6.2 167,057,336 -20.3 157,481,587 -5.7 121,027,903 2.5 * NET INDIRECT LOAN C/Os 1,295,232,201 879,179,004 -32.1 582,263,332 -33.8 466,703,156 -19.8 358,928,840 2.5**%Net Charge Offs - Indirect Loans / Avg Indirect Loans 1.72 1.19 -30.8 0.82 -31.3 0.63 -23.5 0.57 -8.8PARTICIPATION LOANS OUTSTANDING (Bal of Purchased + CU Portion of Part. Lns Interests Retained): Consumer 1,200,599,702 1,149,185,508 -4.3 1,474,199,488 28.3 1,884,980,838 27.9 1,846,950,921 -2.0 Non-Federally Guaranteed Student Loans N/A N/A 212,887,886 331,086,612 55.5 435,752,305 31.6 Real Estate 2,940,992,693 2,720,115,567 -7.5 2,661,620,599 -2.2 2,807,171,180 5.5 2,922,172,699 4.1 Member Business Loans (excluding C&D) 3,261,589,494 3,199,663,947 -1.9 2,869,790,196 -10.3 2,684,502,042 -6.5 2,718,136,018 1.3 Non-Member Business Loans (excluding C&D) 3,760,623,102 4,378,200,443 16.4 4,794,306,659 9.5 4,825,763,147 0.7 4,999,450,450 3.6 Commercial Construction & Development 496,650,416 363,979,798 -26.7 418,475,567 15.0 426,761,643 2.0 335,411,932 -21.4 Loan Pools 734,424,174 633,813,466 -13.7 642,807,534 1.4 858,282,688 33.5 1,509,675,985 75.9TOTAL PARTICIPATION LOANS (BALANCE OUTSTANDING) 12,394,879,581 12,444,958,729 0.4 13,074,087,929 5.1 13,818,548,150 5.7 14,767,550,310 6.9%Participation Loans Outstanding / Total Loans 2.17 2.20 1.8 2.29 3.8 2.31 1.1 2.34 1.1 * Participation Loans Purchased YTD 2,527,883,089 2,363,927,176 -6.5 3,353,744,033 41.9 4,477,177,321 33.5 3,819,658,501 13.8%Participation Loans Purchased YTD / Total Loans Granted YTD 0.95 0.95 0.4 1.29 36.0 1.37 6.2 1.43 4.4PARTICIPATION LOANS SOLD:Participation Loan Interests Sold AND/OR Serviced (Participants' Balance Outstanding ) 7,016,938,310 7,359,464,082 4.9 7,913,106,479 7.5 7,709,020,809 -2.6 8,048,592,074 4.4Participation Loan Interests - Amount Retained (Outstanding) 2,382,636,139 2,566,997,066 7.7 2,719,525,673 5.9 2,612,022,331 -4.0 2,674,970,935 2.4 * Participation Loans Sold YTD 2,101,559,258 1,931,877,800 -8.1 2,933,563,814 51.9 3,310,468,105 12.8 2,675,262,391 7.7** %Participation Loans Sold YTD / Total Assets 0.24 0.21 -11.1 0.31 44.4 0.32 6.2 0.34 4.2WHOLE LOANS PURCHASED AND SOLD:*Loans Purchased in Full from Other Financial Institutions YTD 736,316,645 1,840,275,636 149.9 1,614,273,755 -12.3 1,567,140,978 -2.9 1,409,757,129 19.9*Loans Purchased in Full from Other Sources YTD N/A N/A 226,485,244 1,332,664,181 488.4 1,257,935,615 25.9%Loans Purchased From Financial Institutions & Other Sources YTD / Loans Granted YTD 0.28 0.74 168.4 0.71 -4.1 0.89 25.3 1.00 12.6*Loans, Excluding RE, Sold in Full YTD 506,349,281 473,267,956 -6.5 72,782,410 -84.6 62,790,665 -13.7 83,480,360 77.3DELINQUENCY - PARTICIPATION LENDING 1
1 to < 2 Mo (30-59 days) Delinquent 217,814,861 221,245,307 1.6 157,496,410 -28.8 94,873,742 -39.8 70,443,360 -25.8 2 to < 6 Mo (60-179 days) Delinquent 168,074,685 241,064,448 43.4 270,983,662 12.4 110,327,469 -59.3 134,624,843 22.0 6 < 12 Mo (180-365 days) Delinquent 117,444,446 121,640,423 3.6 148,624,567 22.2 37,920,768 -74.5 67,714,836 78.6 12 Mo & Over (>= 360 days) Delinquent 145,126,061 130,582,522 -10.0 122,687,712 -6.0 93,802,880 -23.5 65,908,672 -29.7 Total Del Participation Lns >=2 Mo (>= 60 Days) 430,645,192 493,287,393 14.5 542,295,941 9.9 242,051,117 -55.4 268,248,351 10.8%Participation Loans Delinquent >= 2 Mo (>= 60 Days) / Total Participation Loans 3.47 3.96 14.1 4.15 4.6 1.75 -57.8 1.82 3.7LOAN LOSSES - PARTICIPATION LENDING * Participation Loans Charged Off 135,240,149 156,494,864 15.7 177,448,110 13.4 160,316,053 -9.7 54,715,534 -54.5 * Participation Loans Recovered 9,422,562 10,255,542 8.8 9,050,266 -11.8 11,358,776 25.5 9,592,562 12.6 * NET PARTICIPATION LOAN C/Os 125,817,587 146,239,322 16.2 168,397,844 15.2 148,957,277 -11.5 45,122,972 -59.6**%Net Charge Offs - Participation Loans / Avg Participation Loans 1.07 1.18 9.8 1.32 12.1 1.11 -16.1 0.42 -62.0*Amounts are year-to-date while the related %change ratios are annualized.** Annualization factor: March = 4; June = 2; September =4/3; December = 1 (or no annualizing)# Means the number is too large to display in the cell
9. IndirectAndParticipationLns
Region: Nation * Peer Group: All * Types Included: All Federally Insured Credit Unions (FICUs) *
1 The NCUA Board approved a regulatory/policy change in May 2012 revising the delinquency reporting requirements for troubled debt restructured (TDR) loans. This policy change may result in a decline in delinquent loans reported as of June 2012.
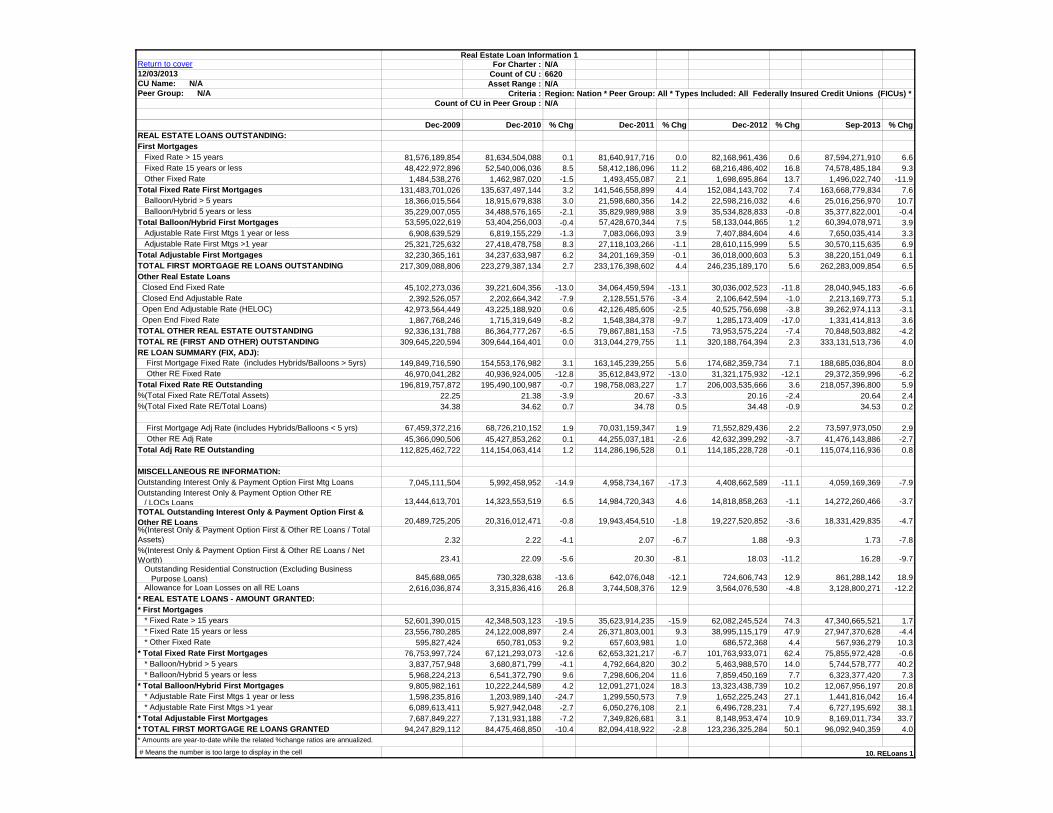
Real Estate Loan Information 1Return to cover For Charter : N/A12/03/2013 Count of CU : 6620CU Name: N/A Asset Range : N/APeer Group: N/A Criteria :
Count of CU in Peer Group : N/A
Dec-2009 Dec-2010 % Chg Dec-2011 % Chg Dec-2012 % Chg Sep-2013 % ChgREAL ESTATE LOANS OUTSTANDING:First Mortgages Fixed Rate > 15 years 81,576,189,854 81,634,504,088 0.1 81,640,917,716 0.0 82,168,961,436 0.6 87,594,271,910 6.6 Fixed Rate 15 years or less 48,422,972,896 52,540,006,036 8.5 58,412,186,096 11.2 68,216,486,402 16.8 74,578,485,184 9.3 Other Fixed Rate 1,484,538,276 1,462,987,020 -1.5 1,493,455,087 2.1 1,698,695,864 13.7 1,496,022,740 -11.9Total Fixed Rate First Mortgages 131,483,701,026 135,637,497,144 3.2 141,546,558,899 4.4 152,084,143,702 7.4 163,668,779,834 7.6 Balloon/Hybrid > 5 years 18,366,015,564 18,915,679,838 3.0 21,598,680,356 14.2 22,598,216,032 4.6 25,016,256,970 10.7 Balloon/Hybrid 5 years or less 35,229,007,055 34,488,576,165 -2.1 35,829,989,988 3.9 35,534,828,833 -0.8 35,377,822,001 -0.4Total Balloon/Hybrid First Mortgages 53,595,022,619 53,404,256,003 -0.4 57,428,670,344 7.5 58,133,044,865 1.2 60,394,078,971 3.9 Adjustable Rate First Mtgs 1 year or less 6,908,639,529 6,819,155,229 -1.3 7,083,066,093 3.9 7,407,884,604 4.6 7,650,035,414 3.3 Adjustable Rate First Mtgs >1 year 25,321,725,632 27,418,478,758 8.3 27,118,103,266 -1.1 28,610,115,999 5.5 30,570,115,635 6.9Total Adjustable First Mortgages 32,230,365,161 34,237,633,987 6.2 34,201,169,359 -0.1 36,018,000,603 5.3 38,220,151,049 6.1TOTAL FIRST MORTGAGE RE LOANS OUTSTANDING 217,309,088,806 223,279,387,134 2.7 233,176,398,602 4.4 246,235,189,170 5.6 262,283,009,854 6.5Other Real Estate Loans Closed End Fixed Rate 45,102,273,036 39,221,604,356 -13.0 34,064,459,594 -13.1 30,036,002,523 -11.8 28,040,945,183 -6.6 Closed End Adjustable Rate 2,392,526,057 2,202,664,342 -7.9 2,128,551,576 -3.4 2,106,642,594 -1.0 2,213,169,773 5.1 Open End Adjustable Rate (HELOC) 42,973,564,449 43,225,188,920 0.6 42,126,485,605 -2.5 40,525,756,698 -3.8 39,262,974,113 -3.1 Open End Fixed Rate 1,867,768,246 1,715,319,649 -8.2 1,548,384,378 -9.7 1,285,173,409 -17.0 1,331,414,813 3.6TOTAL OTHER REAL ESTATE OUTSTANDING 92,336,131,788 86,364,777,267 -6.5 79,867,881,153 -7.5 73,953,575,224 -7.4 70,848,503,882 -4.2TOTAL RE (FIRST AND OTHER) OUTSTANDING 309,645,220,594 309,644,164,401 0.0 313,044,279,755 1.1 320,188,764,394 2.3 333,131,513,736 4.0RE LOAN SUMMARY (FIX, ADJ): First Mortgage Fixed Rate (includes Hybrids/Balloons > 5yrs) 149,849,716,590 154,553,176,982 3.1 163,145,239,255 5.6 174,682,359,734 7.1 188,685,036,804 8.0 Other RE Fixed Rate 46,970,041,282 40,936,924,005 -12.8 35,612,843,972 -13.0 31,321,175,932 -12.1 29,372,359,996 -6.2Total Fixed Rate RE Outstanding 196,819,757,872 195,490,100,987 -0.7 198,758,083,227 1.7 206,003,535,666 3.6 218,057,396,800 5.9%(Total Fixed Rate RE/Total Assets) 22.25 21.38 -3.9 20.67 -3.3 20.16 -2.4 20.64 2.4%(Total Fixed Rate RE/Total Loans) 34.38 34.62 0.7 34.78 0.5 34.48 -0.9 34.53 0.2
First Mortgage Adj Rate (includes Hybrids/Balloons < 5 yrs) 67,459,372,216 68,726,210,152 1.9 70,031,159,347 1.9 71,552,829,436 2.2 73,597,973,050 2.9 Other RE Adj Rate 45,366,090,506 45,427,853,262 0.1 44,255,037,181 -2.6 42,632,399,292 -3.7 41,476,143,886 -2.7Total Adj Rate RE Outstanding 112,825,462,722 114,154,063,414 1.2 114,286,196,528 0.1 114,185,228,728 -0.1 115,074,116,936 0.8
MISCELLANEOUS RE INFORMATION:Outstanding Interest Only & Payment Option First Mtg Loans 7,045,111,504 5,992,458,952 -14.9 4,958,734,167 -17.3 4,408,662,589 -11.1 4,059,169,369 -7.9Outstanding Interest Only & Payment Option Other RE / LOCs Loans 13,444,613,701 14,323,553,519 6.5 14,984,720,343 4.6 14,818,858,263 -1.1 14,272,260,466 -3.7TOTAL Outstanding Interest Only & Payment Option First & Other RE Loans 20,489,725,205 20,316,012,471 -0.8 19,943,454,510 -1.8 19,227,520,852 -3.6 18,331,429,835 -4.7%(Interest Only & Payment Option First & Other RE Loans / Total Assets) 2.32 2.22 -4.1 2.07 -6.7 1.88 -9.3 1.73 -7.8%(Interest Only & Payment Option First & Other RE Loans / Net Worth) 23.41 22.09 -5.6 20.30 -8.1 18.03 -11.2 16.28 -9.7 Outstanding Residential Construction (Excluding Business Purpose Loans) 845,688,065 730,328,638 -13.6 642,076,048 -12.1 724,606,743 12.9 861,288,142 18.9 Allowance for Loan Losses on all RE Loans 2,616,036,874 3,315,836,416 26.8 3,744,508,376 12.9 3,564,076,530 -4.8 3,128,800,271 -12.2* REAL ESTATE LOANS - AMOUNT GRANTED:* First Mortgages * Fixed Rate > 15 years 52,601,390,015 42,348,503,123 -19.5 35,623,914,235 -15.9 62,082,245,524 74.3 47,340,665,521 1.7 * Fixed Rate 15 years or less 23,556,780,285 24,122,008,897 2.4 26,371,803,001 9.3 38,995,115,179 47.9 27,947,370,628 -4.4 * Other Fixed Rate 595,827,424 650,781,053 9.2 657,603,981 1.0 686,572,368 4.4 567,936,279 10.3* Total Fixed Rate First Mortgages 76,753,997,724 67,121,293,073 -12.6 62,653,321,217 -6.7 101,763,933,071 62.4 75,855,972,428 -0.6 * Balloon/Hybrid > 5 years 3,837,757,948 3,680,871,799 -4.1 4,792,664,820 30.2 5,463,988,570 14.0 5,744,578,777 40.2 * Balloon/Hybrid 5 years or less 5,968,224,213 6,541,372,790 9.6 7,298,606,204 11.6 7,859,450,169 7.7 6,323,377,420 7.3* Total Balloon/Hybrid First Mortgages 9,805,982,161 10,222,244,589 4.2 12,091,271,024 18.3 13,323,438,739 10.2 12,067,956,197 20.8 * Adjustable Rate First Mtgs 1 year or less 1,598,235,816 1,203,989,140 -24.7 1,299,550,573 7.9 1,652,225,243 27.1 1,441,816,042 16.4 * Adjustable Rate First Mtgs >1 year 6,089,613,411 5,927,942,048 -2.7 6,050,276,108 2.1 6,496,728,231 7.4 6,727,195,692 38.1* Total Adjustable First Mortgages 7,687,849,227 7,131,931,188 -7.2 7,349,826,681 3.1 8,148,953,474 10.9 8,169,011,734 33.7* TOTAL FIRST MORTGAGE RE LOANS GRANTED 94,247,829,112 84,475,468,850 -10.4 82,094,418,922 -2.8 123,236,325,284 50.1 96,092,940,359 4.0
# Means the number is too large to display in the cell 10. RELoans 1
Region: Nation * Peer Group: All * Types Included: All Federally Insured Credit Unions (FICUs) *
* Amounts are year-to-date while the related %change ratios are annualized.
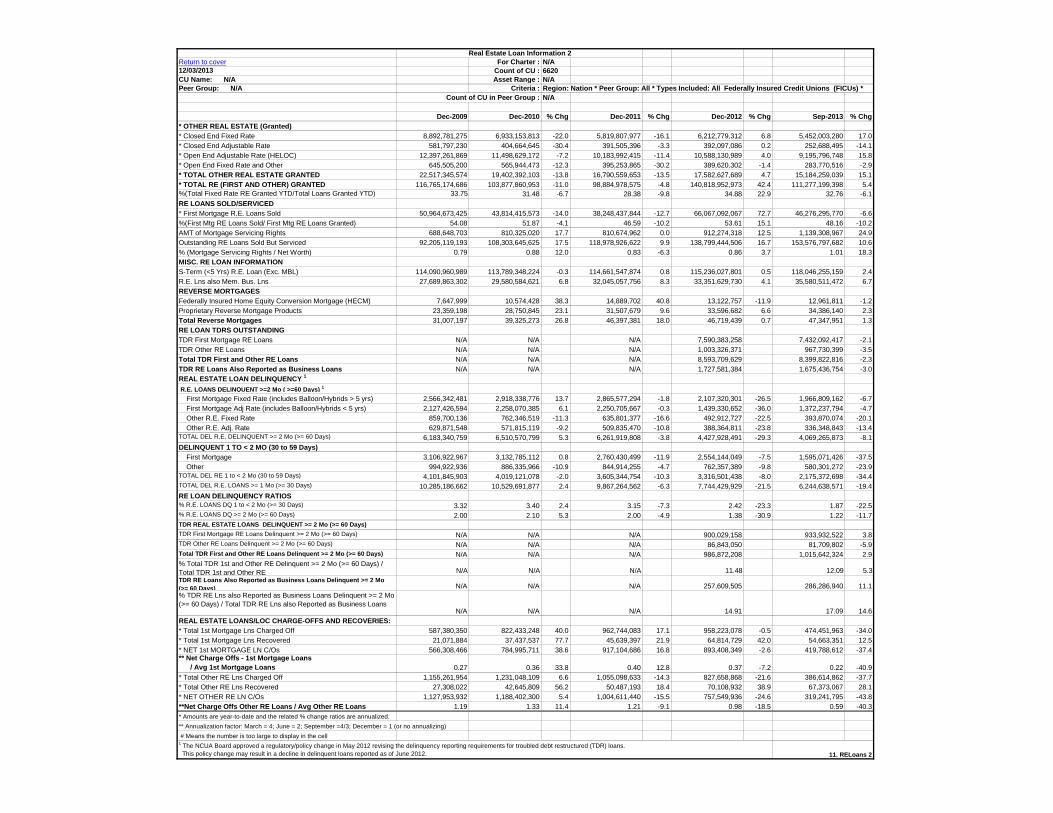
Real Estate Loan Information 2Return to cover For Charter : N/A12/03/2013 Count of CU : 6620CU Name: N/A Asset Range : N/APeer Group: N/A Criteria :
Count of CU in Peer Group : N/A
Dec-2009 Dec-2010 % Chg Dec-2011 % Chg Dec-2012 % Chg Sep-2013 % Chg* OTHER REAL ESTATE (Granted)* Closed End Fixed Rate 8,892,781,275 6,933,153,813 -22.0 5,819,807,977 -16.1 6,212,779,312 6.8 5,452,003,280 17.0* Closed End Adjustable Rate 581,797,230 404,664,645 -30.4 391,505,396 -3.3 392,097,086 0.2 252,688,495 -14.1* Open End Adjustable Rate (HELOC) 12,397,261,869 11,498,629,172 -7.2 10,183,992,415 -11.4 10,588,130,989 4.0 9,195,796,748 15.8* Open End Fixed Rate and Other 645,505,200 565,944,473 -12.3 395,253,865 -30.2 389,620,302 -1.4 283,770,516 -2.9* TOTAL OTHER REAL ESTATE GRANTED 22,517,345,574 19,402,392,103 -13.8 16,790,559,653 -13.5 17,582,627,689 4.7 15,184,259,039 15.1* TOTAL RE (FIRST AND OTHER) GRANTED 116,765,174,686 103,877,860,953 -11.0 98,884,978,575 -4.8 140,818,952,973 42.4 111,277,199,398 5.4%(Total Fixed Rate RE Granted YTD/Total Loans Granted YTD) 33.75 31.48 -6.7 28.38 -9.8 34.88 22.9 32.76 -6.1RE LOANS SOLD/SERVICED* First Mortgage R.E. Loans Sold 50,964,673,425 43,814,415,573 -14.0 38,248,437,844 -12.7 66,067,092,067 72.7 46,276,295,770 -6.6%(First Mtg RE Loans Sold/ First Mtg RE Loans Granted) 54.08 51.87 -4.1 46.59 -10.2 53.61 15.1 48.16 -10.2AMT of Mortgage Servicing Rights 688,648,703 810,325,020 17.7 810,674,962 0.0 912,274,318 12.5 1,139,308,967 24.9Outstanding RE Loans Sold But Serviced 92,205,119,193 108,303,645,625 17.5 118,978,926,622 9.9 138,799,444,506 16.7 153,576,797,682 10.6% (Mortgage Servicing Rights / Net Worth) 0.79 0.88 12.0 0.83 -6.3 0.86 3.7 1.01 18.3MISC. RE LOAN INFORMATIONS-Term (<5 Yrs) R.E. Loan (Exc. MBL) 114,090,960,989 113,789,348,224 -0.3 114,661,547,874 0.8 115,236,027,801 0.5 118,046,255,159 2.4R.E. Lns also Mem. Bus. Lns 27,689,863,302 29,580,584,621 6.8 32,045,057,756 8.3 33,351,629,730 4.1 35,580,511,472 6.7REVERSE MORTGAGESFederally Insured Home Equity Conversion Mortgage (HECM) 7,647,999 10,574,428 38.3 14,889,702 40.8 13,122,757 -11.9 12,961,811 -1.2Proprietary Reverse Mortgage Products 23,359,198 28,750,845 23.1 31,507,679 9.6 33,596,682 6.6 34,386,140 2.3Total Reverse Mortgages 31,007,197 39,325,273 26.8 46,397,381 18.0 46,719,439 0.7 47,347,951 1.3RE LOAN TDRS OUTSTANDINGTDR First Mortgage RE Loans N/A N/A N/A 7,590,383,258 7,432,092,417 -2.1TDR Other RE Loans N/A N/A N/A 1,003,326,371 967,730,399 -3.5Total TDR First and Other RE Loans N/A N/A N/A 8,593,709,629 8,399,822,816 -2.3TDR RE Loans Also Reported as Business Loans N/A N/A N/A 1,727,581,384 1,675,436,754 -3.0REAL ESTATE LOAN DELINQUENCY 1
R.E. LOANS DELINQUENT >=2 Mo ( >=60 Days) 1
First Mortgage Fixed Rate (includes Balloon/Hybrids > 5 yrs) 2,566,342,481 2,918,338,776 13.7 2,865,577,294 -1.8 2,107,320,301 -26.5 1,966,809,162 -6.7 First Mortgage Adj Rate (includes Balloon/Hybrids < 5 yrs) 2,127,426,594 2,258,070,385 6.1 2,250,705,667 -0.3 1,439,330,652 -36.0 1,372,237,794 -4.7 Other R.E. Fixed Rate 859,700,136 762,346,519 -11.3 635,801,377 -16.6 492,912,727 -22.5 393,870,074 -20.1 Other R.E. Adj. Rate 629,871,548 571,815,119 -9.2 509,835,470 -10.8 388,364,811 -23.8 336,348,843 -13.4TOTAL DEL R.E. DELINQUENT >= 2 Mo (>= 60 Days) 6,183,340,759 6,510,570,799 5.3 6,261,919,808 -3.8 4,427,928,491 -29.3 4,069,265,873 -8.1DELINQUENT 1 TO < 2 MO (30 to 59 Days) First Mortgage 3,106,922,967 3,132,785,112 0.8 2,760,430,499 -11.9 2,554,144,049 -7.5 1,595,071,426 -37.5 Other 994,922,936 886,335,966 -10.9 844,914,255 -4.7 762,357,389 -9.8 580,301,272 -23.9TOTAL DEL RE 1 to < 2 Mo (30 to 59 Days) 4,101,845,903 4,019,121,078 -2.0 3,605,344,754 -10.3 3,316,501,438 -8.0 2,175,372,698 -34.4TOTAL DEL R.E. LOANS >= 1 Mo (>= 30 Days) 10,285,186,662 10,529,691,877 2.4 9,867,264,562 -6.3 7,744,429,929 -21.5 6,244,638,571 -19.4RE LOAN DELINQUENCY RATIOS% R.E. LOANS DQ 1 to < 2 Mo (>= 30 Days) 3.32 3.40 2.4 3.15 -7.3 2.42 -23.3 1.87 -22.5% R.E. LOANS DQ >= 2 Mo (>= 60 Days) 2.00 2.10 5.3 2.00 -4.9 1.38 -30.9 1.22 -11.7TDR REAL ESTATE LOANS DELINQUENT >= 2 Mo (>= 60 Days)TDR First Mortgage RE Loans Delinquent >= 2 Mo (>= 60 Days) N/A N/A N/A 900,029,158 933,932,522 3.8TDR Other RE Loans Delinquent >= 2 Mo (>= 60 Days) N/A N/A N/A 86,843,050 81,709,802 -5.9Total TDR First and Other RE Loans Delinquent >= 2 Mo (>= 60 Days) N/A N/A N/A 986,872,208 1,015,642,324 2.9% Total TDR 1st and Other RE Delinquent >= 2 Mo (>= 60 Days) / Total TDR 1st and Other RE N/A N/A N/A 11.48 12.09 5.3TDR RE Loans Also Reported as Business Loans Delinquent >= 2 Mo (>= 60 Days) N/A N/A N/A 257,609,505 286,286,940 11.1% TDR RE Lns also Reported as Business Loans Delinquent >= 2 Mo (>= 60 Days) / Total TDR RE Lns also Reported as Business Loans
N/A N/A N/A 14.91 17.09 14.6REAL ESTATE LOANS/LOC CHARGE-OFFS AND RECOVERIES:* Total 1st Mortgage Lns Charged Off 587,380,350 822,433,248 40.0 962,744,083 17.1 958,223,078 -0.5 474,451,963 -34.0* Total 1st Mortgage Lns Recovered 21,071,884 37,437,537 77.7 45,639,397 21.9 64,814,729 42.0 54,663,351 12.5* NET 1st MORTGAGE LN C/Os 566,308,466 784,995,711 38.6 917,104,686 16.8 893,408,349 -2.6 419,788,612 -37.4** Net Charge Offs - 1st Mortgage Loans / Avg 1st Mortgage Loans 0.27 0.36 33.8 0.40 12.8 0.37 -7.2 0.22 -40.9* Total Other RE Lns Charged Off 1,155,261,954 1,231,048,109 6.6 1,055,098,633 -14.3 827,658,868 -21.6 386,614,862 -37.7* Total Other RE Lns Recovered 27,308,022 42,645,809 56.2 50,487,193 18.4 70,108,932 38.9 67,373,067 28.1* NET OTHER RE LN C/Os 1,127,953,932 1,188,402,300 5.4 1,004,611,440 -15.5 757,549,936 -24.6 319,241,795 -43.8**Net Charge Offs Other RE Loans / Avg Other RE Loans 1.19 1.33 11.4 1.21 -9.1 0.98 -18.5 0.59 -40.3* Amounts are year-to-date and the related % change ratios are annualized.** Annualization factor: March = 4; June = 2; September =4/3; December = 1 (or no annualizing) # Means the number is too large to display in the cell
11. RELoans 2
Region: Nation * Peer Group: All * Types Included: All Federally Insured Credit Unions (FICUs) *
1 The NCUA Board approved a regulatory/policy change in May 2012 revising the delinquency reporting requirements for troubled debt restructured (TDR) loans. This policy change may result in a decline in delinquent loans reported as of June 2012.

Member Business Loan InformationReturn to cover For Charter : N/A12/03/2013 Count of CU : 6620CU Name: N/A Asset Range : N/APeer Group: N/A Criteria :
Count of CU in Peer Group : N/A
Dec-2009 Dec-2010 % Chg Dec-2011 % Chg Dec-2012 % Chg Sep-2013 % ChgBUSINESS LOANSMember Business Loans (NMBLB) 1 28,279,990,864 30,400,595,878 7.5 32,587,182,119 7.2 35,530,981,405 9.0 38,555,753,537 8.5Purchased Business Loans or Participations to Nonmembers (NMBLB) 1 6,795,484,821 6,780,677,729 -0.2 6,564,721,999 -3.2 6,185,208,098 -5.8 6,085,621,969 -1.6 Total Business Loans (NMBLB) 1 35,075,475,685 37,181,273,607 6.0 39,151,904,118 5.3 41,716,189,503 6.5 44,641,375,506 7.0 Unfunded Commitments 1 1,613,346,737 1,594,778,301 -1.2 1,858,932,051 16.6 2,125,640,747 14.3 2,515,639,606 18.3TOTAL BUSINESS LOANS (NMBLB) LESS UNFUNDED COMMITMENTS 1 33,462,128,948 35,586,495,306 6.3 37,292,972,067 4.8 39,590,548,756 6.2 42,125,735,900 6.4%(Total Business Loans (NMBLB) Less Unfunded Commitments/ Total Assets) 1 3.78 3.89 2.9 3.88 -0.4 3.87 -0.1 3.99 2.9NUMBER OF BUSINESS LOANS OUTSTANDING:Number of Outstanding Business Loans to Members 142,084 149,032 4.9 161,190 8.2 175,739 9.0 186,767 6.3Number of Outstanding Purchased Business Loans or Participation Interests to Nonmembers 15,604 16,576 6.2 13,974 -15.7 14,801 5.9 14,081 -4.9Total Number of Business Loans Outstanding 157,688 165,608 5.0 175,164 5.8 190,540 8.8 200,848 5.4REAL ESTATE SECURED BUSINESS LOANS (TO MEMBERS & NON-MEMBERS) Construction and Development N/A N/A 1,539,221,631 1,539,382,249 0.0 1,433,829,932 -6.9 Farmland N/A N/A 741,665,400 814,259,619 9.8 882,982,801 8.4 Non-Farm Residential Property N/A N/A 8,120,185,537 9,385,162,239 15.6 10,430,190,217 11.1 Owner Occupied, Non-Farm, Non-Residential Property N/A N/A 10,117,394,696 10,418,039,016 3.0 10,964,345,395 5.2 Non-Owner Occupied, Non-Farm, Non-Residential Property N/A N/A 12,289,049,719 12,354,821,510 0.5 13,208,724,433 6.9Total Real Estate Secured Business Loans N/A N/A 32,807,516,983 34,511,664,633 5.2 36,920,072,778 7.0NON-REAL ESTATE SECURED BUSINESS LOANS (TO MEMBERS & NON-MEMBERS) Loans to finance agricultural production and other loans to farmers N/A N/A 740,903,019 855,764,053 15.5 890,196,349 4.0 Commercial and Industrial Loans N/A N/A 5,236,405,417 5,926,485,165 13.2 6,341,381,923 7.0 Unsecured Business Loans N/A N/A 94,260,987 90,703,391 -3.8 112,396,429 23.9 Unsecured Revolving Lines of Credit (Business Purpose) N/A N/A 272,817,712 331,572,261 21.5 377,328,027 13.8Total Non-Real Estate Secured Business Loans N/A N/A 6,344,387,135 7,204,524,870 13.6 7,721,302,728 7.2NUMBER OF BUSINESS LOANS OUTSTANDING BY TYPE Number - Construction and Development N/A N/A 2,137 2,171 1.6 2,197 1.2 Number - Farmland N/A N/A 4,893 5,025 2.7 5,162 2.7 Number - Non-Farm Residential Property N/A N/A 51,619 59,269 14.8 64,298 8.5 Number - Owner Occupied, Non-Farm, Non-Residential Property N/A N/A 24,399 26,533 8.7 27,155 2.3 Number - Non-Owner Occupied, Non-Farm, Non-Residential Property N/A N/A 26,696 26,907 0.8 28,109 4.5Total Number of Real Estate Secured Business Loans N/A N/A 109,744 119,905 9.3 126,921 5.9 Number - Loans to finance agricultural production and other loans to farmers N/A N/A 11,045 11,466 3.8 11,311 -1.4 Number - Commercial and Industrial Loans N/A N/A 37,437 38,213 2.1 39,894 4.4 Number - Unsecured Business Loans N/A N/A 2,547 2,824 10.9 2,851 1.0 Number - Unsecured Revolving Lines of Credit (Business Purpose) N/A N/A 14,391 18,132 26.0 19,871 9.6Total Number of Non-Real Estate Secured Business Loans N/A N/A 65,420 70,635 8.0 73,927 4.7AMOUNT OF BUSINESS LOANS GRANTED OR PURCHASED:* MBL (NMBLB) Granted YTD 1 9,439,573,406 10,731,909,508 13.7 11,785,943,031 9.8 14,167,557,481 20.2 12,048,714,962 13.4* Purchased or Participation Interests to Nonmembers (NMBLB) 1 1,332,004,695 1,331,551,475 0.0 1,408,032,039 5.7 1,689,203,435 20.0 1,484,323,638 17.2DELINQUENCY - MEMBER BUSINESS LOANS 2
1 to <2 Mo (30-59 days) Delinquent 548,463,746 595,481,513 8.6 470,560,221 -21.0 397,308,408 -15.6 219,644,683 -44.7 2 to <6 Mo (60-179 days) Delinquent 602,664,514 617,908,743 2.5 628,628,654 1.7 351,333,008 -44.1 320,352,376 -8.8 6 < 12 Mo (180-365 days) Delinquent 360,745,164 390,488,783 8.2 349,549,760 -10.5 207,230,214 -40.7 183,632,198 -11.4 12 Mo & Over (>=360 days) Delinquent 292,638,030 436,037,173 49.0 444,990,364 2.1 302,510,615 -32.0 292,041,495 -3.5 Total Del Loans - All Types >= 2 Mo (>= 60 Days) 1,256,047,708 1,444,434,699 15.0 1,423,168,778 -1.5 861,073,837 -39.5 796,026,069 -7.6MBL DELINQUENCY RATIOS% MBL >= 1 Month Delinquent (All delinquency > = 30 days) 5.39 5.73 6.3 5.08 -11.4 3.18 -37.4 2.41 -24.1% MBL >= 2 Mo (>= 60) Days Delinquent (Reportable delinquency) 3.75 4.06 8.1 3.82 -6.0 2.17 -43.0 1.89 -13.1MBL CHARGE-OFFS AND RECOVERIES:*Total MBL Charge Offs 224,029,781 292,131,922 30.4 373,556,080 27.9 334,889,075 -10.4 134,473,003 -46.5*Total MBL Recoveries 6,548,919 12,571,965 92.0 15,090,687 20.0 15,514,820 2.8 18,254,792 56.9AGRICULTURAL RELATED MBL DELINQUENCY (reported in MBL above)
% MBLs Agricultural Related >= 2 Mo(>= 60 Days) Delinquent (Reportable delinquency) N/A N/A N/A N/A 1 MISCELLANEOUS MBL INFORMATION:Real Estate Loans also Reported as Business Loans 27,689,863,302 29,580,584,621 6.8 32,045,057,756 8.3 33,351,629,730 4.1 35,580,511,472 6.7Construction & Development Loans Meeting 723.3(a) 1,693,971,431 1,476,996,692 -12.8 1384936088 -6.2 1,364,204,462 -1.5 1,266,402,206 -7.2Number of Construction & Development Loans - 723(a) 1,670 1672 0.1 1,793 7.2 1,807 0.8 1,853 2.5Unsecured Business Loans Meeting 723.7(c)-(d) 170,691,125 148,557,889 -13.0 163,836,385 10.3 185,493,077 13.2 229,389,945 23.7Number of Unsecured Business Loans - 723.7(c)-(d) 6,058 6,701 10.6 6,979 4.1 7,048 1.0 7,869 11.6Agricultural Related (NMBLB) 1 1,197,917,677 1,292,611,256 7.9 1,482,568,419 14.7 1,670,023,672 12.6 1,773,179,150 6.2Number of Outstanding Agricultural Related Loans 15,716 15,153 -3.6 15,938 5.2 16,491 3.5 16,473 -0.1* Business Loans and Participations Sold 1,293,972,211 1,507,019,500 16.5 1,673,214,211 11.0 2,054,734,639 22.8 1,658,251,485 7.6SBA Loans Outstanding 601,430,787 697,374,881 16.0 811,246,279 16.3 937,883,530 15.6 1,065,932,881 13.7Number of SBA Loans Outstanding 7,394 8,532 15.4 8,066 -5.5 8,148 1.0 8,102 -0.61 PART 723 REDEFINED MEMBER BUSINESS LOANS IN OCTOBER 2003; * Amounts are year-to-date and the related % change ratios are annualized.
12. MBLs
Region: Nation * Peer Group: All * Types Included: All Federally Insured Credit Unions
2 The NCUA Board approved a regulatory/policy change in May 2012 revising the delinquency reporting requirements for troubled debt restructured (TDR) loans. This policy change may result in a decline in delinquent loans reported as of June 2012.
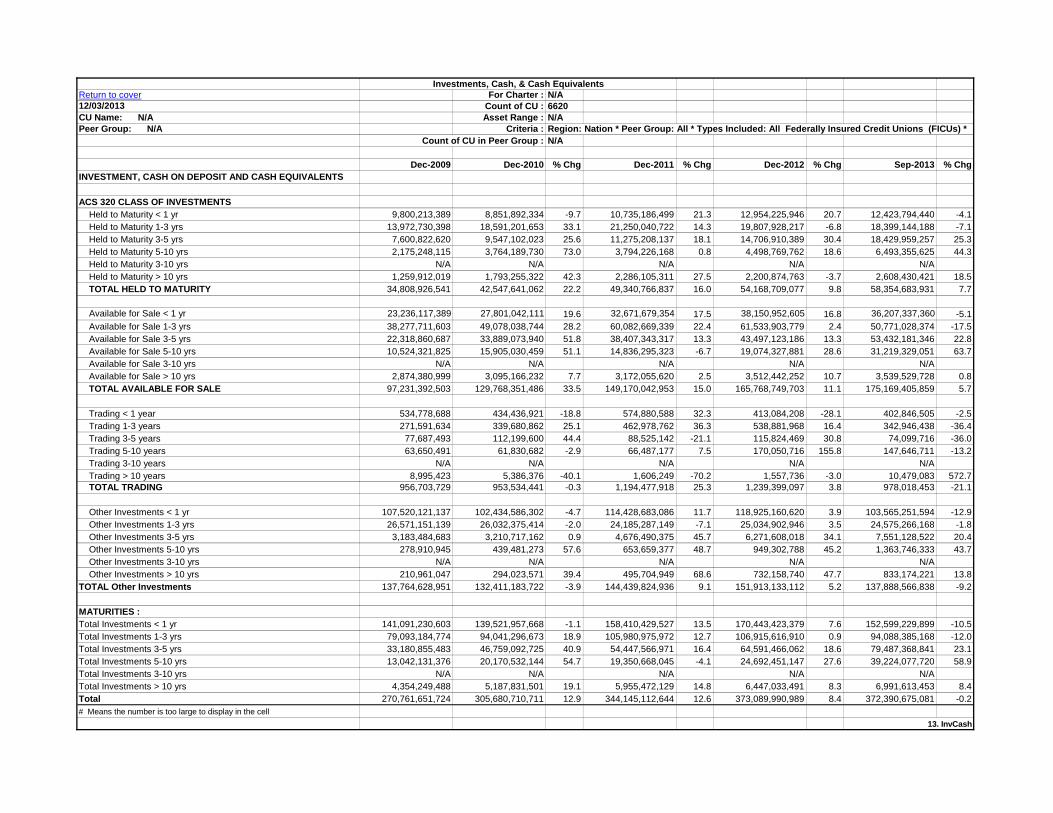
Investments, Cash, & Cash EquivalentsReturn to cover For Charter : N/A12/03/2013 Count of CU : 6620CU Name: N/A Asset Range : N/APeer Group: N/A Criteria :
Count of CU in Peer Group : N/A
Dec-2009 Dec-2010 % Chg Dec-2011 % Chg Dec-2012 % Chg Sep-2013 % ChgINVESTMENT, CASH ON DEPOSIT AND CASH EQUIVALENTS
ACS 320 CLASS OF INVESTMENTS Held to Maturity < 1 yr 9,800,213,389 8,851,892,334 -9.7 10,735,186,499 21.3 12,954,225,946 20.7 12,423,794,440 -4.1 Held to Maturity 1-3 yrs 13,972,730,398 18,591,201,653 33.1 21,250,040,722 14.3 19,807,928,217 -6.8 18,399,144,188 -7.1 Held to Maturity 3-5 yrs 7,600,822,620 9,547,102,023 25.6 11,275,208,137 18.1 14,706,910,389 30.4 18,429,959,257 25.3 Held to Maturity 5-10 yrs 2,175,248,115 3,764,189,730 73.0 3,794,226,168 0.8 4,498,769,762 18.6 6,493,355,625 44.3 Held to Maturity 3-10 yrs N/A N/A N/A N/A N/A Held to Maturity > 10 yrs 1,259,912,019 1,793,255,322 42.3 2,286,105,311 27.5 2,200,874,763 -3.7 2,608,430,421 18.5 TOTAL HELD TO MATURITY 34,808,926,541 42,547,641,062 22.2 49,340,766,837 16.0 54,168,709,077 9.8 58,354,683,931 7.7
Available for Sale < 1 yr 23,236,117,389 27,801,042,111 19.6 32,671,679,354 17.5 38,150,952,605 16.8 36,207,337,360 -5.1 Available for Sale 1-3 yrs 38,277,711,603 49,078,038,744 28.2 60,082,669,339 22.4 61,533,903,779 2.4 50,771,028,374 -17.5 Available for Sale 3-5 yrs 22,318,860,687 33,889,073,940 51.8 38,407,343,317 13.3 43,497,123,186 13.3 53,432,181,346 22.8 Available for Sale 5-10 yrs 10,524,321,825 15,905,030,459 51.1 14,836,295,323 -6.7 19,074,327,881 28.6 31,219,329,051 63.7 Available for Sale 3-10 yrs N/A N/A N/A N/A N/A Available for Sale > 10 yrs 2,874,380,999 3,095,166,232 7.7 3,172,055,620 2.5 3,512,442,252 10.7 3,539,529,728 0.8 TOTAL AVAILABLE FOR SALE 97,231,392,503 129,768,351,486 33.5 149,170,042,953 15.0 165,768,749,703 11.1 175,169,405,859 5.7 Trading < 1 year 534,778,688 434,436,921 -18.8 574,880,588 32.3 413,084,208 -28.1 402,846,505 -2.5 Trading 1-3 years 271,591,634 339,680,862 25.1 462,978,762 36.3 538,881,968 16.4 342,946,438 -36.4 Trading 3-5 years 77,687,493 112,199,600 44.4 88,525,142 -21.1 115,824,469 30.8 74,099,716 -36.0 Trading 5-10 years 63,650,491 61,830,682 -2.9 66,487,177 7.5 170,050,716 155.8 147,646,711 -13.2 Trading 3-10 years N/A N/A N/A N/A N/A Trading > 10 years 8,995,423 5,386,376 -40.1 1,606,249 -70.2 1,557,736 -3.0 10,479,083 572.7 TOTAL TRADING 956,703,729 953,534,441 -0.3 1,194,477,918 25.3 1,239,399,097 3.8 978,018,453 -21.1
Other Investments < 1 yr 107,520,121,137 102,434,586,302 -4.7 114,428,683,086 11.7 118,925,160,620 3.9 103,565,251,594 -12.9 Other Investments 1-3 yrs 26,571,151,139 26,032,375,414 -2.0 24,185,287,149 -7.1 25,034,902,946 3.5 24,575,266,168 -1.8 Other Investments 3-5 yrs 3,183,484,683 3,210,717,162 0.9 4,676,490,375 45.7 6,271,608,018 34.1 7,551,128,522 20.4 Other Investments 5-10 yrs 278,910,945 439,481,273 57.6 653,659,377 48.7 949,302,788 45.2 1,363,746,333 43.7 Other Investments 3-10 yrs N/A N/A N/A N/A N/A Other Investments > 10 yrs 210,961,047 294,023,571 39.4 495,704,949 68.6 732,158,740 47.7 833,174,221 13.8TOTAL Other Investments 137,764,628,951 132,411,183,722 -3.9 144,439,824,936 9.1 151,913,133,112 5.2 137,888,566,838 -9.2
MATURITIES :Total Investments < 1 yr 141,091,230,603 139,521,957,668 -1.1 158,410,429,527 13.5 170,443,423,379 7.6 152,599,229,899 -10.5Total Investments 1-3 yrs 79,093,184,774 94,041,296,673 18.9 105,980,975,972 12.7 106,915,616,910 0.9 94,088,385,168 -12.0Total Investments 3-5 yrs 33,180,855,483 46,759,092,725 40.9 54,447,566,971 16.4 64,591,466,062 18.6 79,487,368,841 23.1Total Investments 5-10 yrs 13,042,131,376 20,170,532,144 54.7 19,350,668,045 -4.1 24,692,451,147 27.6 39,224,077,720 58.9Total Investments 3-10 yrs N/A N/A N/A N/A N/A Total Investments > 10 yrs 4,354,249,488 5,187,831,501 19.1 5,955,472,129 14.8 6,447,033,491 8.3 6,991,613,453 8.4Total 270,761,651,724 305,680,710,711 12.9 344,145,112,644 12.6 373,089,990,989 8.4 372,390,675,081 -0.2# Means the number is too large to display in the cell
13. InvCash
Region: Nation * Peer Group: All * Types Included: All Federally Insured Credit Unions (FICUs) *
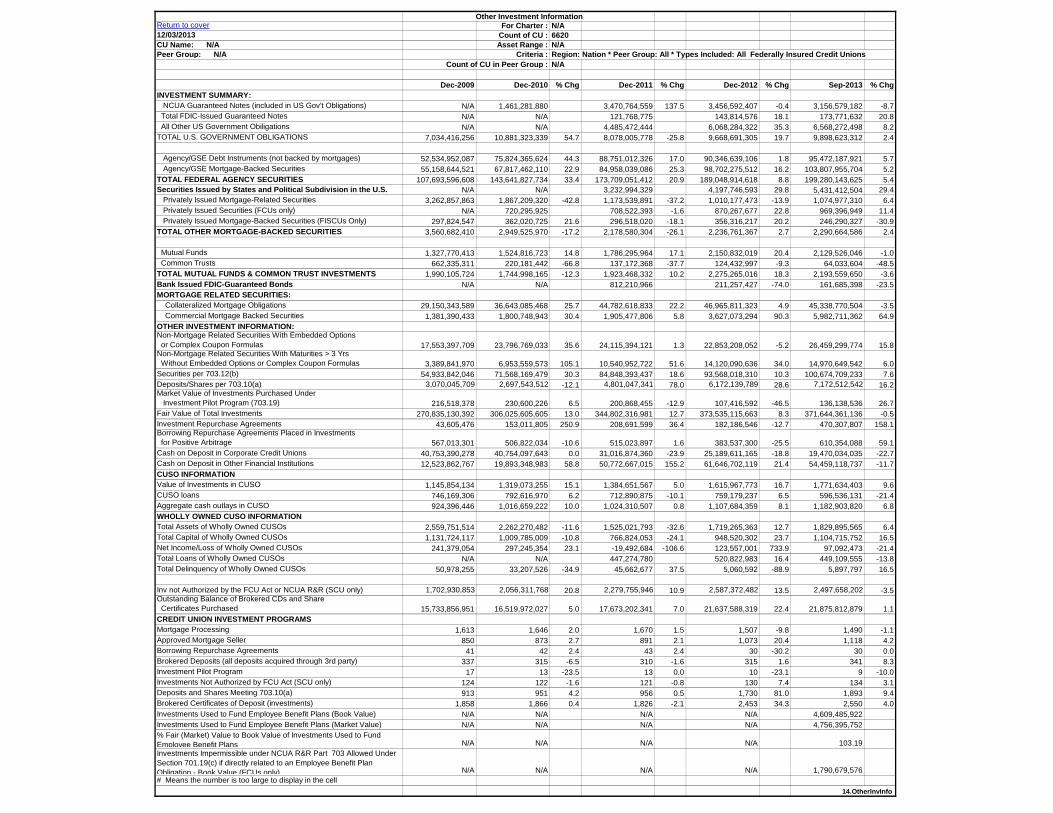
Other Investment InformationReturn to cover For Charter : N/A12/03/2013 Count of CU : 6620CU Name: N/A Asset Range : N/APeer Group: N/A Criteria :
Count of CU in Peer Group : N/A
Dec-2009 Dec-2010 % Chg Dec-2011 % Chg Dec-2012 % Chg Sep-2013 % ChgINVESTMENT SUMMARY: NCUA Guaranteed Notes (included in US Gov't Obligations) N/A 1,461,281,880 3,470,764,559 137.5 3,456,592,407 -0.4 3,156,579,182 -8.7 Total FDIC-Issued Guaranteed Notes N/A N/A 121,768,775 143,814,576 18.1 173,771,632 20.8 All Other US Government Obiligations N/A N/A 4,485,472,444 6,068,284,322 35.3 6,568,272,498 8.2TOTAL U.S. GOVERNMENT OBLIGATIONS 7,034,416,256 10,881,323,339 54.7 8,078,005,778 -25.8 9,668,691,305 19.7 9,898,623,312 2.4
Agency/GSE Debt Instruments (not backed by mortgages) 52,534,952,087 75,824,365,624 44.3 88,751,012,326 17.0 90,346,639,106 1.8 95,472,187,921 5.7 Agency/GSE Mortgage-Backed Securities 55,158,644,521 67,817,462,110 22.9 84,958,039,086 25.3 98,702,275,512 16.2 103,807,955,704 5.2TOTAL FEDERAL AGENCY SECURITIES 107,693,596,608 143,641,827,734 33.4 173,709,051,412 20.9 189,048,914,618 8.8 199,280,143,625 5.4Securities Issued by States and Political Subdivision in the U.S. N/A N/A 3,232,994,329 4,197,746,593 29.8 5,431,412,504 29.4 Privately Issued Mortgage-Related Securities 3,262,857,863 1,867,209,320 -42.8 1,173,539,891 -37.2 1,010,177,473 -13.9 1,074,977,310 6.4 Privately Issued Securities (FCUs only) N/A 720,295,925 708,522,393 -1.6 870,267,677 22.8 969,396,949 11.4 Privately Issued Mortgage-Backed Securities (FISCUs Only) 297,824,547 362,020,725 21.6 296,518,020 -18.1 356,316,217 20.2 246,290,327 -30.9TOTAL OTHER MORTGAGE-BACKED SECURITIES 3,560,682,410 2,949,525,970 -17.2 2,178,580,304 -26.1 2,236,761,367 2.7 2,290,664,586 2.4
Mutual Funds 1,327,770,413 1,524,816,723 14.8 1,786,295,964 17.1 2,150,832,019 20.4 2,129,526,046 -1.0 Common Trusts 662,335,311 220,181,442 -66.8 137,172,368 -37.7 124,432,997 -9.3 64,033,604 -48.5TOTAL MUTUAL FUNDS & COMMON TRUST INVESTMENTS 1,990,105,724 1,744,998,165 -12.3 1,923,468,332 10.2 2,275,265,016 18.3 2,193,559,650 -3.6Bank Issued FDIC-Guaranteed Bonds N/A N/A 812,210,966 211,257,427 -74.0 161,685,398 -23.5MORTGAGE RELATED SECURITIES: Collateralized Mortgage Obligations 29,150,343,589 36,643,085,468 25.7 44,782,618,833 22.2 46,965,811,323 4.9 45,338,770,504 -3.5 Commercial Mortgage Backed Securities 1,381,390,433 1,800,748,943 30.4 1,905,477,806 5.8 3,627,073,294 90.3 5,982,711,362 64.9OTHER INVESTMENT INFORMATION:Non-Mortgage Related Securities With Embedded Options or Complex Coupon Formulas 17,553,397,709 23,796,769,033 35.6 24,115,394,121 1.3 22,853,208,052 -5.2 26,459,299,774 15.8Non-Mortgage Related Securities With Maturities > 3 Yrs Without Embedded Options or Complex Coupon Formulas 3,389,841,970 6,953,559,573 105.1 10,540,952,722 51.6 14,120,090,636 34.0 14,970,649,542 6.0Securities per 703.12(b) 54,933,842,046 71,568,169,479 30.3 84,848,393,437 18.6 93,568,018,310 10.3 100,674,709,233 7.6Deposits/Shares per 703.10(a) 3,070,045,709 2,697,543,512 -12.1 4,801,047,341 78.0 6,172,139,789 28.6 7,172,512,542 16.2Market Value of Investments Purchased Under Investment Pilot Program (703.19) 216,518,378 230,600,226 6.5 200,868,455 -12.9 107,416,592 -46.5 136,138,536 26.7Fair Value of Total Investments 270,835,130,392 306,025,605,605 13.0 344,802,316,981 12.7 373,535,115,663 8.3 371,644,361,136 -0.5Investment Repurchase Agreements 43,605,476 153,011,805 250.9 208,691,599 36.4 182,186,546 -12.7 470,307,807 158.1Borrowing Repurchase Agreements Placed in Investments for Positive Arbitrage 567,013,301 506,822,034 -10.6 515,023,897 1.6 383,537,300 -25.5 610,354,088 59.1Cash on Deposit in Corporate Credit Unions 40,753,390,278 40,754,097,643 0.0 31,016,874,360 -23.9 25,189,611,165 -18.8 19,470,034,035 -22.7Cash on Deposit in Other Financial Institutions 12,523,862,767 19,893,348,983 58.8 50,772,667,015 155.2 61,646,702,119 21.4 54,459,118,737 -11.7CUSO INFORMATIONValue of Investments in CUSO 1,145,854,134 1,319,073,255 15.1 1,384,651,567 5.0 1,615,967,773 16.7 1,771,634,403 9.6CUSO loans 746,169,306 792,616,970 6.2 712,890,875 -10.1 759,179,237 6.5 596,536,131 -21.4Aggregate cash outlays in CUSO 924,396,446 1,016,659,222 10.0 1,024,310,507 0.8 1,107,684,359 8.1 1,182,903,820 6.8WHOLLY OWNED CUSO INFORMATIONTotal Assets of Wholly Owned CUSOs 2,559,751,514 2,262,270,482 -11.6 1,525,021,793 -32.6 1,719,265,363 12.7 1,829,895,565 6.4Total Capital of Wholly Owned CUSOs 1,131,724,117 1,009,785,009 -10.8 766,824,053 -24.1 948,520,302 23.7 1,104,715,752 16.5Net Income/Loss of Wholly Owned CUSOs 241,379,054 297,245,354 23.1 -19,492,684 -106.6 123,557,001 733.9 97,092,473 -21.4Total Loans of Wholly Owned CUSOs N/A N/A 447,274,780 520,822,983 16.4 449,109,555 -13.8Total Delinquency of Wholly Owned CUSOs 50,978,255 33,207,526 -34.9 45,662,677 37.5 5,060,592 -88.9 5,897,797 16.5
Inv not Authorized by the FCU Act or NCUA R&R (SCU only) 1,702,930,853 2,056,311,768 20.8 2,279,755,946 10.9 2,587,372,482 13.5 2,497,658,202 -3.5Outstanding Balance of Brokered CDs and Share Certificates Purchased 15,733,856,951 16,519,972,027 5.0 17,673,202,341 7.0 21,637,588,319 22.4 21,875,812,879 1.1CREDIT UNION INVESTMENT PROGRAMSMortgage Processing 1,613 1,646 2.0 1,670 1.5 1,507 -9.8 1,490 -1.1Approved Mortgage Seller 850 873 2.7 891 2.1 1,073 20.4 1,118 4.2Borrowing Repurchase Agreements 41 42 2.4 43 2.4 30 -30.2 30 0.0Brokered Deposits (all deposits acquired through 3rd party) 337 315 -6.5 310 -1.6 315 1.6 341 8.3Investment Pilot Program 17 13 -23.5 13 0.0 10 -23.1 9 -10.0Investments Not Authorized by FCU Act (SCU only) 124 122 -1.6 121 -0.8 130 7.4 134 3.1Deposits and Shares Meeting 703.10(a) 913 951 4.2 956 0.5 1,730 81.0 1,893 9.4Brokered Certificates of Deposit (investments) 1,858 1,866 0.4 1,826 -2.1 2,453 34.3 2,550 4.0Investments Used to Fund Employee Benefit Plans (Book Value) N/A N/A N/A N/A 4,609,485,922 Investments Used to Fund Employee Benefit Plans (Market Value) N/A N/A N/A N/A 4,756,395,752 % Fair (Market) Value to Book Value of Investments Used to Fund Employee Benefit Plans N/A N/A N/A N/A 103.19 Investments Impermissible under NCUA R&R Part 703 Allowed Under Section 701.19(c) if directly related to an Employee Benefit Plan Obligation - Book Value (FCUs only) N/A N/A N/A N/A 1,790,679,576 # Means the number is too large to display in the cell
14.OtherInvInfo
Region: Nation * Peer Group: All * Types Included: All Federally Insured Credit Unions
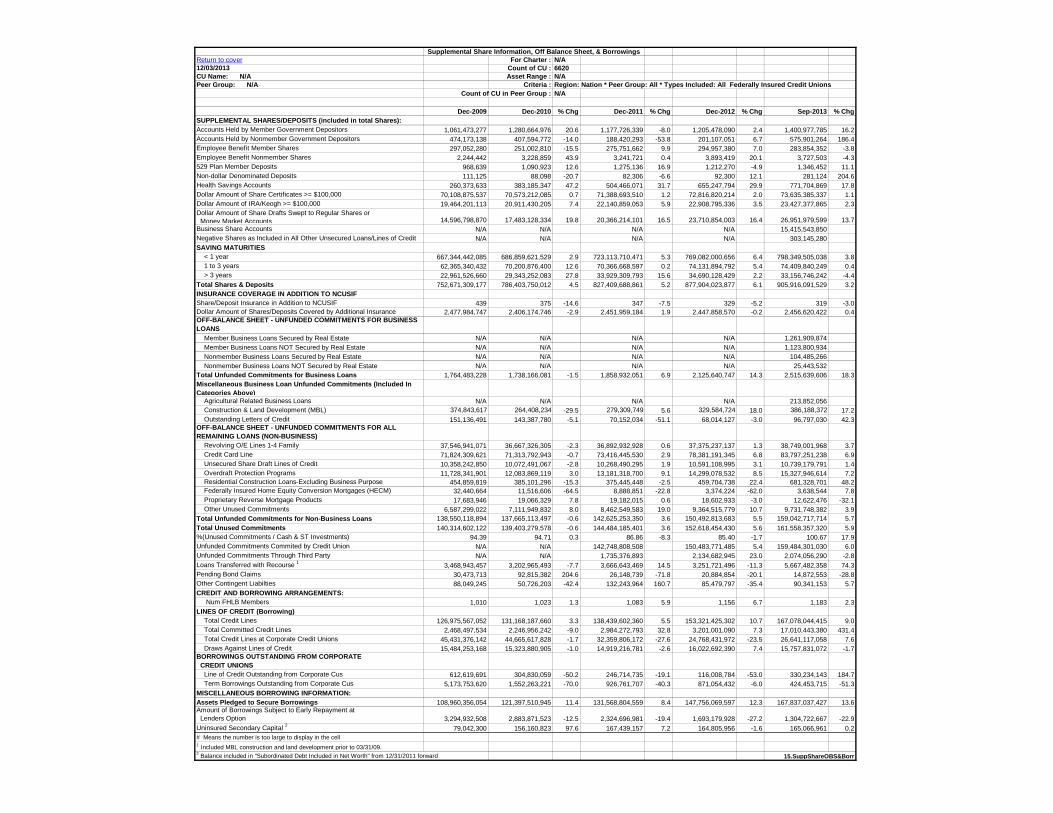
Supplemental Share Information, Off Balance Sheet, & Borrowings Return to cover For Charter : N/A12/03/2013 Count of CU : 6620CU Name: N/A Asset Range : N/APeer Group: N/A Criteria :
Count of CU in Peer Group : N/A
Dec-2009 Dec-2010 % Chg Dec-2011 % Chg Dec-2012 % Chg Sep-2013 % ChgSUPPLEMENTAL SHARES/DEPOSITS (included in total Shares):Accounts Held by Member Government Depositors 1,061,473,277 1,280,664,976 20.6 1,177,726,339 -8.0 1,205,478,090 2.4 1,400,977,785 16.2Accounts Held by Nonmember Government Depositors 474,173,138 407,594,772 -14.0 188,420,293 -53.8 201,107,051 6.7 575,901,264 186.4Employee Benefit Member Shares 297,052,280 251,002,810 -15.5 275,751,662 9.9 294,957,380 7.0 283,854,352 -3.8Employee Benefit Nonmember Shares 2,244,442 3,228,859 43.9 3,241,721 0.4 3,893,419 20.1 3,727,503 -4.3529 Plan Member Deposits 968,639 1,090,923 12.6 1,275,136 16.9 1,212,270 -4.9 1,346,452 11.1Non-dollar Denominated Deposits 111,125 88,098 -20.7 82,306 -6.6 92,300 12.1 281,124 204.6Health Savings Accounts 260,373,633 383,185,347 47.2 504,466,071 31.7 655,247,794 29.9 771,704,869 17.8Dollar Amount of Share Certificates >= $100,000 70,108,875,537 70,573,212,085 0.7 71,388,693,510 1.2 72,816,820,214 2.0 73,635,385,337 1.1Dollar Amount of IRA/Keogh >= $100,000 19,464,201,113 20,911,430,205 7.4 22,140,859,053 5.9 22,908,795,336 3.5 23,427,377,865 2.3Dollar Amount of Share Drafts Swept to Regular Shares or Money Market Accounts 14,596,798,870 17,483,128,334 19.8 20,366,214,101 16.5 23,710,854,003 16.4 26,951,979,599 13.7Business Share Accounts N/A N/A N/A N/A 15,415,543,850 Negative Shares as Included in All Other Unsecured Loans/Lines of Credit N/A N/A N/A N/A 303,145,280 SAVING MATURITIES < 1 year 667,344,442,085 686,859,621,529 2.9 723,113,710,471 5.3 769,082,000,656 6.4 798,349,505,038 3.8 1 to 3 years 62,365,340,432 70,200,876,400 12.6 70,366,668,597 0.2 74,131,894,792 5.4 74,409,840,249 0.4 > 3 years 22,961,526,660 29,343,252,083 27.8 33,929,309,793 15.6 34,690,128,429 2.2 33,156,746,242 -4.4Total Shares & Deposits 752,671,309,177 786,403,750,012 4.5 827,409,688,861 5.2 877,904,023,877 6.1 905,916,091,529 3.2INSURANCE COVERAGE IN ADDITION TO NCUSIFShare/Deposit Insurance in Addition to NCUSIF 439 375 -14.6 347 -7.5 329 -5.2 319 -3.0Dollar Amount of Shares/Deposits Covered by Additional Insurance 2,477,984,747 2,406,174,746 -2.9 2,451,959,184 1.9 2,447,858,570 -0.2 2,456,620,422 0.4OFF-BALANCE SHEET - UNFUNDED COMMITMENTS FOR BUSINESS LOANS Member Business Loans Secured by Real Estate N/A N/A N/A N/A 1,261,909,874 Member Business Loans NOT Secured by Real Estate N/A N/A N/A N/A 1,123,800,934 Nonmember Business Loans Secured by Real Estate N/A N/A N/A N/A 104,485,266 Nonmember Business Loans NOT Secured by Real Estate N/A N/A N/A N/A 25,443,532 Total Unfunded Commitments for Business Loans 1,764,483,228 1,738,166,081 -1.5 1,858,932,051 6.9 2,125,640,747 14.3 2,515,639,606 18.3Miscellaneous Business Loan Unfunded Commitments (Included In Categories Above) Agricultural Related Business Loans N/A N/A N/A N/A 213,852,056 Construction & Land Development (MBL) 374,843,617 264,408,234 -29.5 279,309,749 5.6 329,584,724 18.0 386,188,372 17.2 Outstanding Letters of Credit 151,136,491 143,387,780 -5.1 70,152,034 -51.1 68,014,127 -3.0 96,797,030 42.3OFF-BALANCE SHEET - UNFUNDED COMMITMENTS FOR ALL REMAINING LOANS (NON-BUSINESS) Revolving O/E Lines 1-4 Family 37,546,941,071 36,667,326,305 -2.3 36,892,932,928 0.6 37,375,237,137 1.3 38,749,001,968 3.7 Credit Card Line 71,824,309,621 71,313,792,943 -0.7 73,416,445,530 2.9 78,381,191,345 6.8 83,797,251,238 6.9 Unsecured Share Draft Lines of Credit 10,358,242,850 10,072,491,067 -2.8 10,268,490,295 1.9 10,591,108,995 3.1 10,739,179,791 1.4 Overdraft Protection Programs 11,728,341,901 12,083,869,119 3.0 13,181,318,700 9.1 14,299,078,532 8.5 15,327,946,614 7.2 Residential Construction Loans-Excluding Business Purpose 454,859,819 385,101,296 -15.3 375,445,448 -2.5 459,704,738 22.4 681,328,701 48.2 Federally Insured Home Equity Conversion Mortgages (HECM) 32,440,664 11,516,606 -64.5 8,888,851 -22.8 3,374,224 -62.0 3,638,544 7.8 Proprietary Reverse Mortgage Products 17,683,946 19,066,329 7.8 19,182,015 0.6 18,602,933 -3.0 12,622,476 -32.1 Other Unused Commitments 6,587,299,022 7,111,949,832 8.0 8,462,549,583 19.0 9,364,515,779 10.7 9,731,748,382 3.9Total Unfunded Commitments for Non-Business Loans 138,550,118,894 137,665,113,497 -0.6 142,625,253,350 3.6 150,492,813,683 5.5 159,042,717,714 5.7Total Unused Commitments 140,314,602,122 139,403,279,578 -0.6 144,484,185,401 3.6 152,618,454,430 5.6 161,558,357,320 5.9%(Unused Commitments / Cash & ST Investments) 94.39 94.71 0.3 86.86 -8.3 85.40 -1.7 100.67 17.9Unfunded Commitments Commited by Credit Union N/A N/A 142,748,808,508 150,483,771,485 5.4 159,484,301,030 6.0Unfunded Commitments Through Third Party N/A N/A 1,735,376,893 2,134,682,945 23.0 2,074,056,290 -2.8Loans Transferred with Recourse 1 3,468,943,457 3,202,965,493 -7.7 3,666,643,469 14.5 3,251,721,496 -11.3 5,667,482,358 74.3Pending Bond Claims 30,473,713 92,815,382 204.6 26,148,739 -71.8 20,884,854 -20.1 14,872,553 -28.8Other Contingent Liabilties 88,049,245 50,726,203 -42.4 132,243,964 160.7 85,479,797 -35.4 90,341,153 5.7CREDIT AND BORROWING ARRANGEMENTS: Num FHLB Members 1,010 1,023 1.3 1,083 5.9 1,156 6.7 1,183 2.3LINES OF CREDIT (Borrowing) Total Credit Lines 126,975,567,052 131,168,187,660 3.3 138,439,602,360 5.5 153,321,425,302 10.7 167,078,044,415 9.0 Total Committed Credit Lines 2,468,497,534 2,246,956,242 -9.0 2,984,272,793 32.8 3,201,001,090 7.3 17,010,443,380 431.4 Total Credit Lines at Corporate Credit Unions 45,431,376,142 44,665,617,828 -1.7 32,359,806,172 -27.6 24,768,431,972 -23.5 26,641,117,058 7.6 Draws Against Lines of Credit 15,484,253,168 15,323,880,905 -1.0 14,919,216,781 -2.6 16,022,692,390 7.4 15,757,831,072 -1.7BORROWINGS OUTSTANDING FROM CORPORATE CREDIT UNIONS Line of Credit Outstanding from Corporate Cus 612,619,691 304,830,059 -50.2 246,714,735 -19.1 116,008,784 -53.0 330,234,143 184.7 Term Borrowings Outstanding from Corporate Cus 5,173,753,620 1,552,263,221 -70.0 926,761,707 -40.3 871,054,432 -6.0 424,453,715 -51.3MISCELLANEOUS BORROWING INFORMATION:Assets Pledged to Secure Borrowings 108,960,356,054 121,397,510,945 11.4 131,568,804,559 8.4 147,756,069,597 12.3 167,837,037,427 13.6Amount of Borrowings Subject to Early Repayment at Lenders Option 3,294,932,508 2,883,871,523 -12.5 2,324,696,981 -19.4 1,693,179,928 -27.2 1,304,722,667 -22.9Uninsured Secondary Capital 2 79,042,300 156,160,823 97.6 167,439,157 7.2 164,805,956 -1.6 165,066,961 0.2# Means the number is too large to display in the cell1 Included MBL construction and land development prior to 03/31/09.2 Balance included in "Subordinated Debt Included in Net Worth" from 12/31/2011 forward 15.SuppShareOBS&Borr
Region: Nation * Peer Group: All * Types Included: All Federally Insured Credit Unions

Miscellaneous Information, Programs, ServicesReturn to cover For Charter : N/A12/03/2013 Count of CU : 6620CU Name: N/A Asset Range : N/APeer Group: N/A Criteria :
Count of CU in Peer Group : N/A
Dec-2009 Dec-2010 % Chg Dec-2011 % Chg Dec-2012 % Chg Sep-2013 % ChgMEMBERSHIP: Num Current Members 89,873,931 90,483,958 0.7 91,826,311 1.5 93,817,696 2.2 95,911,613 2.2 Num Potential Members 1,368,599,260 1,473,469,174 7.7 1,537,932,901 4.4 1,627,970,287 5.9 1,725,622,813 6.0 % Current Members to Potential Members 6.57 6.14 -6.5 5.97 -2.8 5.76 -3.5 5.56 -3.6* % Membership Growth 1.46 0.68 -53.6 1.48 118.6 2.17 46.2 2.98 37.2 Total Num Savings Accts 166,305,140 168,311,192 1.2 170,376,601 1.2 175,410,554 3.0 180,430,486 2.9EMPLOYEES: Num Full-Time Employees 219,307 219,996 0.3 221,114 0.5 228,639 3.4 233,205 2.0 Num Part-Time Employees 31,216 30,631 -1.9 30,335 -1.0 31,185 2.8 31,130 -0.2BRANCHES: Num of CU Branches 20,979 21,066 0.4 21,070 0.0 20,180 -4.2 20,189 0.0 Num of CUs Reporting Shared Branches 1,169 1,160 -0.8 1,175 1.3 1,200 2.1 1,199 -0.1 Plan to add new branches or expand existing facilities 91 85 -6.6 679 698.8 617 -9.1 699 13.3MISCELLANEOUS LOAN INFORMATION:**Total Amount of Loans Granted YTD 267,064,394,376 248,726,544,592 -6.9 259,547,365,804 4.4 326,346,567,916 25.7 266,557,883,470 8.9**Total Short-Term, Small Amount (STS) Loans Granted Year to Date (FCUs Only) N/A 40,909,069 56,114,661 37.2 72,632,296 29.4 63,494,317 16.6MEMBER SERVICE AND PRODUCT OFFERINGS (Credit Programs):Business Loans 1,722 1,753 1.8 1,756 0.2 1,929 9.9 1,962 1.7Credit Builder 987 1,027 4.1 1,073 4.5 1,197 11.6 1,257 5.0Debt Cancellation/Suspension 367 392 6.8 411 4.8 438 6.6 441 0.7Direct Financing Leases 54 52 -3.7 49 -5.8 44 -10.2 56 27.3Indirect Business Loans 162 163 0.6 167 2.5 161 -3.6 166 3.1Indirect Consumer Loans 1,618 1,665 2.9 1,678 0.8 1,802 7.4 1,839 2.1Indirect Mortgage Loans 259 263 1.5 268 1.9 215 -19.8 208 -3.3Interest Only or Payment Option 1st Mortgage Loans 477 495 3.8 482 -2.6 564 17.0 593 5.1Micro Business Loans 670 691 3.1 678 -1.9 681 0.4 695 2.1Micro Consumer Loans 954 991 3.9 984 -0.7 1,002 1.8 1,000 -0.2Overdraft Lines of Credit 3,159 3,191 1.0 3,154 -1.2 3,040 -3.6 2,984 -1.8Overdraft Protection 2,867 2,948 2.8 2,991 1.5 2,976 -0.5 2,969 -0.2Participation Loans 1,296 1,353 4.4 1,385 2.4 1,513 9.2 1,536 1.5Pay Day Loans 498 510 2.4 520 2.0 561 7.9 574 2.3Real Estate Loans 4,544 4,659 2.5 4,586 -1.6 4,761 3.8 4,661 -2.1Refund Anticipation Loans 119 126 5.9 128 1.6 124 -3.1 119 -4.0Risk Based Loans 4,032 4,161 3.2 4,156 -0.1 4,249 2.2 4,269 0.5Share Secured Credit Cards 2,004 2,061 2.8 2,080 0.9 2,183 5.0 2,224 1.9Short-Term, Small Amount Loans (STS) N/A 123 392 218.7 623 58.9 689 10.6MEMBER SERVICE AND PRODUCT OFFERINGS (Other Programs):ATM/Debit Card Program 5,112 5,172 1.2 5,108 -1.2 5,038 -1.4 4,937 -2.0Business Share Accounts 2,407 2,481 3.1 2,482 0.0 2,556 3.0 2,588 1.3Check Cashing 3,644 3,716 2.0 3,683 -0.9 3,679 -0.1 3,625 -1.5First Time Homebuyer Program 638 669 4.9 673 0.6 703 4.5 721 2.6Health Savings Accounts 693 715 3.2 741 3.6 773 4.3 781 1.0Individual Development Accounts 159 161 1.3 165 2.5 179 8.5 182 1.7In-School Branches 324 351 8.3 355 1.1 373 5.1 375 0.5Insurance/Investment Sales 1,782 1,804 1.2 1,808 0.2 1,830 1.2 1,838 0.4International Remittances 640 674 5.3 684 1.5 740 8.2 990 33.8Low Cost Wire Transfers 3,582 3,689 3.0 3,667 -0.6 4,471 21.9 4,368 -2.3MERGERS/ACQUISITIONS:Completed Merger/Acquisition Qualfiying for Business Combo Acctng (FAS 141R) 132 220 66.7 316 43.6 436 38.0 521 19.5Adjusted Retained Earnings Obtained through Business Combinations 185,424,895 427,882,001 130.8 895,437,226 109.3 1,121,702,612 25.3 1,331,864,629 18.7Fixed Assets - Capital & Operating LeasesAggregate of Future Capital and Operating Lease Pmts on Fixed Assets (not discounted to PV) 1,563,728,680 1,686,357,989 7.8 1,733,706,621 2.8 1,675,972,512 -3.3 1,684,603,016 0.5
# Means the number is too large to display in the cell 16.MiscInfoAndServices
Region: Nation * Peer Group: All * Types Included: All Federally Insured Credit Unions (FICUs) *
* Annualization factor: March = 4; June = 2; September =4/3; December = 1 (or no annualizing)** Amount is year-to-date and the related % change ratio is annualized.
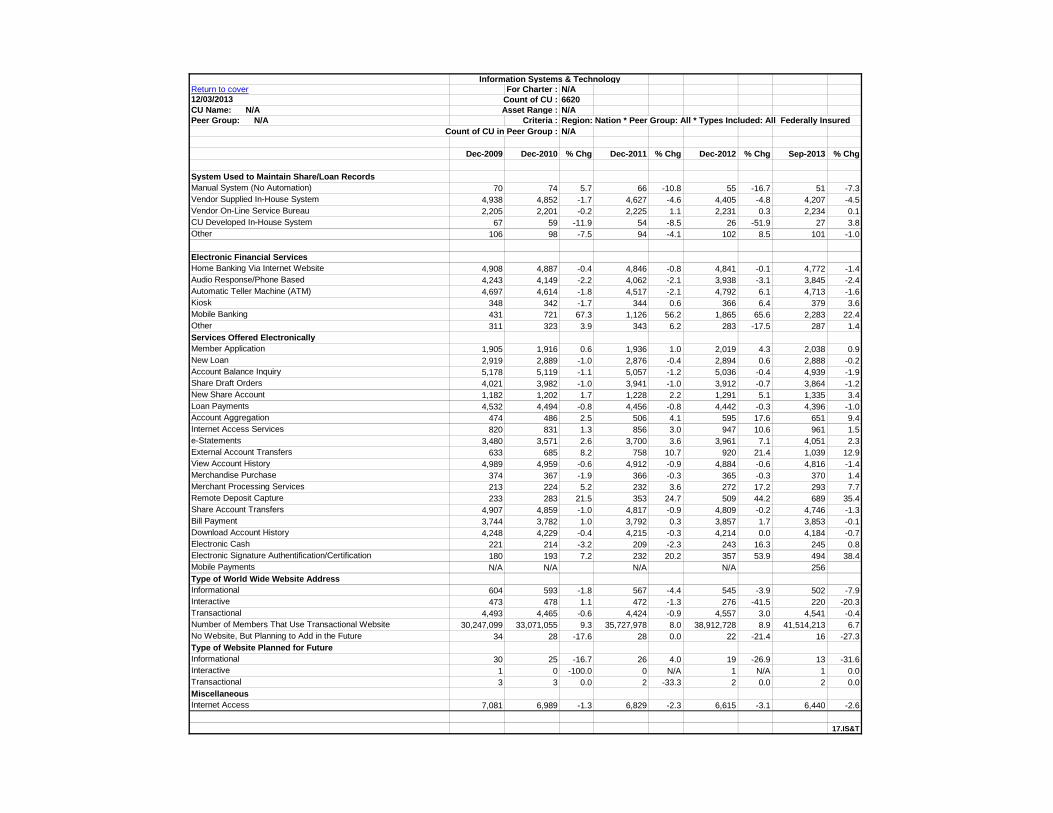
Information Systems & TechnologyReturn to cover For Charter : N/A12/03/2013 Count of CU : 6620CU Name: N/A Asset Range : N/APeer Group: N/A Criteria :
Count of CU in Peer Group : N/A
Dec-2009 Dec-2010 % Chg Dec-2011 % Chg Dec-2012 % Chg Sep-2013 % Chg
System Used to Maintain Share/Loan RecordsManual System (No Automation) 70 74 5.7 66 -10.8 55 -16.7 51 -7.3Vendor Supplied In-House System 4,938 4,852 -1.7 4,627 -4.6 4,405 -4.8 4,207 -4.5Vendor On-Line Service Bureau 2,205 2,201 -0.2 2,225 1.1 2,231 0.3 2,234 0.1CU Developed In-House System 67 59 -11.9 54 -8.5 26 -51.9 27 3.8Other 106 98 -7.5 94 -4.1 102 8.5 101 -1.0
Electronic Financial Services Home Banking Via Internet Website 4,908 4,887 -0.4 4,846 -0.8 4,841 -0.1 4,772 -1.4Audio Response/Phone Based 4,243 4,149 -2.2 4,062 -2.1 3,938 -3.1 3,845 -2.4Automatic Teller Machine (ATM) 4,697 4,614 -1.8 4,517 -2.1 4,792 6.1 4,713 -1.6Kiosk 348 342 -1.7 344 0.6 366 6.4 379 3.6Mobile Banking 431 721 67.3 1,126 56.2 1,865 65.6 2,283 22.4Other 311 323 3.9 343 6.2 283 -17.5 287 1.4Services Offered ElectronicallyMember Application 1,905 1,916 0.6 1,936 1.0 2,019 4.3 2,038 0.9New Loan 2,919 2,889 -1.0 2,876 -0.4 2,894 0.6 2,888 -0.2Account Balance Inquiry 5,178 5,119 -1.1 5,057 -1.2 5,036 -0.4 4,939 -1.9Share Draft Orders 4,021 3,982 -1.0 3,941 -1.0 3,912 -0.7 3,864 -1.2New Share Account 1,182 1,202 1.7 1,228 2.2 1,291 5.1 1,335 3.4Loan Payments 4,532 4,494 -0.8 4,456 -0.8 4,442 -0.3 4,396 -1.0Account Aggregation 474 486 2.5 506 4.1 595 17.6 651 9.4Internet Access Services 820 831 1.3 856 3.0 947 10.6 961 1.5e-Statements 3,480 3,571 2.6 3,700 3.6 3,961 7.1 4,051 2.3External Account Transfers 633 685 8.2 758 10.7 920 21.4 1,039 12.9View Account History 4,989 4,959 -0.6 4,912 -0.9 4,884 -0.6 4,816 -1.4Merchandise Purchase 374 367 -1.9 366 -0.3 365 -0.3 370 1.4Merchant Processing Services 213 224 5.2 232 3.6 272 17.2 293 7.7Remote Deposit Capture 233 283 21.5 353 24.7 509 44.2 689 35.4Share Account Transfers 4,907 4,859 -1.0 4,817 -0.9 4,809 -0.2 4,746 -1.3Bill Payment 3,744 3,782 1.0 3,792 0.3 3,857 1.7 3,853 -0.1Download Account History 4,248 4,229 -0.4 4,215 -0.3 4,214 0.0 4,184 -0.7Electronic Cash 221 214 -3.2 209 -2.3 243 16.3 245 0.8Electronic Signature Authentification/Certification 180 193 7.2 232 20.2 357 53.9 494 38.4Mobile Payments N/A N/A N/A N/A 256 Type of World Wide Website AddressInformational 604 593 -1.8 567 -4.4 545 -3.9 502 -7.9Interactive 473 478 1.1 472 -1.3 276 -41.5 220 -20.3Transactional 4,493 4,465 -0.6 4,424 -0.9 4,557 3.0 4,541 -0.4Number of Members That Use Transactional Website 30,247,099 33,071,055 9.3 35,727,978 8.0 38,912,728 8.9 41,514,213 6.7No Website, But Planning to Add in the Future 34 28 -17.6 28 0.0 22 -21.4 16 -27.3Type of Website Planned for FutureInformational 30 25 -16.7 26 4.0 19 -26.9 13 -31.6Interactive 1 0 -100.0 0 N/A 1 N/A 1 0.0Transactional 3 3 0.0 2 -33.3 2 0.0 2 0.0MiscellaneousInternet Access 7,081 6,989 -1.3 6,829 -2.3 6,615 -3.1 6,440 -2.6
17.IS&T
Region: Nation * Peer Group: All * Types Included: All Federally Insured

Graphs 1Return to cover For Charter : N/A12/03/2013 Count of CU : 6620CU Name: N/A Asset Range : N/APeer Group: N/A Criteria :
N/A
Delinquency & Net Charge-OffsCharge Offs Due To Bankruptcy (YTD) / Total Charge Offs (YTD) Net Worth To Assets
12/09 12/10 12/11 12/12 09/13 12/09 12/10 12/11 12/12 09/13Delinquent lo 1.84 1.76 1.60 1.16 1.02 Net Worth / A 9.89 10.06 10.21 10.43 10.65Net Charge-o 1.21 1.13 0.91 0.73 0.57 Peer 0.00 0.00 0.00 0.00 0.00Peer Delinqu 0.00 0.00 0.00 0.00 0.00Peer Net Cha 0.00 0.00 0.00 0.00 0.00
Loan & Share Growth Return On Average AssetsCurrent Perio 12/09 12/10 12/11 12/12 09/13 12/09 12/10 12/11 12/12 09/13Loan Growth 1.14 -1.35 1.20 4.55 7.58 Net Income / 0.18 0.50 0.67 0.85 0.80Share Growt 10.50 4.48 5.21 6.10 4.25 Peer 0.00 0.00 0.00 0.00 0.00Peer Share 0.00 0.00 0.00 0.00 0.00Peer Loan 0.00 0.00 0.00 0.00 0.00
18. Graphs 1
Count of CU in Peer Group :Region: Nation * Peer Group: All * Types Included: All Federally Insured Credit
Note: The NCUA Board approved a regulatory/policy change in May 2012 revising the delinquency reporting requirements for troubled debt restructured (TDR) loans.This policy change may result in a decline in delinquent loans reported as of June 2012.
-2.0 0.0 2.0 4.0 6.0 8.0
10.0 12.0
12/09 12/10 12/11 12/12 09/13
Loan & Share Growth
Loan Growth Current Period_Prior Year / Prior Year (annualized)
Share Growth Current Period_Prior Year / Prior Year (annualized)
Peer Share
Peer Loan
0.0
2.0
4.0
6.0
8.0
10.0
12.0
12/09 12/10 12/11 12/12 09/13
Net Worth To Assets
Net Worth / Assets Peer
0.0 0.2 0.4 0.6 0.8 1.0 1.2 1.4 1.6 1.8 2.0
12/09 12/10 12/11 12/12 09/13
Delinquency & Net Charge-Offs
Delinquent loans / loans Net Charge-offs / Averge Assets
Peer Delinquency Peer Net Charge-offs
0.0
0.1
0.2
0.3
0.4
0.5
0.6
0.7
0.8
0.9
12/09 12/10 12/11 12/12 09/13
Return On Average Assets
Net Income / Average Assets (annualized) Peer

Graphs 2Return to cover For Charter : N/A12/03/2013 Count of CU : 6620CU Name: N/A Asset Range : N/APeer Group: N/A Criteria :
N/A
Loans To Assets Net Long Term Assets to Assets12/09 12/10 12/11 12/12 09/13 12/09 12/10 12/11 12/12 09/13
Loans / Asse 64.71 61.76 59.42 58.48 59.77 Net Long -Te 31.54 33.01 32.45 32.96 35.95Peer 0.00 0.00 0.00 0.00 0.00 Peer 0.00 0.00 0.00 0.00 0.00
Net Interest Margin (NIM) Cash & Short-Term Investments To Assets12/09 12/10 12/11 12/12 09/13 12/09 12/10 12/11 12/12 09/13
NIM=(Net Int 3.21 3.25 3.12 2.92 2.79 Cash & Shor 16.80 16.10 17.30 17.49 15.19Peer 0.00 0.00 0.00 0.00 0.00 Peer 0.00 0.00 0.00 0.00 0.00
19. Graphs 2
Count of CU in Peer Group :Region: Nation * Peer Group: All * Types Included: All Federally Insured Credit
0.0
10.0
20.0
30.0
40.0
50.0
60.0
70.0
12/09 12/10 12/11 12/12 09/13
Loans To Assets
Loans / Assets Peer
0.0
5.0
10.0
15.0
20.0
25.0
30.0
35.0
40.0
12/09 12/10 12/11 12/12 09/13
Net Long Term Assets to Assets
Net Long -Term Assets / Assets Peer
0.0
0.5
1.0
1.5
2.0
2.5
3.0
3.5
12/09 12/10 12/11 12/12 09/13
Net Interest Margin (NIM)
NIM=(Net Interest Income-Interest Expense)/Avg Assets(annualized) Peer
0.0 2.0 4.0 6.0 8.0
10.0 12.0 14.0 16.0 18.0 20.0
12/09 12/10 12/11 12/12 09/13
Cash & Short-Term Investments To Assets
Cash & Short-Term Investments / Assets Peer