
Supplemental Financial Information - Seeking Alpha
38
THE PHOENICIAN, A LUXURY COLLECTION RESORT Supplemental Financial Information DECEMBER 31, 2020
Transcript of Supplemental Financial Information - Seeking Alpha

THE PHOENICIAN, A LUXURY COLLECTION RESORT
Supplemental Financial Information
DECEMBER 31, 2020
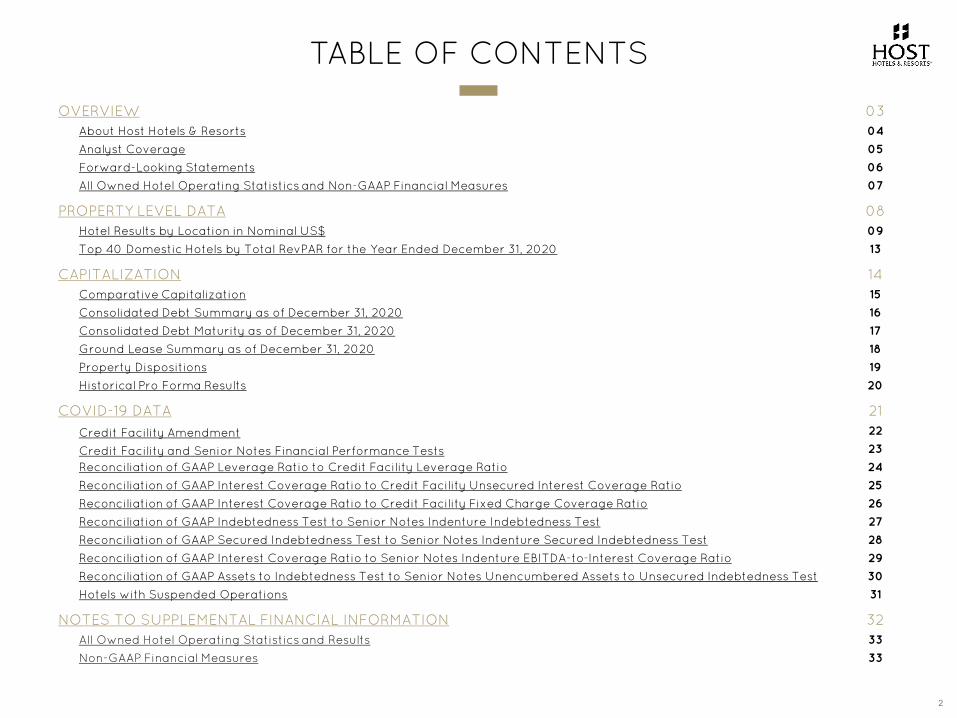
TABLE OF CONTENTS
2
OVERVIEW 03About Host Hotels & Resorts 04
Analyst Coverage 05
Forward-Looking Statements 06
All Owned Hotel Operating Statistics and Non-GAAP Financial Measures 07
PROPERTY LEVEL DATA 08Hotel Results by Location in Nominal US$ 09
Top 40 Domestic Hotels by Total RevPAR for the Year Ended December 31, 2020 13
CAPITALIZATION 14Comparative Capitalization 15
Consolidated Debt Summary as of December 31, 2020 16
Consolidated Debt Maturity as of December 31, 2020 17
Ground Lease Summary as of December 31, 2020 18
Property Dispositions 19
Historical Pro Forma Results 20
COVID-19 DATA 21
Credit Facility Amendment 22
Credit Facility and Senior Notes Financial Performance Tests 23
Reconciliation of GAAP Leverage Ratio to Credit Facility Leverage Ratio 24
Reconciliation of GAAP Interest Coverage Ratio to Credit Facility Unsecured Interest Coverage Ratio 25
Reconciliation of GAAP Interest Coverage Ratio to Credit Facility Fixed Charge Coverage Ratio 26
Reconciliation of GAAP Indebtedness Test to Senior Notes Indenture Indebtedness Test 27
Reconciliation of GAAP Secured Indebtedness Test to Senior Notes Indenture Secured Indebtedness Test 28
Reconciliation of GAAP Interest Coverage Ratio to Senior Notes Indenture EBITDA-to-Interest Coverage Ratio 29
Reconciliation of GAAP Assets to Indebtedness Test to Senior Notes Unencumbered Assets to Unsecured Indebtedness Test 30
Hotels with Suspended Operations 31
NOTES TO SUPPLEMENTAL FINANCIAL INFORMATION 32All Owned Hotel Operating Statistics and Results 33
Non-GAAP Financial Measures 33
HOST HOTELS & RESORTS, CORPORATE HEADQUARTERS
OVERVIEW
PROPERTY LEVEL DATA
CAPITALIZATION
COVID-19 DATA
NOTES TO SUPPLEMENTAL
FINANCIAL INFORMATION
3

ANDAZ MAUI AT WAILEA RESORT
ABOUT HOST HOTELS & RESORTS
4
PREMIER US LODGING REIT
LUXURY & UPPER UPSCALE CONSOLIDATED HOTELS PORTFOLIO(2)
80 46,300 22HOTELS ROOMS TOP US MARKETS
S&P500
$10.4BILLION
$13.8BILLION
COMPANY MARKET CAP(1) ENTERPRISE VALUE(1)
(1) Based on market cap as of December 31, 2020. See Comparative Capitalization for calculation.(2) At February 18, 2021.

5
ANALYST COVERAGE
The Company is followed by the analysts listed above. Please note that any opinions, estimates or forecasts regarding the Company’s performance made by these analysts are theirs alone and do not represent opinions, forecasts or predictions of the Company or its management. The Company does not by its reference above imply its endorsement of or concurrence with any of such analysts’ information, conclusions or recommendations.
BAIRDMike Bellisario414-298-6130
COMPASS POINT RESEARCH & TRADING, LLC
Floris van Dijkum 646-757-2621
MORGAN STANLEY & CO. Thomas Allen212-761-3356
BANK OF AMERICA MERRILL LYNCHShaun Kelley646-855-1005
DEUTSCHE BANK SECURITIESChris Woronka212-250-9376
RAYMOND JAMES & ASSOCIATESBill Crow
BARCLAYS CAPITALAnthony Powell212-526-8768
EVERCORE ISIRichard Hightower
STIFEL, NICOLAUS & CO. Simon Yarmak443-224-1345
BMO CAPITAL MARKETSAri Klein
GOLDMAN SACHS & CO. Stephen Grambling
212-902-7832 [email protected]
TRUISTC. Patrick Scholes
BTIGJames Sullivan212-738-6139
GREEN STREET ADVISORSLukas Hartwich949-640-8780
UBS SECURITIES LLCRobin Farley212-713-2060
CAPITAL ONE SECURITIESNeil Malkin
JEFFERIESDavid Katz
WELLS FARGO SECURITIES LLCDori Kesten
CITI INVESTMENT RESEARCHSmedes Rose212-816-6243
J.P. MORGAN SECURITIESJoe Greff
WOLFE RESEARCHJared Shojaian214-699-4506
ABOUT HOST HOTELS & RESORTS
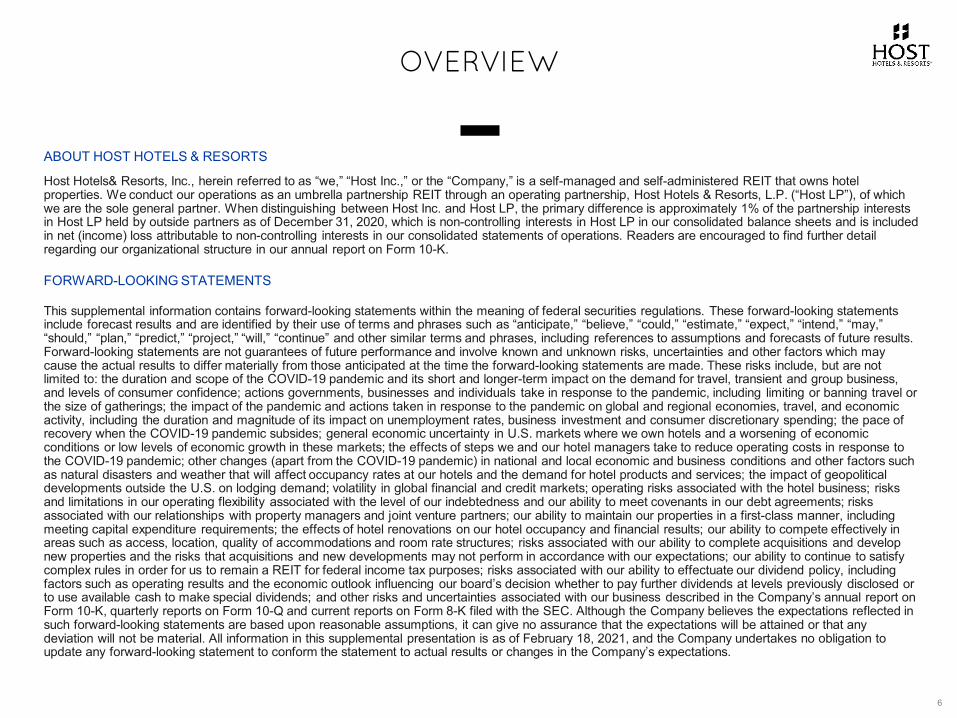
Host Hotels& Resorts, Inc., herein referred to as “we,” “Host Inc.,” or the “Company,” is a self-managed and self-administered REIT that owns hotel properties. We conduct our operations as an umbrella partnership REIT through an operating partnership, Host Hotels & Resorts, L.P. (“Host LP”), of which we are the sole general partner. When distinguishing between Host Inc. and Host LP, the primary difference is approximately 1% of the partnership interests in Host LP held by outside partners as of December 31, 2020, which is non-controlling interests in Host LP in our consolidated balance sheets and is included in net (income) loss attributable to non-controlling interests in our consolidated statements of operations. Readers are encouraged to find further detail regarding our organizational structure in our annual report on Form 10-K.
FORWARD-LOOKING STATEMENTS
This supplemental information contains forward-looking statements within the meaning of federal securities regulations. These forward-looking statements include forecast results and are identified by their use of terms and phrases such as “anticipate,” “believe,” “could,” “estimate,” “expect,” “intend,” “may,” “should,” “plan,” “predict,” “project,” “will,” “continue” and other similar terms and phrases, including references to assumptions and forecasts of future results. Forward-looking statements are not guarantees of future performance and involve known and unknown risks, uncertainties and other factors which may cause the actual results to differ materially from those anticipated at the time the forward-looking statements are made. These risks include, but are not limited to: the duration and scope of the COVID-19 pandemic and its short and longer-term impact on the demand for travel, transient and group business, and levels of consumer confidence; actions governments, businesses and individuals take in response to the pandemic, including limiting or banning travel or the size of gatherings; the impact of the pandemic and actions taken in response to the pandemic on global and regional economies, travel, and economic activity, including the duration and magnitude of its impact on unemployment rates, business investment and consumer discretionary spending; the pace of recovery when the COVID-19 pandemic subsides; general economic uncertainty in U.S. markets where we own hotels and a worsening of economic conditions or low levels of economic growth in these markets; the effects of steps we and our hotel managers take to reduce operating costs in response to the COVID-19 pandemic; other changes (apart from the COVID-19 pandemic) in national and local economic and business conditions and other factors such as natural disasters and weather that will affect occupancy rates at our hotels and the demand for hotel products and services; the impact of geopolitical developments outside the U.S. on lodging demand; volatility in global financial and credit markets; operating risks associated with the hotel business; risks and limitations in our operating flexibility associated with the level of our indebtedness and our ability to meet covenants in our debt agreements; risks associated with our relationships with property managers and joint venture partners; our ability to maintain our properties in a first-class manner, including meeting capital expenditure requirements; the effects of hotel renovations on our hotel occupancy and financial results; our ability to compete effectively in areas such as access, location, quality of accommodations and room rate structures; risks associated with our ability to complete acquisitions and develop new properties and the risks that acquisitions and new developments may not perform in accordance with our expectations; our ability to continue to satisfy complex rules in order for us to remain a REIT for federal income tax purposes; risks associated with our ability to effectuate our dividend policy, including factors such as operating results and the economic outlook influencing our board’s decision whether to pay further dividends at levels previously disclosed or to use available cash to make special dividends; and other risks and uncertainties associated with our business described in the Company’s annual report on Form 10-K, quarterly reports on Form 10-Q and current reports on Form 8-K filed with the SEC. Although the Company believes the expectations reflected in such forward-looking statements are based upon reasonable assumptions, it can give no assurance that the expectations will be attained or that any deviation will not be material. All information in this supplemental presentation is as of February 18, 2021, and the Company undertakes no obligation to update any forward-looking statement to conform the statement to actual results or changes in the Company’s expectations.
6
OVERVIEW
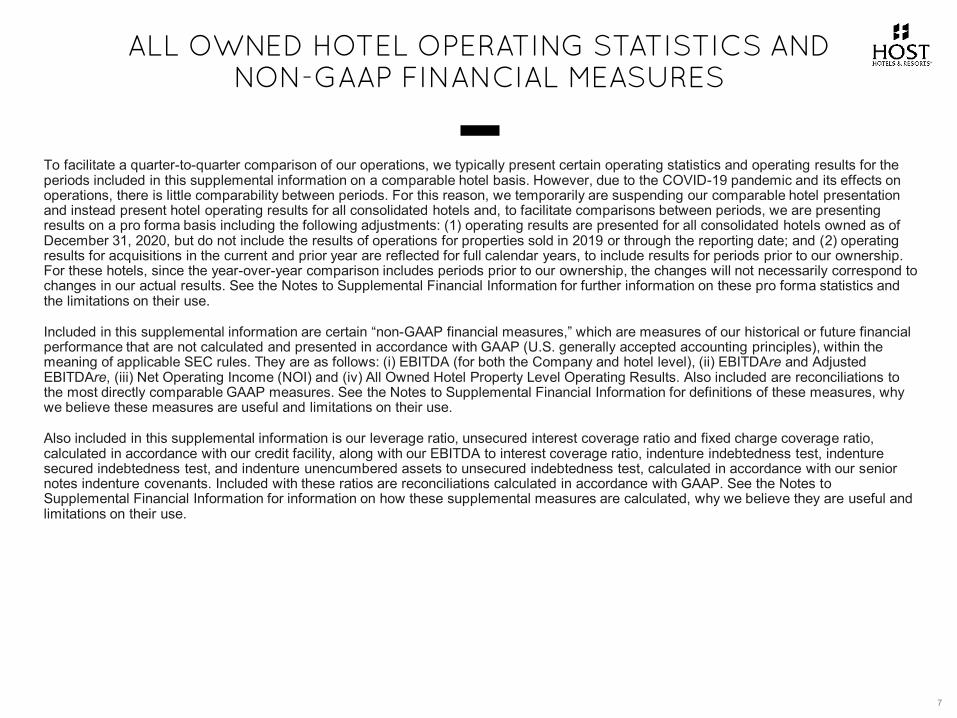
To facilitate a quarter-to-quarter comparison of our operations, we typically present certain operating statistics and operating results for the periods included in this supplemental information on a comparable hotel basis. However, due to the COVID-19 pandemic and its effects on operations, there is little comparability between periods. For this reason, we temporarily are suspending our comparable hotel presentation and instead present hotel operating results for all consolidated hotels and, to facilitate comparisons between periods, we are presenting results on a pro forma basis including the following adjustments: (1) operating results are presented for all consolidated hotels owned as of December 31, 2020, but do not include the results of operations for properties sold in 2019 or through the reporting date; and (2) operating results for acquisitions in the current and prior year are reflected for full calendar years, to include results for periods prior to our ownership. For these hotels, since the year-over-year comparison includes periods prior to our ownership, the changes will not necessarily correspond to changes in our actual results. See the Notes to Supplemental Financial Information for further information on these pro forma statistics and the limitations on their use.
Included in this supplemental information are certain “non-GAAP financial measures,” which are measures of our historical or future financial performance that are not calculated and presented in accordance with GAAP (U.S. generally accepted accounting principles), within the meaning of applicable SEC rules. They are as follows: (i) EBITDA (for both the Company and hotel level), (ii) EBITDAre and Adjusted EBITDAre, (iii) Net Operating Income (NOI) and (iv) All Owned Hotel Property Level Operating Results. Also included are reconciliations to the most directly comparable GAAP measures. See the Notes to Supplemental Financial Information for definitions of these measures, why we believe these measures are useful and limitations on their use.
Also included in this supplemental information is our leverage ratio, unsecured interest coverage ratio and fixed charge coverage ratio, calculated in accordance with our credit facility, along with our EBITDA to interest coverage ratio, indenture indebtedness test, indenture secured indebtedness test, and indenture unencumbered assets to unsecured indebtedness test, calculated in accordance with our senior notes indenture covenants. Included with these ratios are reconciliations calculated in accordance with GAAP. See the Notes to Supplemental Financial Information for information on how these supplemental measures are calculated, why we believe they are useful and limitations on their use.
7
ALL OWNED HOTEL OPERATING STATISTICS AND NON-GAAP FINANCIAL MEASURES
THE RITZ-CARLTON, AMELIA ISLAND
OVERVIEW
PROPERTY LEVEL DATA
CAPITALIZATION
COVID-19 DATA
NOTES TO SUPPLEMENTAL
FINANCIAL INFORMATION
8
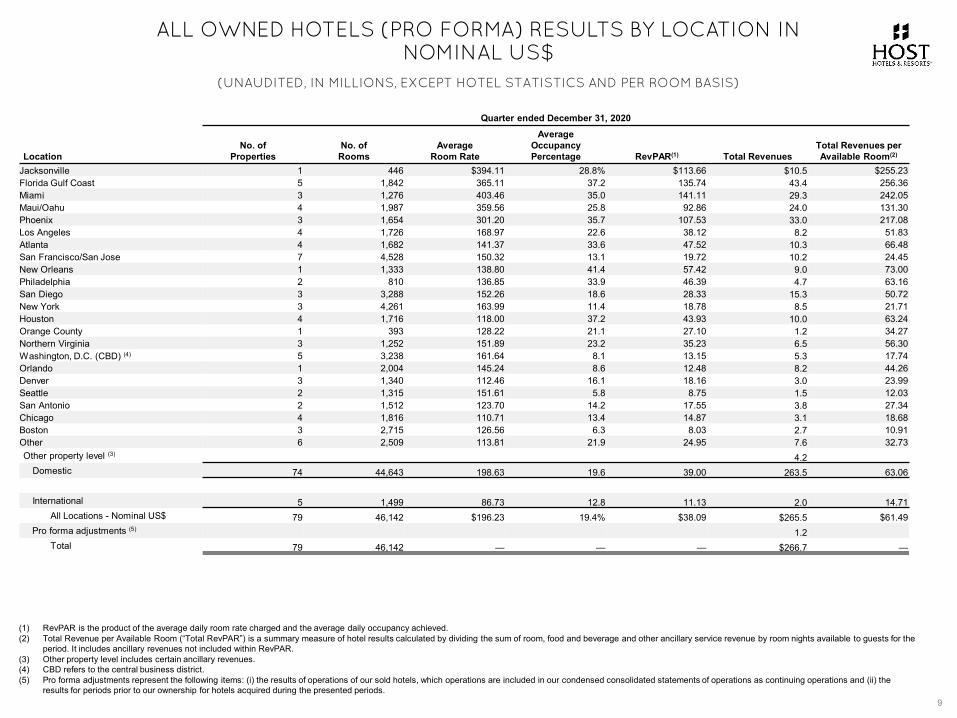
ALL OWNED HOTELS (PRO FORMA) RESULTS BY LOCATION IN NOMINAL US$
(UNAUDITED, IN MILLIONS, EXCEPT HOTEL STATISTICS AND PER ROOM BASIS)
Quarter ended December 31, 2020
LocationNo. of
PropertiesNo. ofRooms
AverageRoom Rate
AverageOccupancyPercentage RevPAR(1) Total Revenues
Total Revenues per Available Room(2)
Jacksonville 1 446 $394.11 28.8% $113.66 $10.5 $255.23Florida Gulf Coast 5 1,842 365.11 37.2 135.74 43.4 256.36Miami 3 1,276 403.46 35.0 141.11 29.3 242.05Maui/Oahu 4 1,987 359.56 25.8 92.86 24.0 131.30Phoenix 3 1,654 301.20 35.7 107.53 33.0 217.08Los Angeles 4 1,726 168.97 22.6 38.12 8.2 51.83Atlanta 4 1,682 141.37 33.6 47.52 10.3 66.48San Francisco/San Jose 7 4,528 150.32 13.1 19.72 10.2 24.45New Orleans 1 1,333 138.80 41.4 57.42 9.0 73.00Philadelphia 2 810 136.85 33.9 46.39 4.7 63.16San Diego 3 3,288 152.26 18.6 28.33 15.3 50.72New York 3 4,261 163.99 11.4 18.78 8.5 21.71Houston 4 1,716 118.00 37.2 43.93 10.0 63.24Orange County 1 393 128.22 21.1 27.10 1.2 34.27Northern Virginia 3 1,252 151.89 23.2 35.23 6.5 56.30Washington, D.C. (CBD) (4) 5 3,238 161.64 8.1 13.15 5.3 17.74Orlando 1 2,004 145.24 8.6 12.48 8.2 44.26Denver 3 1,340 112.46 16.1 18.16 3.0 23.99Seattle 2 1,315 151.61 5.8 8.75 1.5 12.03San Antonio 2 1,512 123.70 14.2 17.55 3.8 27.34Chicago 4 1,816 110.71 13.4 14.87 3.1 18.68Boston 3 2,715 126.56 6.3 8.03 2.7 10.91Other 6 2,509 113.81 21.9 24.95 7.6 32.73Other property level (3) 4.2
Domestic 74 44,643 198.63 19.6 39.00 263.5 63.06
International 5 1,499 86.73 12.8 11.13 2.0 14.71All Locations - Nominal US$ 79 46,142 $196.23 19.4% $38.09 $265.5 $61.49
Pro forma adjustments (5) 1.2Total 79 46,142 — — — $266.7 —
(1) RevPAR is the product of the average daily room rate charged and the average daily occupancy achieved.(2) Total Revenue per Available Room (“Total RevPAR”) is a summary measure of hotel results calculated by dividing the sum of room, food and beverage and other ancillary service revenue by room nights available to guests for the
period. It includes ancillary revenues not included within RevPAR. (3) Other property level includes certain ancillary revenues.(4) CBD refers to the central business district.(5) Pro forma adjustments represent the following items: (i) the results of operations of our sold hotels, which operations are included in our condensed consolidated statements of operations as continuing operations and (ii) the
results for periods prior to our ownership for hotels acquired during the presented periods.9
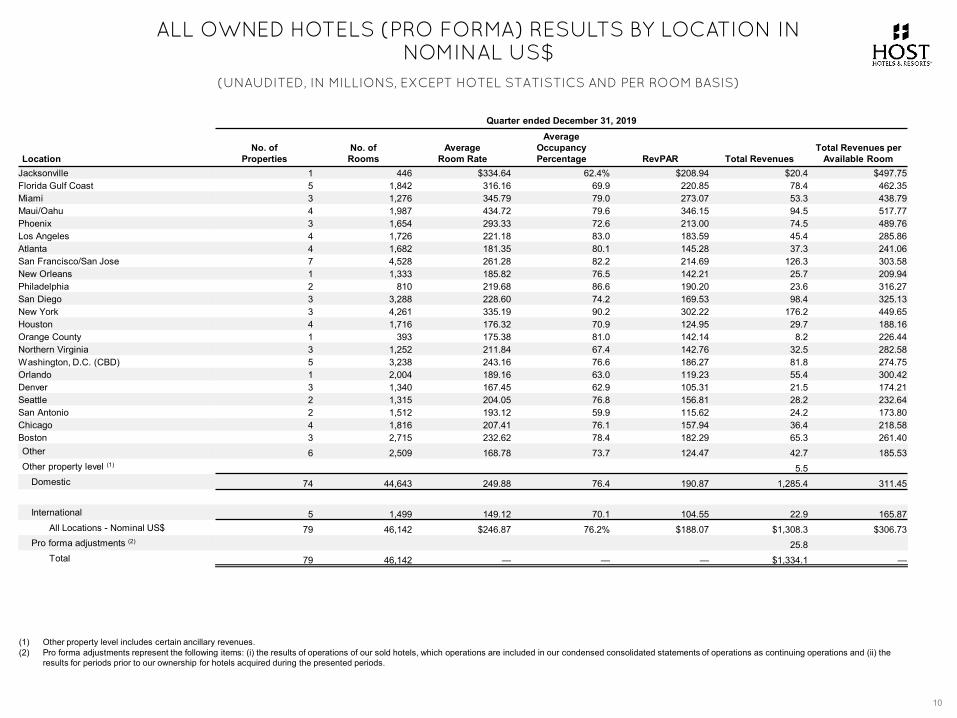
ALL OWNED HOTELS (PRO FORMA) RESULTS BY LOCATION IN NOMINAL US$
10
(UNAUDITED, IN MILLIONS, EXCEPT HOTEL STATISTICS AND PER ROOM BASIS)
Quarter ended December 31, 2019
LocationNo. of
PropertiesNo. ofRooms
AverageRoom Rate
AverageOccupancyPercentage RevPAR Total Revenues
Total Revenues per Available Room
Jacksonville 1 446 $334.64 62.4% $208.94 $20.4 $497.75Florida Gulf Coast 5 1,842 316.16 69.9 220.85 78.4 462.35Miami 3 1,276 345.79 79.0 273.07 53.3 438.79Maui/Oahu 4 1,987 434.72 79.6 346.15 94.5 517.77Phoenix 3 1,654 293.33 72.6 213.00 74.5 489.76Los Angeles 4 1,726 221.18 83.0 183.59 45.4 285.86Atlanta 4 1,682 181.35 80.1 145.28 37.3 241.06San Francisco/San Jose 7 4,528 261.28 82.2 214.69 126.3 303.58New Orleans 1 1,333 185.82 76.5 142.21 25.7 209.94Philadelphia 2 810 219.68 86.6 190.20 23.6 316.27San Diego 3 3,288 228.60 74.2 169.53 98.4 325.13New York 3 4,261 335.19 90.2 302.22 176.2 449.65Houston 4 1,716 176.32 70.9 124.95 29.7 188.16Orange County 1 393 175.38 81.0 142.14 8.2 226.44Northern Virginia 3 1,252 211.84 67.4 142.76 32.5 282.58Washington, D.C. (CBD) 5 3,238 243.16 76.6 186.27 81.8 274.75Orlando 1 2,004 189.16 63.0 119.23 55.4 300.42Denver 3 1,340 167.45 62.9 105.31 21.5 174.21Seattle 2 1,315 204.05 76.8 156.81 28.2 232.64San Antonio 2 1,512 193.12 59.9 115.62 24.2 173.80Chicago 4 1,816 207.41 76.1 157.94 36.4 218.58Boston 3 2,715 232.62 78.4 182.29 65.3 261.40Other 6 2,509 168.78 73.7 124.47 42.7 185.53Other property level (1) 5.5
Domestic 74 44,643 249.88 76.4 190.87 1,285.4 311.45
International 5 1,499 149.12 70.1 104.55 22.9 165.87All Locations - Nominal US$ 79 46,142 $246.87 76.2% $188.07 $1,308.3 $306.73
Pro forma adjustments (2) 25.8Total 79 46,142 — — — $1,334.1 —
(1) Other property level includes certain ancillary revenues.(2) Pro forma adjustments represent the following items: (i) the results of operations of our sold hotels, which operations are included in our condensed consolidated statements of operations as continuing operations and (ii) the
results for periods prior to our ownership for hotels acquired during the presented periods.
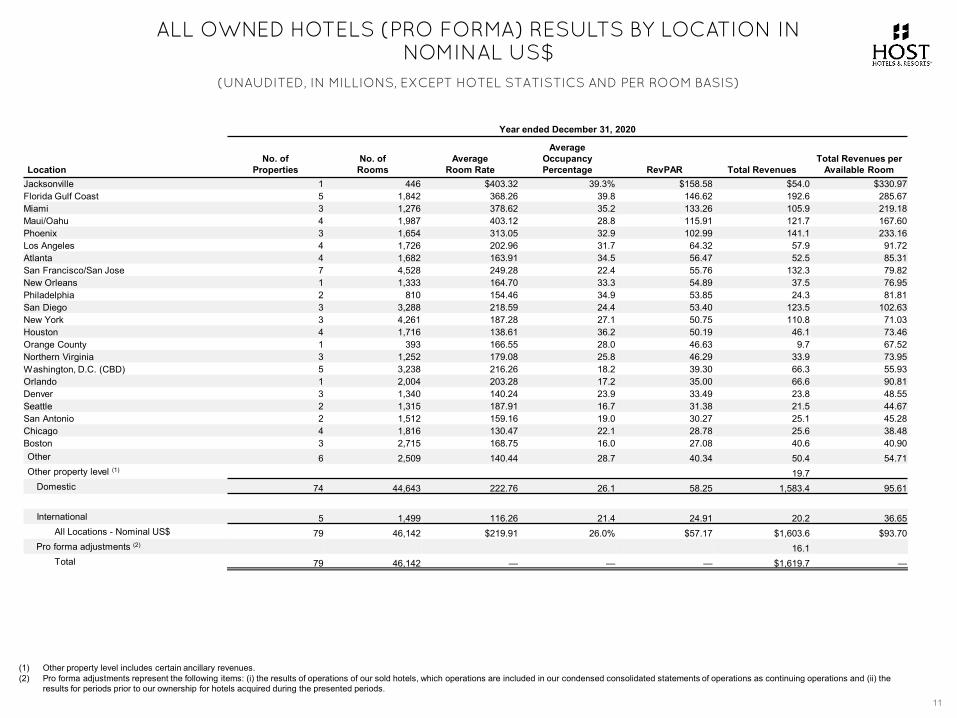
ALL OWNED HOTELS (PRO FORMA) RESULTS BY LOCATION IN NOMINAL US$
11
(UNAUDITED, IN MILLIONS, EXCEPT HOTEL STATISTICS AND PER ROOM BASIS)
Year ended December 31, 2020
LocationNo. of
PropertiesNo. ofRooms
AverageRoom Rate
AverageOccupancyPercentage RevPAR Total Revenues
Total Revenues per Available Room
Jacksonville 1 446 $403.32 39.3% $158.58 $54.0 $330.97Florida Gulf Coast 5 1,842 368.26 39.8 146.62 192.6 285.67Miami 3 1,276 378.62 35.2 133.26 105.9 219.18Maui/Oahu 4 1,987 403.12 28.8 115.91 121.7 167.60Phoenix 3 1,654 313.05 32.9 102.99 141.1 233.16Los Angeles 4 1,726 202.96 31.7 64.32 57.9 91.72Atlanta 4 1,682 163.91 34.5 56.47 52.5 85.31San Francisco/San Jose 7 4,528 249.28 22.4 55.76 132.3 79.82New Orleans 1 1,333 164.70 33.3 54.89 37.5 76.95Philadelphia 2 810 154.46 34.9 53.85 24.3 81.81San Diego 3 3,288 218.59 24.4 53.40 123.5 102.63New York 3 4,261 187.28 27.1 50.75 110.8 71.03Houston 4 1,716 138.61 36.2 50.19 46.1 73.46Orange County 1 393 166.55 28.0 46.63 9.7 67.52Northern Virginia 3 1,252 179.08 25.8 46.29 33.9 73.95Washington, D.C. (CBD) 5 3,238 216.26 18.2 39.30 66.3 55.93Orlando 1 2,004 203.28 17.2 35.00 66.6 90.81Denver 3 1,340 140.24 23.9 33.49 23.8 48.55Seattle 2 1,315 187.91 16.7 31.38 21.5 44.67San Antonio 2 1,512 159.16 19.0 30.27 25.1 45.28Chicago 4 1,816 130.47 22.1 28.78 25.6 38.48Boston 3 2,715 168.75 16.0 27.08 40.6 40.90Other 6 2,509 140.44 28.7 40.34 50.4 54.71Other property level (1) 19.7
Domestic 74 44,643 222.76 26.1 58.25 1,583.4 95.61
International 5 1,499 116.26 21.4 24.91 20.2 36.65All Locations - Nominal US$ 79 46,142 $219.91 26.0% $57.17 $1,603.6 $93.70
Pro forma adjustments (2) 16.1Total 79 46,142 — — — $1,619.7 —
(1) Other property level includes certain ancillary revenues.(2) Pro forma adjustments represent the following items: (i) the results of operations of our sold hotels, which operations are included in our condensed consolidated statements of operations as continuing operations and (ii) the
results for periods prior to our ownership for hotels acquired during the presented periods.
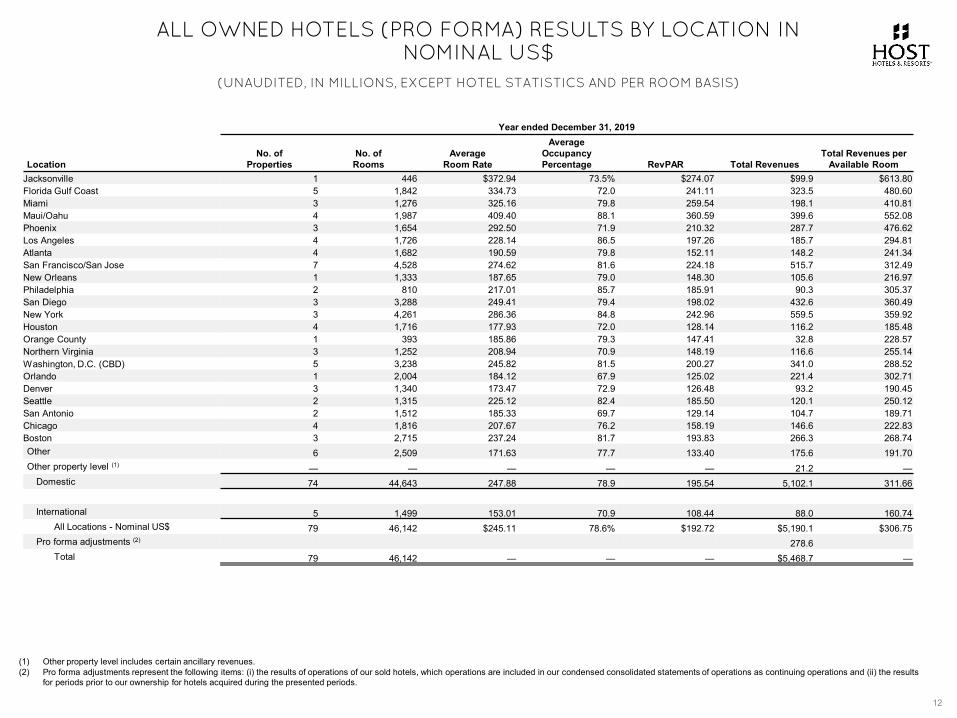
ALL OWNED HOTELS (PRO FORMA) RESULTS BY LOCATION IN NOMINAL US$
12
(UNAUDITED, IN MILLIONS, EXCEPT HOTEL STATISTICS AND PER ROOM BASIS)
Year ended December 31, 2019
LocationNo. of
PropertiesNo. ofRooms
AverageRoom Rate
AverageOccupancyPercentage RevPAR Total Revenues
Total Revenues per Available Room
Jacksonville 1 446 $372.94 73.5% $274.07 $99.9 $613.80Florida Gulf Coast 5 1,842 334.73 72.0 241.11 323.5 480.60Miami 3 1,276 325.16 79.8 259.54 198.1 410.81Maui/Oahu 4 1,987 409.40 88.1 360.59 399.6 552.08Phoenix 3 1,654 292.50 71.9 210.32 287.7 476.62Los Angeles 4 1,726 228.14 86.5 197.26 185.7 294.81Atlanta 4 1,682 190.59 79.8 152.11 148.2 241.34San Francisco/San Jose 7 4,528 274.62 81.6 224.18 515.7 312.49New Orleans 1 1,333 187.65 79.0 148.30 105.6 216.97Philadelphia 2 810 217.01 85.7 185.91 90.3 305.37San Diego 3 3,288 249.41 79.4 198.02 432.6 360.49New York 3 4,261 286.36 84.8 242.96 559.5 359.92Houston 4 1,716 177.93 72.0 128.14 116.2 185.48Orange County 1 393 185.86 79.3 147.41 32.8 228.57Northern Virginia 3 1,252 208.94 70.9 148.19 116.6 255.14Washington, D.C. (CBD) 5 3,238 245.82 81.5 200.27 341.0 288.52Orlando 1 2,004 184.12 67.9 125.02 221.4 302.71Denver 3 1,340 173.47 72.9 126.48 93.2 190.45Seattle 2 1,315 225.12 82.4 185.50 120.1 250.12San Antonio 2 1,512 185.33 69.7 129.14 104.7 189.71Chicago 4 1,816 207.67 76.2 158.19 146.6 222.83Boston 3 2,715 237.24 81.7 193.83 266.3 268.74Other 6 2,509 171.63 77.7 133.40 175.6 191.70Other property level (1) — — — — — 21.2 —
Domestic 74 44,643 247.88 78.9 195.54 5,102.1 311.66
International 5 1,499 153.01 70.9 108.44 88.0 160.74All Locations - Nominal US$ 79 46,142 $245.11 78.6% $192.72 $5,190.1 $306.75
Pro forma adjustments (2) 278.6Total 79 46,142 — — — $5,468.7 —
(1) Other property level includes certain ancillary revenues.(2) Pro forma adjustments represent the following items: (i) the results of operations of our sold hotels, which operations are included in our condensed consolidated statements of operations as continuing operations and (ii) the results
for periods prior to our ownership for hotels acquired during the presented periods.
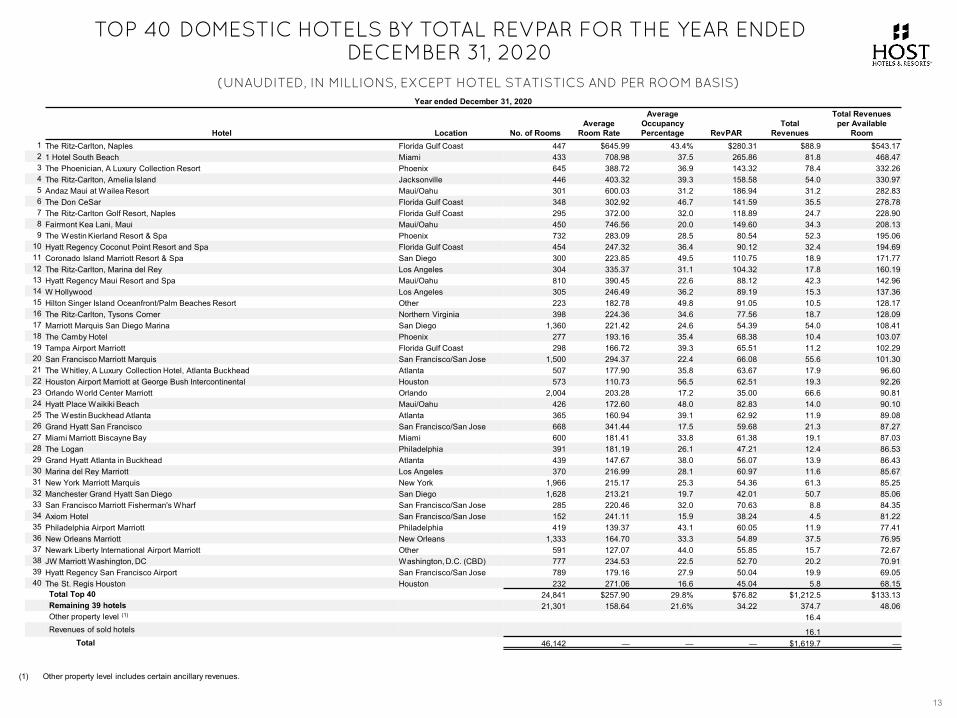
TOP 40 DOMESTIC HOTELS BY TOTAL REVPAR FOR THE YEAR ENDED DECEMBER 31, 2020
13
(UNAUDITED, IN MILLIONS, EXCEPT HOTEL STATISTICS AND PER ROOM BASIS)Year ended December 31, 2020
Hotel Location No. of RoomsAverage
Room Rate
Average Occupancy Percentage RevPAR
Total Revenues
Total Revenues per Available
Room1 The Ritz-Carlton, Naples Florida Gulf Coast 447 $645.99 43.4% $280.31 $88.9 $543.172 1 Hotel South Beach Miami 433 708.98 37.5 265.86 81.8 468.473 The Phoenician, A Luxury Collection Resort Phoenix 645 388.72 36.9 143.32 78.4 332.264 The Ritz-Carlton, Amelia Island Jacksonville 446 403.32 39.3 158.58 54.0 330.975 Andaz Maui at Wailea Resort Maui/Oahu 301 600.03 31.2 186.94 31.2 282.836 The Don CeSar Florida Gulf Coast 348 302.92 46.7 141.59 35.5 278.787 The Ritz-Carlton Golf Resort, Naples Florida Gulf Coast 295 372.00 32.0 118.89 24.7 228.908 Fairmont Kea Lani, Maui Maui/Oahu 450 746.56 20.0 149.60 34.3 208.139 The Westin Kierland Resort & Spa Phoenix 732 283.09 28.5 80.54 52.3 195.06
10 Hyatt Regency Coconut Point Resort and Spa Florida Gulf Coast 454 247.32 36.4 90.12 32.4 194.6911 Coronado Island Marriott Resort & Spa San Diego 300 223.85 49.5 110.75 18.9 171.7712 The Ritz-Carlton, Marina del Rey Los Angeles 304 335.37 31.1 104.32 17.8 160.1913 Hyatt Regency Maui Resort and Spa Maui/Oahu 810 390.45 22.6 88.12 42.3 142.9614 W Hollywood Los Angeles 305 246.49 36.2 89.19 15.3 137.3615 Hilton Singer Island Oceanfront/Palm Beaches Resort Other 223 182.78 49.8 91.05 10.5 128.1716 The Ritz-Carlton, Tysons Corner Northern Virginia 398 224.36 34.6 77.56 18.7 128.0917 Marriott Marquis San Diego Marina San Diego 1,360 221.42 24.6 54.39 54.0 108.4118 The Camby Hotel Phoenix 277 193.16 35.4 68.38 10.4 103.0719 Tampa Airport Marriott Florida Gulf Coast 298 166.72 39.3 65.51 11.2 102.2920 San Francisco Marriott Marquis San Francisco/San Jose 1,500 294.37 22.4 66.08 55.6 101.3021 The Whitley, A Luxury Collection Hotel, Atlanta Buckhead Atlanta 507 177.90 35.8 63.67 17.9 96.6022 Houston Airport Marriott at George Bush Intercontinental Houston 573 110.73 56.5 62.51 19.3 92.2623 Orlando World Center Marriott Orlando 2,004 203.28 17.2 35.00 66.6 90.8124 Hyatt Place Waikiki Beach Maui/Oahu 426 172.60 48.0 82.83 14.0 90.1025 The Westin Buckhead Atlanta Atlanta 365 160.94 39.1 62.92 11.9 89.0826 Grand Hyatt San Francisco San Francisco/San Jose 668 341.44 17.5 59.68 21.3 87.2727 Miami Marriott Biscayne Bay Miami 600 181.41 33.8 61.38 19.1 87.0328 The Logan Philadelphia 391 181.19 26.1 47.21 12.4 86.5329 Grand Hyatt Atlanta in Buckhead Atlanta 439 147.67 38.0 56.07 13.9 86.4330 Marina del Rey Marriott Los Angeles 370 216.99 28.1 60.97 11.6 85.6731 New York Marriott Marquis New York 1,966 215.17 25.3 54.36 61.3 85.2532 Manchester Grand Hyatt San Diego San Diego 1,628 213.21 19.7 42.01 50.7 85.0633 San Francisco Marriott Fisherman's Wharf San Francisco/San Jose 285 220.46 32.0 70.63 8.8 84.3534 Axiom Hotel San Francisco/San Jose 152 241.11 15.9 38.24 4.5 81.2235 Philadelphia Airport Marriott Philadelphia 419 139.37 43.1 60.05 11.9 77.4136 New Orleans Marriott New Orleans 1,333 164.70 33.3 54.89 37.5 76.9537 Newark Liberty International Airport Marriott Other 591 127.07 44.0 55.85 15.7 72.6738 JW Marriott Washington, DC Washington, D.C. (CBD) 777 234.53 22.5 52.70 20.2 70.9139 Hyatt Regency San Francisco Airport San Francisco/San Jose 789 179.16 27.9 50.04 19.9 69.0540 The St. Regis Houston Houston 232 271.06 16.6 45.04 5.8 68.15
Total Top 40 24,841 $257.90 29.8% $76.82 $1,212.5 $133.13Remaining 39 hotels 21,301 158.64 21.6% 34.22 374.7 48.06Other property level (1) 16.4Revenues of sold hotels 16.1
Total 46,142 — — — $1,619.7 —
(1) Other property level includes certain ancillary revenues.

1 HOTEL SOUTH BEACH
OVERVIEW
PROPERTY LEVEL DATA
CAPITALIZATION
COVID-19 DATA
NOTES TO SUPPLEMENTAL
FINANCIAL INFORMATION
14
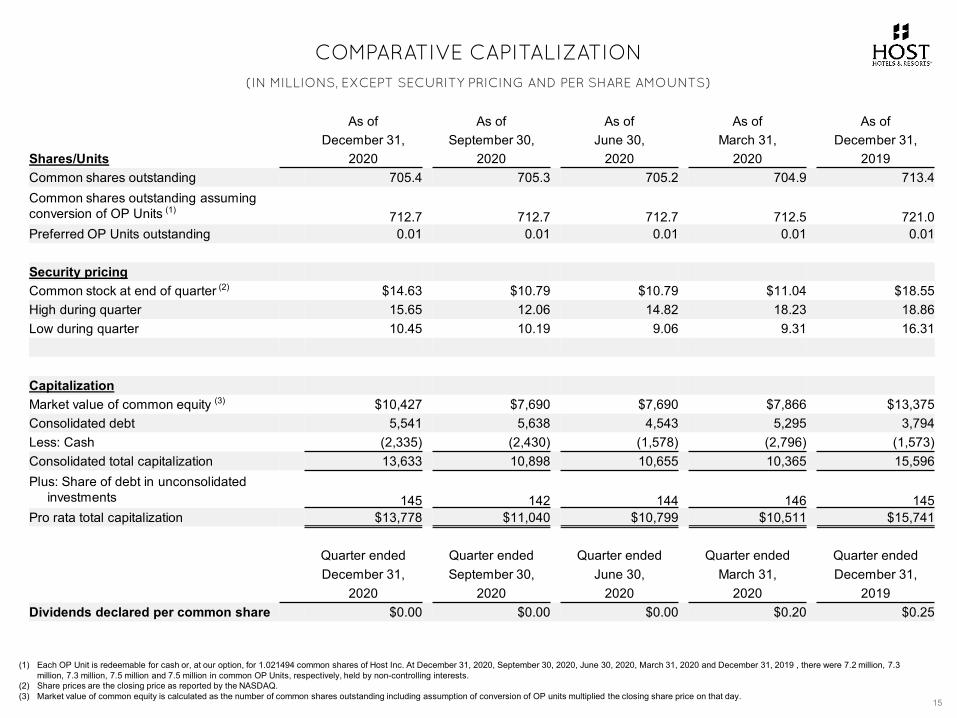
COMPARATIVE CAPITALIZATION(IN MILLIONS, EXCEPT SECURITY PRICING AND PER SHARE AMOUNTS)
15
As of As of As of As of As ofDecember 31, September 30, June 30, March 31, December 31,
Shares/Units 2020 2020 2020 2020 2019Common shares outstanding 705.4 705.3 705.2 704.9 713.4Common shares outstanding assuming conversion of OP Units (1) 712.7 712.7 712.7 712.5 721.0Preferred OP Units outstanding 0.01 0.01 0.01 0.01 0.01
Security pricingCommon stock at end of quarter (2) $14.63 $10.79 $10.79 $11.04 $18.55 High during quarter 15.65 12.06 14.82 18.23 18.86Low during quarter 10.45 10.19 9.06 9.31 16.31
CapitalizationMarket value of common equity (3) $10,427 $7,690 $7,690 $7,866 $13,375 Consolidated debt 5,541 5,638 4,543 5,295 3,794Less: Cash (2,335) (2,430) (1,578) (2,796) (1,573)Consolidated total capitalization 13,633 10,898 10,655 10,365 15,596Plus: Share of debt in unconsolidated
investments 145 142 144 146 145Pro rata total capitalization $13,778 $11,040 $10,799 $10,511 $15,741
Quarter ended Quarter ended Quarter ended Quarter ended Quarter endedDecember 31, September 30, June 30, March 31, December 31,
2020 2020 2020 2020 2019Dividends declared per common share $0.00 $0.00 $0.00 $0.20 $0.25
(1) Each OP Unit is redeemable for cash or, at our option, for 1.021494 common shares of Host Inc. At December 31, 2020, September 30, 2020, June 30, 2020, March 31, 2020 and December 31, 2019 , there were 7.2 million, 7.3 million, 7.3 million, 7.5 million and 7.5 million in common OP Units, respectively, held by non-controlling interests.
(2) Share prices are the closing price as reported by the NASDAQ. (3) Market value of common equity is calculated as the number of common shares outstanding including assumption of conversion of OP units multiplied the closing share price on that day.
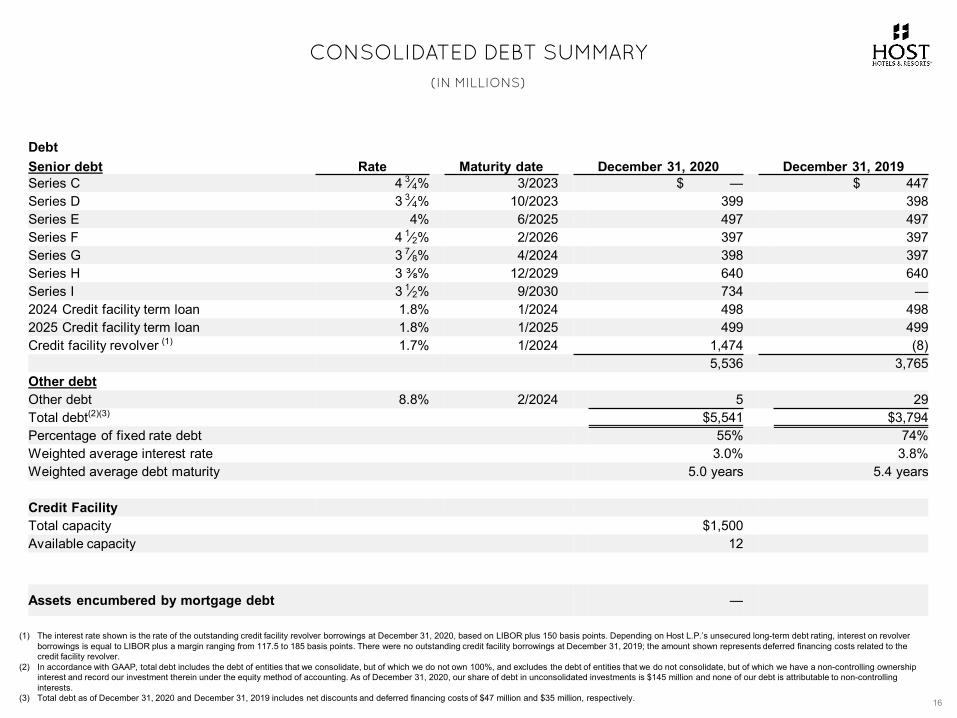
CONSOLIDATED DEBT SUMMARY
16
(IN MILLIONS)
DebtSenior debt Rate Maturity date December 31, 2020 December 31, 2019Series C 4 3⁄4% 3/2023 $ — $ 447 Series D 3 3⁄4% 10/2023 399 398Series E 4% 6/2025 497 497Series F 4 1⁄2% 2/2026 397 397Series G 3 7⁄8% 4/2024 398 397Series H 3 ⅜% 12/2029 640 640Series I 3 1⁄2% 9/2030 734 —2024 Credit facility term loan 1.8% 1/2024 498 4982025 Credit facility term loan 1.8% 1/2025 499 499Credit facility revolver (1) 1.7% 1/2024 1,474 (8)
5,536 3,765Other debtOther debt 8.8% 2/2024 5 29Total debt(2)(3) $5,541 $3,794 Percentage of fixed rate debt 55% 74%Weighted average interest rate 3.0% 3.8%Weighted average debt maturity 5.0 years 5.4 years
Credit FacilityTotal capacity $1,500 Available capacity 12
Assets encumbered by mortgage debt —
(1) The interest rate shown is the rate of the outstanding credit facility revolver borrowings at December 31, 2020, based on LIBOR plus 150 basis points. Depending on Host L.P.’s unsecured long-term debt rating, interest on revolver borrowings is equal to LIBOR plus a margin ranging from 117.5 to 185 basis points. There were no outstanding credit facility borrowings at December 31, 2019; the amount shown represents deferred financing costs related to the credit facility revolver.
(2) In accordance with GAAP, total debt includes the debt of entities that we consolidate, but of which we do not own 100%, and excludes the debt of entities that we do not consolidate, but of which we have a non-controlling ownership interest and record our investment therein under the equity method of accounting. As of December 31, 2020, our share of debt in unconsolidated investments is $145 million and none of our debt is attributable to non-controlling interests.
(3) Total debt as of December 31, 2020 and December 31, 2019 includes net discounts and deferred financing costs of $47 million and $35 million, respectively.
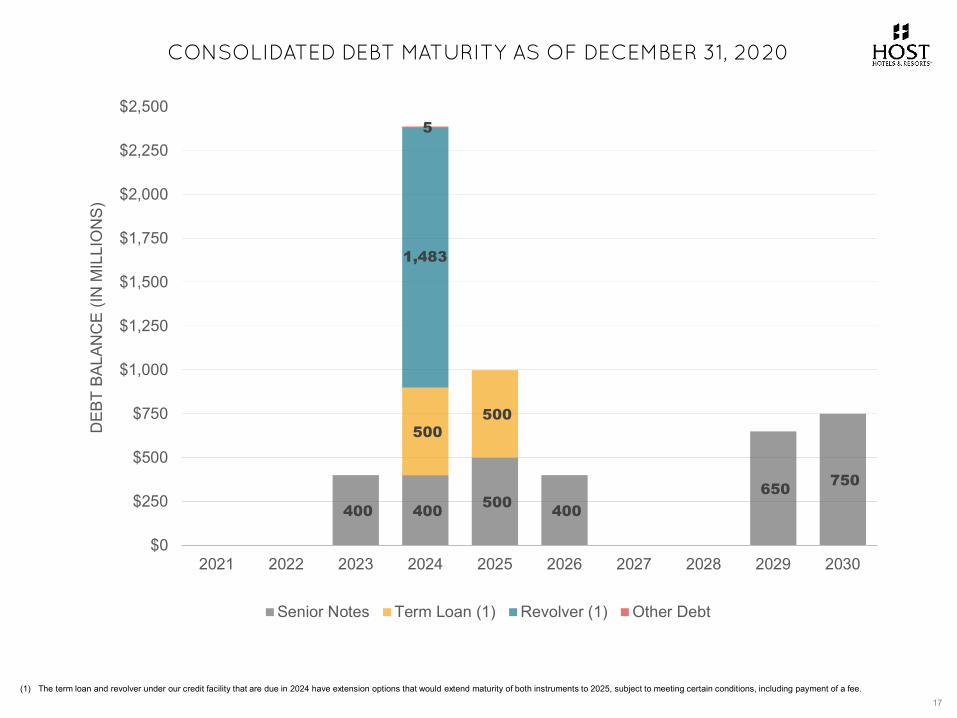
CONSOLIDATED DEBT MATURITY AS OF DECEMBER 31, 2020
17(1) The term loan and revolver under our credit facility that are due in 2024 have extension options that would extend maturity of both instruments to 2025, subject to meeting certain conditions, including payment of a fee.
400 400 500 400 650 750
500 500
1,483
5
$0
$250
$500
$750
$1,000
$1,250
$1,500
$1,750
$2,000
$2,250
$2,500
2021 2022 2023 2024 2025 2026 2027 2028 2029 2030
DEB
T BA
LAN
CE
(IN M
ILLI
ON
S)
Senior Notes Term Loan (1) Revolver (1) Other Debt
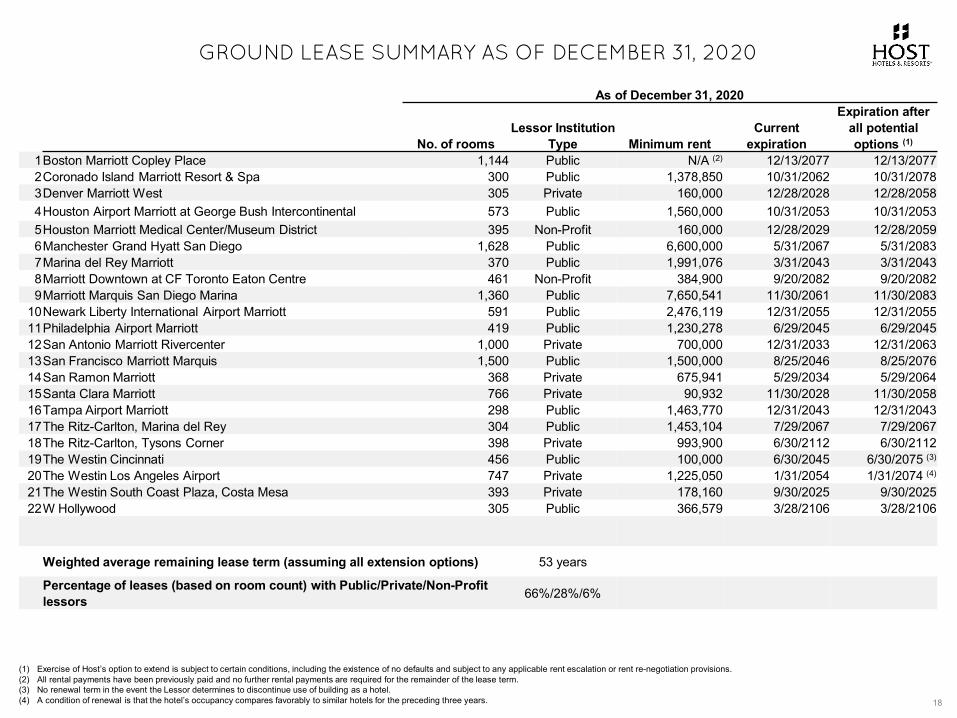
GROUND LEASE SUMMARY AS OF DECEMBER 31, 2020
18
As of December 31, 2020
No. of roomsLessor Institution
Type Minimum rentCurrent
expiration
Expiration after all potential options (1)
1Boston Marriott Copley Place 1,144 Public N/A (2) 12/13/2077 12/13/20772Coronado Island Marriott Resort & Spa 300 Public 1,378,850 10/31/2062 10/31/20783Denver Marriott West 305 Private 160,000 12/28/2028 12/28/20584Houston Airport Marriott at George Bush Intercontinental 573 Public 1,560,000 10/31/2053 10/31/20535Houston Marriott Medical Center/Museum District 395 Non-Profit 160,000 12/28/2029 12/28/20596Manchester Grand Hyatt San Diego 1,628 Public 6,600,000 5/31/2067 5/31/20837Marina del Rey Marriott 370 Public 1,991,076 3/31/2043 3/31/20438Marriott Downtown at CF Toronto Eaton Centre 461 Non-Profit 384,900 9/20/2082 9/20/20829Marriott Marquis San Diego Marina 1,360 Public 7,650,541 11/30/2061 11/30/2083
10Newark Liberty International Airport Marriott 591 Public 2,476,119 12/31/2055 12/31/205511Philadelphia Airport Marriott 419 Public 1,230,278 6/29/2045 6/29/204512San Antonio Marriott Rivercenter 1,000 Private 700,000 12/31/2033 12/31/206313San Francisco Marriott Marquis 1,500 Public 1,500,000 8/25/2046 8/25/207614San Ramon Marriott 368 Private 675,941 5/29/2034 5/29/206415Santa Clara Marriott 766 Private 90,932 11/30/2028 11/30/205816Tampa Airport Marriott 298 Public 1,463,770 12/31/2043 12/31/204317The Ritz-Carlton, Marina del Rey 304 Public 1,453,104 7/29/2067 7/29/206718The Ritz-Carlton, Tysons Corner 398 Private 993,900 6/30/2112 6/30/211219The Westin Cincinnati 456 Public 100,000 6/30/2045 6/30/2075 (3)
20The Westin Los Angeles Airport 747 Private 1,225,050 1/31/2054 1/31/2074 (4)
21The Westin South Coast Plaza, Costa Mesa 393 Private 178,160 9/30/2025 9/30/202522W Hollywood 305 Public 366,579 3/28/2106 3/28/2106
Weighted average remaining lease term (assuming all extension options) 53 years
Percentage of leases (based on room count) with Public/Private/Non-Profit lessors 66%/28%/6%
(1) Exercise of Host’s option to extend is subject to certain conditions, including the existence of no defaults and subject to any applicable rent escalation or rent re-negotiation provisions.(2) All rental payments have been previously paid and no further rental payments are required for the remainder of the lease term. (3) No renewal term in the event the Lessor determines to discontinue use of building as a hotel.(4) A condition of renewal is that the hotel’s occupancy compares favorably to similar hotels for the preceding three years.
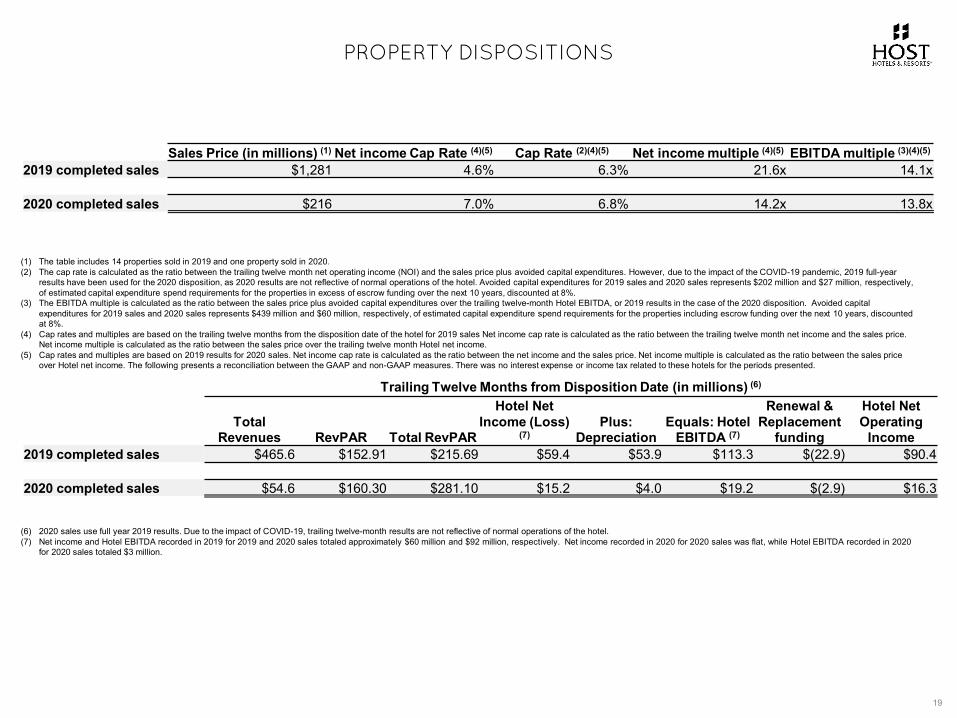
PROPERTY DISPOSITIONS
19
(1) The table includes 14 properties sold in 2019 and one property sold in 2020. (2) The cap rate is calculated as the ratio between the trailing twelve month net operating income (NOI) and the sales price plus avoided capital expenditures. However, due to the impact of the COVID-19 pandemic, 2019 full-year
results have been used for the 2020 disposition, as 2020 results are not reflective of normal operations of the hotel. Avoided capital expenditures for 2019 sales and 2020 sales represents $202 million and $27 million, respectively, of estimated capital expenditure spend requirements for the properties in excess of escrow funding over the next 10 years, discounted at 8%.
(3) The EBITDA multiple is calculated as the ratio between the sales price plus avoided capital expenditures over the trailing twelve-month Hotel EBITDA, or 2019 results in the case of the 2020 disposition. Avoided capital expenditures for 2019 sales and 2020 sales represents $439 million and $60 million, respectively, of estimated capital expenditure spend requirements for the properties including escrow funding over the next 10 years, discounted at 8%.
(4) Cap rates and multiples are based on the trailing twelve months from the disposition date of the hotel for 2019 sales Net income cap rate is calculated as the ratio between the trailing twelve month net income and the sales price. Net income multiple is calculated as the ratio between the sales price over the trailing twelve month Hotel net income.
(5) Cap rates and multiples are based on 2019 results for 2020 sales. Net income cap rate is calculated as the ratio between the net income and the sales price. Net income multiple is calculated as the ratio between the sales price over Hotel net income. The following presents a reconciliation between the GAAP and non-GAAP measures. There was no interest expense or income tax related to these hotels for the periods presented.
(6) 2020 sales use full year 2019 results. Due to the impact of COVID-19, trailing twelve-month results are not reflective of normal operations of the hotel.(7) Net income and Hotel EBITDA recorded in 2019 for 2019 and 2020 sales totaled approximately $60 million and $92 million, respectively. Net income recorded in 2020 for 2020 sales was flat, while Hotel EBITDA recorded in 2020
for 2020 sales totaled $3 million.
Sales Price (in millions) (1) Net income Cap Rate (4)(5) Cap Rate (2)(4)(5) Net income multiple (4)(5) EBITDA multiple (3)(4)(5)
2019 completed sales $1,281 4.6% 6.3% 21.6x 14.1x
2020 completed sales $216 7.0% 6.8% 14.2x 13.8x
Trailing Twelve Months from Disposition Date (in millions) (6)
Total Revenues RevPAR Total RevPAR
Hotel Net Income (Loss)
(7)Plus:
DepreciationEquals: Hotel
EBITDA (7)
Renewal & Replacement
funding
Hotel Net Operating
Income2019 completed sales $465.6 $152.91 $215.69 $59.4 $53.9 $113.3 $(22.9) $90.4
2020 completed sales $54.6 $160.30 $281.10 $15.2 $4.0 $19.2 $(2.9) $16.3
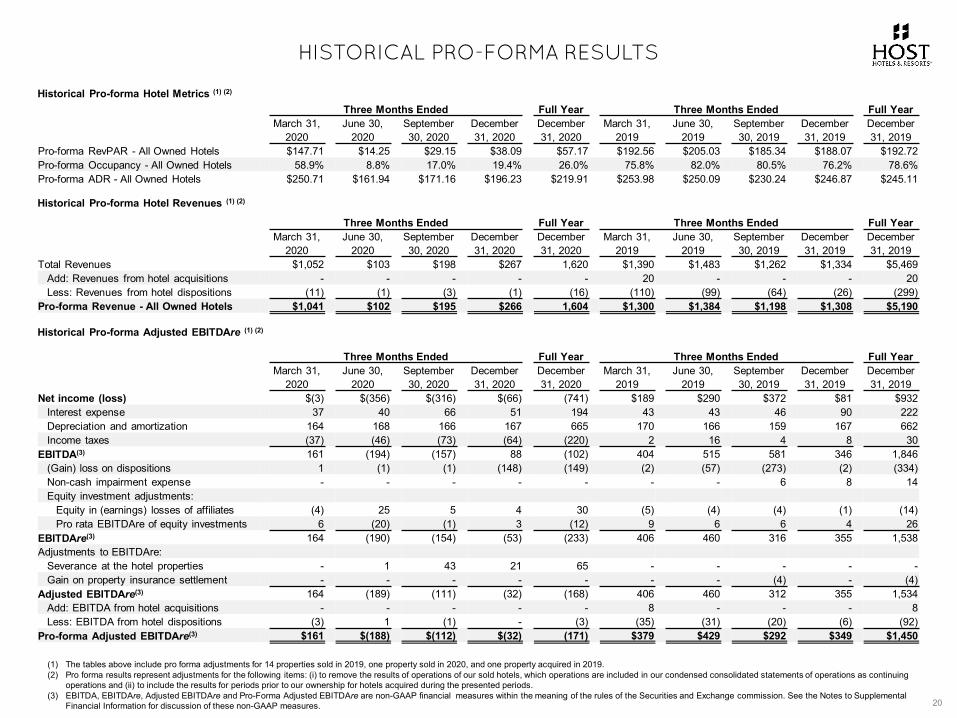
HISTORICAL PRO-FORMA RESULTS
20
Historical Pro-forma Hotel Metrics (1) (2)
Three Months Ended Full Year Three Months Ended Full YearMarch 31,
2020June 30,
2020September 30, 2020
December 31, 2020
December 31, 2020
March 31, 2019
June 30, 2019
September 30, 2019
December 31, 2019
December 31, 2019
Pro-forma RevPAR - All Owned Hotels $147.71 $14.25 $29.15 $38.09 $57.17 $192.56 $205.03 $185.34 $188.07 $192.72Pro-forma Occupancy - All Owned Hotels 58.9% 8.8% 17.0% 19.4% 26.0% 75.8% 82.0% 80.5% 76.2% 78.6%Pro-forma ADR - All Owned Hotels $250.71 $161.94 $171.16 $196.23 $219.91 $253.98 $250.09 $230.24 $246.87 $245.11
Historical Pro-forma Hotel Revenues (1) (2)
Historical Pro-forma Adjusted EBITDAre (1) (2)
Three Months Ended Full Year Three Months Ended Full YearMarch 31,
2020June 30,
2020September 30, 2020
December 31, 2020
December 31, 2020
March 31, 2019
June 30, 2019
September 30, 2019
December 31, 2019
December 31, 2019
Net income (loss) $(3) $(356) $(316) $(66) (741) $189 $290 $372 $81 $932Interest expense 37 40 66 51 194 43 43 46 90 222Depreciation and amortization 164 168 166 167 665 170 166 159 167 662Income taxes (37) (46) (73) (64) (220) 2 16 4 8 30
EBITDA(3) 161 (194) (157) 88 (102) 404 515 581 346 1,846(Gain) loss on dispositions 1 (1) (1) (148) (149) (2) (57) (273) (2) (334)Non-cash impairment expense - - - - - - - 6 8 14Equity investment adjustments:
Equity in (earnings) losses of affiliates (4) 25 5 4 30 (5) (4) (4) (1) (14)Pro rata EBITDAre of equity investments 6 (20) (1) 3 (12) 9 6 6 4 26
EBITDAre(3) 164 (190) (154) (53) (233) 406 460 316 355 1,538Adjustments to EBITDAre:
Severance at the hotel properties - 1 43 21 65 - - - - -Gain on property insurance settlement - - - - - - - (4) - (4)
Adjusted EBITDAre(3) 164 (189) (111) (32) (168) 406 460 312 355 1,534Add: EBITDA from hotel acquisitions - - - - - 8 - - - 8Less: EBITDA from hotel dispositions (3) 1 (1) - (3) (35) (31) (20) (6) (92)
Pro-forma Adjusted EBITDAre(3) $161 $(188) $(112) $(32) (171) $379 $429 $292 $349 $1,450
Three Months Ended Full Year Three Months Ended Full YearMarch 31,
2020June 30,
2020September 30, 2020
December 31, 2020
December 31, 2020
March 31, 2019
June 30, 2019
September 30, 2019
December 31, 2019
December 31, 2019
Total Revenues $1,052 $103 $198 $267 1,620 $1,390 $1,483 $1,262 $1,334 $5,469Add: Revenues from hotel acquisitions - - - - - 20 - - - 20Less: Revenues from hotel dispositions (11) (1) (3) (1) (16) (110) (99) (64) (26) (299)
Pro-forma Revenue - All Owned Hotels $1,041 $102 $195 $266 1,604 $1,300 $1,384 $1,198 $1,308 $5,190
(1) The tables above include pro forma adjustments for 14 properties sold in 2019, one property sold in 2020, and one property acquired in 2019.(2) Pro forma results represent adjustments for the following items: (i) to remove the results of operations of our sold hotels, which operations are included in our condensed consolidated statements of operations as continuing
operations and (ii) to include the results for periods prior to our ownership for hotels acquired during the presented periods.(3) EBITDA, EBITDAre, Adjusted EBITDAre and Pro-Forma Adjusted EBITDAre are non-GAAP financial measures within the meaning of the rules of the Securities and Exchange commission. See the Notes to Supplemental
Financial Information for discussion of these non-GAAP measures.
FAIRMONT KEA LANI, MAUI
OVERVIEW
PROPERTY LEVEL DATA
CAPITALIZATION
COVID-19 DATA
NOTES TO SUPPLEMENTAL
FINANCIAL INFORMATION
21
CREDIT FACILITY AMENDMENTS(1)
22
FINANCIAL COVENANTS
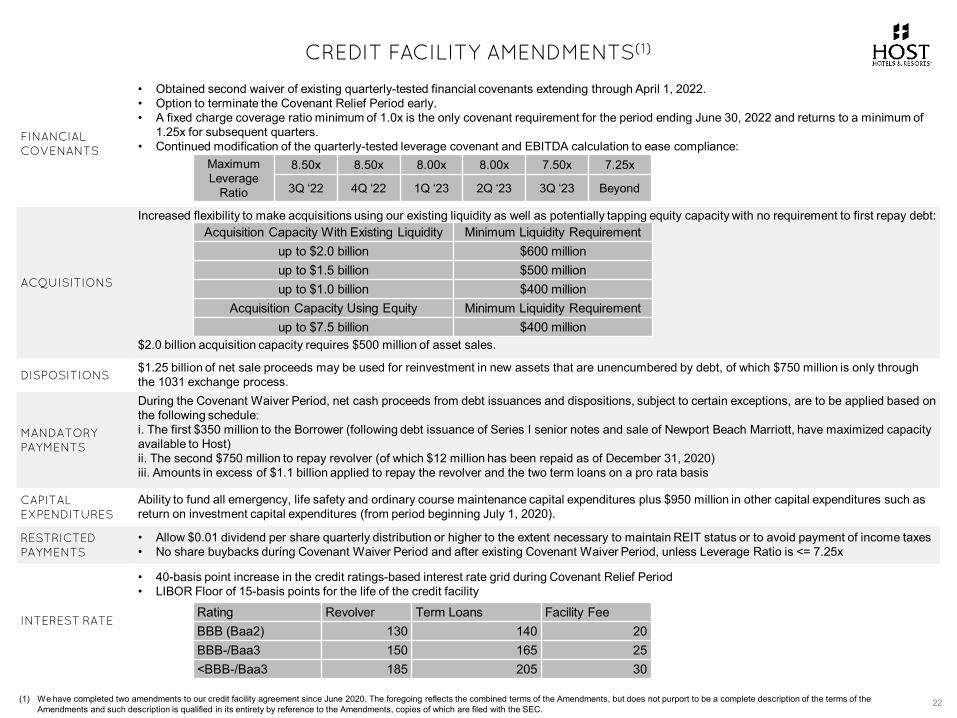
• Obtained second waiver of existing quarterly-tested financial covenants extending through April 1, 2022.• Option to terminate the Covenant Relief Period early.• A fixed charge coverage ratio minimum of 1.0x is the only covenant requirement for the period ending June 30, 2022 and returns to a minimum of
1.25x for subsequent quarters. • Continued modification of the quarterly-tested leverage covenant and EBITDA calculation to ease compliance:
ACQUISITIONS
Increased flexibility to make acquisitions using our existing liquidity as well as potentially tapping equity capacity with no requirement to first repay debt:
$2.0 billion acquisition capacity requires $500 million of asset sales.
DISPOSITIONS$1.25 billion of net sale proceeds may be used for reinvestment in new assets that are unencumbered by debt, of which $750 million is only through the 1031 exchange process.
MANDATORY PAYMENTS
During the Covenant Waiver Period, net cash proceeds from debt issuances and dispositions, subject to certain exceptions, are to be applied based on the following schedule:i. The first $350 million to the Borrower (following debt issuance of Series I senior notes and sale of Newport Beach Marriott, have maximized capacity available to Host)ii. The second $750 million to repay revolver (of which $12 million has been repaid as of December 31, 2020)iii. Amounts in excess of $1.1 billion applied to repay the revolver and the two term loans on a pro rata basis
CAPITAL EXPENDITURES
Ability to fund all emergency, life safety and ordinary course maintenance capital expenditures plus $950 million in other capital expenditures such as return on investment capital expenditures (from period beginning July 1, 2020).
RESTRICTED PAYMENTS
• Allow $0.01 dividend per share quarterly distribution or higher to the extent necessary to maintain REIT status or to avoid payment of income taxes• No share buybacks during Covenant Waiver Period and after existing Covenant Waiver Period, unless Leverage Ratio is <= 7.25x
INTEREST RATE
• 40-basis point increase in the credit ratings-based interest rate grid during Covenant Relief Period• LIBOR Floor of 15-basis points for the life of the credit facility
MaximumLeverage
Ratio
8.50x 8.50x 8.00x 8.00x 7.50x 7.25x
3Q ‘22 4Q ‘22 1Q ‘23 2Q ‘23 3Q ‘23 Beyond
Acquisition Capacity With Existing Liquidity Minimum Liquidity Requirementup to $2.0 billion $600 millionup to $1.5 billion $500 millionup to $1.0 billion $400 million
Acquisition Capacity Using Equity Minimum Liquidity Requirementup to $7.5 billion $400 million
Rating Revolver Term Loans Facility FeeBBB (Baa2) 130 140 20BBB-/Baa3 150 165 25<BBB-/Baa3 185 205 30
(1) We have completed two amendments to our credit facility agreement since June 2020. The foregoing reflects the combined terms of the Amendments, but does not purport to be a complete description of the terms of the Amendments and such description is qualified in its entirety by reference to the Amendments, copies of which are filed with the SEC.
FINANCIAL COVENANTS: CREDIT FACILITY AND SENIOR NOTES FINANCIAL PERFORMANCE TESTS
23
(UNAUDITED, IN MILLIONS, EXCEPT RATIOS)
At December 31, 2020(1)
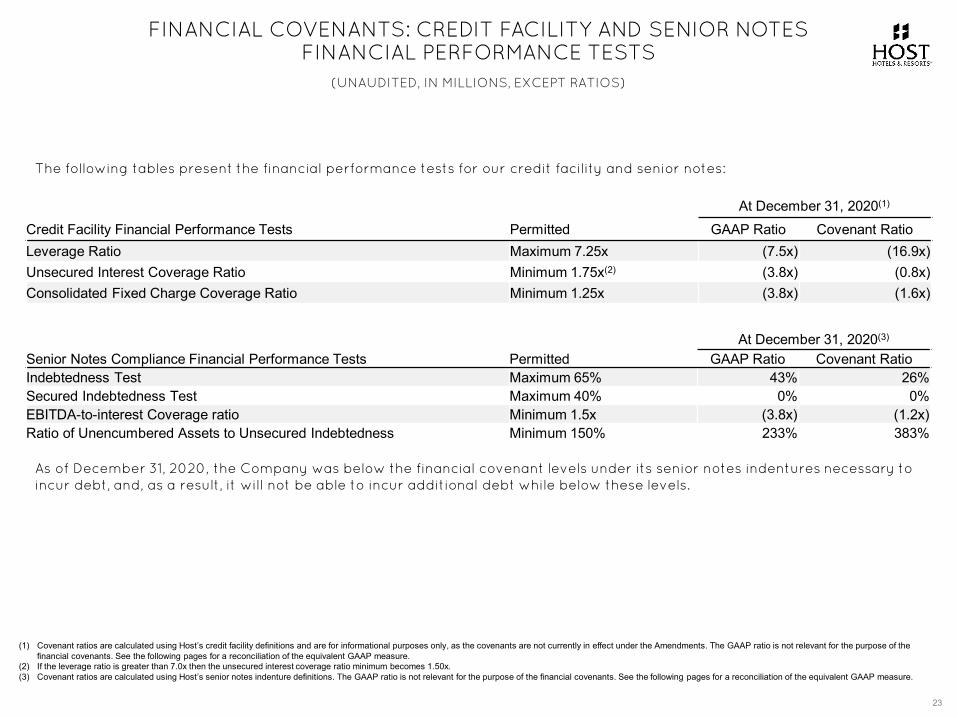
Credit Facility Financial Performance Tests Permitted GAAP Ratio Covenant RatioLeverage Ratio Maximum 7.25x (7.5x) (16.9x)Unsecured Interest Coverage Ratio Minimum 1.75x(2) (3.8x) (0.8x)Consolidated Fixed Charge Coverage Ratio Minimum 1.25x (3.8x) (1.6x)
At December 31, 2020(3)
Senior Notes Compliance Financial Performance Tests Permitted GAAP Ratio Covenant RatioIndebtedness Test Maximum 65% 43% 26%Secured Indebtedness Test Maximum 40% 0% 0%EBITDA-to-interest Coverage ratio Minimum 1.5x (3.8x) (1.2x)Ratio of Unencumbered Assets to Unsecured Indebtedness Minimum 150% 233% 383%
The following tables present the financial performance tests for our credit facility and senior notes:
(1) Covenant ratios are calculated using Host’s credit facility definitions and are for informational purposes only, as the covenants are not currently in effect under the Amendments. The GAAP ratio is not relevant for the purpose of the financial covenants. See the following pages for a reconciliation of the equivalent GAAP measure.
(2) If the leverage ratio is greater than 7.0x then the unsecured interest coverage ratio minimum becomes 1.50x.(3) Covenant ratios are calculated using Host’s senior notes indenture definitions. The GAAP ratio is not relevant for the purpose of the financial covenants. See the following pages for a reconciliation of the equivalent GAAP measure.
As of December 31, 2020, the Company was below the financial covenant levels under its senior notes indentures necessary to incur debt, and, as a result, it will not be able to incur additional debt while below these levels.
FINANCIAL COVENANTS: RECONCILIATION OF GAAP LEVERAGE RATIO TO CREDIT FACILITY LEVERAGE RATIO
24
(UNAUDITED, IN MILLIONS, EXCEPT RATIOS)
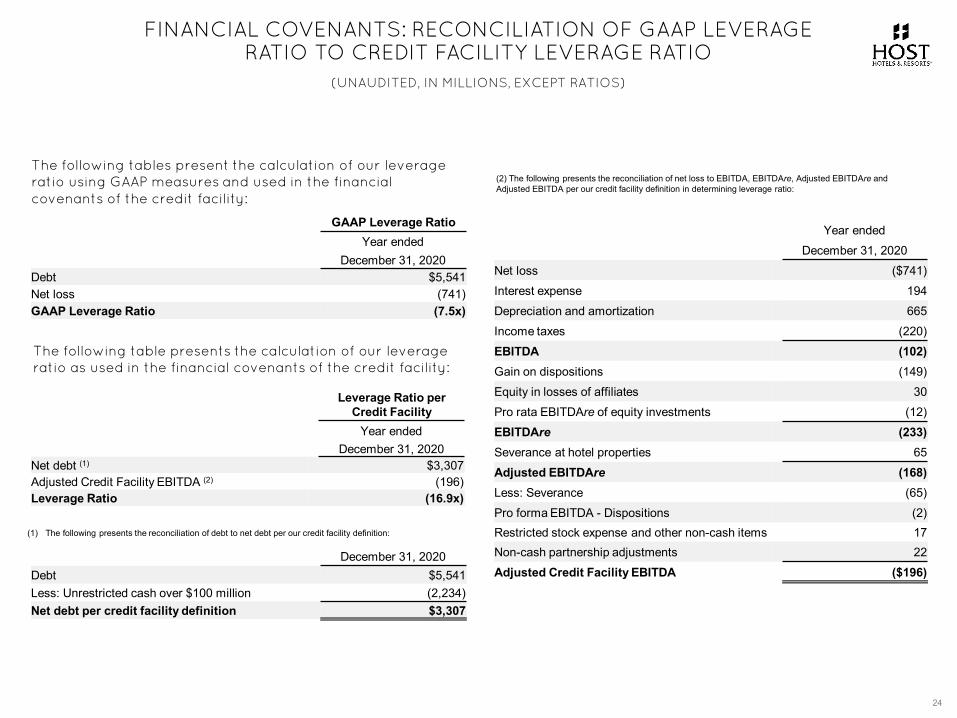
The following table presents the calculation of our leverage ratio as used in the financial covenants of the credit facility:
(1) The following presents the reconciliation of debt to net debt per our credit facility definition:
(2) The following presents the reconciliation of net loss to EBITDA, EBITDAre, Adjusted EBITDAre and Adjusted EBITDA per our credit facility definition in determining leverage ratio:
The following tables present the calculation of our leverage ratio using GAAP measures and used in the financial covenants of the credit facility:
GAAP Leverage RatioYear ended
December 31, 2020Debt $5,541Net loss (741)GAAP Leverage Ratio (7.5x)
Leverage Ratio per Credit Facility
Year endedDecember 31, 2020
Net debt (1) $3,307Adjusted Credit Facility EBITDA (2) (196)Leverage Ratio (16.9x)
December 31, 2020Debt $5,541Less: Unrestricted cash over $100 million (2,234)Net debt per credit facility definition $3,307
Year endedDecember 31, 2020
Net loss ($741)Interest expense 194Depreciation and amortization 665Income taxes (220)EBITDA (102)Gain on dispositions (149)Equity in losses of affiliates 30Pro rata EBITDAre of equity investments (12)EBITDAre (233)Severance at hotel properties 65Adjusted EBITDAre (168)Less: Severance (65)Pro forma EBITDA - Dispositions (2)Restricted stock expense and other non-cash items 17Non-cash partnership adjustments 22Adjusted Credit Facility EBITDA ($196)
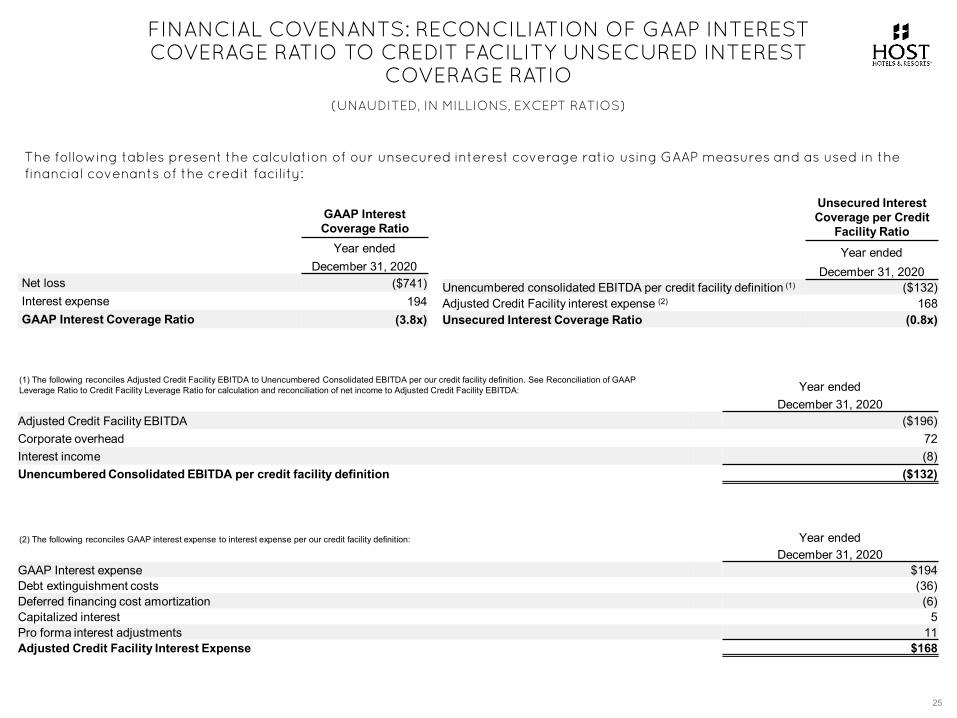
FINANCIAL COVENANTS: RECONCILIATION OF GAAP INTEREST COVERAGE RATIO TO CREDIT FACILITY UNSECURED INTEREST
COVERAGE RATIO
25
(UNAUDITED, IN MILLIONS, EXCEPT RATIOS)
The following tables present the calculation of our unsecured interest coverage ratio using GAAP measures and as used in the financial covenants of the credit facility:
GAAP Interest Coverage Ratio
Year endedDecember 31, 2020
Net loss ($741)Interest expense 194GAAP Interest Coverage Ratio (3.8x)
Unsecured Interest Coverage per Credit
Facility RatioYear ended
December 31, 2020Unencumbered consolidated EBITDA per credit facility definition (1) ($132)Adjusted Credit Facility interest expense (2) 168Unsecured Interest Coverage Ratio (0.8x)
Year endedDecember 31, 2020
Adjusted Credit Facility EBITDA ($196)Corporate overhead 72Interest income (8)Unencumbered Consolidated EBITDA per credit facility definition ($132)
Year endedDecember 31, 2020
GAAP Interest expense $194Debt extinguishment costs (36)Deferred financing cost amortization (6)Capitalized interest 5Pro forma interest adjustments 11Adjusted Credit Facility Interest Expense $168
(1) The following reconciles Adjusted Credit Facility EBITDA to Unencumbered Consolidated EBITDA per our credit facility definition. See Reconciliation of GAAP Leverage Ratio to Credit Facility Leverage Ratio for calculation and reconciliation of net income to Adjusted Credit Facility EBITDA:
(2) The following reconciles GAAP interest expense to interest expense per our credit facility definition:
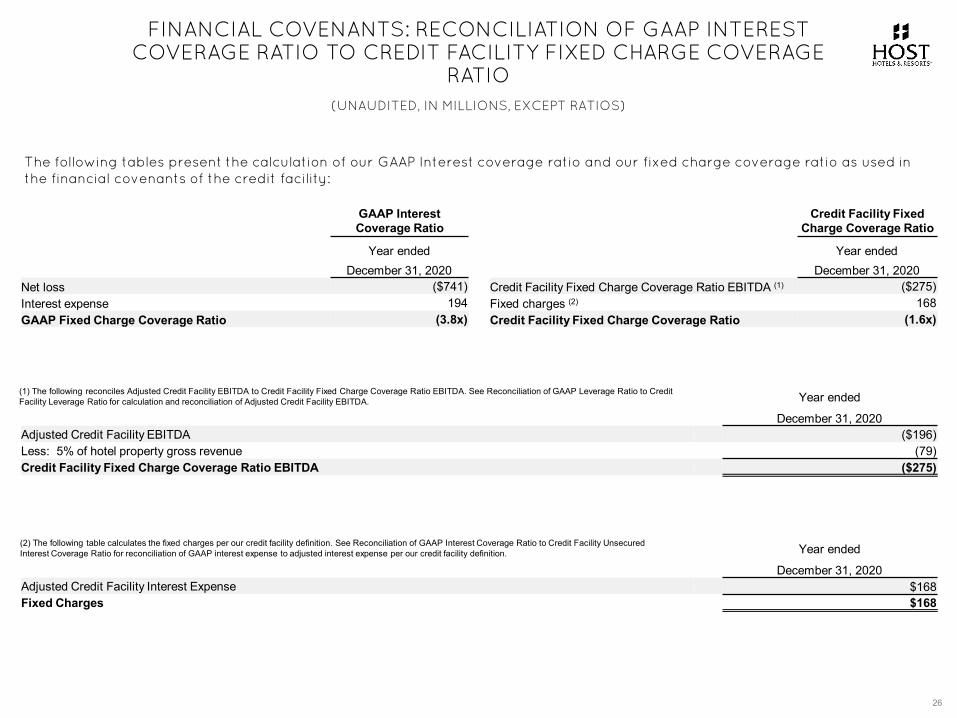
FINANCIAL COVENANTS: RECONCILIATION OF GAAP INTEREST COVERAGE RATIO TO CREDIT FACILITY FIXED CHARGE COVERAGE
RATIO
26
(UNAUDITED, IN MILLIONS, EXCEPT RATIOS)
The following tables present the calculation of our GAAP Interest coverage ratio and our fixed charge coverage ratio as used in the financial covenants of the credit facility:
GAAP Interest Coverage Ratio
Year endedDecember 31, 2020
Net loss ($741)Interest expense 194GAAP Fixed Charge Coverage Ratio (3.8x)
Credit Facility Fixed Charge Coverage Ratio
Year endedDecember 31, 2020
Credit Facility Fixed Charge Coverage Ratio EBITDA (1) ($275)Fixed charges (2) 168Credit Facility Fixed Charge Coverage Ratio (1.6x)
Year ended
December 31, 2020Adjusted Credit Facility EBITDA ($196)Less: 5% of hotel property gross revenue (79)Credit Facility Fixed Charge Coverage Ratio EBITDA ($275)
Year ended
December 31, 2020Adjusted Credit Facility Interest Expense $168Fixed Charges $168
(2) The following table calculates the fixed charges per our credit facility definition. See Reconciliation of GAAP Interest Coverage Ratio to Credit Facility Unsecured Interest Coverage Ratio for reconciliation of GAAP interest expense to adjusted interest expense per our credit facility definition.
(1) The following reconciles Adjusted Credit Facility EBITDA to Credit Facility Fixed Charge Coverage Ratio EBITDA. See Reconciliation of GAAP Leverage Ratio to Credit Facility Leverage Ratio for calculation and reconciliation of Adjusted Credit Facility EBITDA.
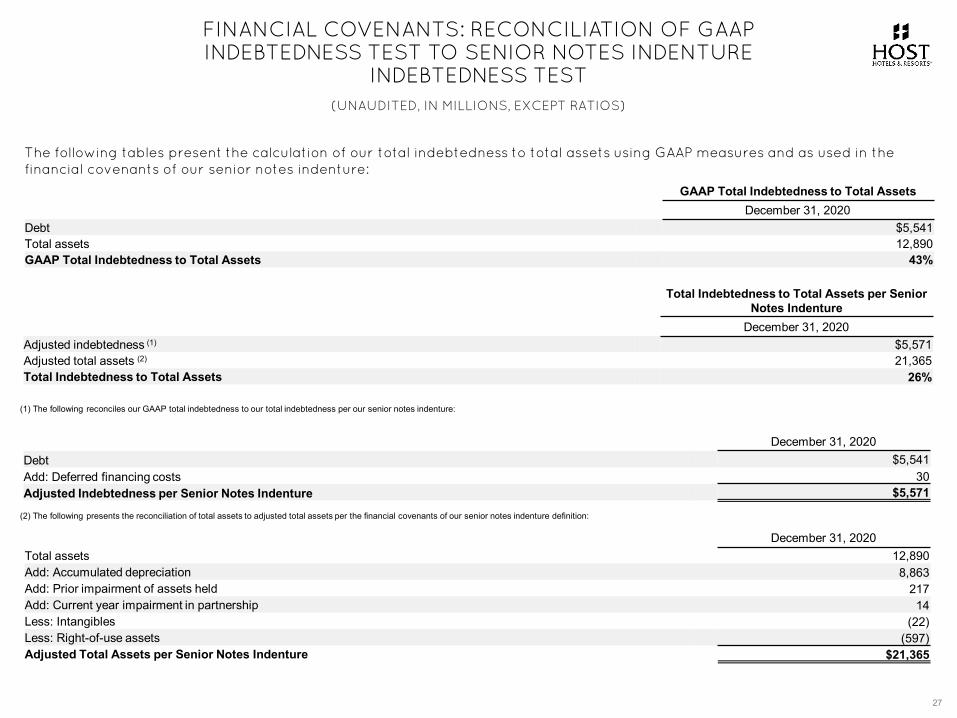
December 31, 2020Total assets 12,890Add: Accumulated depreciation 8,863Add: Prior impairment of assets held 217Add: Current year impairment in partnership 14Less: Intangibles (22)Less: Right-of-use assets (597)Adjusted Total Assets per Senior Notes Indenture $21,365
FINANCIAL COVENANTS: RECONCILIATION OF GAAP INDEBTEDNESS TEST TO SENIOR NOTES INDENTURE
INDEBTEDNESS TEST
27
(UNAUDITED, IN MILLIONS, EXCEPT RATIOS)
The following tables present the calculation of our total indebtedness to total assets using GAAP measures and as used in thefinancial covenants of our senior notes indenture:
(2) The following presents the reconciliation of total assets to adjusted total assets per the financial covenants of our senior notes indenture definition:
(1) The following reconciles our GAAP total indebtedness to our total indebtedness per our senior notes indenture:
GAAP Total Indebtedness to Total AssetsDecember 31, 2020
Debt $5,541Total assets 12,890GAAP Total Indebtedness to Total Assets 43%
Total Indebtedness to Total Assets per Senior Notes Indenture
December 31, 2020Adjusted indebtedness (1) $5,571Adjusted total assets (2) 21,365Total Indebtedness to Total Assets 26%
December 31, 2020Debt $5,541Add: Deferred financing costs 30Adjusted Indebtedness per Senior Notes Indenture $5,571
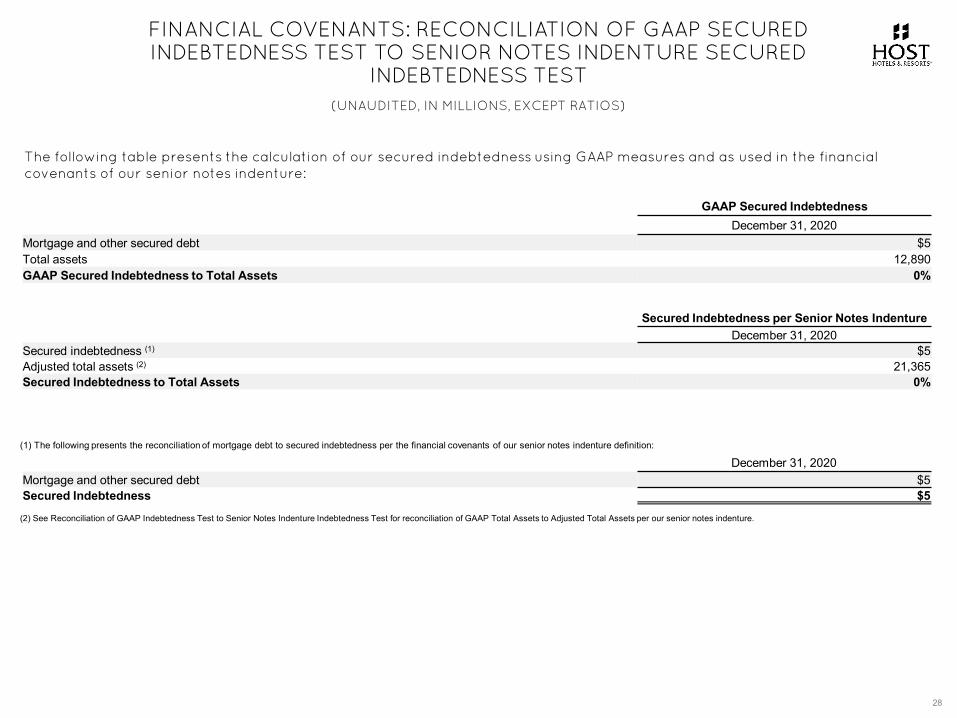
FINANCIAL COVENANTS: RECONCILIATION OF GAAP SECURED INDEBTEDNESS TEST TO SENIOR NOTES INDENTURE SECURED
INDEBTEDNESS TEST
28
(UNAUDITED, IN MILLIONS, EXCEPT RATIOS)
The following table presents the calculation of our secured indebtedness using GAAP measures and as used in the financial covenants of our senior notes indenture:
(2) See Reconciliation of GAAP Indebtedness Test to Senior Notes Indenture Indebtedness Test for reconciliation of GAAP Total Assets to Adjusted Total Assets per our senior notes indenture.
(1) The following presents the reconciliation of mortgage debt to secured indebtedness per the financial covenants of our senior notes indenture definition:
GAAP Secured IndebtednessDecember 31, 2020
Mortgage and other secured debt $5Total assets 12,890GAAP Secured Indebtedness to Total Assets 0%
Secured Indebtedness per Senior Notes IndentureDecember 31, 2020
Secured indebtedness (1) $5Adjusted total assets (2) 21,365Secured Indebtedness to Total Assets 0%
December 31, 2020Mortgage and other secured debt $5Secured Indebtedness $5
FINANCIAL COVENANTS: RECONCILIATION OF GAAP INTEREST COVERAGE RATIO TO SENIOR NOTES INDENTURE EBITDA-TO-
INTEREST COVERAGE RATIO
29
(UNAUDITED, IN MILLIONS, EXCEPT RATIOS)
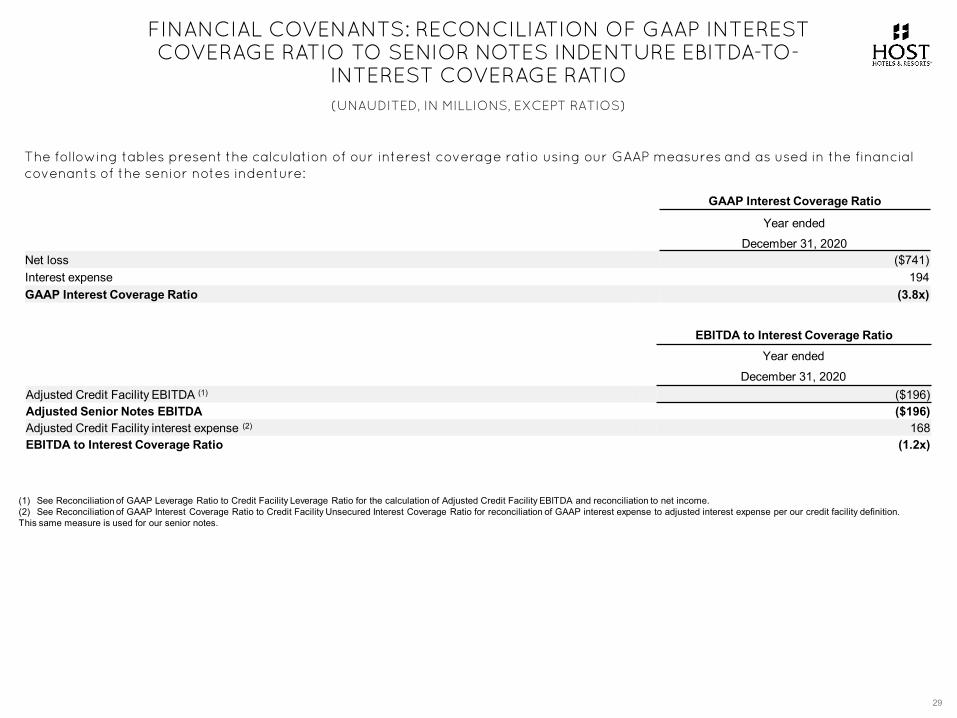
The following tables present the calculation of our interest coverage ratio using our GAAP measures and as used in the financialcovenants of the senior notes indenture:
(1) See Reconciliation of GAAP Leverage Ratio to Credit Facility Leverage Ratio for the calculation of Adjusted Credit Facility EBITDA and reconciliation to net income.(2) See Reconciliation of GAAP Interest Coverage Ratio to Credit Facility Unsecured Interest Coverage Ratio for reconciliation of GAAP interest expense to adjusted interest expense per our credit facility definition. This same measure is used for our senior notes.
GAAP Interest Coverage Ratio
Year endedDecember 31, 2020
Net loss ($741)Interest expense 194GAAP Interest Coverage Ratio (3.8x)
EBITDA to Interest Coverage RatioYear ended
December 31, 2020Adjusted Credit Facility EBITDA (1) ($196)Adjusted Senior Notes EBITDA ($196)Adjusted Credit Facility interest expense (2) 168EBITDA to Interest Coverage Ratio (1.2x)
FINANCIAL COVENANTS: RECONCILIATION OF GAAP ASSETS TO INDEBTEDNESS TEST TO SENIOR NOTES UNENCUMBERED ASSETS
TO UNSECURED INDEBTEDNESS TEST
30
(UNAUDITED, IN MILLIONS, EXCEPT RATIOS)
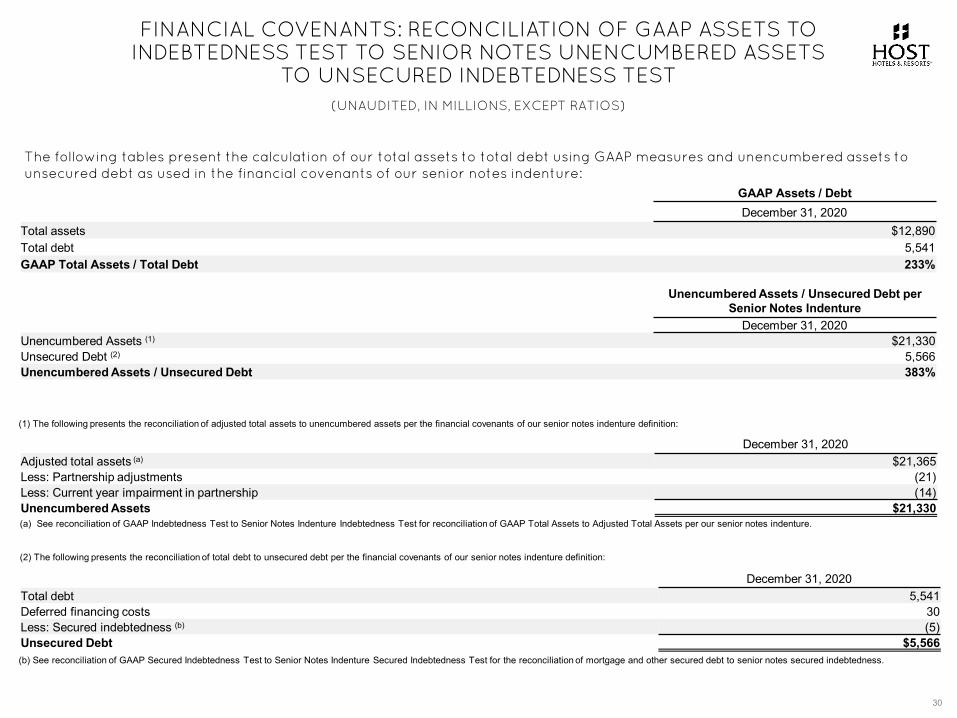
The following tables present the calculation of our total assets to total debt using GAAP measures and unencumbered assets tounsecured debt as used in the financial covenants of our senior notes indenture:
(1) The following presents the reconciliation of adjusted total assets to unencumbered assets per the financial covenants of our senior notes indenture definition:
GAAP Assets / DebtDecember 31, 2020
Total assets $12,890Total debt 5,541GAAP Total Assets / Total Debt 233%
Unencumbered Assets / Unsecured Debt per Senior Notes Indenture
December 31, 2020Unencumbered Assets (1) $21,330Unsecured Debt (2) 5,566Unencumbered Assets / Unsecured Debt 383%
December 31, 2020Adjusted total assets (a) $21,365Less: Partnership adjustments (21)Less: Current year impairment in partnership (14)Unencumbered Assets $21,330(a) See reconciliation of GAAP Indebtedness Test to Senior Notes Indenture Indebtedness Test for reconciliation of GAAP Total Assets to Adjusted Total Assets per our senior notes indenture.
(2) The following presents the reconciliation of total debt to unsecured debt per the financial covenants of our senior notes indenture definition:
December 31, 2020Total debt 5,541Deferred financing costs 30Less: Secured indebtedness (b) (5)Unsecured Debt $5,566(b) See reconciliation of GAAP Secured Indebtedness Test to Senior Notes Indenture Secured Indebtedness Test for the reconciliation of mortgage and other secured debt to senior notes secured indebtedness.
HOTELS WITH SUSPENDED OPERATIONS
31
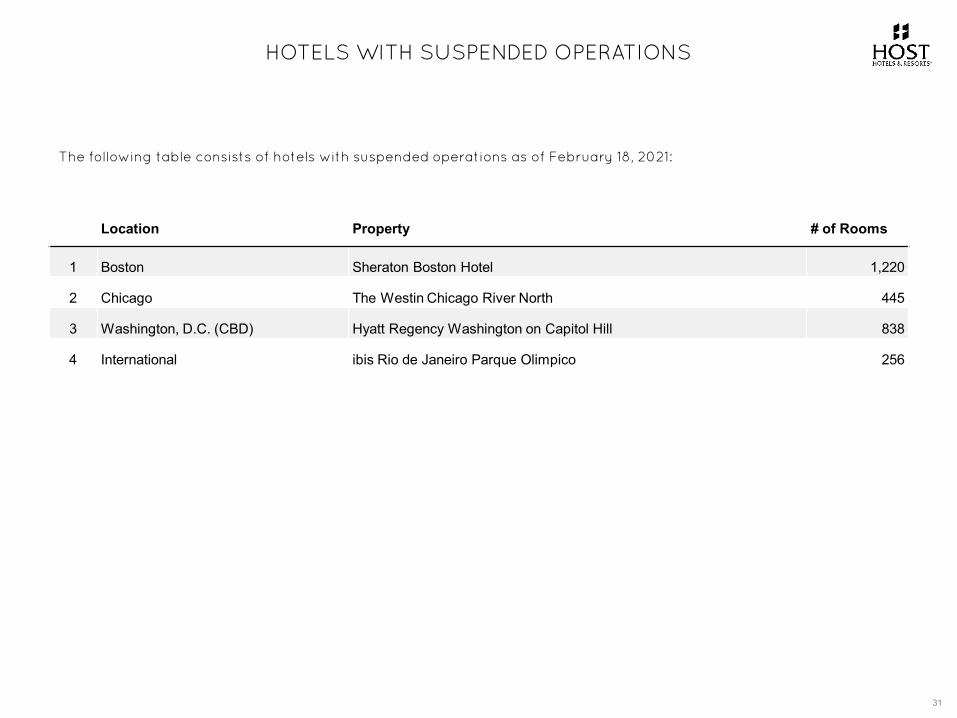
The following table consists of hotels with suspended operations as of February 18, 2021:
Location Property # of Rooms
1 Boston Sheraton Boston Hotel 1,220
2 Chicago The Westin Chicago River North 445
3 Washington, D.C. (CBD) Hyatt Regency Washington on Capitol Hill 838
4 International ibis Rio de Janeiro Parque Olimpico 256

NEW YORK MARRIOTT MARQUIS
OVERVIEW
PROPERTY LEVEL DATA
CAPITALIZATION
COVID-19 DATA
NOTES TO SUPPLEMENTAL
FINANCIAL INFORMATION
32
ALL OWNED HOTEL OPERATING STATISTICS AND RESULTS
To facilitate a quarter-to-quarter comparison of our operations, we typically present certain operating statistics (i.e., Total RevPAR, RevPAR, average daily rate and average occupancy) and operating results (revenues, expenses, hotel EBITDA and associated margins) for the periods included in this presentation on a comparable hotel basis in order to enable our investors to better evaluate our operating performance (discussed in “Comparable Hotel Operating Statistics” below). However, due to the COVID-19 pandemic and its effects on operations there is little comparability between periods. For this reason, we temporarily are suspending our comparable hotel presentation and instead present hotel operating results for all consolidated hotels and, to facilitate comparisons between periods, we are presenting results on a pro forma basis, including the following adjustments: (1) operating results are presented for all consolidated hotels owned as of December 31, 2020, but do not include the results of operations for properties sold in 2019 or through the reporting date; and (2) operating results for acquisitions in the current and prior year are reflected for full calendar years, to include results for periods prior to our ownership. For these hotels, since the year-over-year comparison includes periods prior to our ownership, the changes will not necessarily correspond to changes in our actual results.
NON-GAAP FINANCIAL MEASURES
Included in this supplemental information are certain “non-GAAP financial measures,” which are measures of our historical or future financial performance that are not calculated and presented in accordance with GAAP, within the meaning of applicable SEC rules. They are as follows: (i) EBITDA, (ii) EBITDAreand Adjusted EBITDAre, (iii) NOI, (iv) All Owned Hotel Property Level Operating Results, (v) Credit Facility Financial Performance Tests, and (vi) Senior Notes Financial Performance Tests. The following discussion defines these measures and presents why we believe they are useful supplemental measures of our performance.
Beginning in the third quarter of 2020, we changed our definition of Adjusted EBITDAre remove amounts from hotel property level operating results to exclude non-ordinary course severance costs, which we believe provides useful supplemental information that is beneficial to an investor’s understanding of our ongoing operating performance. Furlough costs, which are viewed as a replacement to wages, and employee retention amounts will continue to be included in these metrics.
33
NOTES TO SUPPLEMENTAL FINANCIAL INFORMATION
NON-GAAP FINANCIAL MEASURES (continued)EBITDA AND NOI
Earnings before Interest Expense, Income Taxes, Depreciation and Amortization (“EBITDA”) is a commonly used measure of performance in many industries. Management believes EBITDA provides useful information to investors regarding our results of operations because it helps us and our investors evaluate the ongoing operating performance of our properties after removing the impact of the Company’s capital structure (primarily interest expense) and its asset base (primarily depreciation and amortization). Management also believes the use of EBITDA facilitates comparisons between us and other lodging REITs, hotel owners that are not REITs and other capital-intensive companies. Management uses EBITDA to evaluate property-level results and EBITDA multiples (calculated as sales price divided by EBITDA) as one measure in determining the value of acquisitions and dispositions and, like Funds From Operations (“FFO”) and Adjusted FFO per diluted share, it is widely used by management in the annual budget process and for our compensation programs. Management also uses NOI when calculating capitalization rates (“Cap Rates”) to evaluate acquisitions and dispositions. For a specific hotel, NOI is calculated as the hotel or entity level EBITDA less an estimate for the annual contractual reserve requirements for renewal and replacement expenditures. Cap Rates are calculated as NOI divided by sales price. Management believes using Cap Rates allows for a consistent valuation method in comparing the purchase or sale value of properties.
EBITDAre AND ADJUSTED EBITDAre
We present EBITDAre in accordance with NAREIT guidelines, as defined in its September 2017 white paper “Earnings Before Interest, Taxes, Depreciation and Amortization for Real Estate,” to provide an additional performance measure to facilitate the evaluation and comparison of the Company’s results with other REITs. NAREIT defines EBITDAre as net income (calculated in accordance with GAAP) excluding interest expense, income tax, depreciation and amortization, gains or losses on disposition of depreciated property (including gains or losses on change of control), impairment expense of depreciated property and of investments in unconsolidated affiliates caused by a decrease in value of depreciated property in the affiliate, and adjustments to reflect the entity’s pro rata share of EBITDAre of unconsolidated affiliates.
We make additional adjustments to EBITDAre when evaluating our performance because we believe that the exclusion of certain additional items described below provides useful supplemental information to investors regarding our ongoing operating performance. We believe that the presentation of Adjusted EBITDAre, when combined with the primary GAAP presentation of net income, is beneficial to an investor’s understanding of our operating performance. Adjusted EBITDAre also is similar to the measure used to calculate certain credit ratios for our credit facility and senior notes. We adjust EBITDAre for the following items, which may occur in any period, and refer to this measure as Adjusted EBITDAre:
• Property Insurance Gains – We exclude the effect of property insurance gains reflected in our consolidated statements of operations because we believe that including them in Adjusted EBITDAre is not consistent with reflecting the ongoing performance of our assets. In addition, property insurance gains could be less important to investors given that the depreciated asset book value written off in connection with the calculation of the property insurance gain often does not reflect the market value of real estate assets.
34
NOTES TO SUPPLEMENTAL FINANCIAL INFORMATION
NON-GAAP FINANCIAL MEASURES (continued)• Acquisition Costs – Under GAAP, costs associated with completed property acquisitions that are considered business combinations are expensed in the
year incurred. We exclude the effect of these costs because we believe they are not reflective of the ongoing performance of the Company.
• Litigation Gains and Losses – We exclude the effect of gains or losses associated with litigation recorded under GAAP that we consider outside the ordinary course of business. We believe that including these items is not consistent with our ongoing operating performance.
• Severance Expense – Effective beginning the third quarter of 2020, in certain circumstances, we will add back hotel-level severance expenses when we do not believe that such expenses are reflective of the ongoing operation of our properties. Situations that would result in a severance add-back include, but are not limited to, (i) costs incurred as part of a broad-based reconfiguration of the operating model with the specific hotel operator for a portfolio of hotels and (ii) costs incurred at a specific hotel due to a broad-based and significant reconfiguration of a hotel and/or its workforce. We do not add back corporate-level severance costs or severance costs at an individual hotel that we consider to be incurred in the normal course of business.
In unusual circumstances, we also may adjust EBITDAre for gains or losses that management believes are not representative of the Company’s current operating performance. The last such adjustment of this nature was a 2013 exclusion of a gain from an eminent domain claim.
LIMITATIONS ON THE USE OF EBITDA, EBITDAre, ADJUSTED EBITDAre AND NOI
EBITDA, EBITDAre, Adjusted EBITDAre, and NOI, as presented, may not be comparable to measures calculated by other companies. This information should not be considered as an alternative to net income, operating profit, cash from operations or any other operating performance measure calculated in accordance with GAAP. Cash expenditures for various long-term assets (such as renewal and replacement capital expenditures, with the exception of NOI), interest expense (for EBITDA, EBITDAre, Adjusted EBITDAre and NOI purposes only) severance expense related to significant property-level reconfiguration and other items have been, and will be, made and are not reflected in the EBITDA, EBITDAre, Adjusted EBITDAre, and NOI presentations. Management compensates for these limitations by separately considering the impact of these excluded items to the extent they are material to operating decisions or assessments of our operating performance.
35
NOTES TO SUPPLEMENTAL FINANCIAL INFORMATION
NON-GAAP FINANCIAL MEASURES (continued)Our consolidated statements of operations and consolidated statements of cash flows (“Statements of Cash Flows”) in the Company’s annual report on Form 10-K and quarterly reports on Form 10-Q include interest expense, capital expenditures, and other excluded items, all of which should be considered when evaluating our performance, as well as the usefulness of our non-GAAP financial measures. Additionally, EBITDA, EBITDAre, Adjusted EBITDAre and NOI should not be considered as a measure of our liquidity or indicative of funds available to fund our cash needs, including our ability to make cash distributions.
Similarly, EBITDAre and Adjusted EBITDAre, include adjustments for the pro rata share of our equity investments. Our equity investments consist of interests ranging from 11% to 67% in seven domestic and international partnerships that own a total of 10 properties and a vacation ownership development. Due to the voting rights of the outside owners, we do not control and, therefore, do not consolidate these entities. The non-controlling partners in consolidated partnerships primarily consist of the approximate 1% interest in Host LP held by outside partners, and a 15% interest held by outside partners in a partnership owning one hotel for which we do control the entity and, therefore, consolidate its operations. These pro rata results for EBITDAre and Adjusted EBITDArewere calculated as set forth in the definitions above. Readers should be cautioned that the pro rata results presented in these measures for equity investments may not accurately depict the legal and economic implications of our investments in these entities.
HOTEL PROPERTY LEVEL OPERATING RESULTS
We present certain operating results for our hotels, such as hotel revenues, expenses, food and beverage profit, and EBITDA, on a hotel-level pro forma basis as supplemental information for our investors. Our hotel results reflect the operating results of our hotels as discussed in “All Owned Hotel Operating Statistics and Results” above. We present all owned hotel pro forma EBITDA to help us and our investors evaluate the ongoing operating performance of our hotels after removing the impact of the Company’s capital structure (primarily interest expense) and its asset base (primarily depreciation and amortization expense). Corporate-level costs and expenses also are removed to arrive at property-level results. We believe these property-level results provide investors with supplemental information about the ongoing operating performance of our hotels. All owned hotel pro forma results are presented both by location and for the Company’s properties in the aggregate. While severance expense is not uncommon at the individual property level in the normal course of business, we eliminate from our hotel level operating results severance costs related to broad-based and significant property-level reconfiguration that is not considered to be within the normal course of business, as we believe this elimination provides useful supplemental information that is beneficial to an investor’s understanding of our ongoing operating performance. We also eliminate depreciation and amortization expense because, even though depreciation and amortization expense are property-level expenses, these non-cash expenses, which are based on historical cost accounting for real estate assets, implicitly assume that the value of real estate assets diminishes predictably over time. As noted earlier, because real estate values historically have risen or fallen with market conditions, many real estate industry investors have considered presentation of historical cost accounting for operating results to be insufficient.
36
NOTES TO SUPPLEMENTAL FINANCIAL INFORMATION
NON-GAAP FINANCIAL MEASURES (continued)Because of the elimination of corporate-level costs and expenses, gains or losses on disposition, certain severance expenses and depreciation and amortization expense, the hotel operating results we present do not represent our total revenues, expenses, operating profit or net income and should not be used to evaluate our performance as a whole. Management compensates for these limitations by separately considering the impact of these excluded items to the extent they are material to operating decisions or assessments of our operating performance. Our consolidated statements of operations include such amounts, all of which should be considered by investors when evaluating our performance.
While management believes that presentation of all owned hotel results is a supplemental measure that provides useful information in evaluating our ongoing performance, this measure is not used to allocate resources or to assess the operating performance of each of our hotels, as these decisions are based on data for individual hotels and are not based on all owned hotel results in the aggregate. For these reasons, we believe all owned hotel operating results, when combined with the presentation of GAAP operating profit, revenues and expenses, provide useful information to investors and management.
CREDIT FACILITY – LEVERAGE, UNSECURED INTEREST COVERAGE AND CONSOLIDATED FIXED CHARGE COVERAGE RATIOS
Host’s credit facility contains certain financial covenants, including allowable leverage, unsecured interest coverage and fixed charge ratios, which are determined using EBITDA as calculated under the terms of our credit facility (“Adjusted Credit Facility EBITDA”). The leverage ratio is defined as net debt plus preferred equity to Adjusted Credit Facility EBITDA. The unsecured interest coverage ratio is defined as unencumbered Adjusted Credit Facility EBITDA to unsecured consolidated interest expense. The fixed charge coverage ratio is defined as Adjusted Credit Facility EBITDA divided by fixed charges, which include interest expense, required debt amortization payments, cash taxes and preferred stock payments. These calculations are based on pro forma results for the prior four fiscal quarters, giving effect to transactions such as acquisitions, dispositions and financings as if they occurred at the beginning of the period. The credit facility also incorporates by reference the ratio of unencumbered assets to unsecured indebtedness test from our senior notes indentures, calculated in the same manner, and the covenant is discussed below with the senior notes covenants.
Additionally, total debt used in the calculation of our leverage ratio is based on a “net debt” concept, under which cash and cash equivalents in excess of $100 million are deducted from our total debt balance. Management believes these financial ratios provide useful information to investors regarding our compliance with the covenants in our credit facility and our ability to access the capital markets, in particular debt financing.
37
NOTES TO SUPPLEMENTAL FINANCIAL INFORMATION
NON-GAAP FINANCIAL MEASURES (continued)
SENIOR NOTES INDENTURE – INDEBTEDNESS TEST, SECURED INDEBTEDNESS TO TOTAL ASSETS TEST, EBITDA-TO-INTEREST COVERAGE RATIO AND RATIO OF UNENCUMBERED ASSETS TO UNSECURED INDEBTEDNESS
Host’s senior notes indentures contains certain financial covenants, including allowable indebtedness, secured indebtedness to total assets, EBITDA-to-interest coverage and unencumbered assets to unsecured indebtedness. The indebtedness test is defined as adjusted indebtedness, which includes total debt adjusted for deferred financing costs, divided by adjusted total assets, which includes undepreciated real estate book values (“Adjusted Total Assets”). The secured indebtedness to total assets is defined as secured indebtedness, which includes mortgage debt and finance leases, divided by Adjusted Total Assets. The EBITDA-to-interest coverage ratio is defined as EBITDA as calculated under our senior notes indenture (“Adjusted Senior Notes EBITDA”) to interest expense as defined by our senior notes indenture. The ratio of unencumbered assets to unsecured indebtedness is defined as unencumbered adjusted assets, which includes Adjusted Total Assets less encumbered assets, divided by unsecured debt, which includes the aggregate principal amount of outstanding unsecured indebtedness plus contingent obligations.
Under the terms of the senior notes indentures, interest expense excludes items such as the gains and losses on the extinguishment of debt, deferred financing charges related to the senior notes or the credit facility, amortization of debt premiums or discounts that were recorded at issuance of a loan to establish its fair value and non-cash interest expense, all of which are included in interest expense on our consolidated statement of operations. As with the credit facility covenants, management believes these financial ratios provide useful information to investors regarding our compliance with the covenants in our senior notes indentures and our ability to access the capital markets, in particular debt financing.
LIMITATIONS ON CREDIT FACILITY AND SENIOR NOTES CREDIT RATIOS
These metrics are useful in evaluating the Company’s compliance with the covenants contained in its credit facility and senior notes indentures. However, because of the various adjustments taken to the ratio components as a result of negotiations with the Company’s lenders and noteholders they should not be considered as an alternative to the same ratios determined in accordance with GAAP. For instance, interest expense as calculated under the credit facility and senior notes indenture excludes the items noted above such as deferred financing charges and amortization of debt premiums or discounts, all of which are included in interest expense on our consolidated statement of operations. Management compensates for these limitations by separately considering the impact of these excluded items to the extent they are material to operating decisions or assessments of performance. In addition, because the credit facility and indenture ratio components are also based on pro forma results for the prior four fiscal quarters, giving effect to transactions such as acquisitions, dispositions and financings as if they occurred at the beginning of the period, they are not reflective of actual performance over the same period calculated in accordance with GAAP.
38
NOTES TO SUPPLEMENTAL FINANCIAL INFORMATION