SEPTEMBER 2019 - Seeking Alpha
44
At EnerSys, we pursue perfection to deliver Power to innovate and inspire. Power delivered simply, safely and sustainably. Power that creates superior value for our customers and shareholders. We are proud to be EnerSys. “Powering the Future Everywhere for Everyone.” SEPTEMBER 2019
Transcript of SEPTEMBER 2019 - Seeking Alpha

At EnerSys, we pursue perfection to
deliver Power to innovate and inspire.
Power delivered simply, safely
and sustainably.
Power that creates superior
value for our customers and
shareholders.
We are proud to be EnerSys.
“Powering the Future
Everywhere for Everyone.”
SEPTEMBER 2019
Forward-Looking Information
This presentation includes forward-looking statements and/or information,
which are based on the Company’s current expectations and assumptions,
and are subject to a number of risks and uncertainties that could cause
actual results to materially differ from those anticipated. Such risks include,
among others, risks associated with competitive actions, technology
development and implementation, intellectual property infringement, failure
to execute acquisition strategy, penetration of existing markets, expansion
into new markets, hiring and retaining high quality management and key
employees and general economic conditions including the risks described in
the Company’s most recent annual report on Form 10-K dated and filed with
the SEC on May 29, 2019 along with other unforeseen risks. The statements
in this presentation and accompanying commentary are made as of the date
of this presentation, even if subsequently made available by the Company
on its website or otherwise. The Company does not undertake any
obligation to update or revise these statements to reflect events or
circumstances occurring after the date of this presentation.
2
EnerSys Acquires Alpha Group
A Compelling Combination, Providing a Full
Suite of Power Solutions
3
A Uniquely Compelling
Acquisition
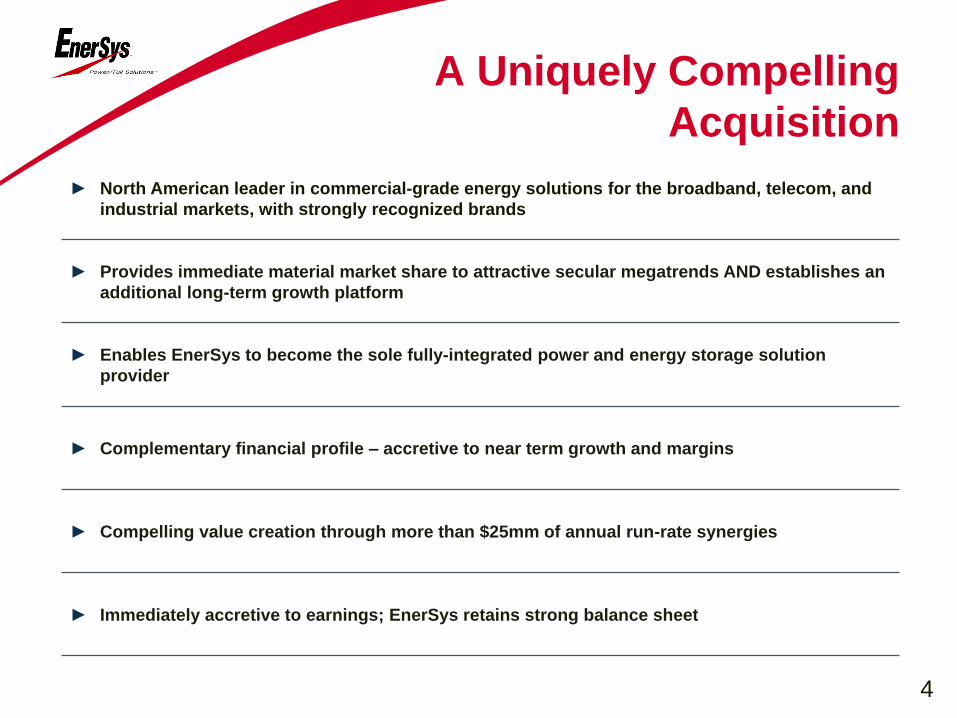
► North American leader in commercial-grade energy solutions for the broadband, telecom, and
industrial markets, with strongly recognized brands
► Provides immediate material market share to attractive secular megatrends AND establishes an
additional long-term growth platform
► Enables EnerSys to become the sole fully-integrated power and energy storage solution
provider
► Complementary financial profile – accretive to near term growth and margins
► Compelling value creation through more than $25mm of annual run-rate synergies
► Immediately accretive to earnings; EnerSys retains strong balance sheet
4
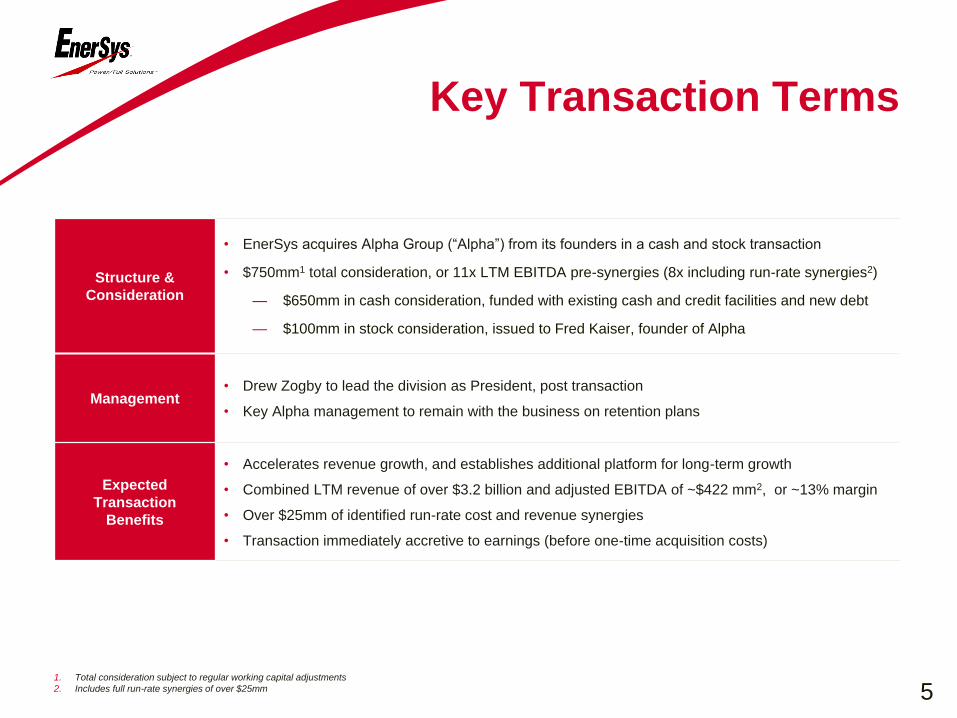
Key Transaction Terms
Structure &
Consideration
• EnerSys acquires Alpha Group (“Alpha”) from its founders in a cash and stock transaction
• $750mm1 total consideration, or 11x LTM EBITDA pre-synergies (8x including run-rate synergies2)
— $650mm in cash consideration, funded with existing cash and credit facilities and new debt
— $100mm in stock consideration, issued to Fred Kaiser, founder of Alpha
Management• Drew Zogby to lead the division as President, post transaction
• Key Alpha management to remain with the business on retention plans
Expected
Transaction
Benefits
• Accelerates revenue growth, and establishes additional platform for long-term growth
• Combined LTM revenue of over $3.2 billion and adjusted EBITDA of ~$422 mm2, or ~13% margin
• Over $25mm of identified run-rate cost and revenue synergies
• Transaction immediately accretive to earnings (before one-time acquisition costs)
1. Total consideration subject to regular working capital adjustments
2. Includes full run-rate synergies of over $25mm 5
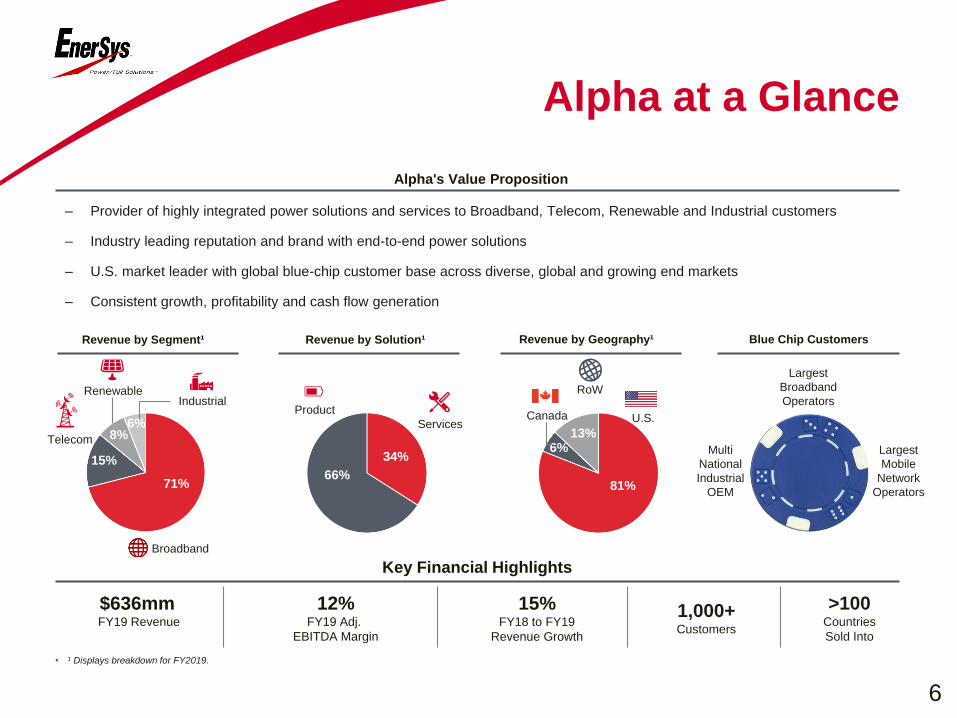
81%
6%13%
66%
34%
Alpha at a Glance
– Provider of highly integrated power solutions and services to Broadband, Telecom, Renewable and Industrial customers
– Industry leading reputation and brand with end-to-end power solutions
– U.S. market leader with global blue-chip customer base across diverse, global and growing end markets
– Consistent growth, profitability and cash flow generation
Alpha's Value Proposition
• ¹ Displays breakdown for FY2019.
Revenue by Segment¹ Revenue by Solution¹ Blue Chip Customers
Key Financial Highlights
$636mmFY19 Revenue
12%FY19 Adj.
EBITDA Margin
1,000+Customers
>100Countries
Sold Into
15%FY18 to FY19
Revenue Growth
Revenue by Geography¹
RenewableIndustrial
Telecom
Broadband
8% 6%
71%
15%
Product
ServicesU.S.Canada
RoW
Largest
Broadband
Operators
Multi
National
Industrial
OEM
Largest
Mobile
Network
Operators
6
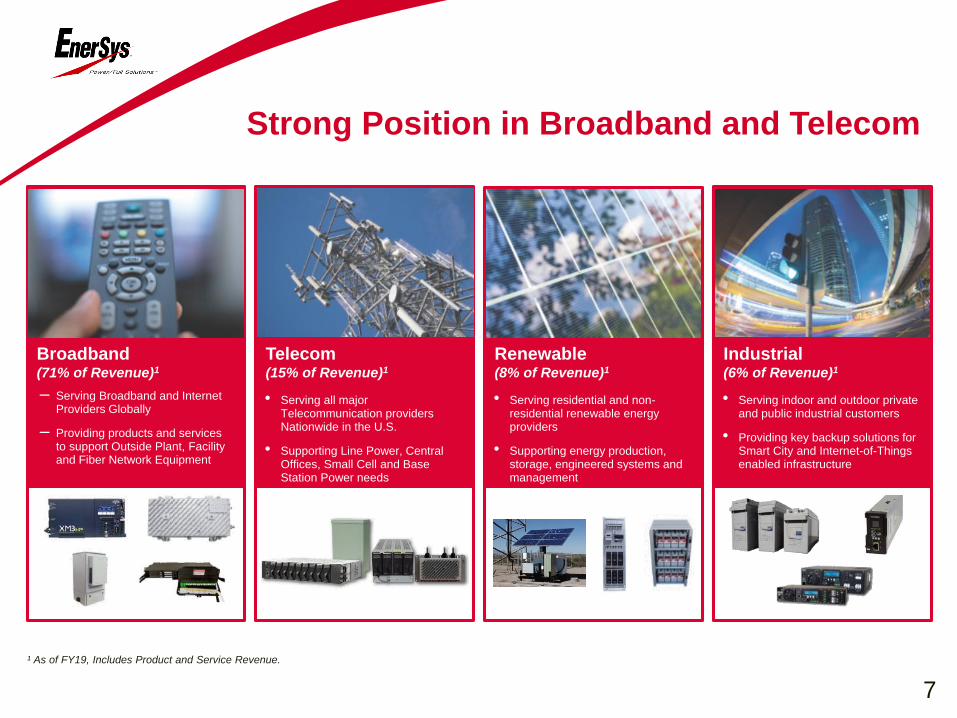
Strong Position in Broadband and Telecom
¹ As of FY19, Includes Product and Service Revenue.
Broadband(71% of Revenue)1
Telecom(15% of Revenue)1
Renewable(8% of Revenue)1
Industrial(6% of Revenue)1
– Serving Broadband and Internet Providers Globally
– Providing products and services to support Outside Plant, Facilityand Fiber Network Equipment
• Serving all major Telecommunication providers Nationwide in the U.S.
• Supporting Line Power, Central Offices, Small Cell and Base Station Power needs
• Serving residential and non-residential renewable energy providers
• Supporting energy production, storage, engineered systems and management
• Serving indoor and outdoor private and public industrial customers
• Providing key backup solutions for Smart City and Internet-of-Things enabled infrastructure
7
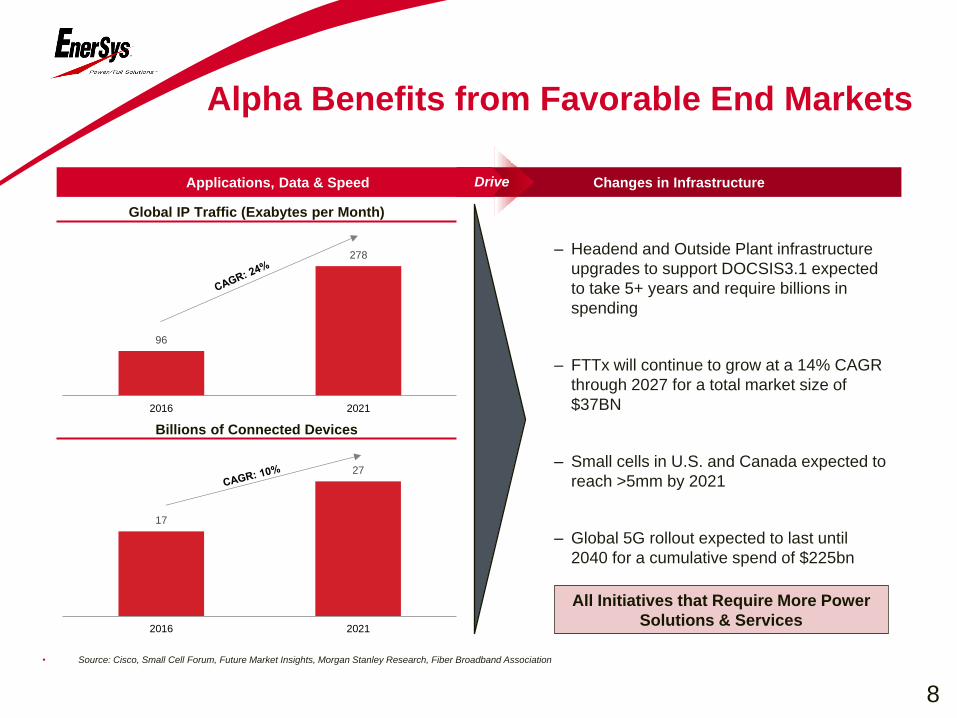
Alpha Benefits from Favorable End Markets
17
27
2016 2021
• Source: Cisco, Small Cell Forum, Future Market Insights, Morgan Stanley Research, Fiber Broadband Association
96
278
2016 2021
Changes in InfrastructureApplications, Data & Speed Drive
– Headend and Outside Plant infrastructure
upgrades to support DOCSIS3.1 expected
to take 5+ years and require billions in
spending
– FTTx will continue to grow at a 14% CAGR
through 2027 for a total market size of
$37BN
– Small cells in U.S. and Canada expected to
reach >5mm by 2021
– Global 5G rollout expected to last until
2040 for a cumulative spend of $225bn
All Initiatives that Require More Power
Solutions & Services
Global IP Traffic (Exabytes per Month)
Billions of Connected Devices
8
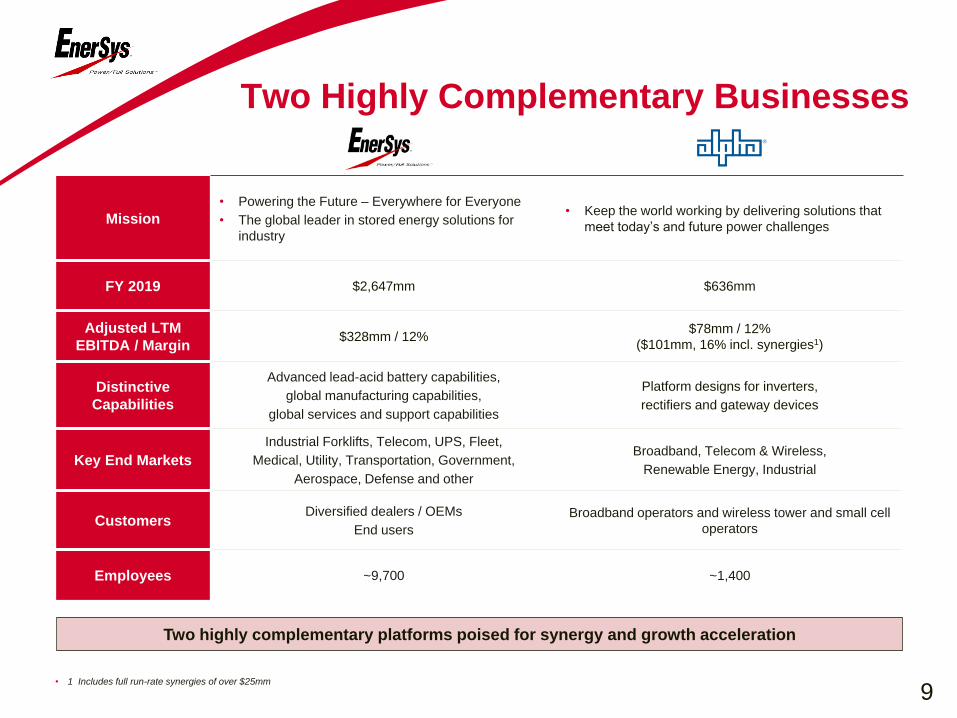
Two Highly Complementary Businesses
Mission
• Powering the Future – Everywhere for Everyone
• The global leader in stored energy solutions for
industry
• Keep the world working by delivering solutions that
meet today’s and future power challenges
FY 2019 $2,647mm $636mm
Adjusted LTM
EBITDA / Margin$328mm / 12%
$78mm / 12%
($101mm, 16% incl. synergies1)
Distinctive
Capabilities
Advanced lead-acid battery capabilities,
global manufacturing capabilities,
global services and support capabilities
Platform designs for inverters,
rectifiers and gateway devices
Key End Markets
Industrial Forklifts, Telecom, UPS, Fleet,
Medical, Utility, Transportation, Government,
Aerospace, Defense and other
Broadband, Telecom & Wireless,
Renewable Energy, Industrial
CustomersDiversified dealers / OEMs
End users
Broadband operators and wireless tower and small cell
operators
Employees ~9,700 ~1,400
• 1 Includes full run-rate synergies of over $25mm
Two highly complementary platforms poised for synergy and growth acceleration
9
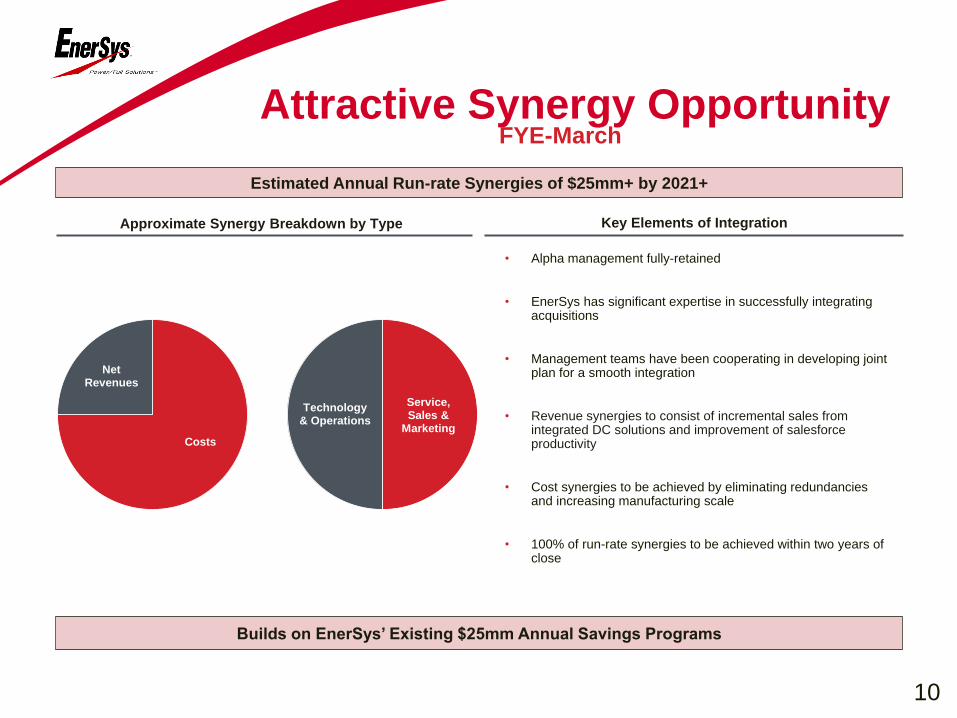
Attractive Synergy Opportunity
Estimated Annual Run-rate Synergies of $25mm+ by 2021+
FYE-March
Approximate Synergy Breakdown by Type
Builds on EnerSys’ Existing $25mm Annual Savings Programs
• Alpha management fully-retained
• EnerSys has significant expertise in successfully integrating acquisitions
• Management teams have been cooperating in developing joint plan for a smooth integration
• Revenue synergies to consist of incremental sales from integrated DC solutions and improvement of salesforce productivity
• Cost synergies to be achieved by eliminating redundancies and increasing manufacturing scale
• 100% of run-rate synergies to be achieved within two years of close
Key Elements of Integration
Costs
Net Revenues
Service, Sales &
Marketing
Technology & Operations
10
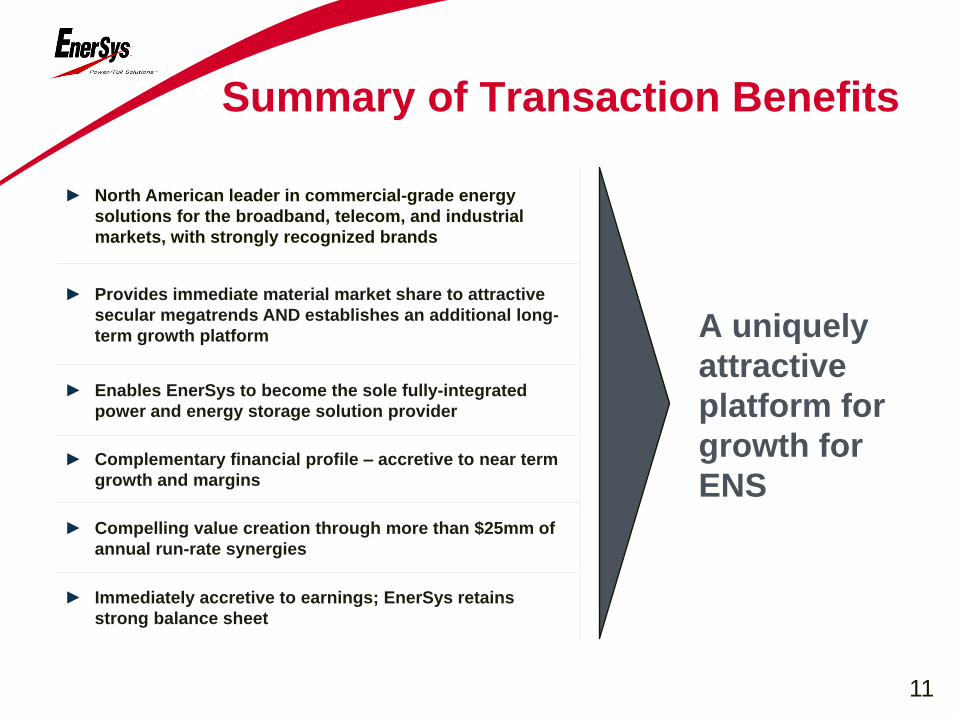
Summary of Transaction Benefits
► North American leader in commercial-grade energy
solutions for the broadband, telecom, and industrial
markets, with strongly recognized brands
A uniquely
attractive
platform for
growth for
ENS
► Provides immediate material market share to attractive
secular megatrends AND establishes an additional long-
term growth platform
► Enables EnerSys to become the sole fully-integrated
power and energy storage solution provider
► Complementary financial profile – accretive to near term
growth and margins
► Compelling value creation through more than $25mm of
annual run-rate synergies
► Immediately accretive to earnings; EnerSys retains
strong balance sheet
11
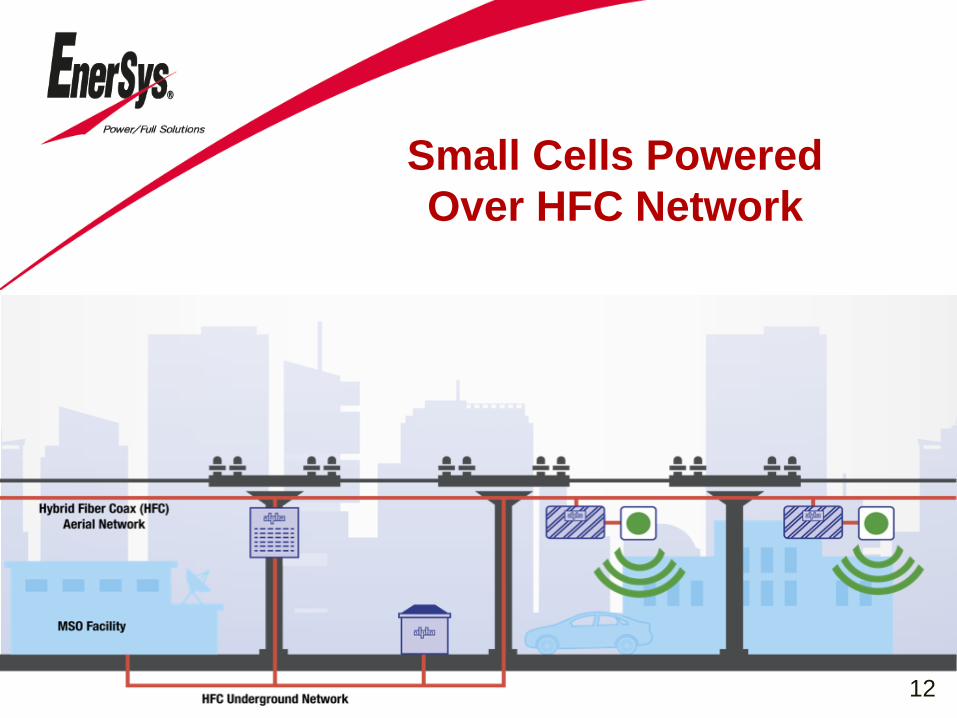
Small Cells Powered
Over HFC Network
12
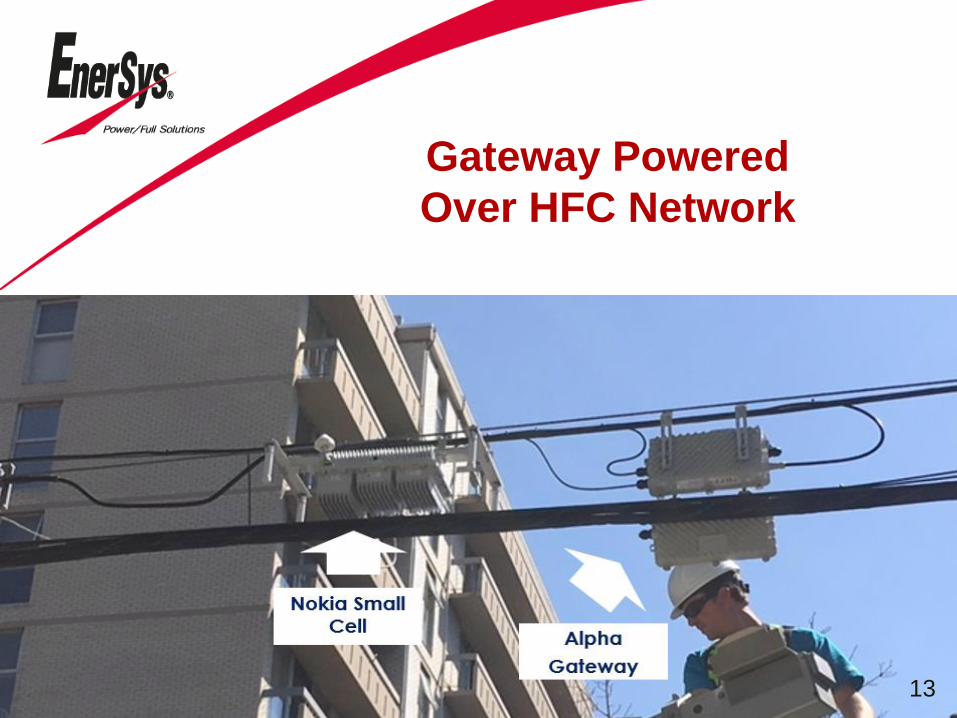
Gateway Powered
Over HFC Network
13
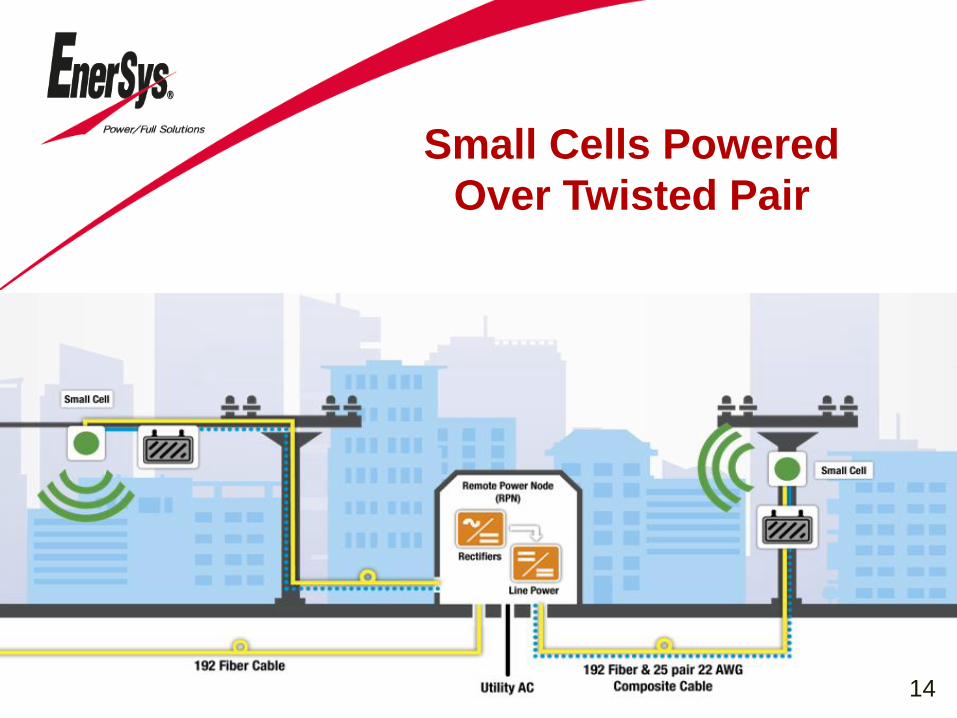
Small Cells Powered
Over Twisted Pair
14
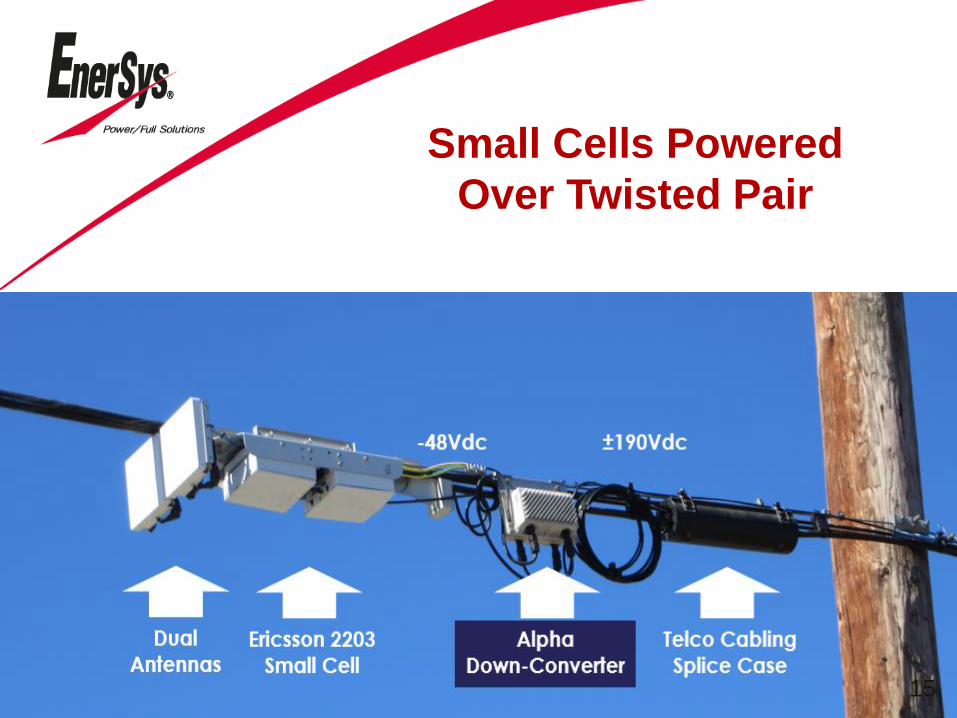
Small Cells Powered
Over Twisted Pair
15
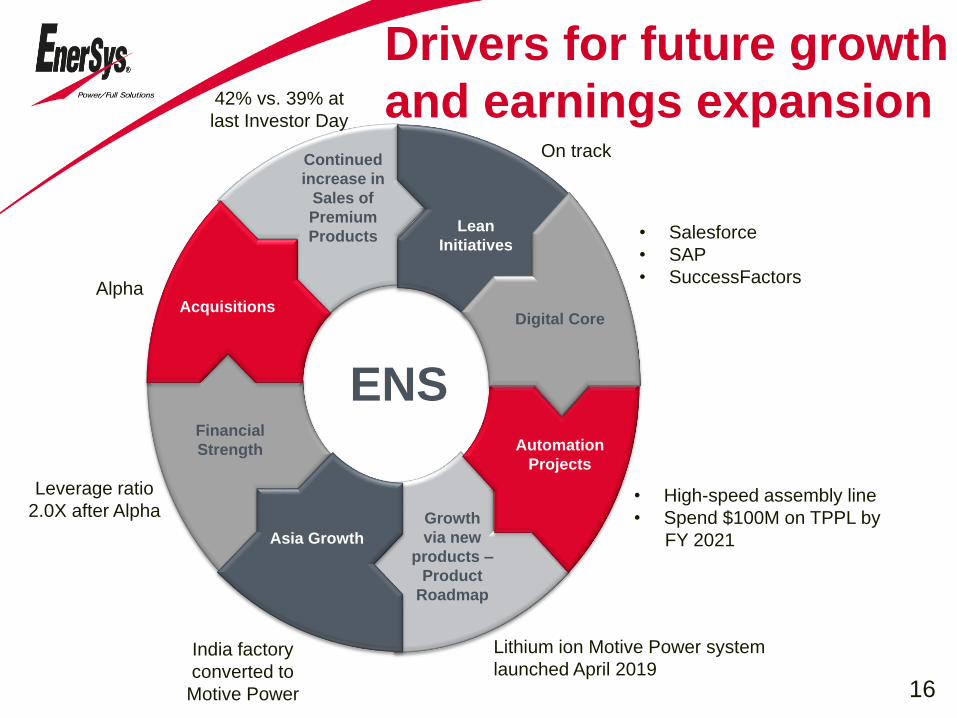
Drivers for future growth
and earnings expansion
Financial
Strength
Continued
increase in
Sales of
Premium
Products
Growth
via new
products –
Product
Roadmap
Asia Growth
Acquisitions
Lean
Initiatives
Automation
Projects
Digital Core
ENS
Alpha
Leverage ratio
2.0X after Alpha
India factory
converted to
Motive Power
42% vs. 39% at
last Investor Day
On track
• Salesforce
• SAP
• SuccessFactors
• High-speed assembly line
• Spend $100M on TPPL by
FY 2021
Lithium ion Motive Power system
launched April 201916

The Global Leader in stored energy
solutions for industrial applications
• Markets: Reserve Power, Motive Power, Aerospace & Defense
• Sales: $2.8 billion in fiscal year 2019
• Global leader: 21% market share in CY 2018
• Customers: Over 10,000 in more than 100 countries
• Global manufacturing facilities
• Employees: 11,200 worldwide
• Sustainability: 99% recycle rate on Lead-Acid batteries
17
Source: BCI, Eurobat industry reports and management estimates based on the markets where EnerSys participates. Market size and share
are for batteries and chargers only. It excludes power solution and services to broadband, telecom and other markets, and the aerospace &
defense and cabinet enclosures markets (each estimated at $1 to $2 billion).
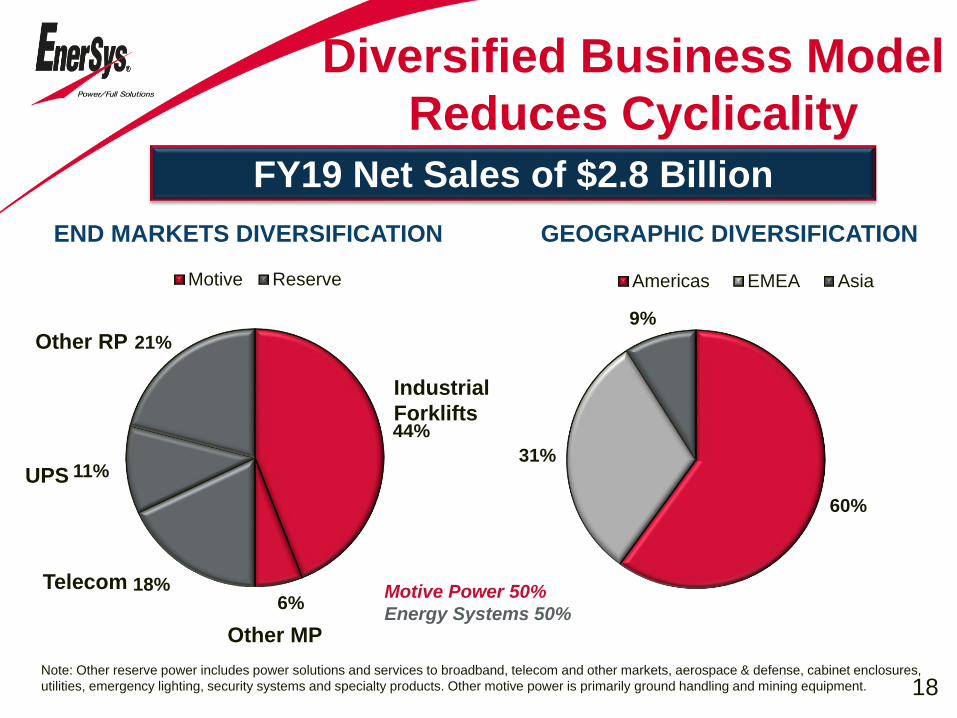
FY19 Net Sales of $2.8 Billion
Diversified Business Model
Reduces Cyclicality
Note: Other reserve power includes power solutions and services to broadband, telecom and other markets, aerospace & defense, cabinet enclosures,
utilities, emergency lighting, security systems and specialty products. Other motive power is primarily ground handling and mining equipment.
Telecom
UPS
Other RP
Industrial
Forklifts
Other MP
GEOGRAPHIC DIVERSIFICATIONEND MARKETS DIVERSIFICATION
Motive Power 50%
Energy Systems 50%
44%
6%18%
11%
21%
Motive Reserve
60%
31%
9%
Americas EMEA Asia
18
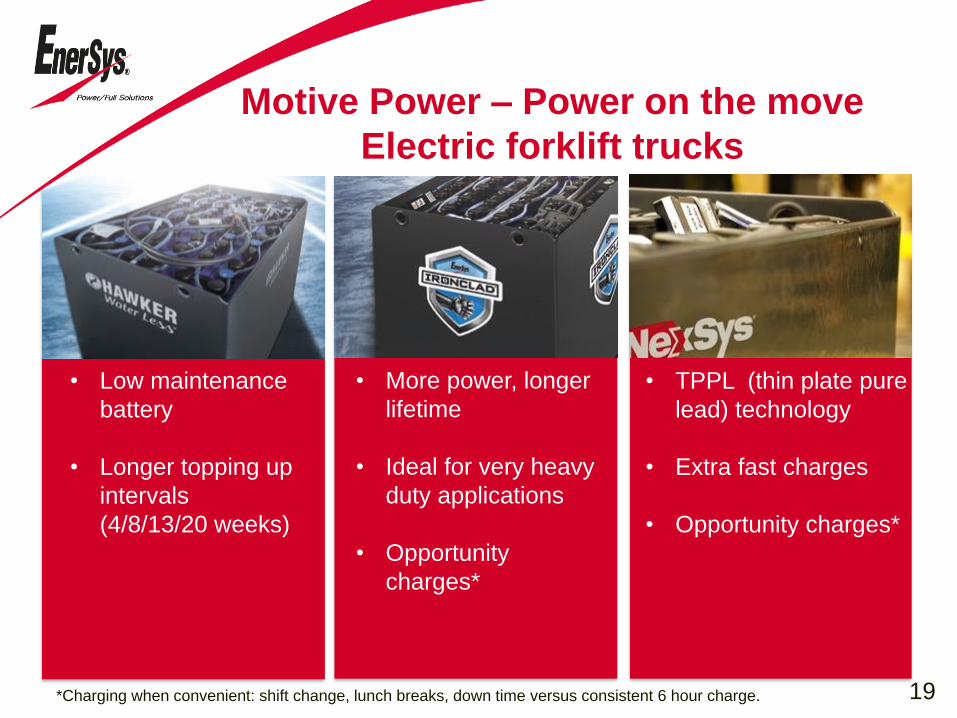
Motive Power – Power on the move
Electric forklift trucks
• Low maintenance
battery
• Longer topping up
intervals
(4/8/13/20 weeks)
• TPPL (thin plate pure
lead) technology
• Extra fast charges
• Opportunity charges*
• More power, longer
lifetime
• Ideal for very heavy
duty applications
• Opportunity
charges*
19*Charging when convenient: shift change, lunch breaks, down time versus consistent 6 hour charge.
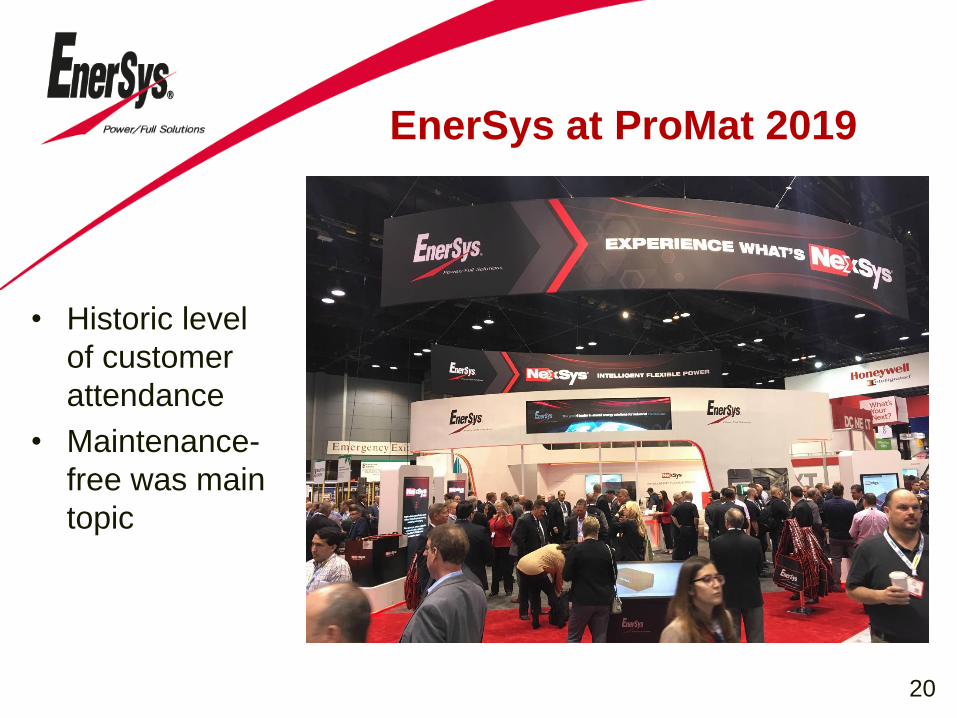
EnerSys at ProMat 2019
• Historic level
of customer
attendance
• Maintenance-
free was main
topic
20
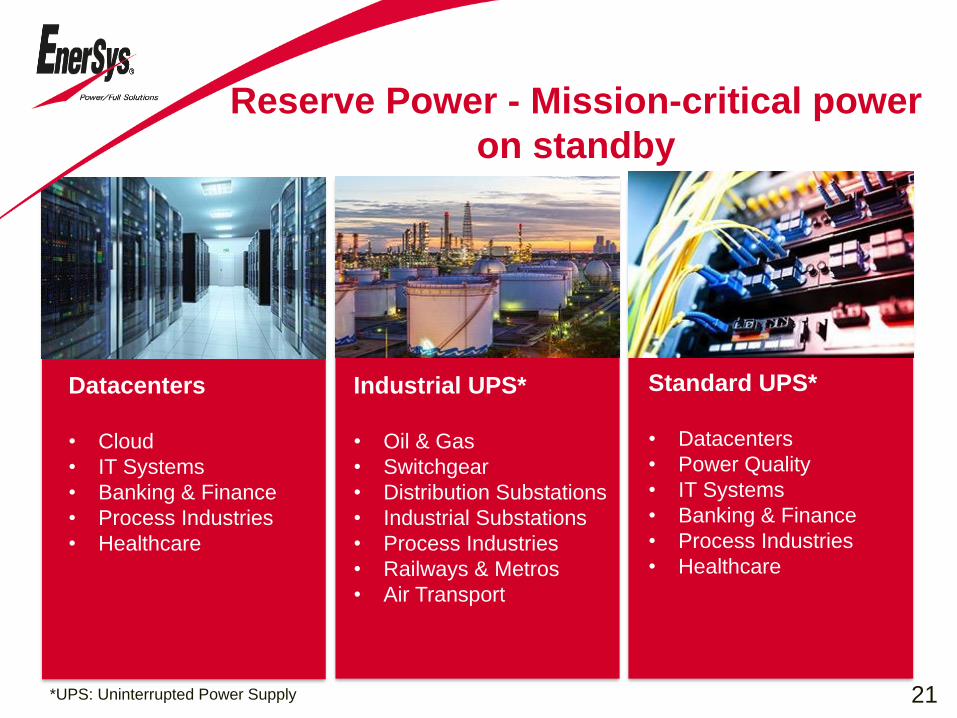
Reserve Power - Mission-critical power
on standby
Datacenters
• Cloud
• IT Systems
• Banking & Finance
• Process Industries
• Healthcare
Standard UPS*
• Datacenters
• Power Quality
• IT Systems
• Banking & Finance
• Process Industries
• Healthcare
Industrial UPS*
• Oil & Gas
• Switchgear
• Distribution Substations
• Industrial Substations
• Process Industries
• Railways & Metros
• Air Transport
21*UPS: Uninterrupted Power Supply
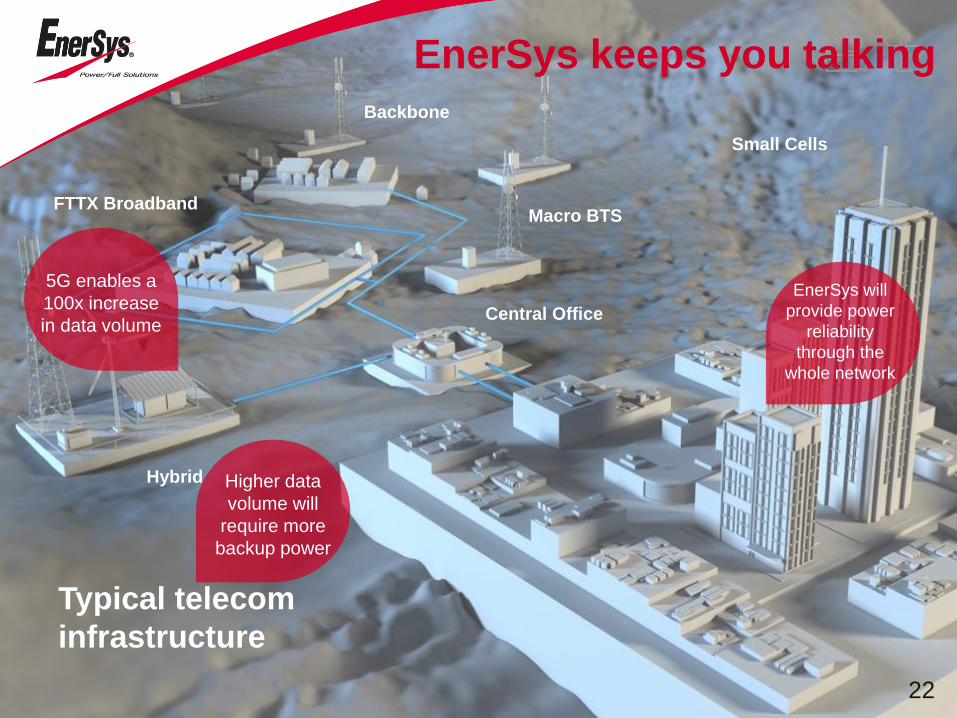
Typical telecom
infrastructure
FTTX Broadband
Hybrid
Macro BTS
Central Office
Small Cells
Backbone
5G enables a
100x increase
in data volume
EnerSys will
provide power
reliability
through the
whole network
Higher data
volume will
require more
backup power
EnerSys keeps you talking
22

Reserve Power – Key segments
Telecom
EnerSys provides
optimized solutions to
reduce your energy
consumption and
promote the longest
battery life.
Fleet/Vehicles
Today’s vehicles are loaded
with more electronics.
EnerSys’ battery:
• Ability to keep up with
changes
• Lasts twice as long
• Handles vibrations much
betterUS Market – $1 B, ENS opportunity $300M
EMEA Market - $0.5+B, ENS opportunity
$150M
23
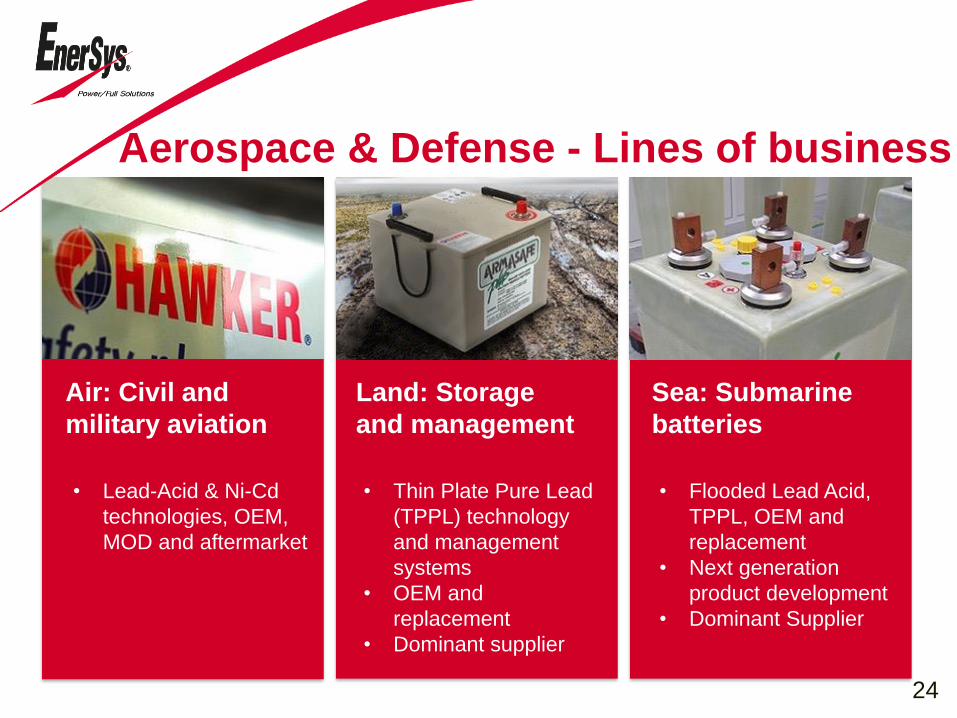
Aerospace & Defense - Lines of business
Air: Civil and
military aviation
• Lead-Acid & Ni-Cd
technologies, OEM,
MOD and aftermarket
Sea: Submarine
batteries
• Flooded Lead Acid,
TPPL, OEM and
replacement
• Next generation
product development
• Dominant Supplier
Land: Storage
and management
• Thin Plate Pure Lead
(TPPL) technology
and management
systems
• OEM and
replacement
• Dominant supplier
24
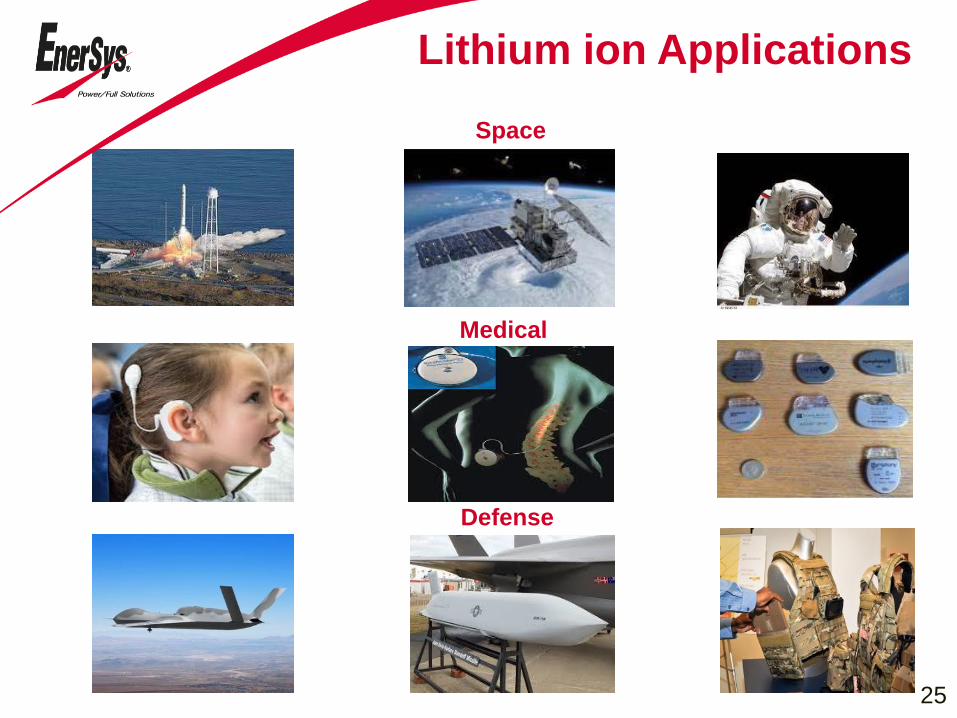
Lithium ion Applications
Space
Medical
Defense
4825
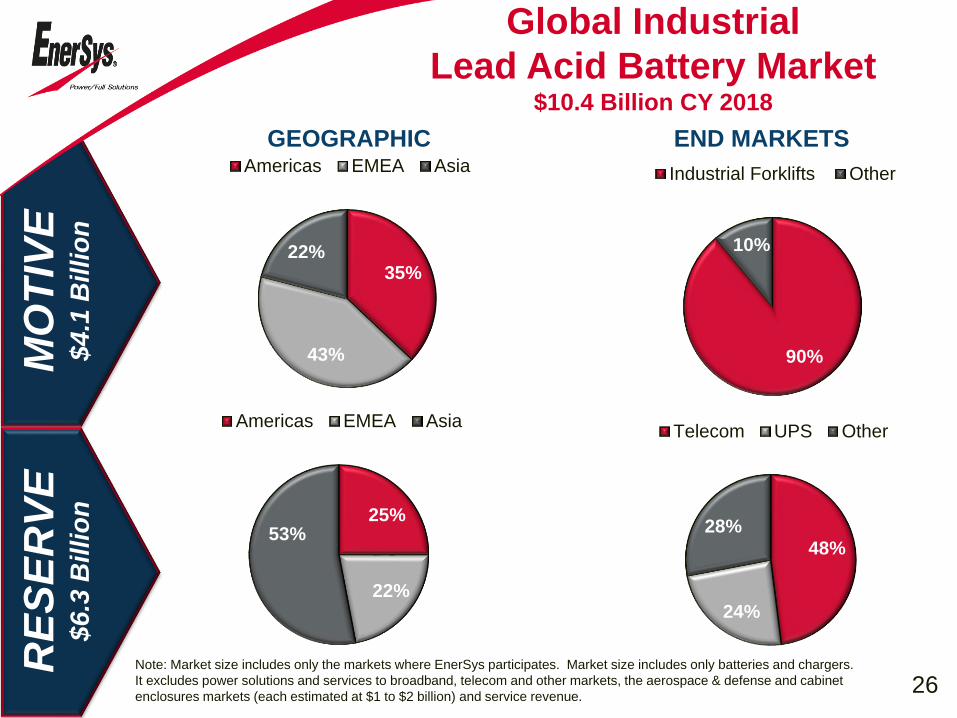
Global Industrial
Lead Acid Battery Market$10.4 Billion CY 2018
END MARKETS
MO
TIV
E$4.1
Billi
on
GEOGRAPHIC
RE
SE
RV
E$6.3
Billio
n
Note: Market size includes only the markets where EnerSys participates. Market size includes only batteries and chargers.
It excludes power solutions and services to broadband, telecom and other markets, the aerospace & defense and cabinet
enclosures markets (each estimated at $1 to $2 billion) and service revenue.26
48%
24%
28%
Telecom UPS Other
25%
22%
53%
Americas EMEA Asia
90%
10%
Industrial Forklifts Other
35%
43%
22%
Americas EMEA Asia
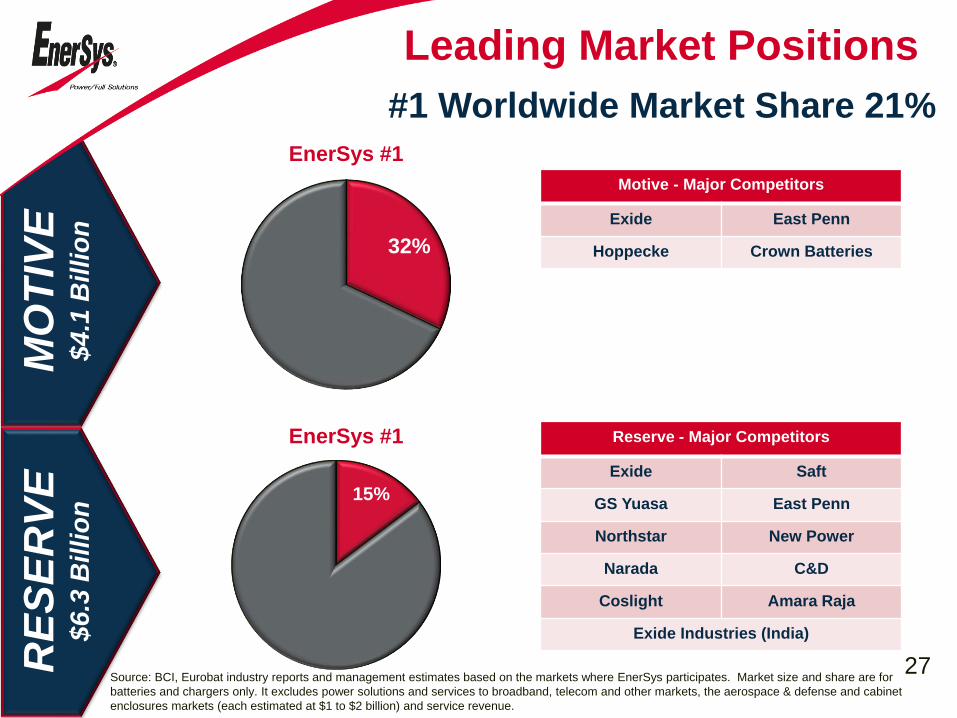
Leading Market Positions
32%
MO
TIV
E$4.1
Billio
n
RE
SE
RV
E$6.3
Billi
on
#1 Worldwide Market Share 21%
EnerSys #1
EnerSys #1
Source: BCI, Eurobat industry reports and management estimates based on the markets where EnerSys participates. Market size and share are for
batteries and chargers only. It excludes power solutions and services to broadband, telecom and other markets, the aerospace & defense and cabinet
enclosures markets (each estimated at $1 to $2 billion) and service revenue.
Reserve - Major Competitors
Exide Saft
GS Yuasa East Penn
Northstar New Power
Narada C&D
Coslight Amara Raja
Exide Industries (India)
Motive - Major Competitors
Exide East Penn
Hoppecke Crown Batteries
27
15%
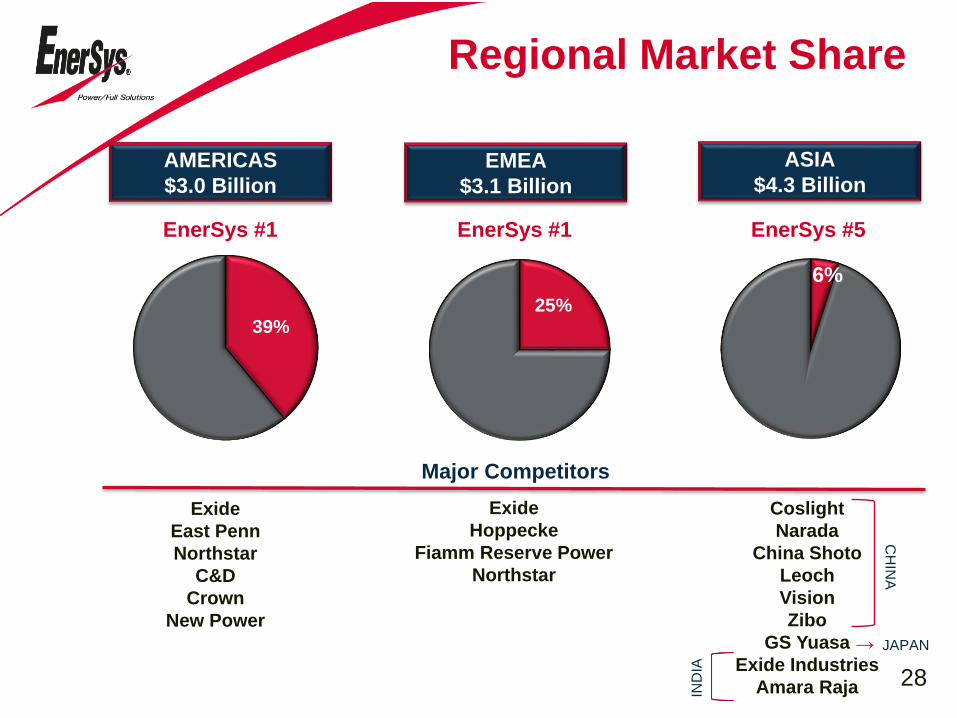
6%
Regional Market Share
EnerSys #1 EnerSys #1 EnerSys #5
AMERICAS
$3.0 Billion
EMEA
$3.1 Billion
ASIA
$4.3 Billion
Exide
East Penn
Northstar
C&D
Crown
New Power
Major Competitors
Exide
Hoppecke
Fiamm Reserve Power
Northstar
Coslight
Narada
China Shoto
Leoch
Vision
Zibo
GS Yuasa
Exide Industries
Amara Raja
CH
INA
→ JAPAN
IND
IA28
25%39%
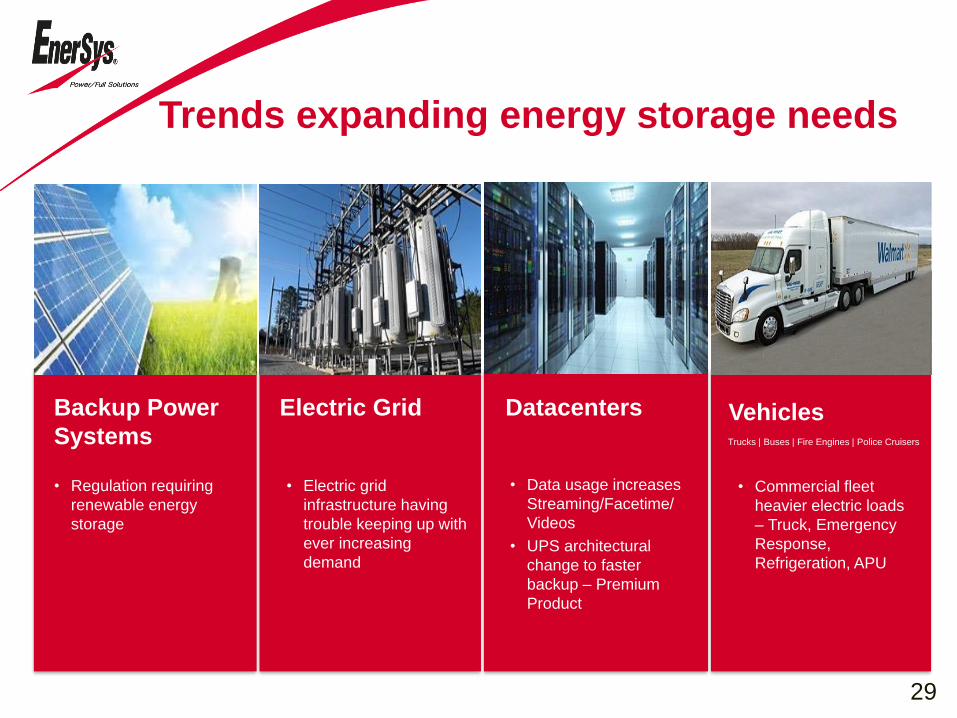
DatacentersElectric Grid
Trends expanding energy storage needs
Backup Power
SystemsVehicles
Electric
Grid
• Regulation requiring
renewable energy
storage
• Electric grid
infrastructure having
trouble keeping up with
ever increasing
demand
• Data usage increases
Streaming/Facetime/
Videos
• UPS architectural
change to faster
backup – Premium
Product
• Commercial fleet
heavier electric loads
– Truck, Emergency
Response,
Refrigeration, APU
Trucks | Buses | Fire Engines | Police Cruisers
29
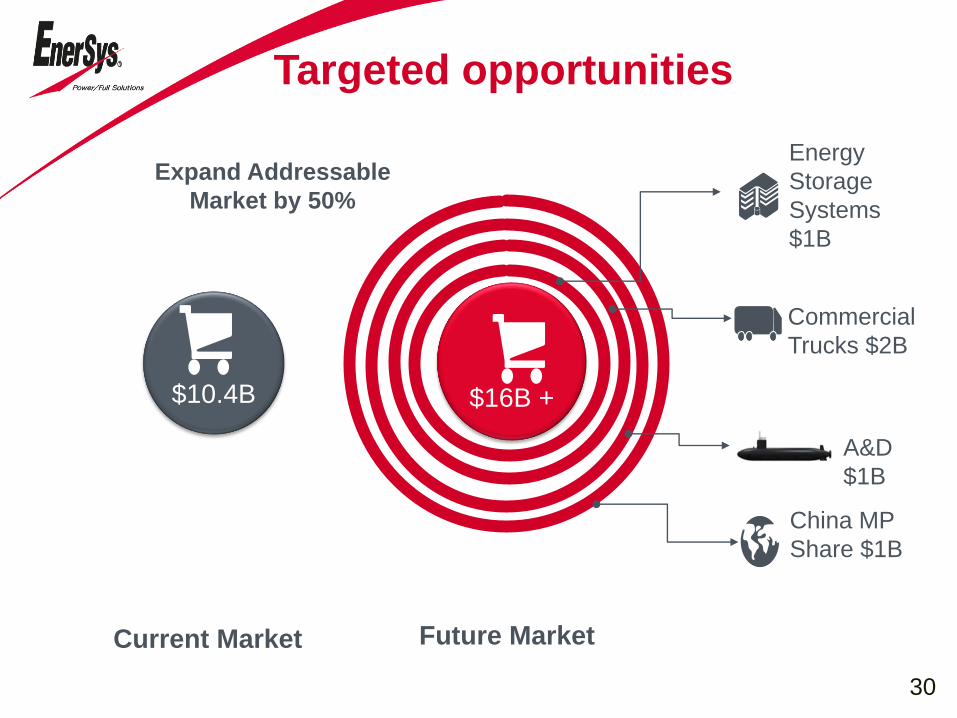
Targeted opportunities
$16B +
A&D
$1B
Energy
Storage
Systems
$1B
Commercial
Trucks $2B
China MP
Share $1B
$10.4B
Current Market Future Market
Expand Addressable
Market by 50%
30
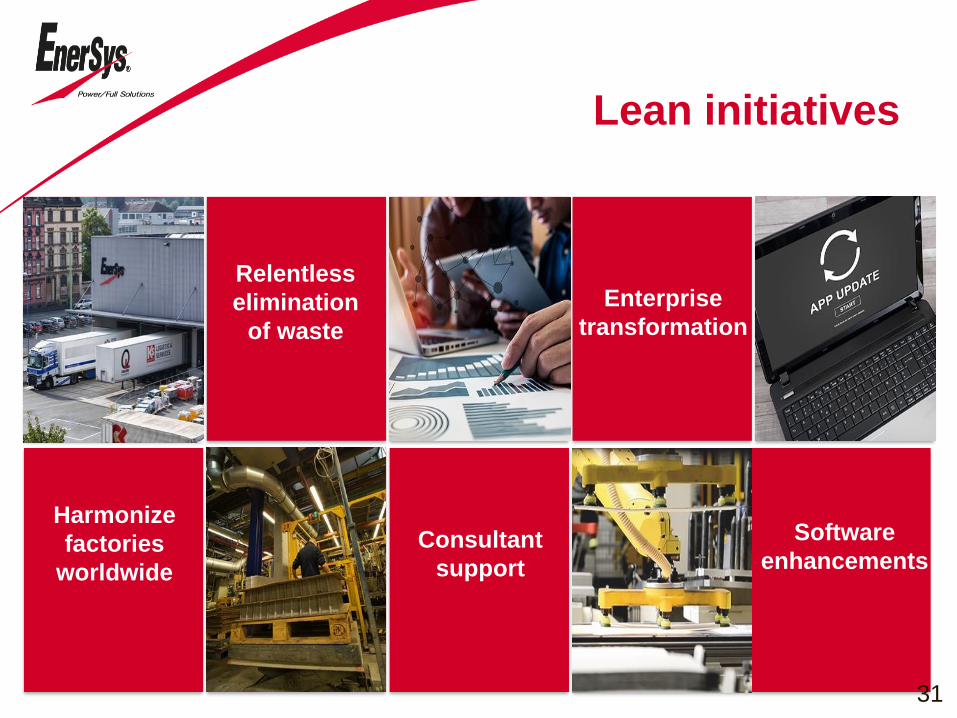
Lean initiatives
Harmonize
factories
worldwide
Relentless
elimination
of waste
Consultant
support
Enterprise
transformation
Software
enhancements
31
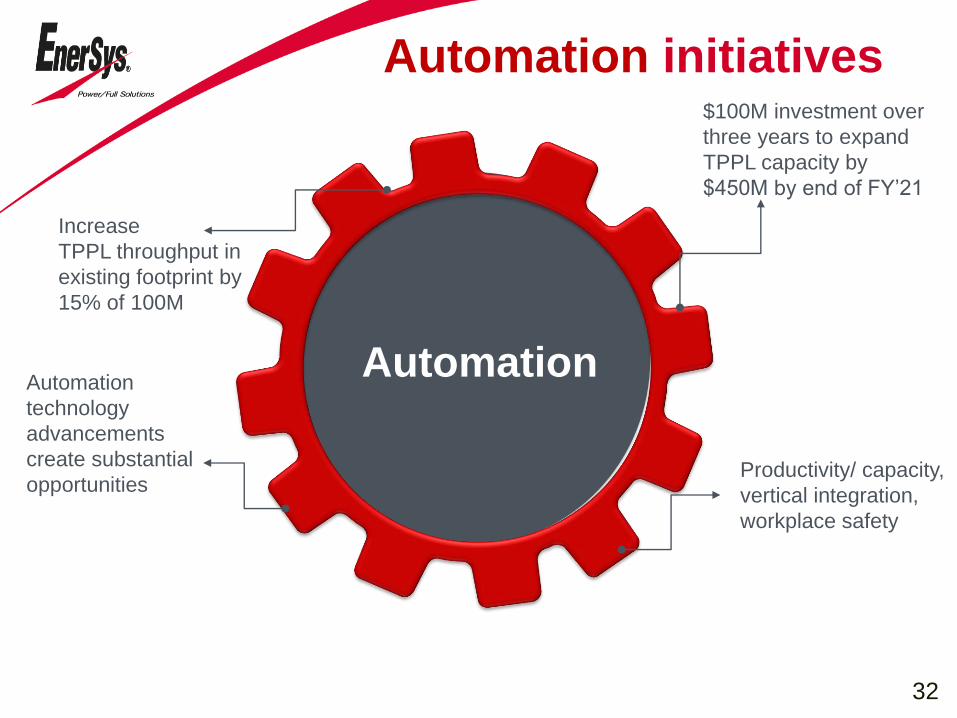
AutomationAutomation
technology
advancements
create substantial
opportunities
Increase
TPPL throughput in
existing footprint by
15% of 100M
$100M investment over
three years to expand
TPPL capacity by
$450M by end of FY’21
Productivity/ capacity,
vertical integration,
workplace safety
32
Automation initiatives
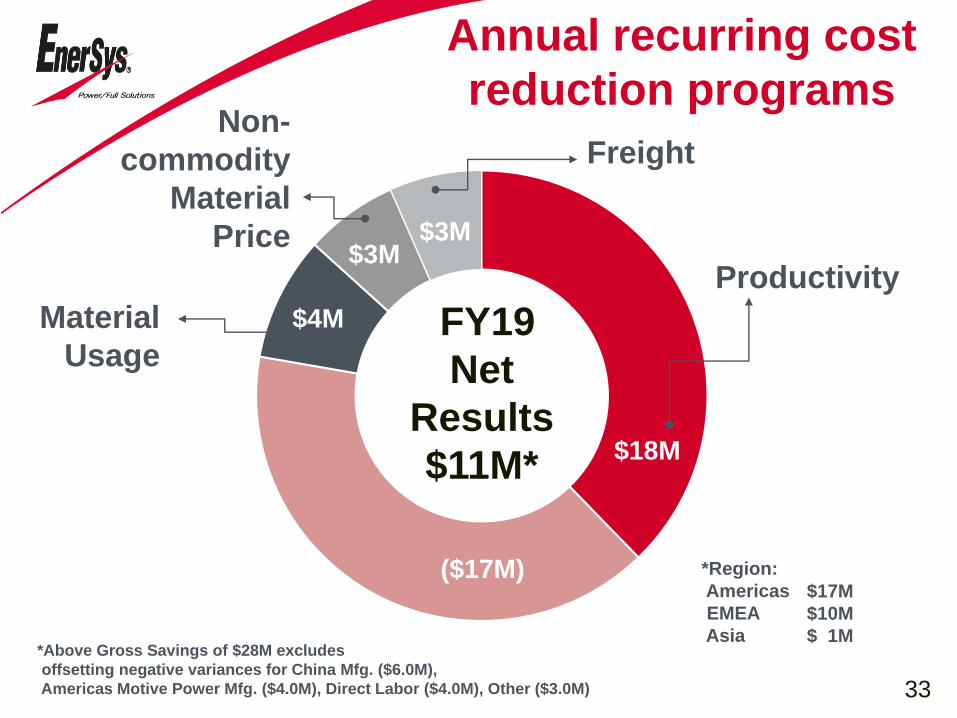
22%
13%
$18M
$3M$3M
FY19
Net
Results
$11M*
Freight
Material
Usage
Non-
commodity
Material
Price
Productivity
$4M
33
*Region:
Americas
EMEA
Asia
$17M
$10M
$ 1M
Annual recurring cost
reduction programs
*Above Gross Savings of $28M excludes
offsetting negative variances for China Mfg. ($6.0M),
Americas Motive Power Mfg. ($4.0M), Direct Labor ($4.0M), Other ($3.0M)
($17M)
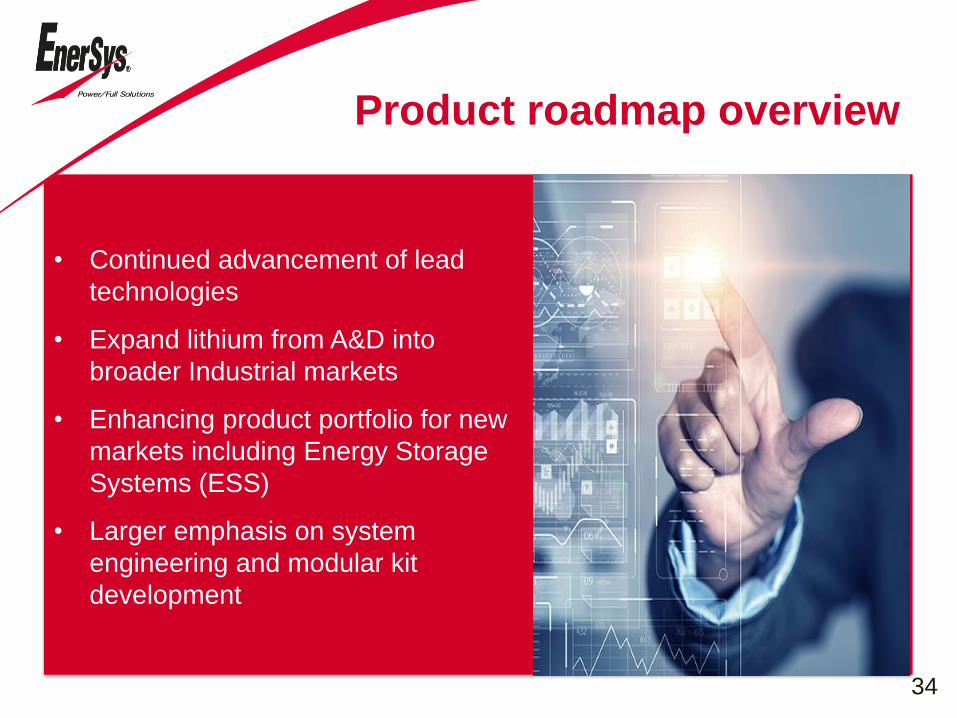
Product roadmap overview
• Continued advancement of lead
technologies
• Expand lithium from A&D into
broader Industrial markets
• Enhancing product portfolio for new
markets including Energy Storage
Systems (ESS)
• Larger emphasis on system
engineering and modular kit
development
34
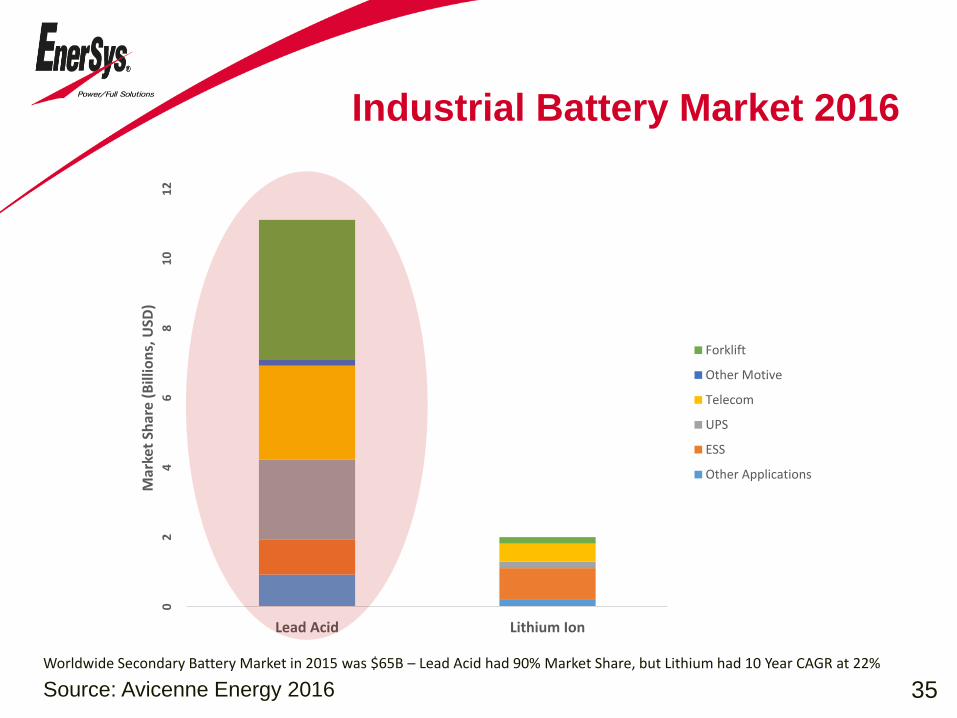
Industrial Battery Market 2016
Source: Avicenne Energy 2016
02
46
81
01
2
Lead Acid Lithium Ion
Mar
ket
Shar
e (
Bill
ion
s, U
SD)
Forklift
Other Motive
Telecom
UPS
ESS
Other Applications
35
Worldwide Secondary Battery Market in 2015 was $65B – Lead Acid had 90% Market Share, but Lithium had 10 Year CAGR at 22%
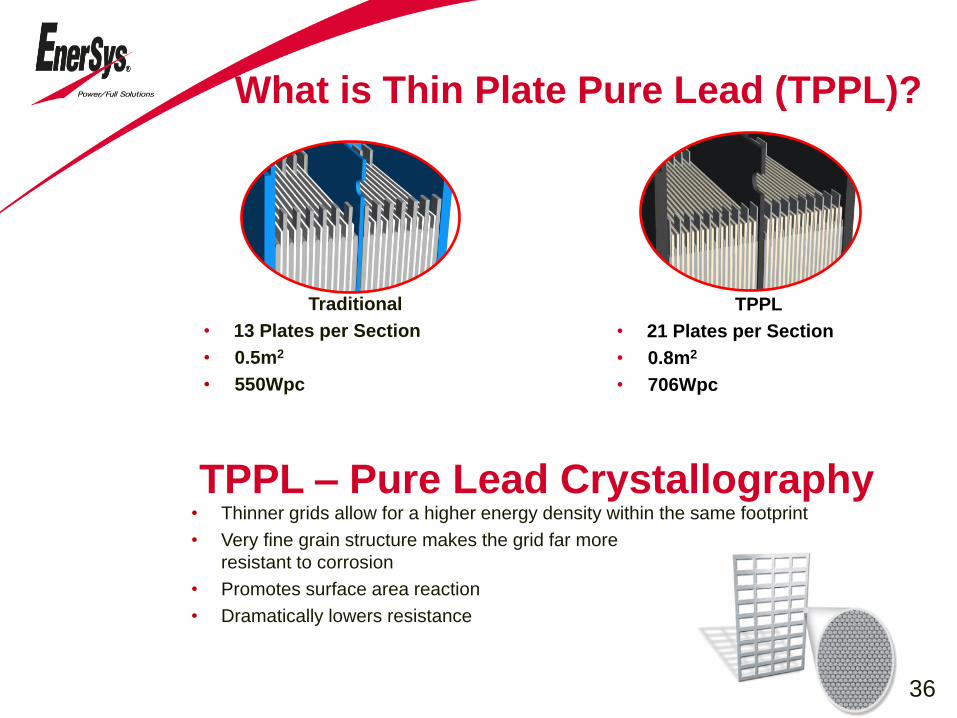
What is Thin Plate Pure Lead (TPPL)?
Traditional
• 13 Plates per Section
• 0.5m2
• 550Wpc
TPPL
• 21 Plates per Section
• 0.8m2
• 706Wpc
TPPL – Pure Lead Crystallography• Thinner grids allow for a higher energy density within the same footprint
• Very fine grain structure makes the grid far more
resistant to corrosion
• Promotes surface area reaction
• Dramatically lowers resistance
36
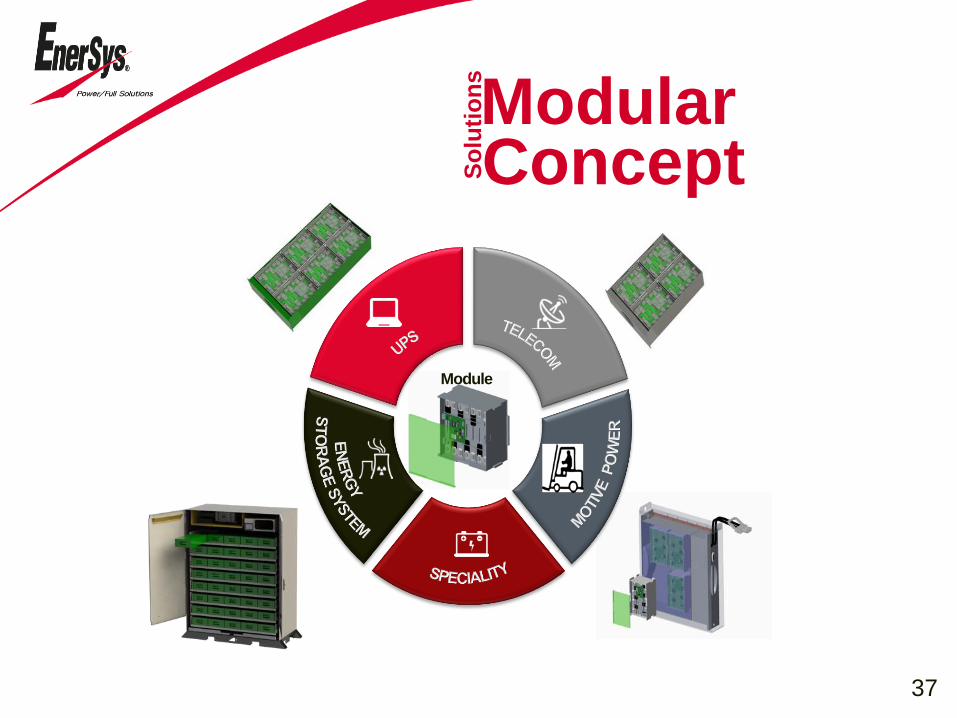
Module
ModularConceptS
olu
tio
ns
37
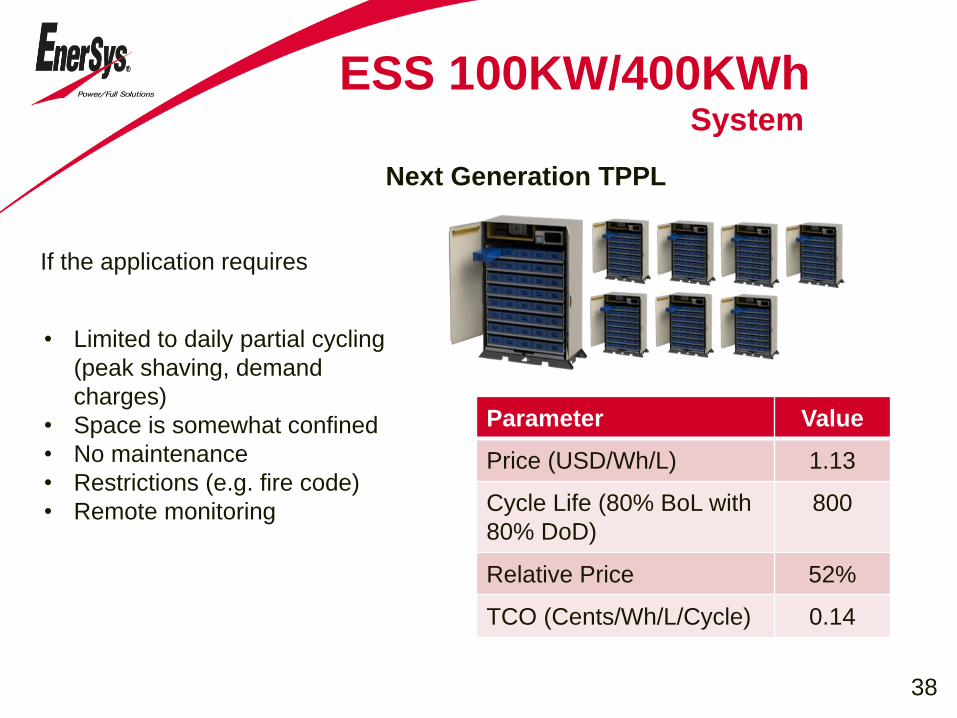
ESS 100KW/400KWhSystem
If the application requires
• Limited to daily partial cycling
(peak shaving, demand
charges)
• Space is somewhat confined
• No maintenance
• Restrictions (e.g. fire code)
• Remote monitoring
Next Generation TPPL
Parameter Value
Price (USD/Wh/L) 1.13
Cycle Life (80% BoL with
80% DoD)
800
Relative Price 52%
TCO (Cents/Wh/L/Cycle) 0.14
38
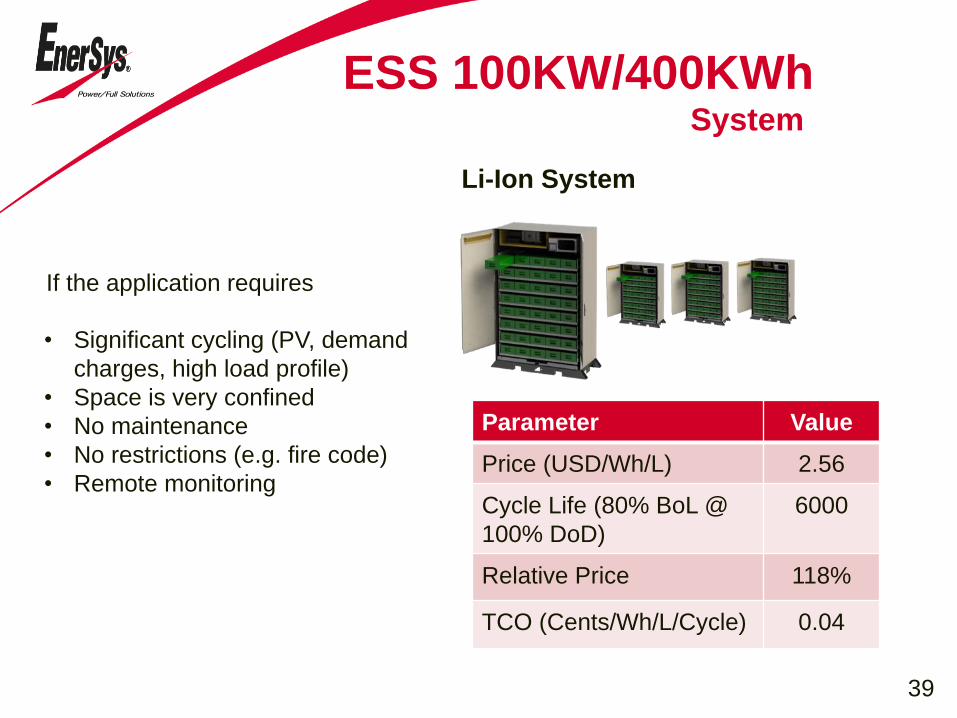
ESS 100KW/400KWhSystem
If the application requires
• Significant cycling (PV, demand
charges, high load profile)
• Space is very confined
• No maintenance
• No restrictions (e.g. fire code)
• Remote monitoring
Li-Ion System
Parameter Value
Price (USD/Wh/L) 2.56
Cycle Life (80% BoL @
100% DoD)
6000
Relative Price 118%
TCO (Cents/Wh/L/Cycle) 0.04
39
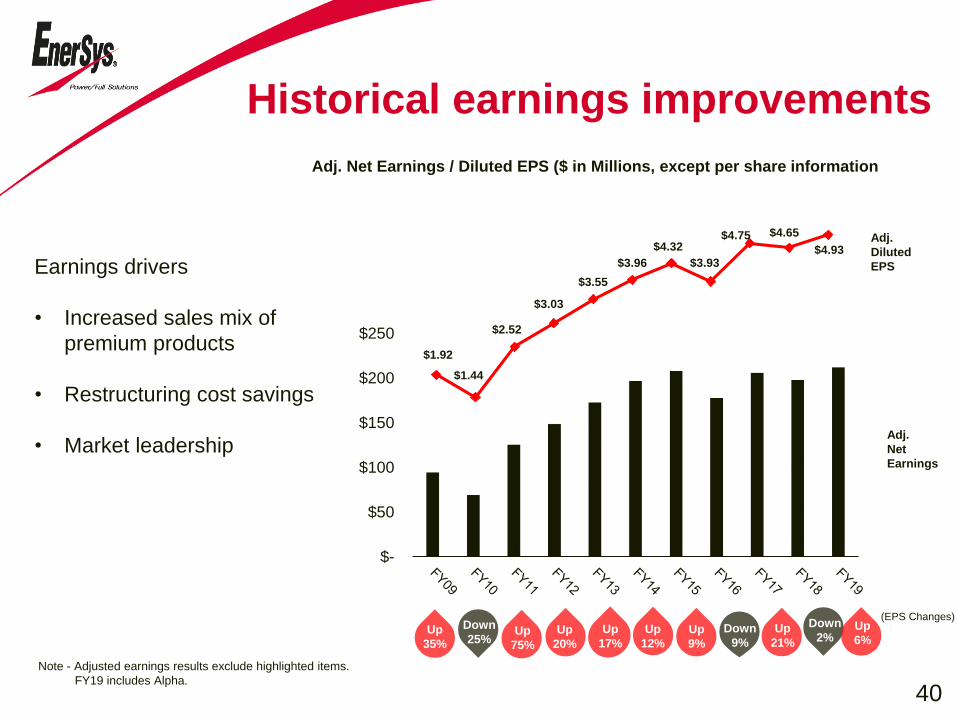
Historical earnings improvements
Note - Adjusted earnings results exclude highlighted items.
FY19 includes Alpha.
$1.92
$1.44
$2.52
$3.03
$3.55
$3.96
$4.32
$3.93
$4.75 $4.65
$4.93
Adj. Net Earnings / Diluted EPS ($ in Millions, except per share information)
Adj.
Diluted
EPS
(EPS Changes)
Up
35%
Down
25%Up
75%
Up
20%
Up
17%
Up
12%
Up
9%
Down
9%
Up
21%
Adj.
Net
Earnings
40
Earnings drivers
• Increased sales mix of
premium products
• Restructuring cost savings
• Market leadership
Down
2%
$-
$50
$100
$150
$200
$250
Up
6%
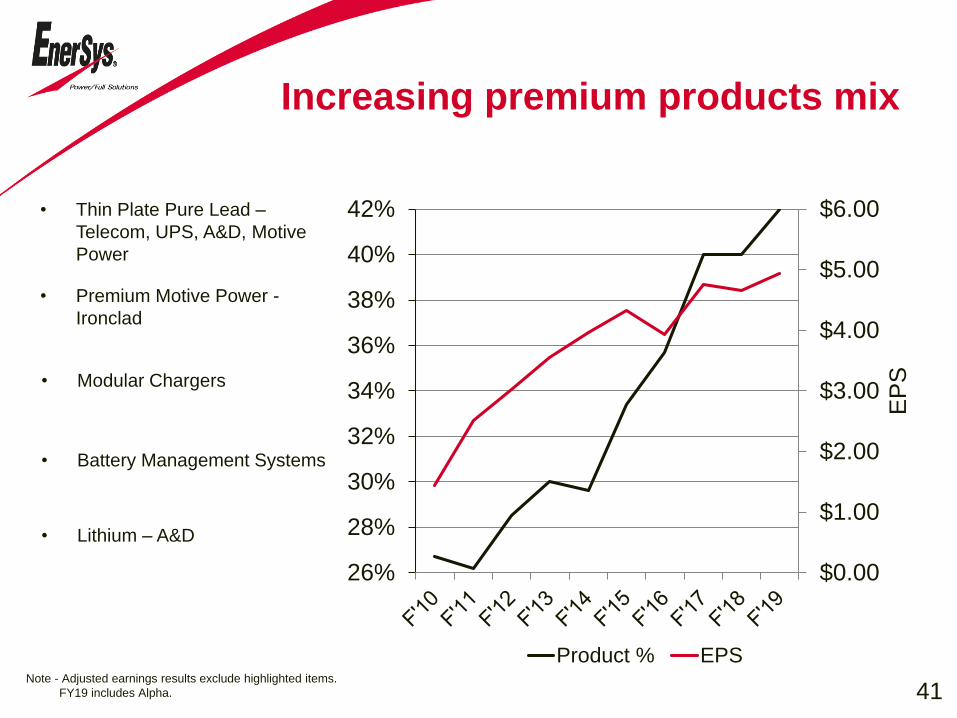
Increasing premium products mix
$0.00
$1.00
$2.00
$3.00
$4.00
$5.00
$6.00
26%
28%
30%
32%
34%
36%
38%
40%
42%
EP
S
Product % EPS
• Thin Plate Pure Lead –
Telecom, UPS, A&D, Motive
Power
• Premium Motive Power -
Ironclad
• Modular Chargers
• Battery Management Systems
• Lithium – A&D
41Note - Adjusted earnings results exclude highlighted items.
FY19 includes Alpha.
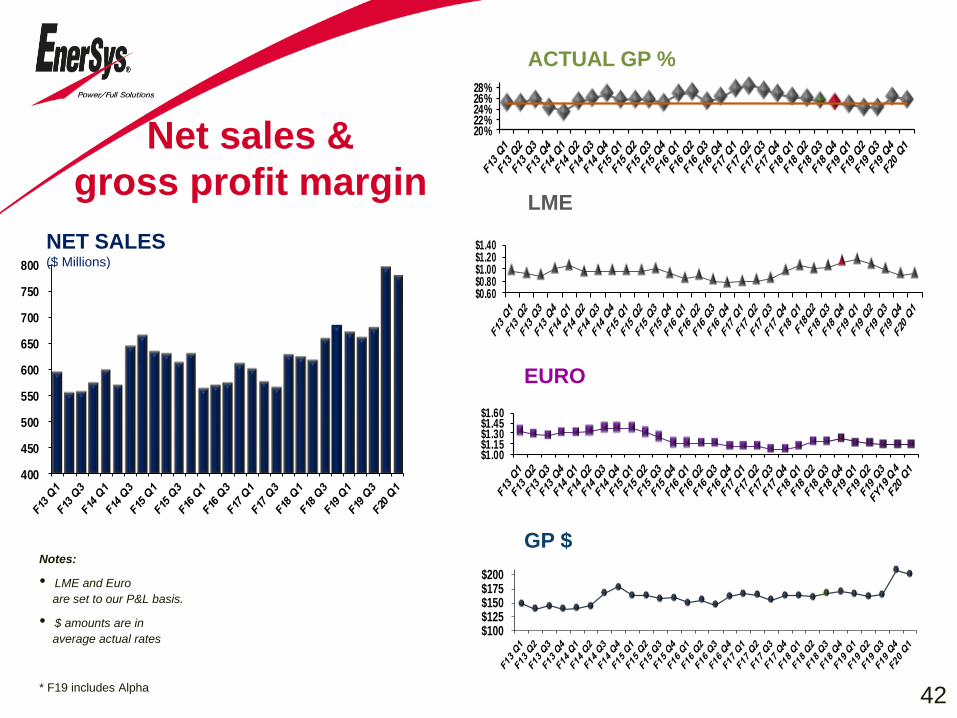
Net sales &
gross profit margin
$100$125$150$175$200
$1.00$1.15$1.30$1.45$1.60
EURO
LME
Notes:
• LME and Euro
are set to our P&L basis.
• $ amounts are in
average actual rates
20%22%24%26%28%
ACTUAL GP %
NET SALES($ Millions)
GP $
42
$0.60$0.80$1.00$1.20$1.40
400
450
500
550
600
650
700
750
800
* F19 includes Alpha
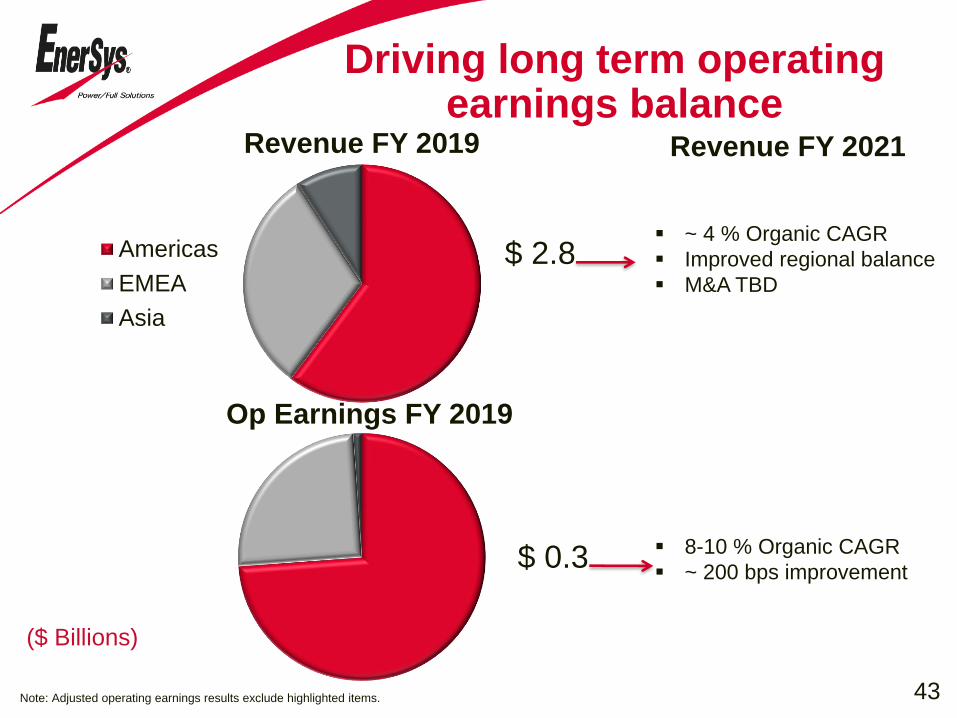
Revenue FY 2019
Americas
EMEA
Asia
Op Earnings FY 2019
$ 2.8
($ Billions)
$ 0.3
~ 4 % Organic CAGR
Improved regional balance
M&A TBD
Revenue FY 2021
8-10 % Organic CAGR
~ 200 bps improvement
43Note: Adjusted operating earnings results exclude highlighted items.
Driving long term operating earnings balance
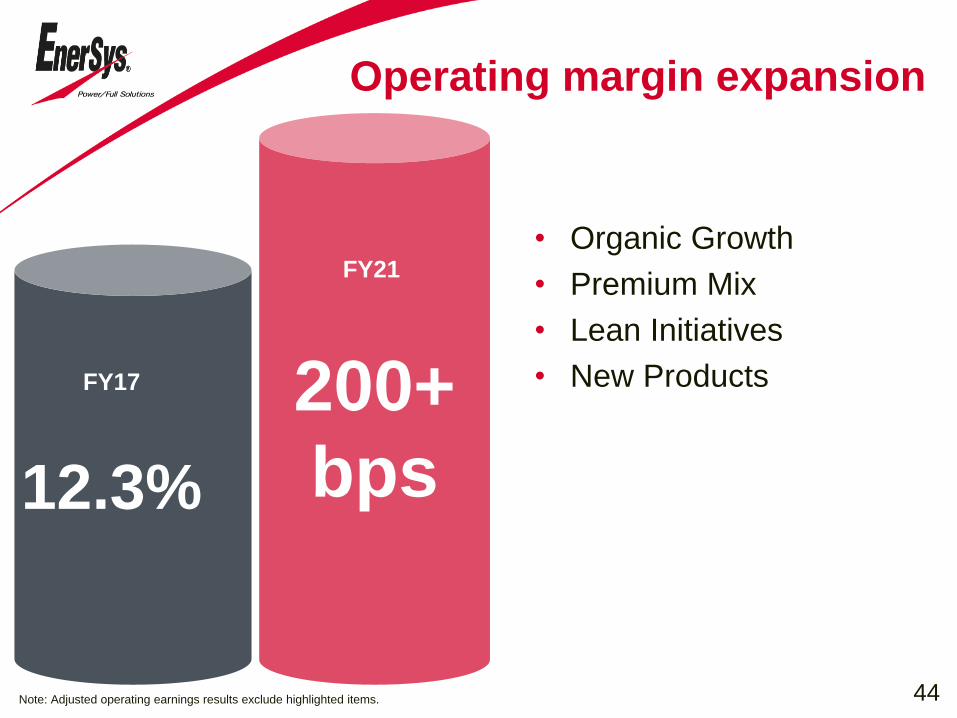
Operating margin expansion
12.3%
200+
bps
FY17
FY21
• Organic Growth
• Premium Mix
• Lean Initiatives
• New Products
44Note: Adjusted operating earnings results exclude highlighted items.