Rivonia Trial Dictabelt Project, Save Your Archive, Gerrit Wagener, Brenda Kotze, Mandy Gilder

Supplemental Materials
Meta-Analyses and P-Curves Support Robust Cycle Shifts in Women’s Mate Preferences:
Reply to Wood and Carden and Harris, Pashler, and Mickes (2014)
by K. Gildersleeve et al., 2014, Psychological Bulletin
http://dx.doi.org/10.1037/a0037714
Differences between the Wood et al. and Gildersleeve et al. Meta-analyses
Wood et al. (2014) used broader inclusion criteria than we did even for our Broad sample
of effects. This resulted in Wood et al. (2014) including a large number of effects that should
have not been combined with the others in their analysis.
First, Wood et al. (2014) problematically included effects based on a “mate dollars”
paradigm, wherein women are given a limited number of “mate dollars” to spend on various
characteristics to design an ideal hypothetical mate (see Li, Bailey, Kenrick, & Linsenmeier,
2002). The more mate dollars a woman spends to increase levels of a given characteristic (e.g.,
masculinity), the fewer dollars she has left to increase levels of other characteristics (e.g.,
kindness). Thus, this method is useful for assessing how women trade off desirable
characteristics when they cannot “have it all.” As such, this method necessarily produces
estimates of women’s preference for a given characteristic that are confounded with their
preferences for other characteristics. We chose to exclude such effects because of their
confounded nature. In contrast, Wood et al. included 10 effects based on a mate dollars
paradigm, all from a single unpublished study (Wood et al. cited the study as Li & Haselton, n.d.;
the correct citation is Li, Pillsworth, & Haselton, 2006).
1

Second, Wood et al. (2014) problematically included effects based on analyses that
treated men (targets), rather than women (raters), as the “unit of analysis.” As we noted in our
meta-analysis (see Gildersleeve et al., 2014, pp. 33), to ensure conclusions will generalize to the
population of women (rather than stimulus men) from whom the samples included in the meta-
analysis were drawn, all effect sizes must be based on analyses treating women as the unit of
analysis. When a study reported effect size information based on analyses treating men as the
unit of analysis, we followed up with authors to obtain effect size information based on
reanalyses treating women as the unit of analysis. When the authors could not provide this
information, we excluded the effects (see Gildersleeve et al., 2014, pp. 33 and Table 1).
In their meta-analysis paper, Wood et al. note, “Given our focus on menstrual cycle
effects, the appropriate metric of variability comes from the participants providing ratings”
(Wood et al., 2014, pp. 7), implying understanding of the unit of analysis issue. Nonetheless
Wood et al. computed 14 effect sizes using effect size information (means, standard deviations,
and so on) from analyses treating men as the unit of analysis (one effect from Gangestad &
Thornhill, 1998; two effects from Hodges-Simeon, Gaulin, & Puts, 2010; one effect from Peters,
Rhodes, & Simmons, cited as 2007, correct year is 2008; two effects from Peters, Simmons, &
Rhodes, 2009; four effects from Putz, 2004; one effect from Rikowski & Grammer, 1999; one
effect from Soler et al., 2003; one effect from Thornhill & Gangestad, 1999; and one effect from
Thornhill et al., 2003). Notably, Gangestad and Thornhill (1998), Thornhill and Gangestad
(1999), and Thornhill et al. (2003) all reported two sets of analyses—one treating men and
another treating women as the unit of analysis. Oddly, in these cases, Wood et al. included the
inappropriate men-as-units effects in their analysis. Furthermore, to compute all of these effects,
2

Wood et al. used the women’s sample sizes in combination with the men’s means, SDs, and so
on. They provide no justification for this unusual and inappropriate method (see pp. 7).
Finally, an additional difference between the two meta-analyses is that Gildersleeve et al.
used multilevel models to properly account for the non-independence of effects nested within the
same study. In contrast, Wood et al. used single-level models and averaged across effects nested
within the same study so that each study contributed a single effect to analyses. This approach
could produce biased estimates of effect size, statistical significance, and so on. And in fact,
whereas our multilevel re-analysis of Wood et al.’s data revealed a marginally significant cycle
shift in preferences for hypothesized cues of genetic quality in a short-term context (p = .07),
where the strongest such effect is predicted, a single-level analysis of these same effects
produced a nonsignificant cycle shift (p = .16). It is possible that Wood et al.’s analytic approach
suppressed effects elsewhere as well.
Does Variability Indicate No True Effects?
Wood and Carden examined the distributions of findings included in our and Wood et
al.’s meta-analysis samples, apparently to gain insight into whether true cycle shifts exist. They
emphasize that “a third of the effects included in both reviews trended in the direction opposite
to evolutionary psychology predictions,” “only seven of [Gildersleeve et al.’s] effects (i.e., 7%)
were statistically significant in the predicted direction, while three studies reported statistically
significant effects in the reverse direction,” and “a few isolated large effect sizes had a
disproportionate effect on the overall mean results in both reviews,” each of which they interpret
as inconsistent with the existence of real cycle shifts.
These claims are problematic. As noted in the main text, variation in effect size and
direction across studies is not inconsistent with the existence of a true effect. Sampling error
3

results in a distribution of effect sizes, with some studies overestimating and some studies
underestimating the true effect. Differences in sample populations, methods, and other factors
further contribute to variation. Wood and Carden’s insinuation that such variation is somehow
inconsistent with a true positive effect is simply untrue (Borenstein, Hedges, Higgins, &
Rothstein, 2010). Indeed, a key rationale for conducting a meta-analysis, rather than a narrative
review, is to do what a narrative reviewer’s mind typically cannot—weight each effect size by its
precision to estimate the true mean effect from the distribution of effect sizes (Borenstein et al.,
2010).
Aside from this conceptual misrepresentation, Wood and Carden failed to take
relationship context into account when examining the distribution of effects in our meta-analysis.
Notably, had Wood and Carden taken relationship context into account, they would have
observed a pattern consistent with the pattern of cycle shifts predicted by the ovulatory shift
hypothesis (though meta-analysis is of course necessary to assess the robustness of this pattern).
In our Broad sample of effects, the proportion of negatively signed effects was largest in a long-
term relationship context (14/28 effects, 50%); intermediate in an unspecified context (13/38
effects; 34%); and smallest in a short-term relationship context (8/30 effects, 27%). This pattern
was even more pronounced in the Narrow sample of effects, with 10/20 (50%), 10/29 (34%), and
just 2/19 (11%) negatively signed effects in a long-term, unspecified, and short-term context,
respectively.
Second, variation in statistical significance is not inconsistent with a true effect. As noted
in the main text, statistical significance depends on both sample size and effect size. A very large
effect can fail to reach statistical significance in a small sample, and a tiny effect can reach
statistical significance in a very large sample. Another key rationale for conducting a meta-
4

analysis is that it abandons the practice of “vote-counting”—tallying up the effects that are
versus are not statistically significant in the predicted direction. This practice is problematic in
that it often enables a) mistakenly equating a larger proportion of statistically significant effects
in the predicted direction with support for the predicted effect (and vice versa) and b) mistakenly
equating inconsistency in the statistical significance of effects with inconsistency in support for
the predicted effect (and vice versa; Borenstein et al., 2010).
Third, and relatedly, large effects exerting influence over the mean effect size is not
inconsistent with a true effect. Wood and Carden (2014) note that, by removing seven
particularly influential studies in our sample, which they claim had a “disproportionate influence
on the aggregated, mean results,” they were able to reduce the weighted mean cycle shift to
barely below statistical significance. They imply that this indicates that the overall weighted
mean cycle shift we reported is not robust. This argument is flawed in several ways. First, in
meta-analysis, each effect is weighted by the inverse of its variance, and this is the case
regardless of effect size or direction. Whether very large, very small, or intermediate in size,
effects with smaller variances—in other words, effects measured with greater precision—are
given more pull on overall weighted mean effect sizes. Having established that small effects are
not likely to be underrepresented in the sample (as we did in our meta-analysis by using
conventional funnel plot and trim and fill procedures; see pp. 43-45), the question is then
whether there is a significant weighted mean effect across the distribution of effects. Our meta-
analysis revealed several such overall effects, in line with the predictions of the ovulatory shift
hypothesis.
Furthermore, in their analysis examining influential effects, Wood and Carden again
failed to take relationship context into account—that is, they estimated the mean cycle shift
5

across short-term, unspecified, and long-term relationship contexts, even though no cycle shift is
predicted in a long-term context. This inappropriate method made it easier to reduce the overall
effect to below significance and made the seven studies appear to be a misleadingly small
proportion of the data. Had Wood et al. instead attempted to reduce the weighted mean cycle
shift across the short-term and unspecified contexts (where an effect is predicted) to barely below
significance, this would have required removing the 15 largest effects from the Broad sample—
22% of the data (out of 68 effects in total). Reducing this same effect to barely below
significance in the Narrow sample would have required removing the 21 largest effects—43% of
the data (out of 49 effects in total). Lastly, a p value of .05 or just barely greater than .05 is not
generally interpreted as compelling evidence for a true null effect. Thus, Wood et al.’s
conclusion, “Thus, Gildersleeve et al.’s conclusions rest on a small number of studies,” is
unjustified and misleading.
In sum, none of Wood and Carden’s points about the distribution of effects in our meta-
analysis sample actually speak to whether true cycle shifts exist, and many were based on flawed
arguments and analyses that failed to take relationship context into account.
Robust Cycle Shifts in Wood’s Data are Not Accounted for by Publication Bias
In our reanalysis of Wood et al.’s data, we observed marginally significant and
statistically significant cycle shifts in a short-term and unspecified relationship context,
respectively, among those effects that examined cycle shifts in women’s preferences for
hypothesized cues of genetic quality. To determine whether these cycle shifts might have been
inflated by an underrepresentation of small effects in their sample (e.g., as might result from
publication bias), we constructed a funnel plot of all of these effects (i.e. all effects for which a
positive effect was predicted under the ovulatory shift hypothesis). As shown below, this funnel
6

plot and subsequent trim and fill procedures revealed no evidence of such bias. P-curves,
reported in the main body of our article and below, likewise produced no evidence that
publication bias or selective reporting account for findings consistent with the ovulatory shift
hypothesis.
Disclosure of Information Used to Create P-curves
Table of Contents
1. Selection Criteria
2. P-curve disclosure table: Effects evaluating Cycle Shift Prediction and Context Moderation Prediction
2a. Included studies2b. References
3. P-curve summary tables of test-statistics, df, reported and recalculated p values for effects evaluating Cycle Shift Prediction and Context Moderation Prediction
4. P-curve disclosure table: Effects evaluating Partner Qualities Moderation Prediction4a. Included studies4b. References
7

5. P-curve summary tables of test-statistics, df, reported and recalculated p values for effects evaluating Partner Qualities Moderation Prediction
6. P-curves 6a. P-curve of reported p values (16 in total) evaluating Cycle Shift Prediction and Context Moderation Prediction6b. P-curve of reported p values (24 in total) evaluating Cycle Shift Prediction, Context Moderation Prediction, and Partner Qualities Moderation Prediction (more conservative)6c. P-curve of reported p values (26 in total) evaluating Cycle Shift Prediction, Context Moderation Prediction, and Partner Qualities Moderation Prediction (less conservative)6d. P-curve of exact p values (23 in total) evaluating Cycle Shift Prediction, Context Moderation Prediction, and Partner Qualities Moderation Prediction (less conservative)6e. P-curve of reported p values (12 in total) evaluating Cycle Shift Prediction6f. P-curve of exact two-tailed p values (13 in total) evaluating Cycle Shift Prediction6g. P-curve of reported p values (8 in total) evaluating Partner Qualities Moderation Prediction (more conservative)6h. P-curve of exact two-tailed p values (6 in total) evaluating Partner Qualities Moderation Prediction (more conservative)6i. P-curve of reported p values (10 in total) evaluating Partner Qualities Moderation Prediction (less conservative)6j. P-curve of exact two-tailed p values (8 in total) evaluating Partner Qualities Moderation Prediction (less conservative)
7. Documentation of effect size estimation7a. R code for determining effect size7b. Notes on effect size estimation procedure7c. Summary table of estimation results
8. Tables of p-values included in Figures 2 and 3 in the main text 8a. P-values included in Figure 2 8b. P-values included in Figure 3
8

1. Selection Criteria
P value was eligible for inclusion if...
I. p was reported in published paper
II. p < .05
III. Either A or B applied:
A. P value was associated with an effect that was expected to be positive under the ovulatory shift hypothesis and was included in the “Broad” genetic quality analysis in the meta-analysis by Gildersleeve, Haselton, & Fales (2014, Psychological Bulletin). There were two such sets of effects: 1. Effects evaluating The Cycle Shift prediction, which posits that women will have a
greater preference for hypothesized cues of genetic quality in ancestral males at high relative to low fertility, but only when women evaluate men’s attractiveness in a short-term or unspecified relationship context.
2. Effects evaluating The Context Moderation prediction, which posits that women’s greater preference for hypothesized cues of genetic quality in ancestral males will be moderated by relationship context, such that the increase in preferences at high- relative to low-fertility is larger in a short-term than in a long-term relationship context.
B. P value was associated with an effect that evaluated one of the interrelated predictions that, for ease of reference, we have grouped together as "The Partner Qualities Moderation prediction." This included the following predictions:1. There will be a positive association between the extent to which women’s male
partner possesses the characteristics that women particularly prefer at high fertility within the cycle (e.g., masculinity and symmetry) and the extent to which their attraction to their own partner (“in-pair” attraction) increases at high relative to low fertility.
2. Conversely, there will be a negative association between the extent to which women’s male partner possesses these characteristics and the extent to which their attraction to other men (“extra-pair” attraction) increases at high relative to low fertility.
3. Relatedly, there will be a negative association between the extent to which women’s male partner possesses these characteristics and the extent to which their favorable evaluations of their partner or relationship (e.g., feelings of closeness or relationship satisfaction) decrease at high relative to low fertility.
Notably, some studies combined the in-pair and extra-pair attraction predictions and tested higher-order interactions examining a negative association between the extent to which women's
9

partner possesses these characteristics and the extent to which their extra-pair relative to in-pair attraction increased at high relative to low fertility.
Moderators included the following purported ancestral indicators of genetic quality or genetic compatibility: masculinity, mating desirability, MHC allele dissimilarity, sexual attractiveness, sexual-versus-investment attractiveness, and fluctuating asymmetry (purported to be an indicator of lower genetic quality in the ancestral past).
Cases of Multiple Reported ps
Some studies tested both the Cycle Shift prediction and Context Moderation prediction or contained multiple dependent measures. These studies therefore contained multiple p values that could be statistically nonindependent. In such cases, we used the following decision rules to select ps for inclusion in the p-curves jointly evaluating the Cycle Shift and Context Moderation predictions or the Cycle Shift, Context Moderation, and Partner Qualities Moderation predictions (no such issues arose when selecting ps evaluating The Cycle Shift prediction alone).
First, when a study reported tests of both The Cycle Shift prediction and the Context Moderation prediction, we selected ps evaluating The Context Moderation prediction (a higher-order effect) over ps evaluating The Cycle Shift prediction (a lower-order effect). If a study contained multiple ps evaluating The Context Moderation prediction, we selected ps based on analyses that made use of more information (e.g., based on composites) over ps based on analyses that made use of less information (e.g., based on individual rating items). If a study contained multiple ps evaluating The Partner Qualities Moderation prediction, we used a two-fold strategy. This applied to two studies, and the first author provided us with the original data file for both studies, allowing us to directly examine relationships among cycle shifts in the dependent measures. For the p-curves labeled "More Conservative" below, as well as those presented in Figures 2 and 3 of the main text, we used the conservative strategy of selecting the single largest p value from each of these studies and excluded all other ps. Thus, no potentially nonindependent ps were included in the “More Conservative” p-curves. For the p-curves labeled "Less Conservative" below, we retained multiple p values from a given study if the cycle shifts in the dependent measures could be justified as statistically independent.
Details about selection of ps in affected studies:
– Gangestad et al. (2004) and (2007) used the same sample of participants, and each contained multiple p values that were otherwise eligible for inclusion in the p-curves examining all p values across the Cycle Shift and Context Moderation predictions and in the p-curves examining all p values across the Cycle Shift, Context Moderation, and Partner Qualities Moderation predictions according to the selection criteria outlined above. In total, this included one p examining The Cycle Shift prediction—the difference between high and low fertility in women’s preference for “Social Presence and Direct Intrasexual Competitiveness” (composite of SP and DIC) (Gangestad et al., 2004) and seven ps examining The Context Moderation prediction—the moderating effect of relationship context (ST vs. LT) on women’s attraction to “Social Presence,” “Direct Intrasexual Competitiveness,” “Social Presence and Direct Intrasexual Competitiveness”(composite of SP and DIC) (Gangestad et al., 2004), “Socially
10

Respected and Influential,” “Arrogant and Self-centered,” “Muscular,” and “Confrontative” (Gangestad et al., 2007).
Of these eight ps, we selected the p associated with the moderating effect of relationship context on women’s attraction to “Social Presence and Direct Intrasexual Competitiveness” (composite of SP and DIC) (Gangestad et al., 2004) to represent both studies in the p-curves examining all p values across the Cycle Shift and Context Moderation predictions and in the p-curves examining all p values across the Cycle Shift, Context Moderation, and Partner Qualities Moderation predictions. We selected this p because it examined the higher-order effect—The Context Moderation prediction, rather than the Cycle Shift prediction—and was based on an effect that made use of more information by virtue of examining attraction to the composite of SP and DIC, rather than SP or DIC (or another male characteristic) on its own.
– Larson et al. (2013) contained multiple ps from Sample 2 that were otherwise eligible according to the selection criteria outlined above. In total, this included three ps evaluating The Partner Qualities Moderation prediction—specifically, the moderating effect of partner mating desirability on the difference between high and low fertility in women’s ratings of closeness to their partner, ratings of relationship satisfaction, and extent to which they rated faults as characteristic of their partner, respectively.
For all “More Conservative” p-curves, we selected the largest p. For all “Less Conservative” p-curves, we examined relationships among cycle shifts in the dependent measures to determine which ps to include. Cycle shifts in women’s assessments of partner faults and cycle shifts in women’s assessments of their satisfaction were not substantially associated (r = -.016, p = .92). Likewise, cycle shifts in women’s assessments of partner faults and feelings of closeness (as measured by the Inclusion of Other in Self scale; Aron, Aron, & Smollan, 1992) were not substantially associated (r = .095, p = .546). In contrast, cycle shifts in women’s assessments of their feelings of closeness and assessments of their relationship satisfaction were associated (r = .305, p = .047). Because they were justifiable as statistically independent, we included the p values corresponding to partner faults and feelings of closeness in the “Less Conservative” p-curve, whereas we excluded the p value corresponding to relationship satisfaction.
– Larson et al. (2012) contained two ps that were otherwise eligible according to the selection criteria outlined above: one p evaluating the moderating effect of women’s ratings of their partner’s sexual attractiveness on the difference between high and low fertility in their in-pair attraction and one p evaluating the moderating effect of 3rd-party ratings of women’s partner’s sexual attractiveness on the difference between high and low fertility in their extra-pair attraction.
For all “More Conservative” p-curves, we selected the larger p (the second of the two ps described above). For all “Less Conservative” p-curves we retained both p values. We did this because the predicted directions of these effects were opposite of one another (as partner sexual attractiveness decreased, women’s extra-pair relative to in-pair attraction at high fertility relative to low fertility was expected to increase); however, the cycle shifts in these dependent measures were nevertheless modestly positively correlated (r = .23, p = .15).
11

Tests for Skew: Windsorizing
Testing for skew entails computing the “pp” value of each p value to be included in the p-curve. The pp value is the p value of the p value—the probability of observing a p value at least that extreme under the null of no true effect. (Specifically, pp = p value/.05.) Some of the pp values corresponding to the p-curves we present are very small because the p values themselves were very small. Simonsohn et al. (2014) recommend Windsorizing extremely small pp values to .01 to prevent them from unduly influencing the p-curve’s skewness. As noted in the P-curve Summary of Test Statistics tables below, we windsorized all pp values less than .01 to .01.
P-curves of “Reported” versus “Exact Two-Tailed” p Values
In the following, we present two sets of p-curves: p-curves of the p values as they were reported in the published papers, including some ps based on one-tailed or directed tests (which allocate .04 to the predicted tail and .01 to the non-predicted tail; Rice & Gaines, 1994), and p-curves of the exact two-tailed p values recalculated based on the test statistics and degrees of freedom. In four cases, recalculating the exact two-tailed p value increased a reported p of less than .05 to an exact p of greater than .05, in which case the p was no longer eligible for inclusion in the p-curve of exact two-tailed p values. Two of these cases involved tests of The Context Moderation prediction: a two-way interaction of mating context by fertility predicting women’s attraction to body masculinity (Little, Jones, & Burriss, 2007, Study 1) and a two-way interaction of mating context by fertility predicting women’s attraction to vocal masculinity (Puts, 2005). The other two cases involved tests of The Partner Qualities Moderation prediction: a three-way interaction of target (in-pair vs. extra-pair) by partner facial masculinity by fertility predicting sexual attraction (Gangestad et al., 2010) and a two-way interaction of male partner mating desirability by fertility predicting women’s feelings of closeness to their partner (as measured by the Inclusion of Other in Self scale; Larson et al., 2013, Sample 2).
In contrast, in one case, recalculating the exact two-tailed p value decreased a reported p of .05 to .049, thereby making that p eligible for inclusion in the p-curve examining exact two-tailed p-values (though not in p-curves examining reported two-tailed p-values). This effect tested the Cycle Shift prediction; specifically, it tested the main effect of fertility on women’s attraction to a masculine gait in an unspecified mating context (Provost et al., 2008, Study 1).
Lastly, as noted above, we present two additional p-curves in the main text. These p-curves are the same as 6a and 6b below, except that they include exact two-tailed p values rather than reported p values (see Figures 2 and 3). We present all of these p-curves in order to be comprehensive. We examined all key p-curves that one might reasonably construct from the literature on cycle shifts in women’s mate preferences and the related literature on cycle shifts in relationship dynamics in order to verify that the shape of the frequency distribution of ps is right-skewed no matter what set of inclusion criteria is applied. To aid in interpreting the p-curves, in each figure, we have also plotted the expected distribution of p values given a true effect and 33% power to detect that effect.
12

2. P-curve disclosure table: Effects evaluating Cycle Shift Prediction and Context Moderation Prediction2a. Included studies
Original paper
Quoted text from original paper indicating prediction of interest
to researchersStudy design Quoted text from original paper with
statistical results Results
Gangestad, Simpson, Cousins, Garver-
Apgar, & Christensen (2004)
“On the basis of the theory that these behavioral displays partly
reflect (and signal) broadly defined condition (see Thornhill
& Gangestad, 1999a), we predicted that during fertile
days, women would prefer the displays in short-term mates
more than in long-term mates, but during nonfertile days, this
difference between mating contexts would not occur.” (p.
204)
fertility (continuous) x SP-
DIC composite predicting short-term attraction
“With short-term mating attractiveness as the dependent
variable, a predicted Conception Risk X SP-DIC Composite
interaction emerged, t(7677) = 2.58, p = .010; as expected, this
interaction was not significant when long-term mating attractiveness was the dependent variable, t(7677) = -
0.36, n.s.” (p. 206)
t(7677) = 2.58, p = .010
fertility (continuous) x
social presence x relationship context
(short-term vs. long-term)
predicting attraction
“Additional follow-up analyses revealed that, entered independently,
both Social Presence and Direct Intrasexual Competitiveness
interacted with conception risk and mating context to predict
attractiveness ratings, t(7672) = 2.10 and 2.21, respectively, p = .036
and .027 (Table 1).” (p. 206)
t(7672) = 2.10, p = .036a
fertility (continuous) x
direct intrasexual competitiveness x
relationship context (short-term vs.
long-term) predicting attraction
t(7672) = 2.21, p = .027a
fertility (continuous) x SP-
“The predicted effect emerged: Conception Risk x SP-DIC t(7677) = 3.06, p = .002
13

DIC composite x mating context (short-term vs.
long-term) predicting attraction
Compositex Mating Context, t(7677) = 3.06, p
= .002.” (p. 205)
Gangestad, Garver-Apgar,
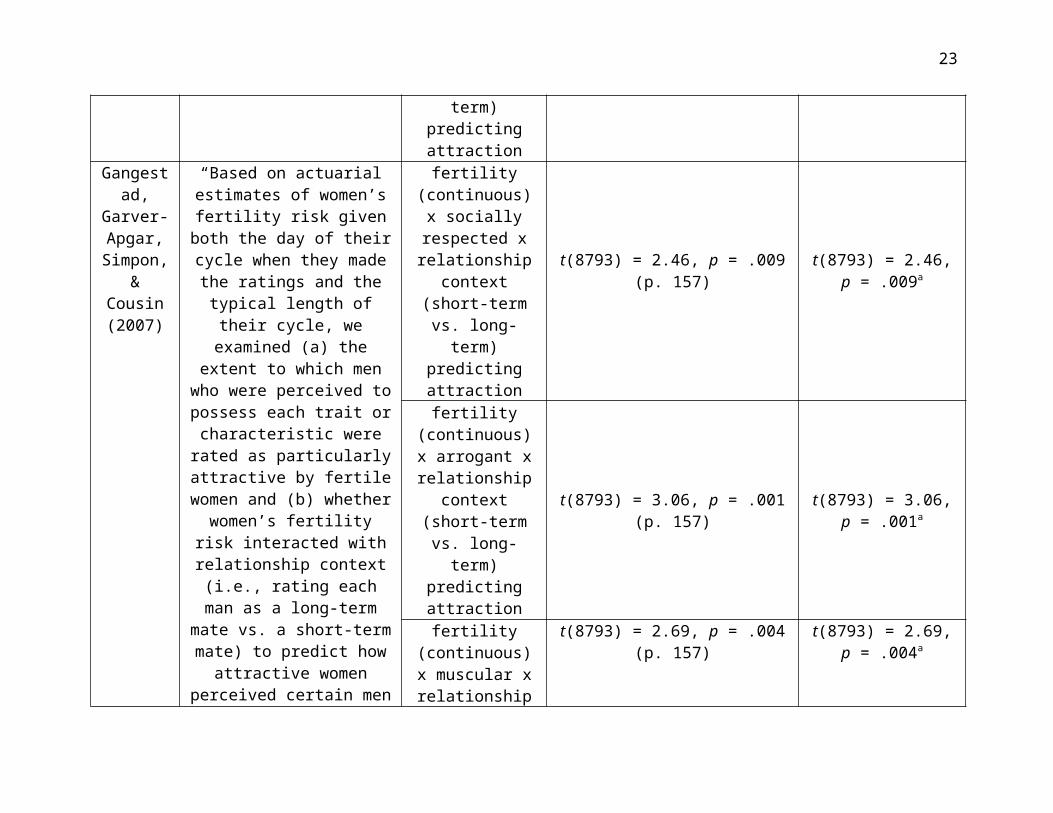
Simpon, & Cousin (2007)
“Based on actuarial estimates of women’s fertility risk given
both the day of their cycle when they made the ratings and the
typical length of their cycle, we examined (a) the extent to
which men who were perceived to possess each trait or
characteristic were rated as particularly attractive by fertile
women and (b) whether women’s fertility risk interacted with relationship context (i.e., rating each man as a long-term mate vs. a short-term mate) to predict how attractive women perceived certain men to be.”
(p. 154)
fertility (continuous) x
socially respected x relationship context
(short-term vs. long-term)
predicting attraction
t(8793) = 2.46, p = .009 (p. 157) t(8793) = 2.46, p = .009a
fertility (continuous) x
arrogant x relationship context
(short-term vs. long-term)
predicting attraction
t(8793) = 3.06, p = .001 (p. 157) t(8793) = 3.06, p = .001a
fertility (continuous) x
muscular x relationship context
(short-term vs. long-term)
predicting attraction
t(8793) = 2.69, p = .004 (p. 157) t(8793) = 2.69, p = .004a
fertility (continuous) x confrontative x
relationship context (short-term vs.
long-term) predicting attraction
t(8793) = 3.07, p = .001 (p. 157) t(8793) = 3.07, p = .001a
14

Gangestad &
Thornhill (1998)
“In this study, we examined women's responses to men's body odour as a function of
men's FA and stages throughout the menstrual cycle. … We were interested in whether
women's preferences could also be predicted from men's FA,
particularly for women who are in a fertile phase of their
ovulatory cycle.” (p. 928)
correlation between fertility
(continuous) and attraction to scents
associated with symmetry
“Normally ovulating (non-pill using) women's preference for symmetry was correlated with the estimated
fertility risk based on the day in the menstrual cycle that the women had
reached. … The correlation was highly significant, r = 0.54, p =
0.001 (d.f. = 26).” (p. 930)
r = 0.54, p = 0.001
Johnston, Hagel,
Franklin, Fink, &
Grammer (2001)
“…the current study examined how a variety of different facial
preferences (attractive male, attractive female, dominant male, dominant female, etc.)
are, or are not, modified by the hormonal state of female
viewers.” (p. 254)
Simple effect of fertility (high vs. low) predicting
attraction to facial masculinity
“A within-subject analysis of their data revealed that within the high-
risk window, these women selected an attractive male face that was
significantly more masculine than their choice outside of this window
[t(28) = 2.20, P = .02].” (p. 258)
t(28) = 2.20, P = .02
Jones, Little,
Boothroyd, DeBruine, Feinberg,
Law Smith, Cornwell, Moore &
Perrett (2005) Study 2
“We hypothesized that attraction to apparent health and femininity in male faces would
both be positively related to estimated progesterone level and that these relationships
would be independent.” (p. 286) [Note: Progesterone is higher in the luteal phase than in the mid-follicular phase. Therefore, by predicting higher preferences
for femininity in the luteal phase, the authors are predicting
higher preferences for
Main effect of fertility (high vs. low) predicting
attraction to facial masculinity
“A separate univariate ANOVA [dependent variable: % maximum
preference for masculinity; between subject factor: phase (late follicular,
mid-luteal); covariates: age, % maximum preference for apparent health] confirmed that attraction to facial masculinity was significantly stronger in the late follicular phase of the menstrual cycle than during the luteal phase (F = 8.452, df =
1,324, p = 0.004).” (p. 288) [Note: Personal correspondence with Ben Jones confirmed that the published
F = 8.452, df = 1,324, p = 0.004
15

masculinity in the mid-follicular phase.]
report contained errors in the description of these analyses and
results and that what we report here has been corrected.]
Little, Jones,
Burt, & Perrett (2007) Study 2
“Following Study 1 we predicted that women would have stronger preferences for symmetry when at the more fertile phase of the menstrual
cycle than at other times. Following findings for
preferences for masculinity in faces, bodies, and behavioural
displays we also predicted potential interactions such that
(1) women would have stronger preferences for symmetry at peak fertility when rating for short-term than for long-term
relationships...” (p. 212)
Simple effect of fertility (high vs. low) predicting
attraction to facial symmetry in a
short-term relationship context
“Using an independent samples t-test we found that women preferred more symmetric faces for short-term relationships when they were in the
fertile versus less-fertile phase (t208 = 3.91, p < 0.001, D = 0.542)...” (p.
213)
t208 = 3.91, p < 0.001
2 fertility (high vs. low) x 2
relationship context (short-term vs.
long-term) predicting attraction to facial symmetry
“A repeated measures ANOVA was carried out with ‘Term’ (long/short) [mating context] as a within-subject
factor and ‘Partner’ (yes/no), ‘Fertility’ (high/low) and ‘Test’ (lab/Internet) as between-subject
factors. Age was entered as a covariate . . . The ANOVA revealed
a significant interaction between ‘Term’ and ‘Fertility’ (F1,201 = 6.54,
p = 0.011, η2p < 0.031).” (p. 213)
F1,201 = 6.54, p = 0.011
Little, Jones, & Burriss (2007) Study 1
“We predicted, following similar results for preferences for masculinity in male faces,
that women would prefer more masculine male bodies when in
the follicular phase of their cycle and that preferences for
masculinity would be enhanced for short-term relationships.” (p.
634)
2 fertility (high vs. low) x 2
relationship context (short-term vs.
long-term) predicting attraction to body masculinity
“A repeated measures ANOVA with term (long/short) as a within-
participant factor, partnership status and fertility as between-participant
factors, and age and self-rated attractiveness entered as covariates
was conducted. This revealed a close to significant interaction between term and fertility (F1,91 = 3.9, p =
0.053). We note that as we predict
F1,91 = 3.9, p = .027
16

this relationship, this is conventionally significant using a one-tailed probability (0.027).” (p.
635)
Little, Jones & Burriss (2007), Study 2
“We also predicted that menstrual cycle shifts may be
greater for short-term relationships, again following
findings from face preferences.” (p. 634)
2 fertility (high vs. low) x 2
relationship context (short-term vs.
long-term) predicting attraction to body masculinity
“… a significant interaction between fertility and term (F1,16=7.3,
p=0.016). The interaction indicated that women most preferred
masculinity in male bodies when rating for a short-term relationship at
high fertility, as shown in Fig. 3.” (p. 637)
F1,16 = 7.3, p = 0.016
Little, Jones, & DeBruine
(2008)
“We predicted (following similar results for preferences for manipulated masculinity in male faces) that women would
prefer more masculine real male faces when in the follicular
phase of their cycle.” (p. 479)
Main effect of fertility (high vs. low) predicting
attraction to facial masculinity
“A univariate ANOVA with partner (yes/no) and cycle phase
(follicular/luteal) as between-participant factors and age as a covariate revealed a significant
effect of cycle phase (F4,145 = 5.30, p = .023)…” (p. 480) (Note: error in
reported df numerator; should be 1.)
F4,145 = 5.30, p = .023 (Note: error in reported df numerator; should be
1.)
Penton-Voak & Perrett (2000)
“In the follicular phase of the menstrual cycle however, we hypothesized that preferences may shift somewhat toward
more masculine stimuli.” (p. 41)
Effect of fertility (high vs. low) on
sum of ranks (masculinization of male faces: -50%, -30%, 0%, +30%, +50%) to predict attraction to facial
masculinity
“A Mann-Whitney test indicated that women in the high conception risk
group were significantly more likely to choose a masculine face than those in the low conception risk
group (U=1798, Z= -2.255, p=.024, Fig. 2).” (p. 45)
U=1798, Z= -2.255, p=.024
Penton-Voak et al.
(1999), Study 1
“Heritable benefits can be realized only if conception
follows copulation, so women might be more attentive to
Main effect of fertility (high vs. low) predicting
attraction to facial
“Repeated-measures analysis of variance (ANOVA) showed a
significant main effect of conception risk (variance ratio (F(1,37) = 9.47;
F(1,37) = 9.47; P<0.004
17

phenotypic markers indicating immunological competence
during the follicular phase of the menstrual cycle when
conception is most likely. … Here we show that female
preference for secondary sexual traits in male face shapes varies
with the probability of conception across the menstrual
cycle.” (741)
masculinity
P<0.004), with subjects preferring faces that were less feminized in the high-conception-risk phase than in the low-conception-risk phase.” (p.
741)
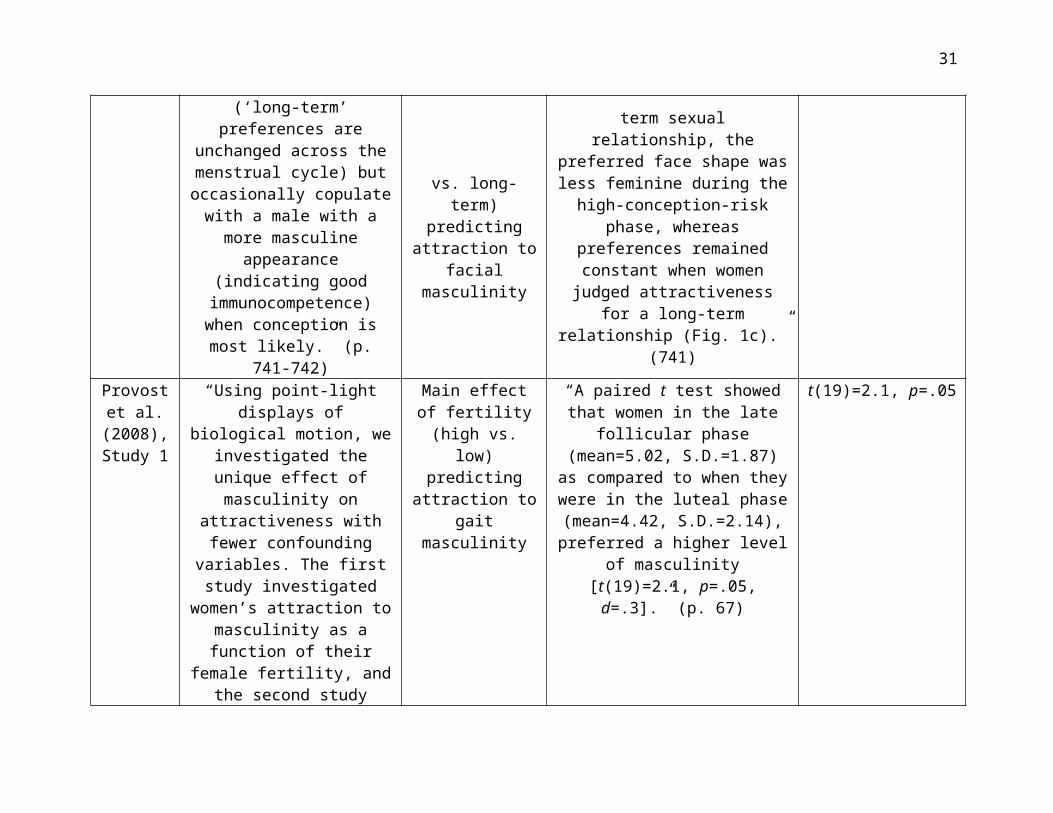
Penton-Voak et al.
(1999), Study 2
“A female might choose a primary partner whose low
masculine appearance suggests cooperation in parental care (‘long-term’ preferences are
unchanged across the menstrual cycle) but occasionally copulate
with a male with a more masculine appearance
(indicating good immunocompetence) when
conception is most likely.” (p. 741-742)
2 fertility (high vs. low) x 2
relationship context (short-term vs.
long-term) predicting attraction to facial masculinity
“However, conception risk interacted with type of relationship
(short-term or long-term; F(1,47)=5.39, P=0.025). For a short-
term sexual relationship, the preferred face shape was less
feminine during the high-conception-risk phase, whereas
preferences remained constant when women judged attractiveness for a long-term relationship (Fig. 1c).”
(741)
F(1,47)=5.39, P=0.025
Provost et al. (2008),
Study 1
“Using point-light displays of biological motion, we
investigated the unique effect of masculinity on attractiveness
with fewer confounding variables. The first study
investigated women’s attraction to masculinity as a function of their female fertility, and the
Main effect of fertility (high vs. low) predicting attraction to gait
masculinity
“A paired t test showed that women in the late follicular phase (mean=5.02, S.D.=1.87) as
compared to when they were in the luteal phase (mean=4.42,
S.D.=2.14), preferred a higher level of masculinity [t(19)=2.1, p=.05,
d=.3].” (p. 67)
t(19)=2.1, p=.05
18

second study investigated women’s attraction to
masculinity as a function of their sociosexuality.” (p. 66)
Puts (2005)
“Specifically, I test whether low male VP (1) increases short-
term, sexual attractiveness more than long-term relationship attractiveness, (2) is more
attractive to women nearer peak fertility…” (p. 390)
Fertility (continuous) x 2 pitch (raised vs.
lowered) x 2 relationship context
(short-term vs. long-term)
predicting ratings of male vocal
attractiveness
“On the other hand, there was a significant three-way interaction between P manipulation, mating
context, and fertility [F(1,106)=3.24, p=.037], as predicted (Fig. 1).” (p.
393)
F(1,106)=3.24, p = .037
Roney, Simmons, & Gray (2011)
“For the subset of cases with a testing session near ovulation, we also predicted that women
would exhibit stronger preferences for facial cues of
men’s testosterone when tested inside the estimated fertile window than when tested
outside this window…” (p. 743)
Main effect of fertility (high vs. low) predicting
attraction to facial cues of testosterone
“Repeated measures ANOVA revealed that, as predicted, women exhibited stronger preferences for the high testosterone faces when tested inside the estimated fertile window (mean z = 0.19 ± 0.27; mean raw percentage of high
testosterone faces chosen = 52%) than when tested in their other session (mean z = -0.28 ± 0.18; mean raw percentage of high
testosterone faces chosen = 43%), F (1, 17) = 4.84, p = 0.04.” (p. 746)
F (1, 17) = 4.84, p = 0.04
Thornhill &
Gangestad (1999)
“…a previous study by the authors provided data
supporting the hypothesis that olfactory stimuli pertaining to men’s phenotypic and genetic quality, measured by degree of
Correlation between fertility
(continuous) and attraction to scents
associated with symmetry
“Normally ovulating (non-pill-using) women’s preference for symmetry was correlated with
estimated fertility risk based on women’s day in the menstrual cycle.
The correlation was highly
r = .43, p = .001
19

body FA, positively affect men’s sexual attrac- tiveness to
women (Gangestad and Thornhill 1998a)…. First, we wished to see if the first study would replicate and thereby
assess the reliability of its main finding using a larger sample.
Second,... in this study we examined whether women prefer the scents of visually
attractive men (based on facial photographs) as well as
symmetric men.” (p. 178)
significant, r = .43, p = .001 (N = 48).” (p. 186)
Thornhill, Chapman,
& Gangestad
(2013)
“In the current study, we examined changes in women’s
preferences for the scent of high-T men across the ovulatory
cycle using a larger sample of men (46) and procedures used in studies examining women’s
preferences for scents associated with men’s symmetry.” (p. 217)
Correlation between fertility
(continuous) and attraction to scents
associated with testosterone levels
“Conception risk did covary significantly and positively with
male scents associated with T levels, r46 = .32, p = .016.” (p. 219)
r46 = .32, p = .016
Thornhill, Gangestad,
Miller, Scheyd,
McCollough &
Franklin (2003)
“Based on this notion, Gangestad and Thornhill
(1998b) proposed that olfactory stimuli pertaining to men’s
phenotypic and genetic quality, measured by degree of body FA, positively affects men’s
scent attractiveness to women, particularly during the fertile
Correlation between fertility
(continuous) and attraction to scents
associated with symmetry
“Consistent with previous studies, women’s preference for symmetry
was predicted by their fertility status (r = .269, directed p = .019).” (p.
673)
r = .269, directed p = .019
20

phase of the cycle when expressed preference for
offspring’s sire is critical.” (p. 669)
a Not included in p-curve due to non-independence.
21

2b. References
Gangestad, S. W., Simpson, J. A., Cousins, A. J., Garver-Apgar, C. E., & Christensen, P. N.(2004). Women's preferences for male behavioral displays change across the menstrual cycle. Psychological Science, 15, 203-207.
Gangestad, S. W., Garver-Apgar, C. E., Simpson, J. A., & Cousins, A. J. (2007). Changes inwomen's mate preferences across the ovulatory cycle. Journal of Personality and Social Psychology, 92, 151-163.
Gangestad, S. W., & Thornhill, R. (1998). Menstrual cycle variation in women's preferences forthe scent of symmetrical men. Proc. R. Soc. Lond. B, 265, 927-933.
Johnston, V. S., Hagel, R., Franklin, M., Fink, B., & Grammer, K. (2001). Male facialattractiveness: Evidence for hormone-mediated adaptive design. Evolution and Human Behavior, 22, 251-267.
Jones, B. C., Little, A. C., Boothroyd, L., DeBruine, L. M., Feinberg, D. R., Smith, M. J., ... & Perrett, D. I. (2005). Commitment to relationships and preferences for femininity and apparent health in faces are strongest on days of the menstrual cycle when progesterone level is high. Hormones and Behavior, 48, 283-290.
Little, A. C., Jones, B. C., Burt, D. M., & Perrett, D. I. (2007). Preferences for symmetry in faceschange across the menstrual cycle. Biological Psychology, 76, 209-216.
Little, A. C., Jones, B. C., & Burriss, R. P. (2007). Preferences for masculinity in male bodieschange across the menstrual cycle. Hormones and Behavior, 51, 633-639.
Little, A. C., Jones, B. C., & DeBruine, L. M. (2008). Preferences for variation in masculinity inreal male faces change across the menstrual cycle: women prefer more masculine faces when they are more fertile. Personality and Individual Differences, 45, 478-482.
Penton-Voak, I. S., Perrett, D. I., Castles, D. L., Kobayashi, T., Burt, D. M., Murray, L. K., &Minamisawa, R. (1999). Menstrual cycle alters face preference. Nature, 399, 741-742.
Penton-Voak, I. S., & Perrett, D. I. (2000). Female preference for male faces changes cyclically:Further evidence. Evolution and Human Behavior, 21, 39-48.
Puts, D. A. (2005). Mating context and menstrual phase affect women's preferences for malevoice pitch. Evolution and Human Behavior, 26, 388-397.
Roney, J. R., Simmons, Z. L., & Gray, P. B. (2011). Changes in estradiol predict within-womenshifts in attraction to facial cues of men's testosterone. Psychoneuroendocrinology, 36, 742-749.
22
Thornhill, R., & Gangestad, S. W. (1999). The scent of symmetry: a human sex pheromone thatsignals fitness? Evolution and Human Behavior, 20, 175-201.
Thornhill, R., Chapman, J. F., & Gangestad, S. W. (2013). Women's preferences for men's scentsassociated with testosterone and cortisol levels: Patterns across the ovulatory cycle. Evolution and Human Behavior, 34, 216-221.
Thornhill, R., Gangestad, S. W., Miller, R., Scheyd, G., McCollough, J. K., & Franklin, M.(2003). Major histocompatibility complex genes, symmetry, and body scent attractiveness in men and women. Behavioral Ecology, 14, 668-678.
23

3. P-curve summary tables of test-statistics, df, reported and recalculated p values for effects evaluating Cycle Shift Prediction and Context Moderation Prediction
Study df t Reported pExact two-tailed p
Bin for reported p
Bin for exact p
Gangestad et al. (2004)
7677 2.58 .01 .0099 2 1
7672 2.10 --a .--a
7672 2.21 --a --a
7677 3.06 .002 .00222 1 1
Gangestad et al. (2007)
8793 2.46 --a --a
8793 3.06 --a --a
8793 2.69 --a --a
8793 3.07 --a --a
Gangestad & Thornhill (1998) 26 3.27 .001 .003 1 1
Johnston et al. (2001) 28 2.20 .02 .0362 3 4
Jones, Little, et al. (2005) Study 2 324 2.91 .004 .0039 1 1
Little, Jones, et al. (2007) Study 2208 3.91 .001 .0001b 1 1201 2.56 .011 .011 2 2
Little, Jones, & Burriss (2007), Study 1 91 1.97 .027 .051c 3
Little, Jones, & Burriss (2007), Study 2 16 2.70 .016 .0157 2 2
Little et al. (2008) 145 2.30 .023 .0229 3 3
Penton-Voak & Perrett (2000) 137 2.28 .024 .0242 3 3
24

Penton-Voak et al. (1999) Study 1 37 3.08 .004 .0039 1 1
Penton-Voak et al. (1999), Study 2 47 2.32 .025 .0246 3 3
Provost et al. (2008), Study 1 19 2.1 .05 .0493 5
Puts (2005) 106 1.80 .037 .0747c 4
Roney, Simmons & Gray (2011) 17 2.20 .04 .0419 5 5
Thornhill & Gangestad (1999) 46 3.23 .001 .0023 1 1
Thornhill, Chapman, & Gangestad (2013) 46 2.29 .016 .0266 2 3
Thornhill et al. 2003 63 2.22 .019 .0303 2 4
Bin Counts Reported pExact two-tailed p
1 6 72 5 23 5 44 1 25 1 2
a Not included in p-curve due to non-independence. b Windsorized pp to .01 for tests of right skew.c Not included in p-curve because exact p > .05.
25

4. P-curve disclosure table: Effects evaluating Partner Qualities Moderation Prediction 4a. Included studies
Original paper
Quoted text from original paper indicating prediction of interest to
researchersStudy design
Quoted text from original paper with
statistical resultsResults
Gangestad, Thornhill, Garver-Apgar (2010)
“We predicted that the partners of less facially masculine men
would show more pronounced shifts toward greater extra-pair
attraction (relative to in-pair attraction), compared to partners of more facially masculine men.”
(p. 414)
2 fertility (high vs. low) x 2 target
(extra-pair vs. in-pair) x partner
facial masculinity predicting sexual
attraction
“The critical moderating effect of interest was a three-way interaction: a target of interest x fertility x male
facial masculinity effect. As predicted, this effect was statistically significant,
F(1,63) = 3.99, p = .031.” (p. 417)
F(1,63) = 3.99, p = .031
Gangestad, Thornhill, & Garver-
Apgar (2005)
“Hence, the ovulatory cycle shift in women’s extra-pair desires and flirtation should be strongest for women with partners who lack traits preferred by women when fertile. Women whose partners
lack these traits may furthermore be less sexually attracted to their partners when fertile. We tested this hypothesis by examining the
moderating effect of male partners’ fluctuating asymmetry (FA) on women’s extrapair and
in-pair sexual interests across the cycle.” (p. 2024)
2 fertility (high vs. low) x 2 target
(extra-pair vs. in-pair) x partner FA predicting sexual
attraction
“In support of our primary prediction, this two-way interaction was strongly
moderated by partner FA, F(1,50) = 15.64, p < .001.”
(p. 2024)
F(1,50) = 15.64, p < .001
Garver-Apgar,
Gangestad, Thornhill, Miller, &
Olp (2006)
“The current study is the first to test the hypothesis that MHC similarity predicts aspects of
actual human sexual relationships. Specifically, we asked whether women paired
with men with whom they share a
2 fertility (high vs. low) x 2 target
(extra-pair vs. in-pair) x MHC allele sharing predicting sexual attraction
“A significant Target x MHC Sharing interaction emerged, …; MHC sharing predicted attraction to extrapair men
more positively than it predicted attraction to
partners. Also as predicted,
F(1, 36) = 6.76, prep
= .960
26

relatively high proportion of MHC alleles, compared with women paired with men with
whom they share a relatively low proportion of MHC alleles, are…more attracted to extrapair men,
particularly during the fertile phase of their cycles.” (p. 831)
fertility status moderated this interaction, F(1, 36) = 6.76, prep = .960, η = .40.” (833)
Haselton & Gangestad
(2006)
“Prediction 1 (pair-bonded women): male sexual
attractiveness moderates ovulatory shifts in female extra-
pair desires.” (p. 510)
2 fertility (high vs. low) x male
sexual-versus-investment
attractiveness predicting extra-
pair desire
“As predicted, the effect of Fertility Status was
powerfully moderated by Male Sexual-versus-
Investment Attractiveness, F(1,19) = 9.47, p = 0.004.”
(p. 512)
F(1,19) = 9.47, p = 0.004
Larson, Haselton,
Gildersleeve, &
Pillsworth (2013)
“Therefore, we predicted that women's ratings of partner sexual
desirability would be a key moderator of fertility-contingent changes in relationship feelings, such that women's feelings about their relationship would be more negative at high than low fertility
if they rated their partner as relatively low in sexual
desirability. We expected this pattern for several measures of
relationship quality: relationship closeness (as measured by the IOS), relationship satisfaction,
and ratings of partner faults and virtues.” (p. 131)
Sample 1: 2 fertility (high vs.
low) x partner sexual
attractiveness predicting self-
other overlap with partner (closeness)
“As predicted, the key interaction between fertility
and partner sexual attractiveness was
significant, F(1, 37)=17.04, pdir<.001, partial η2=.32.” (p.
132)
F(1, 37)=17.04, pdir<.001
Sample 2: 2 fertility (high vs.
low) x partner mating desirability
predicting self-other overlap with partner (closeness)
“As in Sample 1, and as predicted, the key interaction between fertility and partner
mating desirability was significant, F(1, 40)=3.73,
pdir= .04, partial η2=.09.” (p. 132)
F(1, 40)=3.73, pdir= .04
Sample 2: 2 fertility (high vs.
low) x partner mating desirability
predicting relationship
“In contrast to Sample 1, in Sample 2 using a measure of satisfaction typically used in the relationships literature, the key interaction between fertility and partner mating
F(1, 40)= 7.76, pdir
=.005a
27

satisfactiondesirability was significant, F(1, 40)= 7.76, pdir =.005, partial η2=.16.” (p. 133)
Sample 2: 2 fertility (high vs.
low) x partner mating desirability
predicting perceptions of partner faults
“…on women's assessments of their partner's faults…the interaction between fertility
and partner mating desirability was significant, F(1, 64)=12.36, pdir<.001, partial η2=.16.” (p. 133)
F(1, 64)=12.36, pdir<.001b
Larson, Pillsworth, & Haselton
(2012)
“The critical test in these studies is whether women’s fertility and her partner’s possession of cues of high-fitness genes interact to
predict women’s in-pair and extra-pair attractions…. The
current study was designed to attempt to replicate and extend
these findings.” (p. 2)
2 fertility (high vs. low) x partner
sexual attractiveness
predicting in-pair sexual attraction
“However, the interaction between fertility and
women’s ratings of partner sexual attractiveness was
significant, F(1, 38) = 6.05, pdir= .01, partial η2= .14.” (p.
5)
F(1, 38) = 6.05, pdir= .01b
“In this study, we included ratings of men’s bodies as well as
their faces, with the prediction that third-party assessments of body and facial attractiveness
would moderate shifts in women’s attractions across the cycle in similar ways.” (p. 2)
2 fertility (high vs. low) x third-party ratings of partner’s
attractiveness predicting extra-
pair sexual attraction
“However, the interaction between fertility and
composite third-party ratings of partner attractiveness was significant, F(1, 34) = 4.16, pdir= .03, partial η2= .11.” (p.
5)
F(1, 34) = 4.16, pdir= .03
Pillsworth & Haselton
(2006)
“Pillsworth et al. (2004) suggested that future research
should explicitly examine male sexual attractiveness to test the
hypothesis that a woman’s pursuit of an extra-pair vs. an in-pair
conceptive strategy is conditional on how sexually attractive her partner is relative to other men.
Consistent with this proposal, in a
2 fertility (high vs. low) x partner
sexual attractiveness
predicting extra-pair desire
“As predicted, the effect of fertility status on extra-pair desires was moderated by
partner’s sexual attractiveness [F(1,38) = 5.54, p =.015, partial r =
-.36; see Fig. 1].” (p. 253)
F(1,38) = 5.54, p =.015
28

daily diary study, Haselton and Gangestad (in press) found that increases in extra-pair desires at high fertility were greatest for
women who rated their partners as low in sexual vs. investment attractiveness…In the current
study, we further examined this hypothesis by seeking to replicate
the finding of Haselton and Gangestad (in press) using a more
rigorous luteinizing hormone (LH) method of fertility
assessment.” (p. 248)Note. Unless otherwise specified, all partner attractiveness ratings were based on women’s evaluations of their partners.
29

4b. References
Gangestad, S. W., Thornhill, R., & Garver-Apgar, C. E. (2010). Men's facial masculinity predictschanges in their female partners' sexual interests across the ovulatory cycle, whereas men's intelligence does not. Evolution and Human Behavior, 31(6), 412-424.
Gangestad, S. W., Thornhill, R., & Garver-Apgar, C. E. (2005). Women's sexual interests acrossthe ovulatory cycle depend on primary partner developmental instability. Proceedings of the Royal Society B: Biological Sciences, 272(1576), 2023-2027.
Garver-Apgar, C. E., Gangestad, S. W., Thornhill, R., Miller, R. D., & Olp, J. J. (2006). Majorhistocompatibility complex alleles, sexual responsivity, and unfaithfulness in romantic couples. Psychological Science, 17(10), 830-835.
Haselton, M. G., & Gangestad, S. W. (2006). Conditional expression of women's desires and men's mate guarding across the ovulatory cycle. Hormones and Behavior, 49(4), 509-518.
Larson, C. M., Haselton, M. G., Gildersleeve, K. A., & Pillsworth, E. G. (2013). Changes inwomen's feelings about their romantic relationships across the ovulatory cycle. Hormones and behavior, 63(1), 128-135.
Larson, C. M., Pillsworth, E. G., & Haselton, M. G. (2012). Ovulatory shifts in women’sattractions to primary partners and other men: Further evidence of the importance of primary partner sexual attractiveness. PLoS one, 7(9), e44456.
Pillsworth, E. G., & Haselton, M. G. (2006). Male sexual attractiveness predicts differential ovulatory shifts in female extra-pair attraction and male mate retention. Evolution and Human Behavior, 27, 247-258.
30
5. P-curve summary tables of test-statistics, df, reported and recalculated p values for effects evaluating Partner Qualities Moderation Prediction
Study df tLess conservative reported p
Less conservative exact p
Bin reported
Bin exact
More conservative reported p
More conservative exact p
Bin for reported p
Bin for exact p
Gangestad et al. (2010) 63 2.12 .031 .0501c 4 .031 .0501c 4
Gangestad et al. (2005) 50 3.95 .001 0.0003b 1 1 .001 0.0003b 1 1
Garver-Apgar et al. (2006) 36 2.60 .0134 .0134 2 2 .0134 .0134 2 2
Haselton & Gangestad (2006) 19 3.08 .004 .0062 1 1 .004 .0062 1 1
Larson et al. (2013)
37 4.13 .001 .0002b 1 1 .001 .0002b 1 1
40 1.93 .04 .061c 5 .04 .061c 5
40 2.79 --a --a --a --a
64 3.52 .001 .0008 1 1 --d --d
Larson et al. (2012)38 2.46 .01 .019 2 2 --d --d
34 2.04 .03 .049 4 5 .03 .049 4 5Pillsworth & Haselton 38 2.35 .015 .024 2 3 .015 .024 2 3
Bin CountsLess conservative reported p
Less conservative exact p
Conservative reported p
Conservative exact p
1 4 4 1 3 32 3 2 2 2 13 0 1 3 0 14 2 0 4 2 05 1 1 5 1 1
Bins: 1 = <.01; 2 = >.01, <.02; 3 = >.02, <.03; 4 = >.03, <.04; 5 = >.04, <.05.
31

Note. When test statistics were reported as F, they were converted to t.a Not included in p curve due to non-independence.b Windsorized pp to .01 for tests of right skew.c Not included in p-curve because exact p > .05.d Not included in “More Conservative” p-curve.
32

6. P-curves
6a. P-curve of reported p values (16 in total) evaluating the Cycle Shift Prediction and Context Moderation Prediction.
Right Skew:χ2(32) = 50.23, p = .02N = 1613
33

6b. P-curve of reported p values (24 in total) evaluating Cycle Shift Prediction, Context Moderation Prediction, and Partner Qualities Moderation Prediction (more conservative)
Right Skew:χ2(48) = 78.40, p = .004N = 2011
34

6c. P-curve of reported p values (26 in total) evaluating Cycle Shift Prediction, Context Moderation Prediction, and Partner Qualities Moderation Prediction (less conservative)
Right Skew:χ2(52) = 89.44,p = < .001N = 2011
35

6d. P-curve of exact p values (23 in total) evaluating Cycle Shift Prediction, Context Moderation Prediction, and Partner Qualities Moderation Prediction (less conservative)
Right Skew:χ2(46) = 90.16,p = .0001N = 1774
36

6e. P-curve of reported p values (12 in total) evaluating Cycle Shift Prediction
6f. P-curve of exact two-tailed p values (13 in total) evaluating Cycle Shift Prediction
Right Skew:χ2(26) = 40.70,p = .03N = 1402
37

6g. P-curve of reported p values (8 in total) evaluating Partner Qualities Moderation Prediction (more conservative)
6h. P-curve of exact two-tailed p values (6 in total) evaluating Partner Qualities Moderation Prediction (more conservative)
38

6i. P-curve of reported p values (10 in total) evaluating Partner Qualities Moderation Prediction (less conservative)
6j. P-curve of exact two-tailed p values (8 in total) evaluating Partner Qualities Moderation Prediction (less conservative)
39

7. Documentation of effect size estimation
7a. R code for determining effect size
#keep significant results t_obs=subset(t,pt(t,df=df)>.975) df_obs=subset(df,pt(df,df=df)>.975) #Define the loss function loss=function(t_obs,df_obs,d_est, AD) { ncp_est=sqrt((df_obs+2)/4)*d_est tc=qt(.975,df_obs) options(warn=-1) #added to turn off warning for non-central;' power_est=1-pt(tc,df_obs,ncp_est) p_larger=pt(t_obs,df=df_obs,ncp=ncp_est) options(warn=0) #warning's back on ppr=(p_larger-(1-power_est))/power_est #winsorize pp-values (we have started doing this for robustness) ppr=pmax(ppr,.01) ppr=pmin(ppr,.99) #add functionality to do KS or AD test if (missing(AD)) { options(warn=-1) loss=ks.test(ppr,punif)$statistic options(warn=0) } else { options(warn=-1) if (AD==1) loss=ad.test(ppr,punif)$statistic if (AD==0) loss=ks.test(ppr,punif)$statistic options(warn=0) } return(loss) } #find global maximum with KS test
40

optimize(loss,c(-4,4),df_obs=df_obs,t_obs=t_obs)$minimum #find d>0 maximum with KS test optimize(loss,c(0,4),df_obs=df_obs,t_obs=t_obs)$minimum #find global maximum with AD test optimize(loss,c(-4,4),df_obs=df_obs,t_obs=t_obs,AD=1)$minimum #find d>0 maximum with AD test optimize(loss,c(0,4),df_obs=df_obs,t_obs=t_obs, AD=1)$minimum #For plotting the loss function for different ds lossKS=c() lossAD=c() di=c() for (i in 1:200) { d=-1+i/100 di=c(di,d) lossKS=c(lossKS,loss(df_obs=df_obs,t_obs=t_obs,d_est=d)) lossAD=c(lossAD,loss(df_obs=df_obs,t_obs=t_obs,d_est=d, AD=1)) } par(mfrow=c(1,2)) plot(di,lossKS,main="KS test",xlab="Effect size", ylab="Loss") plot(di,lossAD,main="AD test",xlab="Effect size", ylab="Loss")
7b. Notes on effect size estimation procedure
Simonsohn et al.’s (2014b) method of effect size estimation involves examining fit of a non-central distribution of p-values based on observed sample sizes and hypothesized Cohen’s d values to the empirical distribution of p-values. Cohen’s d is estimated to be that value that minimizes a fit statistic. Simonsohn et al. propose using Kolmogorov-Smirnov D as the fit statistic. Following Gangestad et al. (under review) we also report the Anderson-Darling test as an alternative to compare them for robustness. Though estimates using the two statistics differed slightly for individual subsets of data, the overall mean estimates across all runs were nearly identical. We report estimates based on K-S D minimization in the text but also provide results and plots for A-D minimization in this supplement.
Ps from Gangestad et al. (2004) were effects from multilevel models, where Level 1 was individual ratings, rather than individual women. Effect sizes are therefore estimated with and without ps from this study. All effect sizes were estimated based on exact two-tailed p-values.
41

7c. Summary table of effect size estimation results
Set of Effects used to Calculate d Number of p-values; Corresponding p-curve
K-S estimation
A-D estimation
Ps evaluating the Cycle Shift and Context Moderation predictions
15; Figure 2 in main text .20 .21
14 (excluding Gangestad et al., 2004)
.14 .17
Ps evaluating the Cycle Shift, Context Moderation, and Partner Qualities Moderation predictions (more conservative)
21; Figure 3 in main text .29 .28
20 (excluding Gangestad et al., 2004)
.29 .27
Ps evaluating the Cycle Shift, Context Moderation, and Partner Qualities Moderation predictions (less conservative)
26; 6c in OSM .32 31
25 (excluding Gangestad et al., 2004)
.32 .31
Ps evaluating Cycle Shift prediction 12; 6e in OSM .29 .25
11 (excluding Gangestad et al., 2004)
.31 .26
Ps evaluating the Partner Qualities Moderation prediction (more conservative)
8; 6g in OSM .57 .58
Ps evaluating the Partner Qualities Moderation prediction (less conservative)
10; 6i in OSM .65 .61
42

8a. P-values included in Figure 2
Study t df Exact two-tailed p Reported pGangestad & Thornhill (1998) 3.27 26 0.003 0.001Gangestad et al. (2004) 3.06 232 0.002 0.002Johnston et al. (2001) 2.2 28 0.036 0.02Jones, Little, et al. (2005), Study 2 2.91 324 0.004 0.004Little et al. (2008) 2.3 145 0.023 0.023Little, Jones, & Burriss (2007), Study 2 2.7 16 0.016 0.016Little, Jones, et al. (2007), Study 2 2.56 201 0.011 0.011Penton-Voak & Perrett (2000) 2.28 137 0.024 0.024Penton-Voak et al. (1999), Study 1 3.08 37 0.004 <0.004Penton-Voak et al. (1999), Study 2 2.32 47 0.025 0.025Provost et al. (2008), Study 1 2.1 19 0.049 0.05Roney, Simmons & Gray (2011) 2.2 17 0.042 0.04Thornhill & Gangestad (1999) 3.23 46 0.002 0.001Thornhill et al. (2003) 2.22 63 0.157 0.019Thornhill, Chapman, & Gangestad (2013) 2.29 46 0.149 0.016
43

8b. P-values included in Figure 3
Study t df Exact two-tailed p Reported pGangestad & Thornhill (1998) 3.27 26 0.003 0.001Gangestad et al. (2004) 3.06 232 0.002 0.002Gangestad et al. (2005) 3.95 50 0.000 <.001Garver-Apgar et al. (2006) 2.6 36 0.013 0.0134Haselton & Gangestad (2006) 3.08 19 0.006 0.004Johnston et al. (2001) 2.2 28 0.036 0.02Jones, Little, et al. (2005) Study 2 2.91 324 0.004 0.004Larson et al. (2012) 2.04 34 0.049 0.03Larson et al. (2013) 4.13 37 0.000 0.011Little et al. (2008) 2.3 145 0.023 0.023Little, Jones, & Burriss (2007), Study 2 2.7 16 0.016 0.016Little, Jones, et al. (2007) Study 2 2.56 201 0.011 0.011Penton-Voak & Perrett (2000) 2.28 137 0.024 0.024Penton-Voak et al. (1999) Study 1 3.08 37 0.004 <0.004Penton-Voak et al. (1999), Study 2 2.32 47 0.025 0.025Pillsworth & Haselton 2.35 38 0.024 0.015Provost et al. (2008), Study 1 2.1 19 0.049 0.05Roney, Simmons & Gray (2011) 2.2 17 0.042 0.04Thornhill & Gangestad (1999) 3.23 46 0.002 0.001Thornhill et al. 2003 2.22 63 0.157 0.019Thornhill, Chapman, & Gangestad (2013) 2.29 46 0.149 0.016
44
Additional References
Borenstein, M., Hedges, L. V., Higgins, J., & Rothstein, H. R. (2010). A basic introduction to
fixed‐effect and random‐effects models for meta‐analysis. Research Synthesis Methods,
1, 97-111. doi:10.1002/jrsm.12
Gangestad, S. W., Grebe, N. M., Gao, Z. (under review). Of ovulatory cycle effects and P
curves: Evidence for real phenomena, not P-hacking.
Gangestad, S. W., & Thornhill, R. (1998). Menstrual cycle variation in women’s preferences for
the scent of symmetrical men. Proceedings of the Royal Society B: Biological Sciences,
265, 927–933. doi:10.1098/rspb.1998.0380
Gildersleeve, K., Haselton, M. G., & Fales, M. R. (2014). Do women’s mate preferences
change across the ovulatory cycle? A meta-analytic review. Psychological Bulletin.
doi: 10.1037/a0035438
Hodges-Simeon, C. R., Gaulin, S. J. C., & Puts, D. A. (2010). Different vocal parameters predict
perceptions of dominance and attractiveness. Human Nature, 21, 406–427.
doi:10.1007/s12110-010-9101-5
Li, N. P., Bailey, J. M., Kenrick, D. T., & Linsenmeier, J. A. (2002). The necessities and luxuries
of mate preferences: testing the tradeoffs. Journal of Personality and Social Psychology,
82, 947-955. doi:10.1037/0022-3514.82.6.947
Li, N. P., Pillsworth, E. G., & Haselton, M. G. (2006). [Cycle shifts in women’s mate
preferences assessed using a mate dollars paradigm]. Unpublished raw data.
Peters, M., Rhodes, G., & Simmons, L. W. (2008). Does attractiveness in men provide clues to
semen quality? Journal of Evolutionary Biology, 21, 572–579. doi:10.1111/j.1420-
9101.2007.01477.x
45

Peters, M., Simmons, L. W., & Rhodes, G. (2009). Preferences across the menstrual cycle for
masculinity and symmetry in photographs of male faces and bodies. PLoS ONE, 4,
e4138. doi:10.1371/journal.pone.0004138
Putz, D. A. (2004). Female choice, male dominance, and the evolution of low voice pitch in men.
(Doctoral dissertation). Retrieved from ProQuest Dissertations & Theses. (AAT
3139711)
Rice, W. R., & Gaines, S. D. (1994). ‘Heads I win, tails you lose’: testing directional alternative
hypotheses in ecological and evolutionary research. Trends in Ecology & Evolution, 9,
235-237. doi:10.1016/0169-5347(94)90258-5
Rikowski, A., & Grammer, K. (1999). Human body odour, symmetry, and attractiveness.
Proceedings of the Royal Society B: Biological Sciences, 266, 869–874.
doi:10.1098/rspb.1999.0717
Simonsohn U., Nelson, L. D., & Simmons, J. P. (2014b). P-curve and effect size: Correcting for
publication bias using only significant results. Available at SSRN:
http://ssrn.com/abstract=2377290 or doi:10.2139/ssrn.2377290
Simonsohn U., Simmons, J. P, & Nelson, L. D. (2014a). P-curve: A key to the file drawer.
Journal of Experimental Psychology: General. doi:10.1037/a0033242
Soler, C., Núñez, M. Gutiérrez, R., Núñez, J., Medina, P. Sancho, M., & Núñez, A. (2003).
Facial attractiveness in men provides clues to semen quality. Evolution and Human
Behavior, 24, 199–207. doi:10.1016/S1090-5138(03)00013-8
Thornhill, R., & Gangestad, S. W. (1999). The scent of symmetry: A human sex pheromone
that signals fitness? Evolution and Human Behavior, 20, 175–201. doi:10.1016/S1090-
5138(99)00005-7
46

Thornhill, R., Gangestad, S. W., Miller, R., Scheyd, G., McCollough, J. K., & Franklin, M.
(2003). Major histocompatibility complex genes, symmetry, and body scent
attractiveness in men and women. Behavioral Ecology, 14, 668–678.
doi:10.1093/beheco/arg043
Wood, W. & Carden, L. (2014). Elusiveness of menstrual cycle effects on mate preferences:
Comment on Gildersleeve, Haselton, and Fales (2014). Psychological Bulletin.
Wood, W., Kressel, L., Joshi, P. D., & Louie, B. (2014). Meta-analysis of menstrual cycle
effects on women’s mate preferences. Emotion Review. doi:10.1177/1754073914523073
47


![Scrub Jays (Aphelocoma coerulescens) Form Integrated … · 2017-10-21 · Journal of Experimental Psychology: Animal Behavior Processes [PsycARTICLES]; January 2001; 27, 1; PsycARTICLES](https://static.fdocuments.in/doc/165x107/5f02d48a7e708231d406390b/scrub-jays-aphelocoma-coerulescens-form-integrated-2017-10-21-journal-of-experimental.jpg)