Supervisory Control for Resilient Chiller Plants Under ...
19
Received June 13, 2017, accepted July 5, 2017, date of publication July 13, 2017, date of current version August 8, 2017. Digital Object Identifier 10.1109/ACCESS.2017.2726017 Supervisory Control for Resilient Chiller Plants Under Condenser Fouling KHUSHBOO MITTAL 1 , JAMES P. WILSON 1 , BRIAN P. BAILLIE 2 , SHALABH GUPTA 1 , (Member, IEEE), GEORGE M. BOLLAS 2 , AND PETER B. LUH 1 , (Life Fellow, IEEE) 1 Department of Electrical and Computer Engineering, University of Connecticut, Storrs, CT 06269, USA 2 Department of Chemical and Biomolecular Engineering, University of Connecticut, Storrs, CT 06269, USA Corresponding author: Shalabh Gupta ([email protected]) This work was supported by the UTC Institute for Advanced Systems Engineering, University of Connecticut. Any opinions expressed herein are those of the authors and do not represent those of the sponsor. ABSTRACT This paper presents a supervisory control strategy for resilient chiller plants in the presence of condenser fouling. Fouling results in off-nominal performance of chiller parameters, such as increased refrigerant mass flow rate, compressor motor speed, discharge pressure, and discharge temperature. These effects further lead to faster deterioration of condenser pipes and tubes, and increase the risk of early motor failures. Thus, the main objective of this paper is to provide resilience, i.e., to bring the system parameters back to normalcy, and thereby protect the system from the adverse effects of fouling and improve its life expectancy while ensuring energy efficiency and meeting the desired cooling load. The supervisory control strategy presented here incorporates fault detection and diagnosis (FDD) and resilient control for mitigating the effects of condenser fouling. A computationally efficient and robust FDD scheme enables the estimation of the condenser fouling level using optimal sensor selection and statistical classifiers, thus facilitating condition-based maintenance. On the other hand, the resilient control scheme enables redistribution of load between chillers in order to reduce the load on faulty equipment in an energy-efficient manner, while still providing the required overall cooling load. The performance of this method is tested and validated using a high-fidelity chiller plant model and the proposed strategy is shown to diagnose condenser fouling with a high accuracy and effectively mitigate the effects of fouling at low computational cost. It is shown that the supervisory controller is able to meet the desired building load requirements at lower energy consumption, as compared with no supervisory control. INDEX TERMS Resilient control, fouling diagnosis, sensor selection, chiller plants. I. INTRODUCTION Chiller plants are responsible for providing thermal comfort and acceptable air quality in buildings and account for a sig- nificant portion of world’s energy consumption [1], [2]. Fig 1 shows a schematic diagram of a chiller plant. A typical chiller plant is a large, complex, and interconnected system that consists of multiple chillers, cooling towers, water pumps, and their associated components (e.g, a chiller consists of a condenser, an evaporator, and a compressor, etc). Chiller plants provide cooling to the buildings by means of efficient vapor-compression refrigeration cycles. Furthermore, chiller plants operate under time-varying cooling loads in response to different weather conditions. Thus, the complexity of a chiller plant makes it susceptible to the growth of faults in its components, such as condenser and evaporator foul- ing, compressor motor faults, refrigerant charge degradation, sensor faults, etc. These faults gradually evolve over time and lead to equipment degradation and inefficient plant operation resulting in increased energy costs. Moreover, operating with degraded equipment results in decreased component lifetime, thus increasing the equipment maintenance and replacement costs. In severe cases, the inability of the degraded compo- nent to meet its performance causes occupant discomfort in buildings. A. MOTIVATION This paper focuses on condenser fouling since it is one of the most common faults in chiller plants [3]–[5]. Condenser fouling is caused by accumulation of foreign sub- stances on the inner surface of the condenser, which decreases the effective heat transfer area and increases the thermal resistance. This diminishes the efficiency of heat transfer 14028 2169-3536 2017 IEEE. Translations and content mining are permitted for academic research only. Personal use is also permitted, but republication/redistribution requires IEEE permission. See http://www.ieee.org/publications_standards/publications/rights/index.html for more information. VOLUME 5, 2017
Transcript of Supervisory Control for Resilient Chiller Plants Under ...
Received June 13, 2017, accepted July 5, 2017, date of publication July 13, 2017, date of current version August 8, 2017.
Digital Object Identifier 10.1109/ACCESS.2017.2726017
Supervisory Control for Resilient ChillerPlants Under Condenser FoulingKHUSHBOO MITTAL1, JAMES P. WILSON1, BRIAN P. BAILLIE2,SHALABH GUPTA1, (Member, IEEE), GEORGE M. BOLLAS2,AND PETER B. LUH1, (Life Fellow, IEEE)1Department of Electrical and Computer Engineering, University of Connecticut, Storrs, CT 06269, USA2Department of Chemical and Biomolecular Engineering, University of Connecticut, Storrs, CT 06269, USA
Corresponding author: Shalabh Gupta ([email protected])
This work was supported by the UTC Institute for Advanced Systems Engineering, University of Connecticut. Any opinions expressedherein are those of the authors and do not represent those of the sponsor.
ABSTRACT This paper presents a supervisory control strategy for resilient chiller plants in the presenceof condenser fouling. Fouling results in off-nominal performance of chiller parameters, such as increasedrefrigerant mass flow rate, compressor motor speed, discharge pressure, and discharge temperature. Theseeffects further lead to faster deterioration of condenser pipes and tubes, and increase the risk of early motorfailures. Thus, the main objective of this paper is to provide resilience, i.e., to bring the system parametersback to normalcy, and thereby protect the system from the adverse effects of fouling and improve its lifeexpectancy while ensuring energy efficiency and meeting the desired cooling load. The supervisory controlstrategy presented here incorporates fault detection and diagnosis (FDD) and resilient control for mitigatingthe effects of condenser fouling. A computationally efficient and robust FDD scheme enables the estimationof the condenser fouling level using optimal sensor selection and statistical classifiers, thus facilitatingcondition-based maintenance. On the other hand, the resilient control scheme enables redistribution of loadbetween chillers in order to reduce the load on faulty equipment in an energy-efficient manner, while stillproviding the required overall cooling load. The performance of this method is tested and validated using ahigh-fidelity chiller plant model and the proposed strategy is shown to diagnose condenser fouling with ahigh accuracy and effectively mitigate the effects of fouling at low computational cost. It is shown that thesupervisory controller is able to meet the desired building load requirements at lower energy consumption,as compared with no supervisory control.
INDEX TERMS Resilient control, fouling diagnosis, sensor selection, chiller plants.
I. INTRODUCTIONChiller plants are responsible for providing thermal comfortand acceptable air quality in buildings and account for a sig-nificant portion of world’s energy consumption [1], [2]. Fig 1shows a schematic diagram of a chiller plant. A typical chillerplant is a large, complex, and interconnected system thatconsists of multiple chillers, cooling towers, water pumps,and their associated components (e.g, a chiller consists ofa condenser, an evaporator, and a compressor, etc). Chillerplants provide cooling to the buildings by means of efficientvapor-compression refrigeration cycles. Furthermore, chillerplants operate under time-varying cooling loads in responseto different weather conditions. Thus, the complexity of achiller plant makes it susceptible to the growth of faultsin its components, such as condenser and evaporator foul-ing, compressor motor faults, refrigerant charge degradation,
sensor faults, etc. These faults gradually evolve over time andlead to equipment degradation and inefficient plant operationresulting in increased energy costs. Moreover, operating withdegraded equipment results in decreased component lifetime,thus increasing the equipment maintenance and replacementcosts. In severe cases, the inability of the degraded compo-nent to meet its performance causes occupant discomfort inbuildings.
A. MOTIVATIONThis paper focuses on condenser fouling since it is oneof the most common faults in chiller plants [3]–[5].Condenser fouling is caused by accumulation of foreign sub-stances on the inner surface of the condenser, which decreasesthe effective heat transfer area and increases the thermalresistance. This diminishes the efficiency of heat transfer
140282169-3536 2017 IEEE. Translations and content mining are permitted for academic research only.
Personal use is also permitted, but republication/redistribution requires IEEE permission.See http://www.ieee.org/publications_standards/publications/rights/index.html for more information.
VOLUME 5, 2017

K. Mittal et al.: Supervisory Control for Resilient Chiller Plants Under Condenser Fouling
FIGURE 1. Schematic of an interconnected chiller plant.
TABLE 1. Effects of fouling on a chiller system.
between the two fluids of the condenser leading to chillerinefficiency.
In order to compensate for this deficiency and to meetthe required cooling load, the chiller controller increases therefrigerant pressure and mass flow rate through the condenserby raising the compressor speed. This leads to higher powerconsumption, reduced energy efficiency, and increased wearof the chiller components (e.g., pipes, tubes, motors, etc.).While high refrigerant mass flow rate and high pressurelead to faster deterioration of condenser pipes and tubes,a higher compressor speed increases the risk of early com-pressor motor failures. In effect, the entire system operatesas a stressed congested system trying to meet the demand.Table 1 summarizes the several adverse effects of fouling onchiller health and performance [6]–[8]. Under severe foulingconditions, the degraded chiller might not even be able tomeet its demanded cooling load despite overdriving the com-pressor, resulting in thermal discomfort to building occupants
and significantly reducing the long-term reliability of chillercomponents.
Therefore, this paper develops a supervisory control strat-egywhosemain objective is to provide resilience to the chillerplants by load reconfiguration i.e., redistributing the load ofthe faulty chiller between the healthy chillers. It brings thesystem parameters back to normalcy and results in mitigationof the effects of condenser fouling, while maintaining energyefficiency and meeting the desired cooling load performance.The major challenges faced by the the proposed supervisorycontrol framework are summarized in Fig. 2.
FIGURE 2. Challenges and the proposed solution approaches.
Remark: The objectives of a resilient controller [9]–[12]are far beyond a fault-tolerant controller. A fault-tolerantcontroller strives tomeet the desired performance of an outputvariable in the presence of faults. In this process, it can pos-sibly drive the system more rigorously thus causing furtherdamage to the already faulty system. On the other hand,a resilient controller strives to bring all the system parametersback to normalcy to improve system reliability, thus miti-gating the effects of faults and preventing further damage.This however could be done with a graceful degradation ofperformance if necessary.
B. LITERATURE REVIEWMany researchers have developed optimization-based super-visory control strategies with the main focus on improvingthe energy-efficiency of chiller plants [13]–[18], howeverthese approaches did not consider faulty operating conditions.On the other hand, some researchers have shown interest indeveloping fault-tolerant control methodologies for variableair volume (VAV) air conditioning systems. For example,Wang and Chen [19] developed an energy efficient fault-tolerant controller that addresses the air flow rate sensormeasurement faults using neural networks to estimate mea-surement errors. Jin and Du [20] designed a fault tolerant
VOLUME 5, 2017 14029

K. Mittal et al.: Supervisory Control for Resilient Chiller Plants Under Condenser Fouling
TABLE 2. Literature review of the existing research for fault tolerant control of condenser fouling.
controller for controlling outdoor air and AHU supply airtemperature of VAV systems in case of sensor bias faults.The proposed method uses PCA and joint angle methodfor detection and isolation of fault and compensatory recon-struction for fault reconstruction. Ji et al. [21] developed aprognostics-enabled resilient controller for building climatecontrol systems in order to maintain an accepted level of ther-mal comfort in the presence of component failures. Specifi-cally, for condenser fouling, Table 2 discusses the existingwork in the area of fault-tolerant control to accommodate thisfault and also the current research gaps.
One major limitation of the aforementioned approaches isthat they used simplified chiller plant models to determine theoptimal set points for the plant. The use of simplified modelslimits the availability of critical variables, such as the com-pressor speed, thus making it difficult to directly study thesystem-wide impact of faults. In addition, the fault tolerantcontrollers are primarily focused on meeting the performanceand energy requirements; however they did not touch uponthe essence of resilience, i.e., to bring the system back tonormalcy, in presence of faults. In particular, there has notbeen significant research on supervisory control to mitigatethe effects of condenser fouling, while meeting the neces-sary trade-offs between energy-efficiency and resilience. Thispaper addresses this gap by developing a supervisory controlstrategy, that enables a resilient controller in presence ofcondenser fouling, thereby redistributing the load betweenchillers to protect the faulty chiller from the damaging effectsof fouling, while at the same time minimizing the powerconsumption and meeting the overall cooling load demand.The proposed strategy is validated on a physics-based high-fidelity chiller plant model that utilizes the real cooling loadand historical weather data with uncertainties as inputs andincludes the necessary performance and control variables.
In order for the supervisory controller to be effective,a robust fault detection and diagnosis (FDD) approach isnecessary to maintain state awareness of the system and toaccurately determine the fault severity. Early detection ofcondenser fouling is challenging since it is a soft fault thatdevelops slowly over time and often goes unnoticed, causinggradual degradation in the performance of the chiller [4].There are several existing methods in literature for detectingHVAC system faults and an elaborate review of these meth-ods is presented in [25]–[27]. In general, FDD approachesconsist primarily of (1) model-based, (2) knowledge-basedand (3) data-driven methods. Existing FDD approaches
for common HVAC faults including condenser foulingcomprise rule-based methods [28], estimation of residueand thresholding methods [29]–[31], and more sophisticatedmachine learning based methods, such as principal compo-nent analysis (PCA) [32], wavelet transforms [33] and neuralnetworks [34].
Most of the existing FDD approaches rely on humanexpertise to select the sensors for decision making. However,different sensors have different sensitivities towardsfaults under time-varying operating conditions. Therefore,the selected sensors are not guaranteed to provide the bestFDD performance and classification accuracy. This paperalso addresses this shortcoming by performing optimal sensorselection to pick the smallest sensor set that gives the highestclassification accuracy. Additionally, instead of binary clas-sification of fouling, the proposed FDD strategy classifies itinto multiple categories to provide a better estimate of theseverity.
C. CONTRIBUTIONSThe main contributions of the proposed supervisory controlframework are summarized as follows:
• Development of a supervisory control strategy thatenables a resilient controller for the faulty chiller,to bring its parameters back to normalcy, while mini-mizing power consumption and providing the desiredcooling load.
• Identification of the smallest optimal sensor set for foul-ing detection and diagnosis in order to reduce the com-putational complexity of the classifier while maintaininghigh classification accuracy and low false alarm rate.
• Validation on a high fidelity chiller plant model thattakes real building cooling load and weather data withuncertainties as inputs for simulation of faults and datageneration.
The rest of the paper is organized as follows. Section IIformulates the supervisory control problem for chiller con-denser fouling. Section III presents the details of the chillerplant simulation model and describes the effects of condenserfouling. Section IV presents the solution methodology thatdiagnoses and mitigates the effects of condenser foulingin a robust and energy-efficient manner. Section V showsthe results achieved by the proposed methodology. Finally,section VI concludes the paper with recommendations forfuture work.
14030 VOLUME 5, 2017
K. Mittal et al.: Supervisory Control for Resilient Chiller Plants Under Condenser Fouling
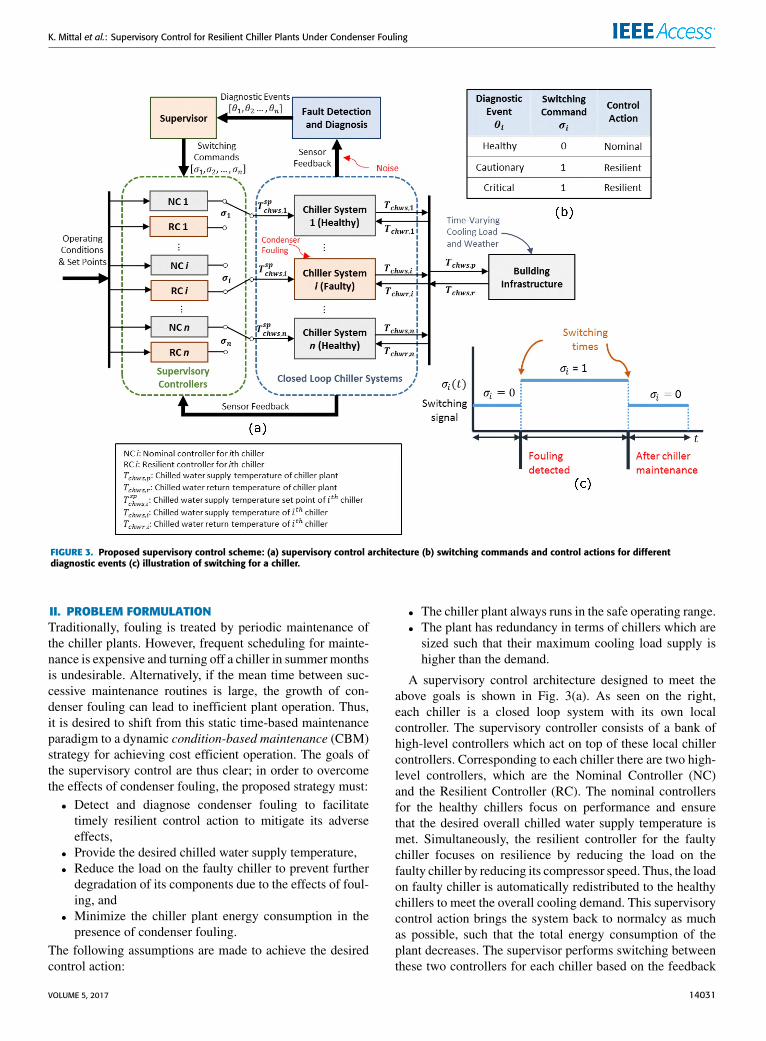
FIGURE 3. Proposed supervisory control scheme: (a) supervisory control architecture (b) switching commands and control actions for differentdiagnostic events (c) illustration of switching for a chiller.
II. PROBLEM FORMULATIONTraditionally, fouling is treated by periodic maintenance ofthe chiller plants. However, frequent scheduling for mainte-nance is expensive and turning off a chiller in summer monthsis undesirable. Alternatively, if the mean time between suc-cessive maintenance routines is large, the growth of con-denser fouling can lead to inefficient plant operation. Thus,it is desired to shift from this static time-based maintenanceparadigm to a dynamic condition-based maintenance (CBM)strategy for achieving cost efficient operation. The goals ofthe supervisory control are thus clear; in order to overcomethe effects of condenser fouling, the proposed strategy must:• Detect and diagnose condenser fouling to facilitatetimely resilient control action to mitigate its adverseeffects,
• Provide the desired chilled water supply temperature,• Reduce the load on the faulty chiller to prevent furtherdegradation of its components due to the effects of foul-ing, and
• Minimize the chiller plant energy consumption in thepresence of condenser fouling.
The following assumptions are made to achieve the desiredcontrol action:
• The chiller plant always runs in the safe operating range.• The plant has redundancy in terms of chillers which aresized such that their maximum cooling load supply ishigher than the demand.
A supervisory control architecture designed to meet theabove goals is shown in Fig. 3(a). As seen on the right,each chiller is a closed loop system with its own localcontroller. The supervisory controller consists of a bank ofhigh-level controllers which act on top of these local chillercontrollers. Corresponding to each chiller there are two high-level controllers, which are the Nominal Controller (NC)and the Resilient Controller (RC). The nominal controllersfor the healthy chillers focus on performance and ensurethat the desired overall chilled water supply temperature ismet. Simultaneously, the resilient controller for the faultychiller focuses on resilience by reducing the load on thefaulty chiller by reducing its compressor speed. Thus, the loadon faulty chiller is automatically redistributed to the healthychillers to meet the overall cooling demand. This supervisorycontrol action brings the system back to normalcy as muchas possible, such that the total energy consumption of theplant decreases. The supervisor performs switching betweenthese two controllers for each chiller based on the feedback
VOLUME 5, 2017 14031

K. Mittal et al.: Supervisory Control for Resilient Chiller Plants Under Condenser Fouling
on fault classification from FDD. Thus the supervisor has themapping σ = S(θ), where θ = {θ1, θ2, . . . θn} and σ ={σ1, σ2, . . . σn} are the vectors that correspond to the diag-nostic events and the switching commands for all n chillers,respectively. Here, each θi ∈ θ carries a decision from thediagnostic decision set {Healthy, Cautionary, Critical}. Also,each σi ∈ σ carries a command from the command set {0, 1},where 0 corresponds to NC and 1 corresponds to RC. Themapping is based on a simple logic as shown in the tablein Fig. 3(b). Fig. 3(c) illustrates the switching command ofthe supervisor for the ith chiller based on the FDD feedback.When fouling is detected, the chiller control is switched toRC and after a maintenance action, the supervisor switchesit back to NC. The switching can happen at most once inevery 12 hour interval after the arrival of diagnostic decision.Details are in Section IV-B.
The FDD methodology classifies fouling into one of thethree classes with different fouling severities defined as:
• Healthy (H): Fouling severity < 20%• Cautionary (Ca): 20% ≤ Fouling severity < 60%• Critical (Cr): Fouling severity ≥ 60%.
The critical class, as the name suggests, refers to instancesof very high fouling, which results in serious performancedegradation and large energy losses. The cautionary classrefers to a more frequent minor blockage which often goesunnoticed because the local controllers overdrive the chillersto meet the cooling load demand. In general, the number ofclasses can be set according to the user requirement. In thiswork, three classes are chosen as they are able to capture thedifferent fouling severities successfully and the control gainsdo not vary significantly between the two faulty classes. Thechillers in cautionary and critical conditions need a resilientcontrol action as although the cooling load demand might bemet in these cases, but the system parameters still performoff-nominally. Aside from minimizing the false alarm andmissed detection rates, the FDD approach must:
• Be robust to uncertainties,• Account for time-varying operating conditions,• Utilize a minimal amount of sensor data, and• Perform on low-cost computational platforms.
These requirements are met by using simple but efficientmachine learning approaches including a combination ofoptimal sensor selection techniques, and computationallyefficient statistical classifiers. Lastly, a high-fidelity chillerplant model is used for this study as the platform for vali-dating the supervisory control methodology. This simulationmodel has three centrifugal chillers and takes in real data asits inputs, namely, the time-varying building cooling load, andthe weather data, as described in the next section.
III. HIGH FIDELITY CHILLER PLANT MODELSimulation models of chillers and other HVAC system com-ponents have long been used as tools for making informedplant design decisions and for the development of optimalcontrol strategies [35]–[37]. The models most commonly
used in these efforts are highly abstracted and representchiller performance through relatively simple empirical cor-relations [38]–[40]. The level of abstraction of these modelsis such that the entire refrigerant side of chiller, including thecompressor, is fully abstracted and replaced with simplifiedperformance curves. These models are useful for describingsystem behavior at nominal conditions but lack the fidelitynecessary for the representation of faults or other systemstates beyond nominal operation and for the assessment ofoperating conditions within the chillers. Therefore, the devel-opment of a resilient supervisory controller requires a moredetailed model.
The models used in this work are developed inModelica [41] using component models from the ModelonThermalPower, VaporCycle, and ThermoFluid commerciallibraries as well as the Modelica Buildings Library andthe ThermoCycle open source library [42]–[44]. The chillerplant model integrates submodels representing each of themajor components of the chiller plant. Models for the pumps,pipes, cooling towers, and building-side heat exchangers areincluded. A number of assumptions are made regarding theoperation of the plant. Water flow rates for both the chilledand cooling water loops are kept constant and all componentsof the plant are always active rather than staging tomatch loadconditions.
FIGURE 4. Modelon-library based centrifugal chiller model.
The centrifugal chiller model used here includes compo-nent models representing the compressor, condenser, expan-sion device, and evaporator of a typical vapor-compressionchiller, as shown in Fig. 4. The condenser and evaporatorare counter-flow heat exchangers with a finite-volume for-mulation. This formulation divides the heat exchanger intoa number of subunits along its length and considers tem-peratures, heat transfer rates, and fluid properties separatelyfor each subunit. The compressor and expansion devices arerepresented by static models, with compressor performancedefined by a centrifugal compressor characteristic map andvalve behavior defined by a direct linear relationship between
14032 VOLUME 5, 2017

K. Mittal et al.: Supervisory Control for Resilient Chiller Plants Under Condenser Fouling
mass flow, pressure drop, and opening position. A two-phasefluid media model for R134a refrigerant from the Modelonlibrary [45] is used to determine fluid properties within thechiller subcomponents. These detailed component and fluidpropertymodels provide additional information and insight asto the conditions within the chiller over the range of operationas compared to the simplified empirical models frequentlyused in other work.
The control scheme in the chiller model uses a pair ofdecoupled PI controllers. The opening position of the expan-sion valve is manipulated to maintain refrigerant superheatat the compressor inlet, and the operating speed of the com-pressor is manipulated to maintain the chilled water supplytemperature set point. These controllers cannot be modifiedby the supervisory controller, however their setpoints couldbe adjusted.
System performance at nominal or faulty conditions canbe predicted over a wide range of operating states throughdynamic simulation. Historical weather [46] and correspond-ing cooling load data from the University of ConnecticutCentral Utilities Plant (UConn CUP) are used as inputs tothe model for simulation of a large set of realistic conditions.The chiller plant model was validated through comparison ofthe simulation results to those of existing validated modelsand to additional operating data from the UConn CUP. Thesecomparison results are summarized in the Appendix, thusvalidating that the outputs generated by the simulated modelclosely follow the trend of the real plant outputs. Furtherdetails on the model, plant data, and the simulations executedfor verification of model accuracy and significance are pre-sented in [47].
A. MODELING CONDENSER FOULINGFor each pair of finite volumes considered in the con-denser, the flow of energy from the refrigerant to the cool-ing water is defined by the simple heat transfer equation asfollows:
dQdt= UA1T (1)
where the rate of heat transferred over time is the productof the temperature difference between the two fluids (1T ),the contact surface area (A), and the overall heat transfercoefficient (U ). The primary observed effect of condenserfouling is a reduction in the rate of heat transfer. Water-sidefouling of the condenser is injected in the model by addinga fouling coefficient to the right hand side of Eq. 1 equal toone minus the percentage of fouling, representing a decreasein heat transfer coefficient and effective area of the waterpipes, thus changing the combined UA value to reduce heattransfer effectiveness in a manner equivalent to that used inZhao et al. [48]. This increased heat transfer resistance createsa need for either higher temperature or mass flow rate onrefrigerant side in order to provide the same cooling. Thisrequires the controller to run the compressor at a higher speed,thus drawing more power and accelerating wear and tear.
TABLE 3. Typical sensors available in a chiller plant.
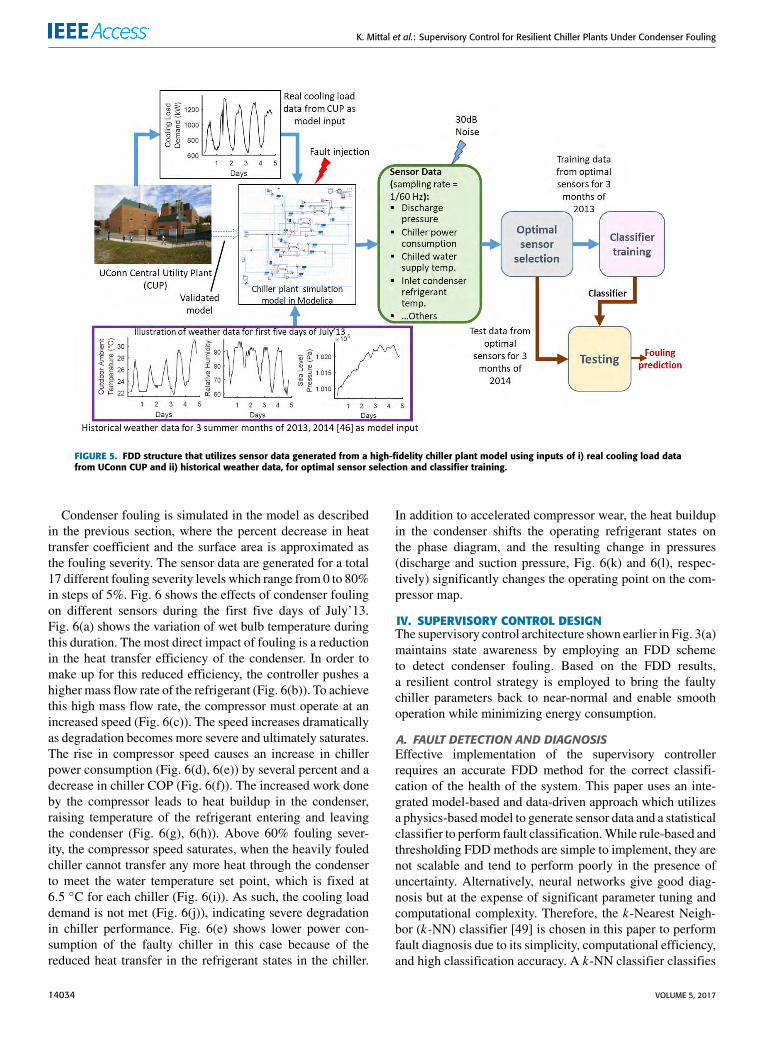
B. FAULT DATA GENERATION USING REAL COOLING LOADAND HISTORICAL WEATHER DATA AS MODEL INPUTSThe high fidelity chiller plant model described above is usedfor generating data for classifier training for fault diagno-sis. In order to simulate realistic and uncertain plant oper-ating conditions, cooling load data for the months of June,July and August from the years 2013 and 2014 were takenfrom UConn CUP and given as inputs to the plant model.Historical weather data [46] including ambient temperature,relative humidity, and sea level pressure for the same dayswere also used as model inputs to calculate the wet-bulbtemperature [43]. The variations in these input parametersfor the first five days of July 2013 are shown in Fig. 5.Furthermore, in order to account for sensor uncertainties,30 dB of additive white Gaussian noise (AWGN) is addedto the sensor data as suggested by our industry partner.
Sensor data are collected by simulating the model underthese operating conditions at a sampling rate of 1
60 Hz whichis in accordancewith the limitations discussedwith our indus-try partner. Table 3 lists the most important sensors availablein the plant. For brevity, the variables derived from measuredvalues are also referred to as ‘sensors’, such as the chillercoefficient of performance (COP). COP is used to report theefficiency of refrigerant based systems. It is the ratio of theamount of cooling supplied by the evaporator compared tothe energy consumed by the compressor.
VOLUME 5, 2017 14033
K. Mittal et al.: Supervisory Control for Resilient Chiller Plants Under Condenser Fouling
FIGURE 5. FDD structure that utilizes sensor data generated from a high-fidelity chiller plant model using inputs of i) real cooling load datafrom UConn CUP and ii) historical weather data, for optimal sensor selection and classifier training.
Condenser fouling is simulated in the model as describedin the previous section, where the percent decrease in heattransfer coefficient and the surface area is approximated asthe fouling severity. The sensor data are generated for a total17 different fouling severity levels which range from 0 to 80%in steps of 5%. Fig. 6 shows the effects of condenser foulingon different sensors during the first five days of July’13.Fig. 6(a) shows the variation of wet bulb temperature duringthis duration. The most direct impact of fouling is a reductionin the heat transfer efficiency of the condenser. In order tomake up for this reduced efficiency, the controller pushes ahigher mass flow rate of the refrigerant (Fig. 6(b)). To achievethis high mass flow rate, the compressor must operate at anincreased speed (Fig. 6(c)). The speed increases dramaticallyas degradation becomes more severe and ultimately saturates.The rise in compressor speed causes an increase in chillerpower consumption (Fig. 6(d), 6(e)) by several percent and adecrease in chiller COP (Fig. 6(f)). The increased work doneby the compressor leads to heat buildup in the condenser,raising temperature of the refrigerant entering and leavingthe condenser (Fig. 6(g), 6(h)). Above 60% fouling sever-ity, the compressor speed saturates, when the heavily fouledchiller cannot transfer any more heat through the condenserto meet the water temperature set point, which is fixed at6.5 ◦C for each chiller (Fig. 6(i)). As such, the cooling loaddemand is not met (Fig. 6(j)), indicating severe degradationin chiller performance. Fig. 6(e) shows lower power con-sumption of the faulty chiller in this case because of thereduced heat transfer in the refrigerant states in the chiller.
In addition to accelerated compressor wear, the heat buildupin the condenser shifts the operating refrigerant states onthe phase diagram, and the resulting change in pressures(discharge and suction pressure, Fig. 6(k) and 6(l), respec-tively) significantly changes the operating point on the com-pressor map.
IV. SUPERVISORY CONTROL DESIGNThe supervisory control architecture shown earlier in Fig. 3(a)maintains state awareness by employing an FDD schemeto detect condenser fouling. Based on the FDD results,a resilient control strategy is employed to bring the faultychiller parameters back to near-normal and enable smoothoperation while minimizing energy consumption.
A. FAULT DETECTION AND DIAGNOSISEffective implementation of the supervisory controllerrequires an accurate FDD method for the correct classifi-cation of the health of the system. This paper uses an inte-grated model-based and data-driven approach which utilizesa physics-basedmodel to generate sensor data and a statisticalclassifier to perform fault classification.While rule-based andthresholding FDDmethods are simple to implement, they arenot scalable and tend to perform poorly in the presence ofuncertainty. Alternatively, neural networks give good diag-nosis but at the expense of significant parameter tuning andcomputational complexity. Therefore, the k-Nearest Neigh-bor (k-NN) classifier [49] is chosen in this paper to performfault diagnosis due to its simplicity, computational efficiency,and high classification accuracy. A k-NN classifier classifies
14034 VOLUME 5, 2017

K. Mittal et al.: Supervisory Control for Resilient Chiller Plants Under Condenser Fouling
FIGURE 6. Effects of condenser fouling on different sensors (including physically available sensors and the derived ones). Sensor data is shownfor the first five days of July 2013.
test data based on the majority vote of its neighbors byassigning the test data to the most common class label amongits k nearest neighbors. The training phase of k-NN classifierincludes storing all the training data points and their corre-sponding class labels. The testing phase involves computingthe distance between the test data and all the training points todetermine the nearest neighbors of the test data and assigningit to the majority class label of the computed neighbors.
Fig. 5 shows the overall FDD architecture. The diagnosisprocess is comprised of two different phases: (a) trainingof the classifier for accurate classification of fouling and(b) testing of the trained classifier for performance evaluation.
1) TRAININGAs shown in Fig. 5, the training phase consists of modelsimulations for data generation, data pre-processing for noise
removal, selection of optimal sensors and developing a classi-fication model using the optimal sensors. A detailed descrip-tion of these steps is presented below.
Sensor data for the months of June, July and August’13are generated for different fouling severities using the pro-cess described in Section III-B. The noisy sensor data ispre-processed by first partitioning the data into blocks oflength 720, where each block corresponds to a time dura-tion of 12 hours based on a sampling rate of 1
60Hz. Thedata blocks are de-noised by passing through a standardwavelet-based filter [50], [51] and rejecting the end pointsof the de-noised block by keeping only the mid regionof 360 points. The proposed classifier provides a deci-sion for each data point of the de-noised block and themajority vote over all these points is taken as the blockdecision.
VOLUME 5, 2017 14035

K. Mittal et al.: Supervisory Control for Resilient Chiller Plants Under Condenser Fouling
a: SENSOR SELECTIONThe filtered data as described above is generated for thedifferent sensors shown in Table 3. To get the best classifica-tion accuracy with reduced complexity, optimal sensor selec-tion is important. Several methods exist in the literature forperforming optimal sensors selection. Kohavi and John [52]proposed the wrapper method, which is a performance basedincremental sensor selection technique, that iteratively addsthe sensor that gives the best classification performance tothe optimal sensor set. The performance metric used in thewrapper method is the correct classification rate (CCR) ofthe classifier. It is a classifier-based sensor selection approachthat becomes computationally expensive if the number ofavailable sensors is large (of the order of 100 sensors).For sensor data sets with a large number of sensors, fil-ter methods (e.g., maximum Relevance Minimum Redun-dancy (mRMR) [53]) can be used. These approaches firstfilter the sensor data set to get a smaller sensor subset byusing the mutual information between the sensors and thetarget classes. The wrapper technique is then applied onthis filtered sensor subset to get the final optimal sensordata set. Applying a filter method along with the wrappercauses significant reduction in computational complexity forlarge data sets as only a small subset of sensors is usedwith the wrapper selection method. In this work, becausethe number of sensors is small, the wrapper technique isdirectly applied to the sensor data set to get the optimalsensors.
The steps involved are listed below:
• Initially, set the optimal sensor set as empty, S∗ = ∅, andthe available sensor set as S. Sensor data for the monthsJune-Aug’13 is given as input.
• While the total number of optimal sensors is less thanN (N = 4 here):i) Get a reduced sensor set S = S − S∗.ii) Evaluate the performance of each sensor subset
obtained by adding one sensor at a time from S to S∗.The feature space of the k-NN classifier consistsof the obtained sensor subset along with the wetbulb temperature (Twb). This is done because eventhough the sensors have high sensitivity towards foul-ing severity, they do not have information about theoperating conditions. As can be seen in Fig. 6(b),the change in compressor speed for different foul-ing levels is relative with respect to the magnitudeof speed, which is governed by the operating con-ditions. Thus, in order to add information about theoperating conditions, Twb is appended to the featurespace comprising the sensor subset. The performanceof each feature space is evaluated by using 10-foldcross validation [54] with the k-NN classifier. Var-ious performance metrics like correct classificationrate (CCR) and false alarm rate (FAR) can be used.In this paper, CCR is used to rank the sensor sub-sets. The confusion matrix used for computing these
TABLE 4. Confusion matrix where cij represents the number of datapoints belonging to class i and classified as class j .
metrics is shown in Table 4. These metrics are definedin Eqs. (2) and (3), respectively.
CCR =6icii6i6icij
∗ 100% (2)
FAR =
∑3j=2 c1j
63j=1c1j
∗ 100% (3)
iii) Set the optimal sensor set S∗ as the subset with thehighest CCR.
The optimal sensors selected by using the incrementalwrapper selection method are ranked as follows:1) Discharge Temperature2) Power Consumption of all Chillers3) Power Consumption of Faulty Chiller4) Chilled Water Supply TemperatureInitially, the top four optimal sensors are selected, but the
number of optimal sensors is a tuning parameter, selectedbased on classifier performance. To select the best featurespace, four different classifiers are trained using differentfeature spaces. The feature space for the first classifier con-sists of Twb and the top optimal sensor. Similarly, the featurespaces of second, third and fourth classifiers consist of thetop two, top three and top four optimal sensors, respec-tively, along with Twb. Thus, four different k-NN classifiersare trained to classify the chiller state as healthy, caution-ary or critical.
2) TESTINGAfter training the classifiers with the summer months ofthe year 2013, their performance is tested on the months ofJune, July and August of year 2014. Input data from thesemonths is used for model simulations and data generation forknown fouling severities. The noisy data set is pre-processedby partitioning the data into blocks of length 720 andde-noising each block. The data from the optimal sensors arethen given as input to the trained classifiers. The predictedfouling classes are compared with the original classes and theclassification results are presented in Section V-A.
B. SUPERVISORY CONTROLLERDuring the nominal operation of chiller plant without imple-menting the supervisory control, each of the n chillers receivethe same set point T dchws,p for the desired chilled water supplytemperature. As shown on the right side of Fig. 7, eachchiller has a closed loop controller that regulates the watertemperature locally by selecting an appropriate compressor
14036 VOLUME 5, 2017

K. Mittal et al.: Supervisory Control for Resilient Chiller Plants Under Condenser Fouling
FIGURE 7. Supervisory controllers acting on the healthy and faulty closed-loop chiller systems.
speed ωj(t), j = 1 . . . n. The chilled water leaving from thejth chiller with temperature Tchws,j(t) mixes with the chilledwater from other chillers, thus resulting in the average chilledwater supply temperature Tchws,p(t), which is then used tocool the buildings. When all chillers are healthy, the desiredcooling load is met, such that
Tchws,j(t) = Tchws,p(t) = T dchws,p (4)
Now suppose that there is fouling in the condenser of theith chiller, then the amount of heat transfer from this faultychiller reduces. In order to overcome this deficiency, the localcontroller of this faulty chiller increases the compressor speedin order to increase the mass flow rate and pressure of therefrigerant at the condenser inlet. However, this leads toincreased power consumption and increased stress not onlyon the compressor but also on the other components of thechiller, hence causing accelerated wear. Thus, under theseconditions, although the desired cooling load might be met,i.e. Tchws,i = T dchws,p, the chiller parameters such as refrig-erant mass flow rate, compressor motor speed, dischargepressure, and discharge temperature go off-nominal whichis undesirable. Furthermore, in critical cases, that is undersevere levels of fouling, the compressor speed saturates,resulting in the inability of the faulty chiller to even maintainthe cooling load. As such, Tchws,i > T dchws,p, which in turnresults in the chiller plant not meeting the desired coolingload, i.e. Tchws,p > T dchws,p. In these critical cases, since thereis no feedback that monitors Tchws,p, even the controllers ofthe healthy chillers cannot take any corrective actions to meetthe desired chilled water supply temperature T dchws,p.
Fig. 7 shows the details of supervisory controller whichconsists of two high-level controllers, the Nominal Con-troller (NC) and the Resilient Controller (RC) for each chiller.As shown in Fig. 3 earlier, the supervisor switches thecontrol of the faulty chiller from the nominal mode to theresilient mode in presence of condenser fouling. Hence these
high-level controllers, i.e. RC on the faulty chiller and NC’son the healthy chillers, operate together such that the loadon the faulty chiller is redistributed to the healthy chillers,albeit in an energy-efficient manner. The NC’s acting on thehealthy chillers focus on performance and ensure that thedesired chilled water supply temperature of the plant is met;however, these NC’s alone do not make the system resilient tothe effects of condenser fouling. In contrast, the RC acting onthe faulty chiller focuses on resilience, i.e. bringing the faultychiller parameters back to normalcy, to prevent acceleratedwear of its components. Table 5 lists some useful variables.
As discussed earlier, an immediate effect of fouling isan increase in the compressor speed of the faulty chiller,due to the action of its local controller to maintain thecooling load requirement. Thus it is desired to reduce thecompressor speed of the faulty chiller and increase it forthe healthy chillers such that the desired temperature T dchws,pis met, while energy is minimized. However, as per therequirements of our industry partner, the supervisory con-troller cannot bypass the local controllers, thus the chillercompressor speeds ωj(t), j = 1, . . . n, cannot be directlychanged. Therefore, ωj(t)′s are controlled indirectly byadjusting the set points of individual chillers, i.e. T spchws,j(t),∀j = 1, . . . n. Since the overall energy consumption hasa nonlinear profile with respect to the compressor speeds,the faulty chiller speed could only be reduced until it hitsthe minimum energy point. This optimization problem isdescribed in Section IV-B2.Notation: In the remaining paper, the subscript f is used
to denote the index of the faulty chiller, and the subscript h,h 6= f , is used to denote the indices of the healthy chillers.
1) NOMINAL CONTROLLERS FOR THE HEALTHY CHILLERSThe objective of this controller is to maintain
Tchws,p(t) = T dchws,p (5)
VOLUME 5, 2017 14037

K. Mittal et al.: Supervisory Control for Resilient Chiller Plants Under Condenser Fouling
TABLE 5. Variables used by the supervisory controller during runtime.
by adjusting the set points T spchws,h(t) of the healthy chillers viamonitoring Tchws,p(t) as feedback signal, as shown in Fig. 7.Since in this paper all chillers are assumed to have the samecooling capacity and power consumption, all healthy chillersreceive the same set point T spchws,h(t). This controller is imple-mented as a Proportional-Integral (PI) controller with thefollowing transfer function
Gh(s) = Kh
(1+
1Th s
)(6)
where Kh = 0.792 and Th = 6.64 seconds are the pro-portional gain and integral time, respectively. The controllerwas tuned using the Zeigler-Nichols method and was testedto maintain performance under time-varying operating condi-tions, such as the building cooling load BCL(t) and the wet-bulb temperature Twb(t).
2) RESILIENT CONTROLLER FOR THE FAULTY CHILLERThe NC’s running on the healthy chillers always ensure thatthe cooling load requirement is met, thus any reduction in thecooling provided by the faulty chiller will be compensatedby the healthy chillers automatically. Since the faulty chilleris less efficient and more prone to wear than the healthychillers, it should not work as hard as the healthy chillersand hence ωf (t) should be reduced to below ωh(t). However,the power profile is nonlinear with respect to compressorspeeds and thus ωf (t) cannot be arbitrarily reduced. Let pj(t)be the power consumption of the jth chiller. Then the totalpower consumption of all chillers is defined as Ptotal(t) =n∑j=1
pj(t). The RC acting on the faulty chiller reduces ωf (t)
until the optimal point ω∗f (t) is reached where Ptotal(t) isminimum, thereby maximizing the energy efficiency of thesystem. Thus, the optimization problem is defined as follows:
minimizeωf (t)
Ptotal(t)
subject to ωf (t) ≤ ωh(t) (7)
Corresponding to ω∗f (t), the speed of the healthy chillers,which meets the cooling load demand (i.e. Tchws,p(t) =T dchws,p), is termed as ω∗h(t). Determining ω∗f (t) in real time,
FIGURE 8. k-means clustering of the operating space.
however, is challenging since it depends on the time-varyinginput operating conditions such as the building cooling loadBCL(t) and the wet-bulb temperature Twb(t), and also thefouling level θf (t) of the faulty chiller.
a: OFFLINE TRAININGSince it is difficult to calculate all values of ω∗f for eachoperating condition, only a finite number of operating pointsare considered. These pre-computed values of ω∗f are laterused during runtime to approximate the optimal set pointsfor the chiller plant. In order to select these operating points,the input operating space (BCL,Twb), consisting of the his-torical cooling load and the weather data, is partitioned intodifferent regions using the k-means clustering algorithm [55].The results with k = 8 for the data from the summer of2013 are shown in Fig. 8. Then for each centroid and givenfouling level of the faulty chiller, the simulation model isrun for different values of ωf with the nominal controller forhealthy chillers running. Since the faulty class is either cau-tionary (20% ≤ fouling severity < 60%) or critical (60% ≤fouling severity), the middle points of 40% and 70%, respec-tively, are chosen as the inputs for each class. Then theoutputs of simulation runs are used to generate the powerconsumption profiles for various input conditions.
14038 VOLUME 5, 2017
K. Mittal et al.: Supervisory Control for Resilient Chiller Plants Under Condenser Fouling
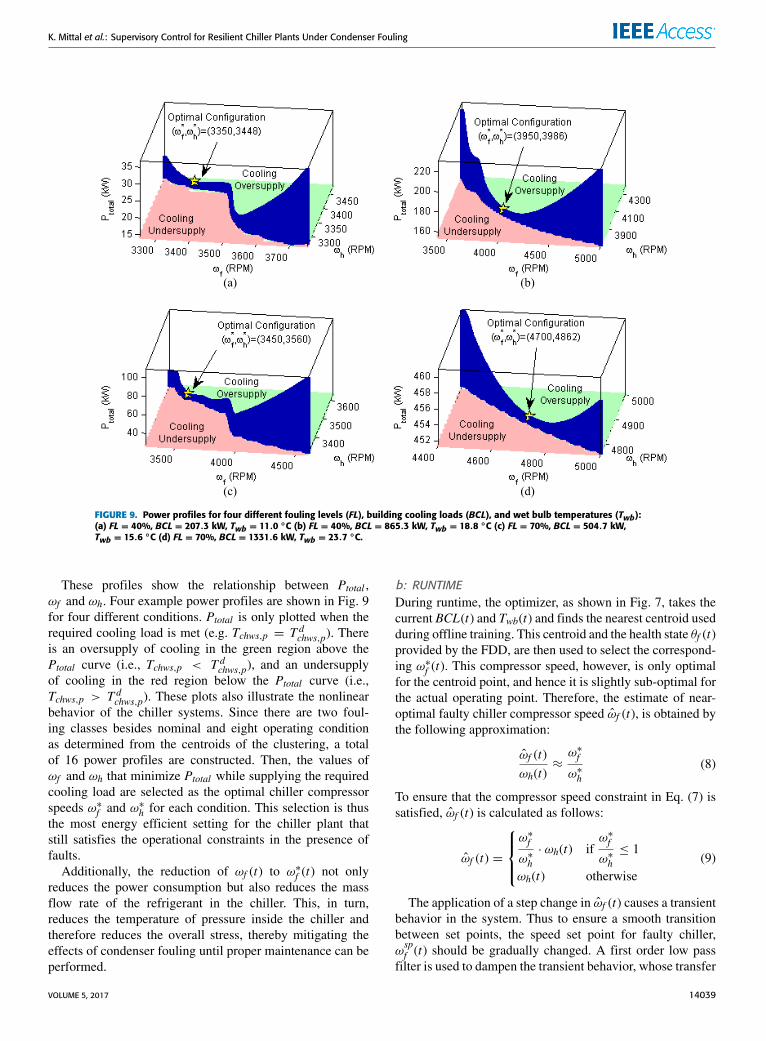
FIGURE 9. Power profiles for four different fouling levels (FL), building cooling loads (BCL), and wet bulb temperatures (Twb):(a) FL = 40%, BCL = 207.3 kW, Twb = 11.0 ◦C (b) FL = 40%, BCL = 865.3 kW, Twb = 18.8 ◦C (c) FL = 70%, BCL = 504.7 kW,Twb = 15.6 ◦C (d) FL = 70%, BCL = 1331.6 kW, Twb = 23.7 ◦C.
These profiles show the relationship between Ptotal ,ωf and ωh. Four example power profiles are shown in Fig. 9for four different conditions. Ptotal is only plotted when therequired cooling load is met (e.g. Tchws,p = T dchws,p). Thereis an oversupply of cooling in the green region above thePtotal curve (i.e., Tchws,p < T dchws,p), and an undersupplyof cooling in the red region below the Ptotal curve (i.e.,Tchws,p > T dchws,p). These plots also illustrate the nonlinearbehavior of the chiller systems. Since there are two foul-ing classes besides nominal and eight operating conditionas determined from the centroids of the clustering, a totalof 16 power profiles are constructed. Then, the values ofωf and ωh that minimize Ptotal while supplying the requiredcooling load are selected as the optimal chiller compressorspeeds ω∗f and ω∗h for each condition. This selection is thusthe most energy efficient setting for the chiller plant thatstill satisfies the operational constraints in the presence offaults.
Additionally, the reduction of ωf (t) to ω∗f (t) not onlyreduces the power consumption but also reduces the massflow rate of the refrigerant in the chiller. This, in turn,reduces the temperature of pressure inside the chiller andtherefore reduces the overall stress, thereby mitigating theeffects of condenser fouling until proper maintenance can beperformed.
b: RUNTIMEDuring runtime, the optimizer, as shown in Fig. 7, takes thecurrent BCL(t) and Twb(t) and finds the nearest centroid usedduring offline training. This centroid and the health state θf (t)provided by the FDD, are then used to select the correspond-ing ω∗f (t). This compressor speed, however, is only optimalfor the centroid point, and hence it is slightly sub-optimal forthe actual operating point. Therefore, the estimate of near-optimal faulty chiller compressor speed ωf (t), is obtained bythe following approximation:
ωf (t)ωh(t)
≈ω∗f
ω∗h(8)
To ensure that the compressor speed constraint in Eq. (7) issatisfied, ωf (t) is calculated as follows:
ωf (t) =
ω∗f
ω∗h· ωh(t) if
ω∗f
ω∗h≤ 1
ωh(t) otherwise(9)
The application of a step change in ωf (t) causes a transientbehavior in the system. Thus to ensure a smooth transitionbetween set points, the speed set point for faulty chiller,ωspf (t) should be gradually changed. A first order low pass
filter is used to dampen the transient behavior, whose transfer
VOLUME 5, 2017 14039

K. Mittal et al.: Supervisory Control for Resilient Chiller Plants Under Condenser Fouling
function is given by:
LP(s) =1
τ s+ 1(10)
where τ = 300 seconds. Finally, as mentioned earlier,the compressor speed ωf (t) cannot be changed directly, sinceit is updated by the local controller which is not accessible.Thus, as an intermediate step we add a PI controller whichdetermines the chilled water supply temperature set pointof the faulty chiller T spchws,f (t) by monitoring the compressorspeed sensor ωf (t) in order to track the desired compressorspeed ωspf (t). The transfer function of this controller is:
Gf (s) = Kf
(1+
1Tf s
)(11)
where Kf = −10 and Tf = 1 second are the proportionalgain and integral time, respectively.
V. RESULTS AND DISCUSSIONThe results of the proposed supervisory control strategy arepresented in this section. Inputs of weather and cooling loaddata for summer 2014 are used for generating the test data.The FDD module classifies each chiller as healthy, caution-ary or critical. Based on the predicted fouling class, the super-visory controller switches to the resilient controller for thefaulty chiller to mitigate the effects of fouling.
TABLE 6. Confusion matrices for classifier trained on summer 2013 using4D feature space and tested on summer 2014.
A. FAULT DETECTION AND DIAGNOSISAs discussed in Section IV-A1, different k-NN classificationmodels are trained using the feature spaces consisting of dif-ferent numbers of optimal sensors and Twb, obtained from thedata of months June-Aug’13. These feature spaces are thenused for generating decisions for the test data from themonthsof June-Aug’14. It was observed that the feature space withfour sensors provides the best classification accuracy. Table 6shows the confusion matrices for the test data using theselected 4-D feature space. The numbers in the confusionmatrices sum to the total number of test data blocks whichis ∼ 1084 for each month.
TABLE 7. FDD performance for different months.
It is clear from Table 7 that the FDD scheme performsfouling classification with an accuracy of ∼ 97%. The con-fusion matrices in Table 6 show that the missed detectionrate is minimized by the proposed scheme, thus providinggood diagnosis. Importantly, any missed detections that dooccur are between adjacent classes, e.g., a chiller in criticalcondition is never misclassified as healthy. The approach alsohas a low false alarm rate of about ∼ 3%, which is essentialfor a reliable FDD system. The robustness of the approachcan be seen from the use of training and testing data fromtwo different years. The classifier trained using data from theyear 2013 gives accurate predictions for the data from 2014.
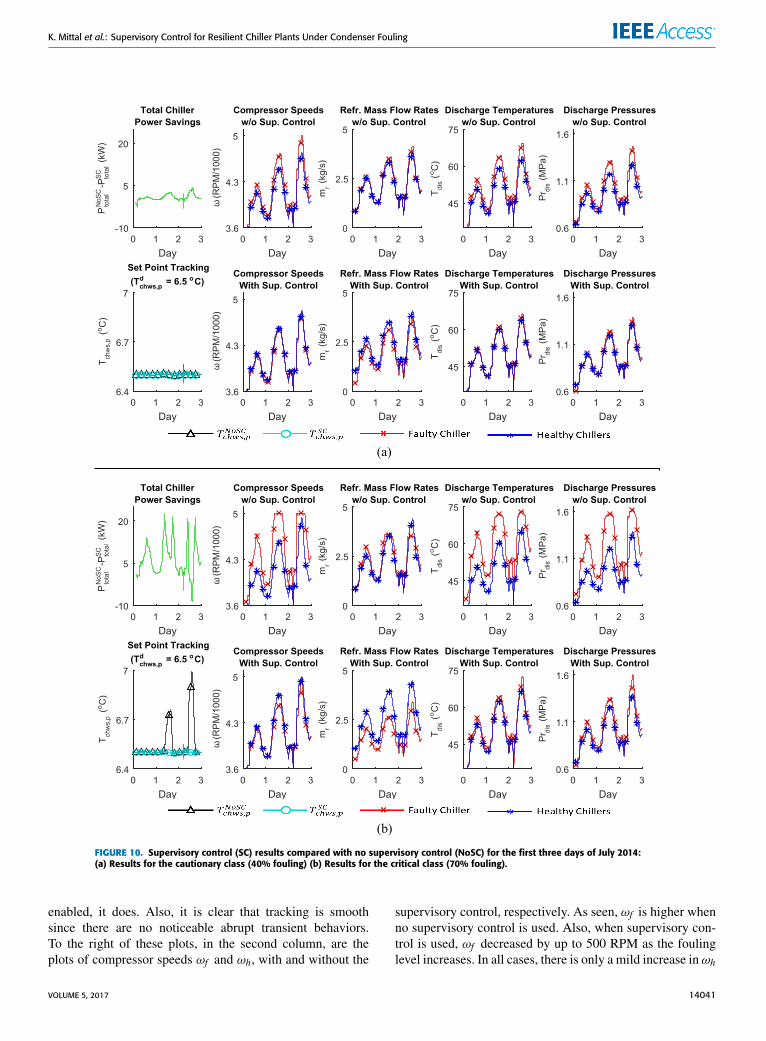
B. SUPERVISORY CONTROLLERThe performance of supervisory controller (SC) was testedfor four different fouling levels, 25%, 40%, 55%, and 70%,over the months of June, July, and August of 2014 andcompared against a chiller plant with no supervisory con-trol (NoSC). Fig. 10 visualizes the results for a few snapshotsof data taken during the first three days of July 2014 for40% (Fig. 10(a)) and 70% (Fig. 10(b)) fouling.
First, the plot in the first column and the top row of eachof the Figs. 10(a) and 10(b) shows the power savings whichis the difference in power when the supervisory controlleris not used with the one when it is used. As seen in theseplots, the power savings are realized in almost all instancesby up to about 20 kW. The corresponding plots below thepower savings plots show that the supervisory controller alsoreliably tracks T dchws,p in all instances of fouling. It is alsonoted that if the supervisory controller is not used for criticalfouling cases of 70%, then the chiller plant does not meetthe performance; however with the supervisory controller
14040 VOLUME 5, 2017
K. Mittal et al.: Supervisory Control for Resilient Chiller Plants Under Condenser Fouling
FIGURE 10. Supervisory control (SC) results compared with no supervisory control (NoSC) for the first three days of July 2014:(a) Results for the cautionary class (40% fouling) (b) Results for the critical class (70% fouling).
enabled, it does. Also, it is clear that tracking is smoothsince there are no noticeable abrupt transient behaviors.To the right of these plots, in the second column, are theplots of compressor speeds ωf and ωh, with and without the
supervisory control, respectively. As seen, ωf is higher whenno supervisory control is used. Also, when supervisory con-trol is used, ωf decreased by up to 500 RPM as the foulinglevel increases. In all cases, there is only a mild increase inωh
VOLUME 5, 2017 14041
K. Mittal et al.: Supervisory Control for Resilient Chiller Plants Under Condenser Fouling
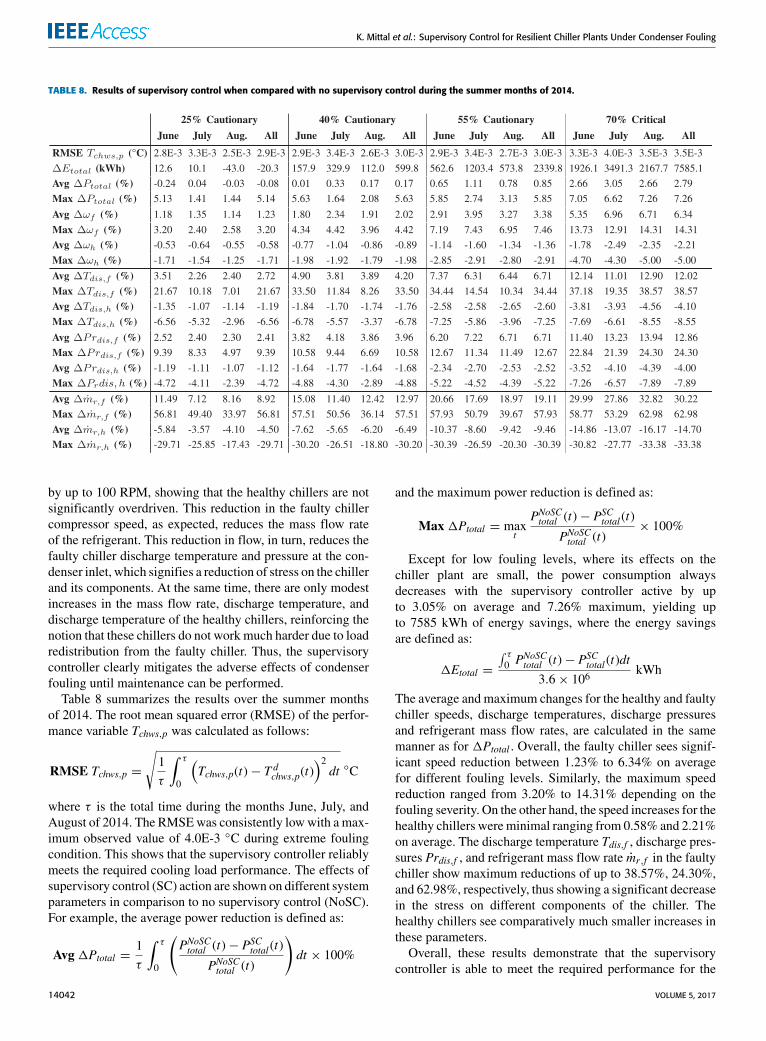
TABLE 8. Results of supervisory control when compared with no supervisory control during the summer months of 2014.
by up to 100 RPM, showing that the healthy chillers are notsignificantly overdriven. This reduction in the faulty chillercompressor speed, as expected, reduces the mass flow rateof the refrigerant. This reduction in flow, in turn, reduces thefaulty chiller discharge temperature and pressure at the con-denser inlet, which signifies a reduction of stress on the chillerand its components. At the same time, there are only modestincreases in the mass flow rate, discharge temperature, anddischarge temperature of the healthy chillers, reinforcing thenotion that these chillers do not work much harder due to loadredistribution from the faulty chiller. Thus, the supervisorycontroller clearly mitigates the adverse effects of condenserfouling until maintenance can be performed.
Table 8 summarizes the results over the summer monthsof 2014. The root mean squared error (RMSE) of the perfor-mance variable Tchws,p was calculated as follows:
RMSE Tchws,p =
√1τ
∫ τ
0
(Tchws,p(t)− T dchws,p(t)
)2dt ◦C
where τ is the total time during the months June, July, andAugust of 2014. The RMSEwas consistently lowwith a max-imum observed value of 4.0E-3 ◦C during extreme foulingcondition. This shows that the supervisory controller reliablymeets the required cooling load performance. The effects ofsupervisory control (SC) action are shown on different systemparameters in comparison to no supervisory control (NoSC).For example, the average power reduction is defined as:
Avg 1Ptotal =1τ
∫ τ
0
(PNoSCtotal (t)− P
SCtotal(t)
PNoSCtotal (t)
)dt × 100%
and the maximum power reduction is defined as:
Max 1Ptotal = maxt
PNoSCtotal (t)− PSCtotal(t)
PNoSCtotal (t)× 100%
Except for low fouling levels, where its effects on thechiller plant are small, the power consumption alwaysdecreases with the supervisory controller active by upto 3.05% on average and 7.26% maximum, yielding upto 7585 kWh of energy savings, where the energy savingsare defined as:
1Etotal =
∫ τ0 P
NoSCtotal (t)− P
SCtotal(t)dt
3.6× 10⁶kWh
The average and maximum changes for the healthy and faultychiller speeds, discharge temperatures, discharge pressuresand refrigerant mass flow rates, are calculated in the samemanner as for 1Ptotal . Overall, the faulty chiller sees signif-icant speed reduction between 1.23% to 6.34% on averagefor different fouling levels. Similarly, the maximum speedreduction ranged from 3.20% to 14.31% depending on thefouling severity. On the other hand, the speed increases for thehealthy chillers wereminimal ranging from 0.58% and 2.21%on average. The discharge temperature Tdis,f , discharge pres-sures Prdis,f , and refrigerant mass flow rate mr,f in the faultychiller show maximum reductions of up to 38.57%, 24.30%,and 62.98%, respectively, thus showing a significant decreasein the stress on different components of the chiller. Thehealthy chillers see comparatively much smaller increases inthese parameters.
Overall, these results demonstrate that the supervisorycontroller is able to meet the required performance for the
14042 VOLUME 5, 2017

K. Mittal et al.: Supervisory Control for Resilient Chiller Plants Under Condenser Fouling
customer under condenser fouling while providing resilience.Notably, the main features of this supervisory controller forthe end user include:
• cost savings through reduced energy consumption,• increased product lifespan through faulty chiller loadreduction,
• chiller plant performance guarantees through load redis-tribution to health chillers, and
• conditioned-based maintenance to ensure fouling istreated only when needed.
These features can collectively provide considerable costsavings to end user over the life cycle of the chiller plant. Theproposed supervisory control strategy can be implementedon a real chiller plant by integrating the supervisory controlframework with the Plant System Manager (PSM).
VI. CONCLUSIONS AND FUTURE WORKThis paper proposed a novel model-based supervisory controlframework that enables resilient operation of chiller plantsin the presence of condenser fouling. The supervisory con-trol framework consists of an optimal sensor selection-basedfault detection and diagnosis scheme and a resilient controlstrategy that effectively mitigates the effects of condenserfouling by bringing the system parameters back to normalcy,while meeting the cooling load demand. The methodologyis validated on a high-fidelity chiller plant model where itis shown to meet all of its listed goals. The FDD approachshows high classification accuracy with low missed detectionand false alarm rates, while the supervisory control resultsdemonstrate resilience, power savings, and cooling load per-formance guarantees, for different fouling severities and foroperation during different months. Furthermore, these solu-tions are shown to be robust by extensive testing on a largeand diverse data set and are computationally efficient due tothe simplicity of their designs.
For future work, the methodology needs to be extended toprovide a resilient control action against all the major faultsin chillers and chiller plants. However, to design a controlstrategy to handle multiple faults, the fault detection and diag-nosis strategy needs to be improved by incorporating system-level fault detection and isolation, which monitors the entirechiller plant and identifies exactly which component or sub-component in a chiller plant is faulty. Other areas for improve-ment are updating the control to handle chiller start-up andshut-down times, chiller staging and asymmetric chiller con-figurations. Comparison of the obtained results with realexperimental condenser fouling data if available or simulatedsensor data with more uncertainty in terms of bias and noisevalues is another area of future work. Finally, improvementsto the proposed algorithms that minimize the amount ofrequired training data will increase the scalability of thesupervisory controller when dealing with larger problems.The supervisory control framework presented here can beextended and applied to other complex interconnected sys-tems with load sharing subsystems such as airplanes, power
FIGURE 11. Thermodynamic cycle of the chiller model at nominalconditions.
grids, smart buildings, etc. to achieve energy-efficient andreliable operation.
APPENDIXVALIDATION OF CHILLER PLANT MODELThe high-fidelity chiller plant simulation model is imple-mented in the Modelica modeling language using componentmodels from several commercial and open-source libraries.The models used in this work are a high-fidelity model ofa water-cooled centrifugal chiller with local capacity controland a scalable framework model of a chiller plant, whichuses the chiller model as a component. Local capacity controlof the chiller adjusts its compressor speed to maintain achilled water supply temperature setpoint, which is assignedat the plant level. The chiller plant testbed model includescomponent models representing the key components of aclosed loop chilled water plant. The chiller components inthe plant model are interchangeable, allowing for side-by-side comparison between the high-fidelity chiller model andexisting alternatives.
Validation of the high fidelity chillermodel was undertakenby first comparing its outputs to published standards forchillers using the selected refrigerant at nominal operatingconditions, as enumerated in Table 9. With these values inagreement the chiller model is a realistic representation of anR134a refrigeration cycle. The thermodynamic cycle of thechiller model at nominal conditions is illustrated in Fig. 11.
Validation of the chiller plant model was performed bycomparison of its outputs to operating data recorded from thechiller plant in the University of Connecticut Central UtilitiesPlant (UConn CUP) and corresponding weather data. Twoplant model configurations were evaluated, one using thedeveloped high-fidelity chiller model and the other using anexisting validated empirical chiller model from the LBNLBuildings Library. Both model configurations were found tosuitably represent the behavior of a real chiller plant for the
VOLUME 5, 2017 14043

K. Mittal et al.: Supervisory Control for Resilient Chiller Plants Under Condenser Fouling
TABLE 9. High fidelity model nominal conditions.
FIGURE 12. Comparison of the heat transfer rates on the condenser andevaporator sides of the chillers in the proposed model with real chillerplant and empirical models.
studied range of input conditions, confirming the validity ofboth the chiller and chiller plant models used in this work.Fig. 12 shows a comparison of heat transfer rates on thecondenser and evaporator sides of the chillers in each of thesemodels and the real chiller plant.
REFERENCES[1] F. W. Payne and J. J. McGowan, Energy Management and Control Systems
Handbook. Lilburn, GA, USA: Springer, 2012.[2] L. Pérez-Lombard, J. Ortiz, and C. Pout, ‘‘A review on buildings energy
consumption information,’’ Energy Buildings, vol. 40, no. 3, pp. 394–398,2008.
[3] K. Choi, S. M. Namburu, M. S. Azam, J. Luo, K. R. Pattipati, andA. Patterson-Hine, ‘‘Fault diagnosis in HVAC chillers,’’ IEEE Instrum.Meas. Mag., vol. 8, no. 3, pp. 24–32, Aug. 2005.
[4] M. Comstock, J. Braun, and E. Groll, ‘‘The sensitivity of chiller perfor-mance to common faults,’’ HVACR Res., vol. 7, no. 3, pp. 263–279, 2001.
[5] X. Zhao, M. Yang, and H. Li, ‘‘A virtual condenser fouling sensor forchillers,’’ Energy Buildings, vol. 52, pp. 68–76, Sep. 2012.
[6] J. Tomczyk, Troubleshooting and Servicing Modern Air Conditioning andRefrigeration Systems. Mt. Prospect, Il, USA: ESCO Press, 1995.
[7] J. Tomczyk. (2002). A Look at Compressor Discharge Temperatures.[Online]. Available: http://www.achrnews.com/articles/88734-a-look-at-compressor-discharge-temperatures#comments
[8] ThermaCom Ltd. (2000). Compressor Longevity. [Online]. Available:http://seedengr.com/CompressorLongevity.pdf
[9] S. Sridhar, A. Hahn, and M. Govindarasu, ‘‘Cyber attack-resilient controlfor smart grid,’’ in Proc. IEEE PES Innov. Smart Grid Technol. (ISGT),Jan. 2012, pp. 1–3.
[10] C. G. Rieger, D. I. Gertman, and M. A. McQueen, ‘‘Resilient controlsystems: Next generation design research,’’ inProc. 2nd Conf. Human Syst.Interaction, May 2009, pp. 632–636.
[11] D. L. Alderson and J. C. Doyle, ‘‘Contrasting views of complexity and theirimplications for network-centric infrastructures,’’ IEEE Trans. Syst., Man,Cybern. A, Syst., Humans, vol. 40, no. 4, pp. 839–852, Jul. 2010.
[12] D. Wei and K. Ji, ‘‘Resilient industrial control system (RICS): Concepts,formulation, metrics, and insights,’’ in Proc. 3rd Int. Symp. Resilient Con-trol Syst. (ISRCS), 2010, pp. 15–22.
[13] Z. Ma, S. Wang, X. Xu, and F. Xiao, ‘‘A supervisory control strategy forbuilding cooling water systems for practical and real time applications,’’Energy Convers. Manage., vol. 49, no. 8, pp. 2324–2336, 2008.
[14] Z. Ma and S. Wang, ‘‘Supervisory and optimal control of central chillerplants using simplified adaptive models and genetic algorithm,’’ Appl.Energy, vol. 88, no. 1, pp. 198–211, 2011.
[15] X. Wei, A. Kusiak, M. Li, F. Tang, and Y. Zeng, ‘‘Multi-objective opti-mization of the HVAC (heating, ventilation, and air conditioning) systemperformance,’’ Energy, vol. 83, pp. 294–306, Apr. 2015.
[16] S. Wang and Z. Ma, ‘‘Supervisory and optimal control of building HVACsystems: A review,’’ HVACR Res., vol. 14, no. 1, pp. 3–32, 2008.
[17] Y. Zeng, Z. Zhang, and A. Kusiak, ‘‘Predictive modeling and optimizationof a multi-zone HVAC system with data mining and firefly algorithms,’’Energy, vol. 86, pp. 393–402, Jun. 2015.
[18] A. Kusiak and G. Xu, ‘‘Modeling and optimization of HVAC systems usinga dynamic neural network,’’ Energy, vol. 42, no. 1, pp. 241–250, 2012.
[19] S. Wang and Y. Chen, ‘‘Fault-tolerant control for outdoor ventilation airflow rate in buildings based on neural network,’’ Building Environ., vol. 37,no. 7, pp. 691–704, 2002.
[20] X. Jin and Z. Du, ‘‘Fault tolerant control of outdoor air and AHU supply airtemperature in VAV air conditioning systems using PCA method,’’ Appl.Thermal Eng., vol. 26, no. 11, pp. 1226–1237, 2006.
[21] K. Ji, Y. Lu, L. Liao, Z. Song, and D. Wei, ‘‘Prognostics enabled resilientcontrol for model-based building automation systems,’’ in Proc. 12th Conf.Int. Building Perform. Simulation Assoc., 2011, pp. 286–293.
[22] Z.Ma and S.Wang, ‘‘Online fault detection and robust control of condensercooling water systems in building central chiller plants,’’Energy Buildings,vol. 43, no. 1, pp. 153–165, 2011.
[23] Z. Ma and S. Wang, ‘‘Fault-tolerant supervisory control of building con-denser cooling water systems for energy efficiency,’’HVACR Res., vol. 18,nos. 1–2, pp. 126–146, 2012.
[24] X.-F. Liu and A. Dexter, ‘‘Fault-tolerant supervisory control of VAV air-conditioning systems,’’ Energy Buildings, vol. 33, no. 4, pp. 379–389,2001.
[25] S. Katipamula and M. R. Brambley, ‘‘Review article: Methods for faultdetection, diagnostics, and prognostics for building systems—A review,part I,’’ HVACR Res., vol. 11, no. 1, pp. 169–187, 2005.
[26] Y. Yu, D. Woradechjumroen, and D. Yu, ‘‘A review of fault detection anddiagnosis methodologies on air-handling units,’’ Energy Buildings, vol. 82,pp. 550–562, Oct. 2014.
[27] Y. Zhang and J. Jiang, ‘‘Bibliographical review on reconfigurable fault-tolerant control systems,’’ Annu. Rev. Control, vol. 32, no. 2, pp. 229–252,2008.
[28] J. Cui and S. Wang, ‘‘A model-based online fault detection and diagnosisstrategy for centrifugal chiller systems,’’ Int. J. Thermal Sci., vol. 44,no. 10, pp. 986–999, 2005.
14044 VOLUME 5, 2017

K. Mittal et al.: Supervisory Control for Resilient Chiller Plants Under Condenser Fouling
[29] T. A. Reddy, ‘‘Development and evaluation of a simple model-basedautomated fault detection and diagnosis (FDD)method suitable for processfaults of large chillers,’’ ASHRAE Trans., vol. 113, no. 2, pp. 27–39,2007.
[30] M. Bonvini, M. D. Sohn, J. Granderson, M. Wetter, and M. A. Piette,‘‘Robust on-line fault detection diagnosis for HVAC components basedon nonlinear state estimation techniques,’’ Appl. Energy, vol. 124,pp. 156–166, Jul. 2014.
[31] Q. Zhou, S. Wang, and Z. Ma, ‘‘A model-based fault detection and diag-nosis strategy for HVAC systems,’’ Int. J. Energy Res., vol. 33, no. 10,pp. 903–918, 2009.
[32] S. Wang and J. Cui, ‘‘A robust fault detection and diagnosis strategyfor centrifugal chillers,’’ HVACR Res., vol. 12, no. 3, pp. 407–428,2006.
[33] Y. Chen, X. Hao, G. Zhang, and S. Wang, ‘‘Flow meter fault isolation inbuilding central chilling systems using wavelet analysis,’’ Energy Convers.Manage., vol. 47, no. 13, pp. 1700–1710, 2006.
[34] W.-Y. Lee, J. M. House, and N.-H. Kyong, ‘‘Subsystem level faultdiagnosis of a building’s air-handling unit using general regres-sion neural networks,’’ Appl. Energy, vol. 77, no. 2, pp. 153–170,2004.
[35] R. Hackner, W. Beckman, and J. Mitchell, ‘‘System dynamics and energyuse,’’ ASHRAE J., vol. 27, no. 6, Jun. 1985.
[36] J. Braun, ‘‘Methodologies for the design and control of central coolingplants,’’ Ph.D. dissertation, Dept. Mech. Eng., Univ. Wisconsin-Madison,Madison, WI, USA, 1988.
[37] J. U. R. Khan and S. M. Zubair, ‘‘Thermodynamic optimization of finitetime vapor compression refrigeration systems,’’ Energy Convers. Manage.,vol. 42, no. 12, pp. 1457–1475, 2001.
[38] Basic Concepts Manual—Essential Information You Need about RunningEnergyPlus, US Dept. Energy Nat. Renewable Energy Lab. (NREL),Golden, Colorado, 2013.
[39] DOE-2 Reference Manual, Los Alamos Sci. Lab., Los Alamos, NM, USA,1980.
[40] Trnsys 17 User Guide, Univ. Wisconsin Madison, Madison, WI, USA,2009.
[41] Modelica Association. (2014). The Modelica Language Specification Ver-sion 3.3 Revision 1. [Online]. Available: http://www.modelica.org/
[42] Dymola User’s Manual, Dynasim AB, Vélizy-Villacoublay, France, 2004.[43] M. Wetter, ‘‘A Modelica-based model library for building energy and
control systems,’’ Lawrence Berkeley Nat. Lab., Berkeley, CA, USA,Tech. Rep. LBNL-2739E, 2010.
[44] S. Quoilin, A. Desideri, J. Wronski, I. Bell, and V. Lemort, ‘‘Thermocycle:Amodelica library for the simulation of thermodynamic systems,’’ in Proc.10th Int. Modelica Conf., 2014, pp. 683–692.
[45] Dymola User’s Manual, Dynasim AB, Vélizy-Villacoublay, France, 2014.[46] (2015). National Weather Service. [Online]. Available:
http://www.weather.gov[47] B. P. Baillie and G. M. Bollas, ‘‘Development, validation, and assessment
of a high fidelity chilled water plant model,’’ Appl. Thermal Eng., vol. 111,pp. 477–488, Jan. 2017.
[48] X. Zhao, M. Yang, and H. Li, ‘‘A virtual condenser foulingsensor for chillers,’’ Energy Buildings, vol. 52, pp. 68–76,Sep. 2012. [Online]. Available: http://www.sciencedirect.com/science/article/pii/S0378778812002733
[49] T. Cover and P. Hart, ‘‘Nearest neighbor pattern classification,’’ IEEETrans. Inf. Theory, vol. 13, no. 1, pp. 21–27, Jan. 1967.
[50] D. L. Donoho and J. M. Johnstone, ‘‘Ideal spatial adaptationby wavelet shrinkage,’’ Biometrika, vol. 81, no. 3, pp. 425–455,1994.
[51] D. L. Donoho, ‘‘De-noising by soft-thresholding,’’ IEEE Trans. Inf. The-ory, vol. 41, no. 3, pp. 613–627, May 1995.
[52] R. Kohavi and G. H. John, ‘‘Wrappers for feature subset selection,’’ Artif.Intell., vol. 97, nos. 1–2, pp. 273–324, 1997.
[53] H. Peng, F. Long, and C. Ding, ‘‘Feature selection based on mutual infor-mation criteria of max-dependency, max-relevance, and min-redundancy,’’IEEE Trans. Pattern Anal. Mach. Intell., vol. 27, no. 8, pp. 1226–1238,Aug. 2005.
[54] R. Kohavi et al., ‘‘A study of cross-validation and bootstrap for accu-racy estimation and model selection,’’ in Proc. IJCAI, vol. 14. 1995,pp. 1137–1145.
[55] D. Arthur and S. Vassilvitskii, ‘‘K-means++: The advantages of carefulseeding,’’ in Proc. 18th Annu. ACM-SIAM Symp. Discrete Algorithms,Philadelphia, PA, USA, 2007, pp. 1027–1035.
KHUSHBOO MITTAL received the B.E. degree inelectronics and communication engineering fromIIT Roorkee, India, in 2011, and the M.S. degreein electrical engineering from the École Polytech-nique Fédérale de Lausanne, Switzerland, in 2013.She is currently pursuing the Ph.D. degree with theDepartment of Electrical and Computer Engineer-ing, University of Connecticut, Storrs, CT, USA.Her current research interests include data anal-ysis in complex network systems, fault diagnosis
and prognosis, machine learning, sensor/feature selection, and informationfusion.
JAMES P. WILSON received the B.S.E. degreein electrical engineering from the University ofConnecticut, Storrs, CT, USA, in 2014, where heis currently pursuing the Ph.D. degree with theDepartment of Electrical and Computer Engineer-ing. His current research interests include dataanalysis, machine learning, fault diagnosis andprognosis, and supervisory control in complexinterconnected systems in the presence of faultsand degradations.
BRIAN P. BAILLIE received the B.S.E. degreein chemical engineering from the University ofConnecticut, Storrs, CT, USA, in 2014, wherehe is currently pursuing the Ph.D. degree withthe Department of Chemical and Biomolecu-lar Engineering. His research interests includethe modeling of complex thermofluid systems,heuristic-informed generation of reduced mod-els, and optimal experimental design for modelselection.
SHALABH GUPTA (M’07) received the B.E.degree in mechanical engineering from IITRoorkee, India, in 2001, and the M.S. degreein mechanical engineering, the M.S. degree inelectrical engineering, and the Ph.D. degree inmechanical engineering from Pennsylvania StateUniversity, University Park, PA, USA, in 2004,2005, and 2006, respectively. He is currently anAssistant Professor with the Department of Elec-trical and Computer Engineering, University of
Connecticut. His current research interests include distributed autonomy,cyber-physical systems, robotics, network intelligence, data analytics, infor-mation fusion, and fault diagnosis in complex systems. He is a member ofthe American Society of Mechanical Engineers.
VOLUME 5, 2017 14045

K. Mittal et al.: Supervisory Control for Resilient Chiller Plants Under Condenser Fouling
GEORGE M. BOLLAS received the B.E. andPh.D. degrees from the Aristotle University ofThessaloniki, Greece. He was a Post-DoctoralResearch Associate with the Chemical Engineer-ing Department, Massachusetts Institute of Tech-nology. He is currently anAssociate Professor withthe Department of Chemical and BiomolecularEngineering, University of Connecticut, a ProcessDesign Expert and Winner of the prestigious NSFCAREER Award and the ACS PRF DNI Award.
He is the Director of the United Technologies Corporation Institute forAdvanced Systems Engineering with the University of Connecticut. Hislaboratory pursues a balanced approach to experimentation guided by robustmodeling and simulation of chemical processes, including experimentaldesign, process scaling, and control.
PETER B. LUH (S’77–M’80–SM’91–F’95–LF’16) received the B.S. degree fromNational Tai-wan University, Taipei, Taiwan, the M.S. degreefrom the Massachusetts Institute of Technology,Cambridge, MA, USA, and the Ph.D. degree fromHarvard University, Cambridge. He has been withthe University of Connecticut, Storrs, CT, USA,since 1980, and is the SNET Professor of Com-munications and Information Technologies. Hiscurrent research interests include smart and green
buildings, intelligent manufacturing, and smart grid. He is a member andthe Elected Chair (2018–2019) of the IEEE TAB Periodicals Committee.He was the Vice President of publication activities for the IEEE Roboticsand Automation Society, an Editor-in-Chief of the IEEE TRANSACTIONS ON
ROBOTICS AND AUTOMATION, and the Founding Editor-in-Chief of the IEEETRANSACTIONS ON AUTOMATION SCIENCE AND ENGINEERING.
14046 VOLUME 5, 2017