Supermarket Supply Chains with Chinese Characteristics...
25
Supermarket Supply Chains with Chinese Characteristics: The Case of Walmart’s Direct Farms Hope Michelson Steve Boucher The Earth Institute University of California, Davis Columbia University [email protected] [email protected] Junfei Bai Xiangping Jia Center for Chinese Agricultural Policy Center for Chinese Agricultural Policy [email protected] [email protected] Jikun Huang Xinzhe Chen Center for Chinese Agricultural Policy University of California, Davis [email protected] [email protected] Selected paper prepared for presentation at the Agricultural and Applied Economics Association’s 2013 AAEA & CAES Joint Annual Meeting, Washington, DC, August 4-6, 2013. Copyright 2013 by Hope Michelson, Steve Boucher, Junfei Bai, Xiangping Jia and Jikun Huang. All rights reserved. Readers may make verbatim copies of this document for non-commercial purposes by any means, provided that this copyright notice appears on all such copies.
Transcript of Supermarket Supply Chains with Chinese Characteristics...

Supermarket Supply Chains with Chinese Characteristics:
The Case of Walmart’s Direct Farms
Hope Michelson Steve Boucher The Earth Institute University of California, Davis
Columbia University [email protected] [email protected]
Junfei Bai Xiangping Jia
Center for Chinese Agricultural Policy Center for Chinese Agricultural Policy [email protected] [email protected]
Jikun Huang Xinzhe Chen
Center for Chinese Agricultural Policy University of California, Davis [email protected] [email protected]
Selected paper prepared for presentation at the Agricultural and Applied Economics Association’s 2013 AAEA & CAES Joint Annual Meeting, Washington, DC, August 4-6, 2013.
Copyright 2013 by Hope Michelson, Steve Boucher, Junfei Bai, Xiangping Jia and Jikun Huang. All rights reserved. Readers may make verbatim copies of this document for non-commercial purposes by
any means, provided that this copyright notice appears on all such copies.

1
1. Introduction: The Rise of Supermarkets in China
China’s supermarket sector has grown rapidly in the past twenty years, driven by
increased incomes, increased urbanization, state investment in food retail, and increased
openness to foreign direct investment (FDI). Reardon et al. (2004) describe recent trends:
having achieved only minimal presence by the early 1990s, by the mid-2000s
supermarkets commanded 30% of the urban food retail market with sales growth of 30 to
40 percent per year. Modern retail growth has been similar to what has been observed in
other emerging markets (Reardon et al. 2003; Weatherspoon and Reardon 2003), though
the growth in China has been considerably faster. The supermarket sector remains highly
fragmented in China, however; the top four companies in sales, Walmart, Carrefour, RT-
MART, and China Resources Enterprise together accounted for only 35.9% of total
supermarket retail revenue in the Chinese market in 2012 (PRWEB 2012).
As supermarkets have increased their presence in China, their demand for stable
supplies of fresh fruits and vegetables meeting private quality and food safety standards
has also grown. A challenge for supermarkets has been where and how to source these
fresh fruits and vegetables, particularly given retailer concerns about food safety in
traditional procurement channels. While the majority of fresh fruits and vegetables are
still procured through the wholesale market system (Reardon et al. 2004), supermarkets
and other retailers prioritizing product traceability and cost reduction are beginning to
establish supply chains designed to circumvent the wholesale market and source closer to
the farmgate.
Direct procurement from farmers, though still rare in emerging markets, can offer
attractive benefits to companies, farmers, and governments. Companies can secure a

2
steady, safe supply of food to urban areas. For governments, such programs can boost
investment, incomes and employment in the farm sector. For farmers, direct farm
programs can offer a high value, market option with characteristics, such as quantity and
price stability and the provision of key services such as credit, technical assistance and
management skills generally unavailable in spot markets (Kirsten and Sartorius 2002;
Michelson et al. 2012), though these relationships likely introduce new production and
marketing risks (Naryayanan 2012).
China’s agrarian structure, however, presents special challenges to buyers seeking
to source directly from farmers. China’s scale and recent agrarian history present unique
opportunities and challenges for supply chain structuring and consequently small farmer
participation in quality-differentiated food markets. The geography and magnitude of
potential demand and sourcing is immense while average landholdings in the country
remain extraordinarily small and fragmented. The smallholder sector in China is made up
of more than 200 million farmers cultivating plots averaging only 0.6 hectares in 2008
(NSBC; Deng et al 2010) and farms have relatively low productive asset stocks, on
average close to 700 USD according to Rozelle et al. (2006). With farming dominated by
so many small-holder households, the transactions costs of sourcing at the farm-gate are
likely to be very high without an intermediate actor or institution such as a lead farmer or
farmer cooperative to aggregate and coordinate production and facilitate the transaction.
In other countries, Non-Governmental Organizations and farmers’ cooperatives have
served this purpose. Little is known about the structure of intermediation that is
emerging to connect small-holders to supermarkets in China.

3
The institutional and organizational structure that emerge as retailers seek to
establish more direct procurement relationships with farming communities will have
important implications for the quality and price of fresh produce available to Chinese
consumers as well as the level and stability of income for farm households participating
in these emerging value chains. This paper uses recently collected data from 35
“production bases” participating in Walmart’s Direct Farm program to describe the
Direct Farm procurement chain. We highlight the critical role played by a relatively new
set of private market actors in the Chinese rural landscape that we term “supply
companies”. These supply companies play important roles as providers of logistical
services such as transportation and cold-chain storage and, in many cases, are directly
responsible for organizing and coordinating farm production. While our analysis is
mainly descriptive, it provides, as far as we are aware, a first systematic look at the role
of supply companies in the organization of production and land tenure relationships in
farming communities participating in retail value chains.
2. Chinese Government Policies Related to Agricultural Value Chains
The Chinese agrarian sector has undergone a period of significant reform in the past three
decades. Starting in the late 1970s, the government replaced the centrally-planned
commune system with the “Household Responsibility System” (HRS), allocating what
had been collectively owned land to households through grants of 15 year land-use rights.
The transition from communes to the HRS has been associated with significant increases
in agricultural productivity and decreases in rural poverty (Lin 1992).

4
Since 2000, the central government has initiated a second generation of reform policies
designed to promote agricultural development and strengthen agricultural production and
marketing among small farmers, at least three of which are relevant to our research: the
Dragon-Head Company Program, the Farmer Cooperative program, and the Direct Farm
Program.
In 2002, the government began a lending program to promote agricultural
industrialization and contracting between large agribusiness and small farmers, the
Dragon-Head Companies Program. Under this program, the government granted special
status to companies meeting criteria related to size, technology, and potential to improve
farm incomes. (Gale and Callender, 2005). Dragon Head companies are granted special
tax status as well as access to loans with favorable terms through China’s Agricultural
Development Bank. Designated Dragon Head firms agree to develop systems that
improve farmers’ market access, credit access, and technology use (Guo et al. 2007). The
Dragon Head program now exists at the provincial and municipal levels and includes
more than 60,000 firms (Zhang 2013).
Since the late 1990s, the government has played an active role in forming and
strengthening farmer cooperatives through Ministry of Agriculture programs providing
services including financial and credit support, tax exempt status, marketing information,
cash grants and subsidies, and technical training (Deng 2010). A 2006 law granted formal
legal status to registered cooperatives (Sonntag et al, 2005); with formal legal status,
cooperatives could sign contracts and act as businesses. According to the Ministry of
Agriculture, the number of rural cooperatives reached 180 thousand in 2008 and nearly
ten percent of farmers belonged to at least one agricultural cooperative. The period of

5
most rapid growth has been since 2000 (Deng, 2010). Xia (2011) describes the use of
contracts among cooperatives and the relationships between cooperatives and agro-
industrial firms.
Finally, at the end of 2008, the Chinese Ministries of Commerce and Agriculture
jointly issued an “Announcement to Initiate Direct Farm Pilot Programs” to promote the
modernization of the agricultural product supply chain and to facilitate linkages between
small farmers and agribusiness. The program announced by the Ministries articulated
four primary goals:
• Overcome the challenges of selling fresh agricultural produce;
• Increase farmers' income;
• Reduce transactions costs by eliminating intermediaries between farmers and
retailers
• Increase the traceability of fresh produce to better guarantee food safety and
quality.
To accomplish these goals, the government program was designed to encourage
supermarkets, agricultural wholesalers and agricultural cooperatives to engage in “Direct
Farm Program” relationships. For example, supermarkets would purchase fresh
agricultural product directly from farmers on farm bases1
1 A farm base or agricultural production base connotes a scale of land with specialization of production, uniformly managed in terms of production and input use spraying. Farm bases usually work with enterprises or cooperatives in vertically integrated production and sourcing relationships.
, build and use cold chain
storage, invest in food safety testing equipment and build distribution centers located in
the county or city where the farm base is located.
6
At the end of 2008, the Ministries of Agriculture and Commerce included nine
supermarkets as pioneer enterprises in the pilot Direct Farm program. The government
provided support through organizing trade forums and conferences to facilitate
communication between supermarkets and farmer cooperatives, motivating local
government to finance cold chain storage and distribution centers to increase
supermarkets' ability to supply product and providing training classes for supermarket
and cooperatives.
In 2009, the Chinese government expanded the Direct Farm pilot by announcing a
certification and financial incentive program for Direct Farm programs in 13 provinces
and two cities. Individual direct farm programs consisting of a supermarket and
agricultural product circulation companies/cooperatives that satisfy specific registered
capital, financial investment and partnership requirements could apply for an official
“direct farm” certification. Once certified, the program is in theory eligible for a financial
incentive of 2 million yuan; 1.5 million yuan for cold chain storage or distribution
centers, 300,000 yuan for food safety testing equipment systems, and 200,000 yuan for
farm base product brand building program.
An increasing number of supermarkets in China have started direct farm
programs, including local supermarkets, national level domestic large supermarkets such
as Vanguard, and multinational supermarkets such as Carrefour and Metro. Walmart
provides an excellent case study to examine the organizational structure and the
contractual arrangements between the supply companies and participating farmers as
Walmart was one of nine supermarkets involved in the first round pilot program and uses
a model similar to other supermarkets. Currently, products marketed under Walmart’s

7
Direct Farm program include fresh vegetables, fruits, meats, grains and seafood. In the
stores (Walmart Stores and Sam’s Club) these products are labeled with a Walmart direct
farm logo and sold in a special section. As of the end of 2011, Walmart’s direct farm
program was sourcing products from 81 farm bases in 23 provinces.
3. Data Collection
As part of a broader study on the impacts of Direct Farm programs on rural
development, in October through December, 2012, researchers from the Center for
Chinese Agricultural Policy (CCAP), the University of California, Davis, and Columbia
University conducted interviews with farm leaders, supply company management and
local government officials in the locales of 38 out of 44 of the fruit and vegetable
production bases participating in Walmart’s Direct Farm program in China. These
production bases are located in the following 15 provinces: Shandong (6), Liaoning (5),
Beijing (4), Guangdong (4), Xinjiang (4)I, Sichuan (3), Yunnan (2), Fujian (2), Jiangxi
(2), Shanghai (2), Hunan (1), Hubei (1), Hebei (1), and Jiangsu (1).2
In each survey PB location, we interviewed a range of people to complete three
separate surveys. First, the production base survey was completed by interviewing the
manager of the supply company and the production base manager, who was typically the
The interviews were
carried out two research teams consisting of one senior research fellow and several
graduate students from CCAP.
2 The number in parentheses is the number of Walmart production bases in the province. Six fruit and vegetable production bases were excluded for because of local coordination issues. The excluded production bases were in Hainan (1), Shanxi (2), Zhejiang (1) and Hubei (1).
8
head of the local cooperative.3
Completing the interviews typically required 2 full days on-site. County-level
government officials were interviewed on the first morning. In order to avoid potential
biases related to officials’ relationships with specific retailers, no specific mention was
made about Wal-mart’s Direct Farm program; instead we justified the survey as an effort
to understand the dynamics of agricultural product markets. Following the completion of
the county-level survey, the research team visited the Walmart production base to
interview the production base manager and the manager from the supply company who is
responsible for managing production relationships and contracts with the production
base. Completion of the production base survey form required, on average, 4 hours.
After completing the production base survey, the research team then administered the
The production base survey collects information on the
organizational structure of the production base, including land tenure and labor relations,
as well as information on cropping portfolios, farming practices, marketing, and contract
terms between the supply company and individual farmers. The remaining two surveys
were conducted with government officials at the township and county levels. These
surveys collected basic socio-economic information about the township and county in
which the production base was located as well as information on specific government
policies and involvement in Direct Farm programs. To complete these survey forms, we
interviewed officials from the local Bureau of Agriculture and, in some cases, also from
other administrative offices, such as the Bureau of Commerce, Bureau of Transportation,
and Bureau of Livestock.
3 In some cases, the supply company manager and the production base manager were the same individual. This occurred when the supply company rented in land and directly controlled production through a wage labor or sub-leasing arrangement.
9
township-level survey with either the head or deputy head of the township, who is in
charge of agricultural development issues in the township.
While conducting the fieldwork, it became immediately apparent that
relationships between the supply company and the farmers participating in the production
base were heterogeneous and, often-times, complex. As we will discuss in later sections,
this complexity and heterogeneity is interesting as it suggests both that the supply
companies are playing multiple, complex roles and that these roles are different
depending on crop, region and other factors. For now, however, we also note that this
complexity created challenges to data collection. As mentioned above, for the production
base survey, we often interviewed two people. The first was the leader/representative of
the production base. When the production base was comprised of owner-operated farms,
this was typically the leader of the village cooperative. When the land had instead been
consolidated by the supply company, this was typically a farm manager who had been
hired by the supply company to manage and coordinate production. The second person
was a manager or representative from the supply company that received the purchase
orders from Walmart. Given that some of the supply companies are quite large
operations, this individual was often based at the supply company’s headquarters. For
example, two of the largest supply companies are Golden Mao and Xingyeyuan, which
are based in Shenzhen and Dalian respectively.
Determining the true relationship between the supply company and the production
base was often difficult as conflicting answers were often initially given by the
production base manager and the supply company representative. The complexity of
understanding this relationship hinged on two factors. First, the greater is the degree of
control of production by the supply company (for example when the supply company
10
rents in village land and sets up a wage –labor based farm), the less complex was data
collection. This is because the supply companies typically maintained centralized and
relatively good records that permitted easy responses to questions about production and
contracts. In contrast, when the production base is controlled by a large number of
owner-operated family farms, the production base leader (cooperative head) typically was
less able to provide high quality information about the many different farms. Second, the
greater was the number of supply companies to whom the production base supplied fresh
produce, the more challenging was the data collection. Once again, since production
bases dominated by owner-operated small farms typically engaged in supply relationships
for a number of crops and with a number of different supply companies, data collection
was most challenging with them.
4. Description of Direct Farms
We begin with a description of the prevalence of Direct Farms (associated with
Walmart or any other retailer) in the 34 counties from our survey. Table 1 shows that
Direct Farms in the surveyed counties experienced rapid growth since 2007, when a
supportive policy to encourage its development was launched jointly by Ministry of
Agriculture and Ministry of Commerce of China. In the 34 counties we visited there are
463 townships in total. Of these, 24% had a Direct Farm in 2012, whereas only 4% had a
Direct Farm in the initial year of the government’s policy. In early years of the program,
the prevalence of Direct Farms selling to foreign supermarkets was slightly higher than
that of Direct Farms selling primarily to their domestic counterparts. By 2008, however,
this changed as domestic supermarkets became relatively more important in sourcing
from Direct Farms. By 2012, about 17% of the 463 townships had at least one Direct

11
Farm selling to domestic supermarkets, which nearly doubles the prevalence of foreign
supermarkets procuring from Direct Farms. Interestingly, our survey shows that some
Direct Farms were already operating before the policy launched in 2007, suggesting that
some supermarkets had already begun sourcing more directly from farming communities
before the government introduced their promotional policies.
[TABLE 1 ABOUT HERE]
Table 2 presents the same information as Table 1 for the subset of townships with a
Direct Farm selling to Walmart. As these farms are the object of our study, 100% of
these townships had a Direct Farm in 2012 (the year of the survey). Not surprisingly, the
prevalence of Direct Farms in the surveyed townships is significantly higher than in the
full population of townships in the surveyed counties. Also not surprisingly, the
prevalence of Direct Farms selling to domestic supermarkets is consistently lower than
those selling to foreign supermarkets and that gap increases over time.
[TABLE 2 ABOUT HERE]
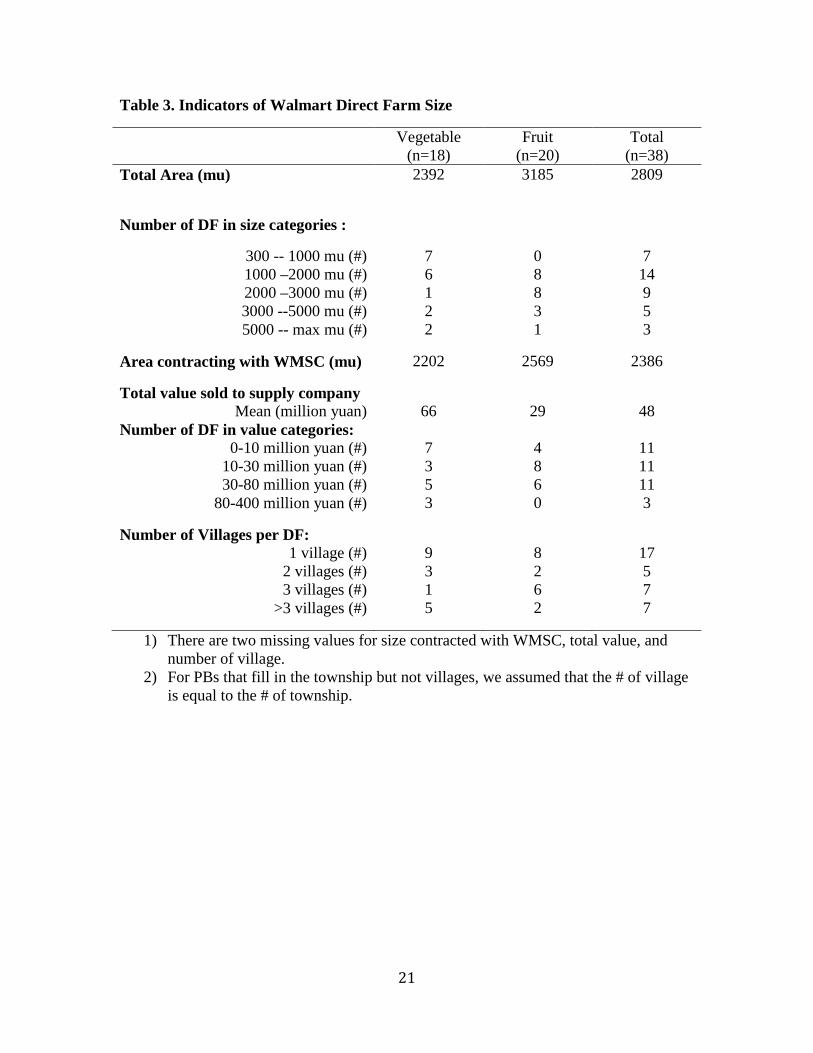
Table 3 provides basic information of the size of surveyed Direct Farms. The
average area of Direct Farms is about 2,800 mu (or about 187 ha.), but differs between
vegetable and fruit farms, with Direct Farms specializing in fruit about thirty percent
larger than those specializing in vegetables. Table 3 shows that 16 out of the 20 fruit
bases range between 1000 and 3000 mu, while 13 of the 18 vegetable bases are under
2,000 mu.
Table 3 also indicates that, on average, 85% (2386/2809) of total area of the Direct
Farms is contracting with the supply company that is contracting with Walmart. This is
12
not surprising given the Direct Farms were selected because of the existence of Walmart
supply company. However, it is interesting to note that, in most of the Direct Farms, the
contractual relationship is not exclusive; the Direct Farms typically sell to a range of
intermediaries including the Walmart supply company and other supply companies. As
we will see shortly, in most cases the Walmart supply company only accounts for a small
proportion of the total value of fresh produce purchased from the Direct Farm.
[TABLE 3 ABOUT HERE]
Given China’s land tenure system, coordination from village or higher-level
government leadership is likely to be important for the establishment of a Direct Farm.
As such, we anticipated that it would be quite difficult to establish multi-village Direct
Farms. It was somewhat surprising, therefore, to learn that in fact, this is quite common
and there is no remarkable difference between fruit and vegetable Direct Farms.
Table 4 presents information about the number and types of crops grown by the
surveyed Direct Farms. The most important distinction is that vegetable Direct Farms
grow a significantly larger number of crops, just over 16 on average, than fruit-based
Direct Farms, which typically specialize in a single fruit.
[TABLE 4 ABOUT HERE]
For production bases which were not own-operated by farmers, we also asked how
the SC acquired the land and how farmers participated in the land use4
4 As we mentioned earlier, in many cases it is difficult to distinguish farmers cooperatives from WM supply company. According to the Ministry of Agriculture
. Table 5 shows
13
that among 20 Direct Farms there is only one was rented directly by the SC from
individual farmers, while all of the rest of the Direct Farms had to rent in through village
leaders or farmers cooperatives5
. This is not surprising given the fact that land area
owned by Chinese individual farmers is usually small, being less than one mu per person
in the nation. Directly negotiating and contracting with individual farmers for SC in most
cases is practically impossible. Table 5 also indicates that farmer’s land had been
somehow consolidated prior to WM SC renting it in for establishing the production base.
The average area rented by SC is 2,457 mu (or about 164 ha) for wage-labor PB, and
2,195 mu (or about 146 ha). For Direct Farms with a mixed operational model, the land
size is quite small, being only 1,324 mu (or 88 ha).
[TABLE 5 ABOUT HERE]
Farmer’s participation in Direct Farms differs by operational model. For Direct
Farms which are operated in sublease model, that is, the SC rented in land, made some
investment (such as greenhouse, irrigation system), and then rented back to individual
farmers. It is unnecessary that the farmers to whom the land subleased to have to be those
who rented out their land directly or indirectly to the SC. In fact, the SC land often is
leased to farmers from outside of the villages where the Direct Farm is located. In Table
6, we see that there are about 15% of households who rented the well-invested land from and Ministry of Commerce of China, to establish direct farm, retailers have to directly procure 5 Land ownership in rural China, according to the HRS, is largely belong to village collective, while individual farmers in the village hold the right of occupancy. So, when we say that SC rents land from village leaders or farmers cooperative, it actually means village leaders or farmer cooperative are coordinating the land acquisition and signing leasing contract with SC on farmers’ behavior. This is because in most cases it’s often impossible or economically nonsense for SC to directly negotiate and contract with individual farmers for land acquisition.

14
SC were from other villages in the county, and near 30% are from outside of the county.
For wage-labor PBs, even more farmers hired by the PBs were from outside of the
county, and near half of them were actually from other provinces.
Three things in Table 6 should be highlighted. First, the number of households for
PBs operated by sublease receivers (136 households) and land owners (420 households)
indicates the low bound of individual farmers involved. This is because the SC often
works with household for business activities (such as contracting, procurement etc) for
these two models rather than with individual farmers. So, in many cases it is difficult for
the representative of SC or the head of PB to tell the numbers of labors involved in the
production6
6 According to our research agenda, we will have phase two survey in which we will survey individual households in the selected PBs to gain information of individual labor participation. By doing so, we will be able to empirically measure the effects of “DF” on rural labor participation and the welfare achievements to them due to the “DF”.
. Second, the number of owner-operated households who participated in the
WM “DF” is a kind of loosing concept. During the survey, we learned that the SC or their
collaborators (such as long-time relationship vender) often procure products from outside
of the PB area. This could be either because the products from their PB cannot meet order
demand, in both quality and quantity dimensions, or because the SC wants to procure and
store more for anti-seasonal benefits, or other reasons. As their management system to
separate PB products from outside products is often not as good as their claimed, it is
actually difficult or sometime impossible for them to exactly tell the number of owner-
operated households. The number (420) reported in table 6 hereby mainly reflects the
number of owner-operated farmers who the SC has a relatively stable relationship. It is
not surprising for SC to procure products from outside of the PB. Finally, in the survey,
we did not ask where owner-operated farmers are from because we presumed 100% are

15
local villagers considering land ownership. However, we did find that many owner-
operated lands were indeed not operated by the land owners who hold right of occupancy
under the HRS land tenure system. In many cases, these lands were operated by the
owner’s relatives or the villagers in their village, but there were also some cases in which
the land was rented to migrants from outside of the area or some agricultural extension
persons by various types of agreements. Major differences from the sublease and wage-
labor models are that these lands are still operated by individual family and the land tends
to be smaller. This kind of model (we still called it owner-operated) can often be seen in
PBs of products which have ordinary value, but it is very uncommon for high value
products such as in two grape PBs in Bingchuan, Yuannan, and in the honey-dew or
cantaloupe PB in Hamin, Xinjiang.
[TABLE 6 ABOUT HERE]
We now turn to investment and infrastructure across the Direct Farms. There are
various infrastructures in the Direct Farms, but investments differ between vegetable and
fruit production bases. For all types of infrastructures listed in Table 7, vegetable PBs are
more likely to have than fruit PBs do, particularly for greenhouse and worker’s
dormitory. For example, near 80% of surveyed vegetables bases have greenhouse, which
versus 26.3% for fruit bases. Also, the percentage of PBs providing worker housing is
also significantly higher for vegetable PBs than for fruit PBs. However, the average
investment on cold chain and warehouse is much greater for fruit PBs than vegetables.
Relatively shorter harvesting season for fruit than vegetable is probably the primary
reason for fruit PBs to invest more on warehouse and cold chain than vegetable PBs.

16
[TABLE 7 ABOUT HERE]
The infrastructure investment sources vary by crop and infrastructure type. Table 8
compares the identities of who made certain types of investments by fruit versus
vegetable based Direct Farms. For greenhouse, over 80% of vegetable PBs received
government investment, which doubles the number for fruit PBs. Also, there are 50% of
vegetable PBs and 40% of fruit PBs received investment for greenhouse from supply
companies. For warehouse, cold chain, and worker accommodation were largely invested
by supply companies. This is the same for both vegetable and fruit PBs. Investments on
irrigation system on vegetable PBs were mostly from SC or local government, while
farmers were still the primary investors for irrigation for fruit PBs.
Table 9 shows the frequencies of various levels of certifications acquired by the
Direct Farms. In addition to infrastructures, applying for and holding food safety-related
certificates is another key investment as it may determine the price farmers receive and it
may be required to participate in various types of markets. For vegetable PBs we visited,
there were 41%, 18% and 35% and 60% of them holding green food, organic, and other
private certificates, respectively. Table 9 also shows that the cost to get these certificates
was mainly covered by the SC who directly or indirectly (but closely) works with the PB.
This is especially true for vegetable PBs. This is not surprising as we saw earlier that
most of vegetable PB lands were controlled by SC. Apparently, holding occupancy rights
of land gives the SC more incentives to apply these certificates. Considering the same
reason, we were expecting a very small proportion of fruit PB holding these kinds of
17
certificates as fruit PBs were mostly owner-operated. Surprisingly, these numbers are
even higher in fruit PBs, approximately by 20% for every certificate than vegetable PBs.
5. Discussion
The way by which the value chains for fresh fruit and vegetables develop in China can
have important implications for both the price and quality of food available to Chinese
consumers but also, and the focus of this paper, for the development of rural communities
in China. In particular, the institutional structures that emerge will play an important role
in determining whether or not and how small-holder households participate in these value
chains and the flow of benefits to these households.
Our initial exploration of Walmart’s Direct Farm program provides some initial insights
into these questions. We find that, while the Direct Farms program provides a means for
produce to arrive on retail shelves without having passed through the traditional
wholesale market, the program is far from “direct”. Instead, a newly emerging sector of
private intermediaries, which we call Supply Companies, plays a critical role in
organizing and coordinating production. The degree to which benefits of selling into
these value chains ultimately pass through to small-holders is a question that remains
open and will be explored in future research.

18
References
Deng, H., Huang, J., Xu, Z., & Rozelle, S. (2010). Policy support and emerging farmer
professional cooperatives in rural China. China Economic Review, 21(4), 495–507.
Gale, F., & Callender, R. (2007). New directions in China’s agricultural lending. DIANE
Publishing. Retrieved from http://books.google.com/books?hl=en&lr=&id=-e7-
PFUcQzwC&oi=fnd&pg=PP7&dq=New+Directions+in+China%E2%80%99s+Agricultu
ral+Lending+&ots=4wEv4_zrXv&sig=EBOk5psPIWVlLG0s1GX4HykgPvc
Guo, H., & Jolly, R. W. (2008). Contractual arrangements and enforcement in transition
agriculture: theory and evidence from China. Food Policy, 33(6), 570–575.
Hu, D., Reardon, T., Rozelle, S., Timmer, P., & Wang, H. (2004). The emergence of
supermarkets with Chinese characteristics: challenges and opportunities for China’s
agricultural development. Development Policy Review, 22(5), 557–586.
Jia, X., & Huang, J. (2011). Contractual arrangements between farmer cooperatives and
buyers in China. Food Policy, 36(5), 656–666.
Kirsten, J., & Sartorius, K. (2002). Linking agribusiness and small-scale farmers in developing
countries: is there a new role for contract farming? Development Southern Africa, 19(4),
503–529.
Lin, J. Y. (1992). Rural reforms and agricultural growth in China. The American Economic
Review, 34–51.
Michelson, H., Reardon, T., & Perez, F. (2012). Small Farmers and Big Retail: trade-offs of
supplying supermarkets in Nicaragua. World Development, 40(2), 342–354.

19
Narayanan, S. (2012). Safe gambles? Farmer perceptions of transactional certainty and risk-
return tradeoffs in contract farming schemes in Southern India. Indira Gandhi Institute of
Development Research, Mumbai, India. Retrieved from
http://www.igidr.ac.in/pdf/publication/WP-2012-021.pdf
NSBC. (n.d.). Chinese National Bureau of Statistics.
PRWEB. (n.d.). Supermarkets in China Industry Research Report. Retrieved from
http://www.prweb.com/releases/2012/12/prweb10192005.htm
Reardon, T., Timmer, P., & Berdegue, J. (2004). The rapid rise of supermarkets in developing
countries: induced organizational, institutional, and technological change in agrifood
systems. Electronic Journal of Agricultural and Development Economics, 1(2), 168–183.
Rozelle, S., & Huang, J. (2006). China’s horticultural economy: A report for the western
growers association. Davis, CA: University of California, Davis Working Paper.
Sonntag, B. H., Huang, J., Rozelle, S., & Skerritt, J. H. (2005). China’s agricultural and rural
development in the early 21st century. Australian Centre for International Agricultural
Research (ACIAR). Retrieved from
http://www.cabdirect.org/abstracts/20053122955.html
Zhang, Q. F. (2012). The Political Economy of Contract Farming in China’s Agrarian
Transition. Journal of Agrarian Change, 12(4), 460–483.
Zhang, Q. F., & Donaldson, J. A. (2008). The rise of agrarian capitalism with Chinese
characteristics: Agricultural modernization, agribusiness and collective land rights. The
China Journal, (60), 25–47.

20
Appendix A. Tables
Table 1. Growth of Direct Farms in All Townships in Surveyed Counties: 2006-2012
Percentage of Counties in Surveyed Townships that Had at Least One Direct Farm in…
2006 2007 2008 2009 2010 2011 2012
Any DF 3 4 9 13 19 24 24
DF of Foreign supermarket 2 3 6 6 9 11 11
DF of Domestic supermarket 2 3 6 10 14 17 17
Table 2. Growth of Direct Farms in Townships with Walmart Direct Farm: 2006-2012 Percentage of Counties in Surveyed Townships that Had at Least
One Direct Farm in…
2006 2007 2008 2009 2010 2011 2012
Any DF 22 31 47 56 86 100 100
DF of Foreign supermarket 22 31 47 56 86 100 100
DF of Domestic supermarket 11 17 22 25 33 39 39
21
Table 3. Indicators of Walmart Direct Farm Size
Vegetable
(n=18) Fruit
(n=20) Total
(n=38) Total Area (mu) 2392 3185 2809
Number of DF in size categories :
300 -- 1000 mu (#) 1000 –2000 mu (#) 2000 –3000 mu (#) 3000 --5000 mu (#) 5000 -- max mu (#)
7 6 1 2 2
0 8 8 3 1
7 14 9 5 3
Area contracting with WMSC (mu) 2202 2569 2386
Total value sold to supply company Mean (million yuan)
Number of DF in value categories: 0-10 million yuan (#) 10-30 million yuan (#) 30-80 million yuan (#)
80-400 million yuan (#)
66 7 3 5 3
29 4 8 6 0
48
11 11 11 3
Number of Villages per DF: 1 village (#)
2 villages (#) 3 villages (#)
>3 villages (#)
9 3 1 5
8 2 6 2
17 5 7 7
1) There are two missing values for size contracted with WMSC, total value, and number of village.
2) For PBs that fill in the township but not villages, we assumed that the # of village is equal to the # of township.

22
Table 4: Direct Farm Crop Portfolios
Amount # of Crops per vegetable DF (n=18) 16.6 % of DF with Leafy Green (Short Cycle) % of DF with Leafy Green (Long Cycle)
94.4% 94.4%
% of DF with Root 50% % of DF with Legume 50% % of DF with Nightshade 66.7% % of DF with Squash 72.2% # of Crops per fruit DF (n=20) 1.2 % of DF with Tree Fruits 80% % of DF with Vine/Bush fruits 30%
Table 5. Terms of Land Acquisition by Supply Company
Wage Sublease Both
# of PB 13 2 5 % of PB rent in their land
From individual hhs 0% (0) 0% (0) 20% (1) from village leaders 69.2% (9) 100% (2) 20% (1)
from cooperative 23.1% (3) 0% (0) 60% (3) state owned land 7.7% (1) 0%(0) 0% (0)
% of PB have the following situation prior to renting in land:
Farmed by families 38.5% (5) 50% (1) 60% (3) Consolidated land and farmed by
another company 38.5% (5) 50% (1) 20% (1) collective owned land and not
farmed 23.1% (3) 0% (0) 0% (0) private owned land and not farmed 0% (0) 0% (0) 20% (1)
Mean area rented by SC (mu) 2457 2195 1324 Years since first rental
Min-5 5 1 2 6-10 7 1 2
11-max 1 0 1 Length of land contract (years)
Min-5 2 1 0 6-10 4 0 0
11-20 3 1 4 20-max 3 0 0
1) There are two missing values for Length of land contract.

23
Table 6: Terms of Participation of Households on SC Land
Model Type
Sublease (n=23)
Wage (n=7)
Owner (n=18)
Number of households or wage worker 136 106 420
Mean of percentage of households are from the following place: (%)
the same village as the land 57.1 37.5 ≤100 other villages in this county 14.3 30.2 0
other counties in this province 7.1 1.3 0 other provinces 21.4 31 0
Mean area operated by each household (mu) 39.5 12.7 10
1) The number of households for wage worker model is not very accurate. Since number of workers is reported for wage worker model, instead of number of households
2) For mean area operated by each household, 2 missing values for wage labor model and 4 missing values for owner operator model.
Table 7: Capital Investments on Direct Farms
Vegetables Fruit
%DF with the Invest.
Mean Invest. (Thousand
Yuan) %DF with the Invest.
Mean Invest. (Thousand
Yuan) Greenhouse 76.5 8,861 26.3 8,316 Warehouse 55.6 500 45 10,441 Cold Chain 66.7 1,247 52.6 10,083 Worker Housing 44.4 1,760 27.8 1,166 Irrigation 83.3 511 72.2 556 TOTAL INVESTMENT per DF NA 1,616 NA 11,188

24
Table 8: Identity of Investor on Direct Farms
Vegetables Fruit
% DF’s in which investments
were made by… % DF’s in which investments
were made by…
Farmers SC Gov. Farmers SC Gov. Greenhouse 40 50 83.3 60 40 40
Warehouse 0 100 20 0 100 20
Cold Chain 0 100 14.3 0 50 0
Worker Housing 16.7 66.7 33.3 0 100 0
Irrigation 18.2 54.5 54.5 66.7 33.3 44.4
Table 9: Investment in Certification by Direct Farms
Vegetables Fruit
% DF have
Years cert.
% SC paid
cert. fee % DF have
Years cert.
% SC paid
cert. fee Green food 41.2 5.3 83.3 63.2 4.9 55.6
Organic 17.6 1.5 50 31.6 3.7 50
Other Private 35.3 2 100 55.6 3.2 55.6