Superior Execution Deserves Multiple Rerating; Raise TP to ...
7
1 Superior Execution Deserves Multiple Rerating; Raise TP to Rs2,120 Strong Print; One More Revenue Guidance Upgrade 2QFY22 revenue is at US$3.99bn, which is 110bps above our estimate of US$3.95bn. The sequential constant currency growth is at 6.3% vs. our estimate of 5% (consensus: 6%), driven by a broad-based growth across industries. EBIT margin stood at 23.6%, substantially ahead of our estimate of 22.2%, driven by a better-than-expected operating leverage and lower- than-expected wage inflation. Net profit stood at Rs54.2bn, which is 3.4% above our estimate of Rs52.1bn, driven by an outperformance in both revenue growth and EBIT margin. Large deal signings remained healthy at US$2.15bn. Management’s commentary on the demand environment and deal pipeline remained strong. Infosys (INFO) upgraded its FY22 revenue growth guidance at 16.5-17.5% in CC terms vs. the prior 14-16%. Additionally, the company retained the EBIT margin guidance at 22-24%. We expect INFO to continue to gain market share in the current technology upcycle. We have raised the FY22E-FY24E EPS estimates by (0.1)-3.9% (previous note of Mar’21) driven by an improved revenue growth visibility. We retain the BUY recommendation and raise the target price to Rs2,120 (vs. the prior Rs1,920) and value the stock at 28.5x (earlier 27x) FY24E earnings. Broad-based Growth Across Verticals; Sharp Attrition Spike In Line With Larger Peers (1) Digital revenue reported a growth of 42.4% YoY and is at ~56% of revenue. (2) INFO reported a broad-based revenue growth across verticals and geographies, and the growth was led by North America and manufacturing vertical. (3) Voluntary LTM attrition in IT services stood at 20.1%, compared to 13.9% in 1QFY22. Management expects the high attrition to ease in the next couple of quarters. (4) During 2QFY22, the company added a net work force of ~11.6k employees. It targets to hire 45k (vs. the earlier 35k target) graduates over FY22. (5) INFO stated it will launch a new company structure in the coming weeks. 6) The board has announced an interim dividend of Rs15/share. Execution Surprise Led by Operating Efficiencies INFO reported 2QFY22 EBIT margin of 23.6% (10bps QoQ), which was 110bps higher than consensus, as operating efficiencies (80bps), lower SG&A cost (50bps) and Fx gain (20bps) offset wage inflation (110bps) and a rise in sub-contractor cost (40bps). Additionally, we expect a limited margin upside for FY22 due to a higher SG&A cost (higher attrition and resumption of offices) and accelerated hiring over the next two quarters. We estimate an EBIT margin of 24-24.7% over FY22E-FY24E. Superior Execution Deserves Premium Valuation At CMP, INFO trades at 26.4x/23.0x FY23E/FY24E EPS, which is at 10% discount to the larger peer TCS. Going forward, we expect INFO to report a superior growth vs. the top 4 Indian IT peers, driven by a surge in large deals and acceleration in the digital revenue share. Also, a stable management keeps INFO in a better position to make bolder decisions and pursue aggressive market share gain. We believe the stock deserves a rerating, considering the industry-leading double-digit revenue growth, rising share of digital business (56% of revenue), elevated EBIT margin levels vs. pre-Covid levels and a consistent capital allocation policy. Thus, we retain the BUY recommendation. We have shifted to a 1-year target price from the earlier 2-year. As we enter 2HFY22, instead of rolling forward our valuation, we maintain it based on FY24E earnings and shift to a 1-year target price of Rs2,120. Share price (%) 1 mth 3 mth 12 mth Absolute performance 1.1 16.7 50.0 Relative to Nifty (3.4) 1.8 (1.8) Recos/View Old Revised Change Recos BUY BUY n Price Target (Rs) 1,920 2,120 h h Upgrade n Maintain i Downgrade Change of Estimates (% change) FY22E FY23E FY24E Net revenues 1.8 2.6 3.0 EBIT 0.2 2.5 3.5 Net Profit (0.7) 1.7 3.0 EPS (Rs) (0.1) 2.4 3.9 1 Year Stock Price Performance Note: * CMP as on October 13, 2021 800 1000 1200 1400 1600 1800 2000 Oct-20 Nov-20 Nov-20 Dec-20 Jan-21 Jan-21 Feb-21 Mar-21 Mar-21 Apr-21 May-21 Jun-21 Jun-21 Jul-21 Aug-21 Aug-21 Sep-21 Oct-21 Key Financials Y/E Mar (Rs mn) FY20 FY21 FY22E FY23E FY24E Revenue 9,07,910 10,04,730 12,01,936 13,77,437 15,47,858 EBIT 1,93,740 2,46,220 2,88,673 3,34,433 3,82,846 PAT 1,65,950 1,93,410 2,33,099 2,72,469 3,12,228 Diluted EPS (Rs) 39.0 45.4 55.3 64.7 74.2 P/E (x) 43.8 37.6 30.9 26.4 23.0 EV / EBITDA (x) 34.0 27.3 23.2 20.5 18.4 RoE (%) 25.4 27.1 30.8 34.0 33.7 Dividend Yield (%) 2.6 1.4 1.0 1.6 2.0 Source: RSec Research Infosys IT | India Institutional Equity Research 2QFY22 Result Update | 14 October, 2021 BUY 1 Year Target Price: Rs2,120 CMP* (Rs) 1,705 Upside/ (Downside) (%) 24 Bloomberg Ticker INFO IN Market Cap. (Rs bn) 7,269 Research Analyst: Suyog Kulkarni, CFA Contact: (022) 41681371 / 9890966735 Email: [email protected] Research Associate: Chaitanya Panchmatia Contact : (022) 41681371 / 8080782900 Email : [email protected] Please refer to the last page for change in rating guideline and time horizon for target price.
Transcript of Superior Execution Deserves Multiple Rerating; Raise TP to ...

1
Superior Execution Deserves Multiple Rerating; Raise TP to Rs2,120Strong Print; One More Revenue Guidance Upgrade 2QFY22 revenue is at US$3.99bn, which is 110bps above our estimate of US$3.95bn. The sequential constant currency growth is at 6.3% vs. our estimate of 5% (consensus: 6%), driven by a broad-based growth across industries. EBIT margin stood at 23.6%, substantially ahead of our estimate of 22.2%, driven by a better-than-expected operating leverage and lower-than-expected wage inflation. Net profit stood at Rs54.2bn, which is 3.4% above our estimate of Rs52.1bn, driven by an outperformance in both revenue growth and EBIT margin. Large deal signings remained healthy at US$2.15bn. Management’s commentary on the demand environment and deal pipeline remained strong. Infosys (INFO) upgraded its FY22 revenue growth guidance at 16.5-17.5% in CC terms vs. the prior 14-16%. Additionally, the company retained the EBIT margin guidance at 22-24%. We expect INFO to continue to gain market share in the current technology upcycle. We have raised the FY22E-FY24E EPS estimates by (0.1)-3.9% (previous note of Mar’21) driven by an improved revenue growth visibility. We retain the BUY recommendation and raise the target price to Rs2,120 (vs. the prior Rs1,920) and value the stock at 28.5x (earlier 27x) FY24E earnings.
Broad-based Growth Across Verticals; Sharp Attrition Spike In Line With Larger Peers(1) Digital revenue reported a growth of 42.4% YoY and is at ~56% of revenue. (2) INFO reported a broad-based revenue growth across verticals and geographies, and the growth was led by North America and manufacturing vertical. (3) Voluntary LTM attrition in IT services stood at 20.1%, compared to 13.9% in 1QFY22. Management expects the high attrition to ease in the next couple of quarters. (4) During 2QFY22, the company added a net work force of ~11.6k employees. It targets to hire 45k (vs. the earlier 35k target) graduates over FY22. (5) INFO stated it will launch a new company structure in the coming weeks. 6) The board has announced an interim dividend of Rs15/share.
Execution Surprise Led by Operating Efficiencies INFO reported 2QFY22 EBIT margin of 23.6% (10bps QoQ), which was 110bps higher than consensus, as operating efficiencies (80bps), lower SG&A cost (50bps) and Fx gain (20bps) offset wage inflation (110bps) and a rise in sub-contractor cost (40bps). Additionally, we expect a limited margin upside for FY22 due to a higher SG&A cost (higher attrition and resumption of offices) and accelerated hiring over the next two quarters. We estimate an EBIT margin of 24-24.7% over FY22E-FY24E.
Superior Execution Deserves Premium Valuation At CMP, INFO trades at 26.4x/23.0x FY23E/FY24E EPS, which is at 10% discount to the larger peer TCS. Going forward, we expect INFO to report a superior growth vs. the top 4 Indian IT peers, driven by a surge in large deals and acceleration in the digital revenue share. Also, a stable management keeps INFO in a better position to make bolder decisions and pursue aggressive market share gain. We believe the stock deserves a rerating, considering the industry-leading double-digit revenue growth, rising share of digital business (56% of revenue), elevated EBIT margin levels vs. pre-Covid levels and a consistent capital allocation policy. Thus, we retain the BUY recommendation. We have shifted to a 1-year target price from the earlier 2-year. As we enter 2HFY22, instead of rolling forward our valuation, we maintain it based on FY24E earnings and shift to a 1-year target price of Rs2,120.
Share price (%) 1 mth 3 mth 12 mth
Absolute performance 1.1 16.7 50.0
Relative to Nifty (3.4) 1.8 (1.8)
Recos/View Old Revised Change
Recos BUY BUY n
Price Target (Rs) 1,920 2,120 h
h Upgrade n Maintain i Downgrade
Change of Estimates(% change) FY22E FY23E FY24E
Net revenues 1.8 2.6 3.0
EBIT 0.2 2.5 3.5
Net Profit (0.7) 1.7 3.0
EPS (Rs) (0.1) 2.4 3.9
1 Year Stock Price Performance
Note: * CMP as on October 13, 2021
800
1000
1200
1400
1600
1800
2000
Oct
-20
Nov
-20
Nov
-20
Dec
-20
Jan-
21
Jan-
21
Feb-
21
Mar
-21
Mar
-21
Apr
-21
May
-21
Jun-
21
Jun-
21
Jul-2
1
Aug
-21
Aug
-21
Sep-
21
Oct
-21
Key FinancialsY/E Mar (Rs mn) FY20 FY21 FY22E FY23E FY24ERevenue 9,07,910 10,04,730 12,01,936 13,77,437 15,47,858EBIT 1,93,740 2,46,220 2,88,673 3,34,433 3,82,846PAT 1,65,950 1,93,410 2,33,099 2,72,469 3,12,228Diluted EPS (Rs) 39.0 45.4 55.3 64.7 74.2 P/E (x) 43.8 37.6 30.9 26.4 23.0 EV / EBITDA (x) 34.0 27.3 23.2 20.5 18.4 RoE (%) 25.4 27.1 30.8 34.0 33.7 Dividend Yield (%) 2.6 1.4 1.0 1.6 2.0
Source: RSec Research
InfosysIT | India
Institutional Equity Research
2QFY22 Result Update | 14 October, 2021
BUY1 Year Target Price: Rs2,120
CMP* (Rs) 1,705
Upside/ (Downside) (%) 24
Bloomberg Ticker INFO IN
Market Cap. (Rs bn) 7,269
Research Analyst: Suyog Kulkarni, CFA
Contact: (022) 41681371 / 9890966735Email: [email protected]
Research Associate: Chaitanya Panchmatia
Contact : (022) 41681371 / 8080782900Email : [email protected]
Please refer to the last page for change in rating guideline and time horizon for target price.

2
InfosysIT | India
Institutional Equity Research
BUYTarget Price: Rs2,120
CMP* (Rs) 1,705
Upside/ (Downside) (%) 24
Bloomberg Ticker INFO IN
Quarterly Performance
YE March (Rs mn) 2QFY22 2QFY21 YoY (%) 1QFY22 QoQ (%) RSec - Est Deviation from
our est. (%)
Revenue (US$mn) 3,998 3,312 20.7 3,782 5.7 3,956 1.1
Revenue 2,96,020 2,45,700 20.5 2,78,960 6.1 2,92,742 1.1
EBIT 69,720 62,280 11.9 66,030 5.6 64,984 7.3
Net income 54,210 48,350 12.1 51,950 4.4 52,090 4.1
Diluted EPS (Rs) 12.9 11.4 13.0 12.2 5.2 12.3 4.9
Margin Analysis (%) Change in BPS Change in BPS
EBIT 23.6 25.3 (180) 23.7 (12) 22.2 140
Net Income 18.3 19.7 (137) 18.6 (31) 17.8 50
Source: Company, RSec Research
Conference Call – Key Takeaways f Revenue growth during the quarter was at 6.3%/19.4% QoQ/YoY in constant currency.
This was the fastest quarterly YoY growth in 11 years.
f The company recorded a broad-based double-digit growth across geographies and verticals. The largest sector, financial services, grew by 20.5% YoY, followed by manufacturing (42.5% YoY), retail (17.2% YoY) and life sciences (26.1% YoY). In terms of geographies, North America grew by 23.1% YoY, followed by Europe at 19.6% YoY.
f Digital business grew by 42% and is now 56% of the revenue. Within digital, cloud is growing faster and Cobalt cloud capabilities are resonating well with clients.
f The company recorded 22 large new deals (more than US$50mn) totaling to US$2.15bn. Of the total deals, 5 each were from financial services and energy & utility vertical, 3 each were from retail and manufacturing and one each from life sciences and other verticals. Region-wise, 15 deals were from Americas, 6 were from Europe and 1 from RoW. The share of new deals in 2QFY22 is at 37%.
f Voluntary LTM attrition in IT services stood at 20.1%, compared to 13.9% in 1QFY22. Management expects the high attrition to ease in the next couple of quarters. Utilization rose to 89.3%. During 2QFY22, INFO added a net work force of ~11.6k employees. It targets to hire 45k (vs. the earlier target of 35k) graduates over FY22.
f INFO reported 2QFY22 EBIT margin at 23.6% (10bps QoQ), as operating efficiencies (80bps), lower SG&A cost (50bps) and Fx gain (20bps), which largely offset the wage inflation (110bps) and a rise in sub-contractor cost (50bps).
f The company raised FY22 revenue growth guidance to 16.5-17.5% in CC terms vs. the prior 14-16%. Additionally, it retained the EBIT margin guidance of 22-24%.
Key Risks f Aggressive technology spending cuts by the large US banks
f Increased competitive intensity driven by IT players, SaaS companies and Hyperscalers
f Stricter immigration laws may delay project ramp-up and completion
f Lower-than-expected success of continued cost efficiency projects
f Unfavourable currency movement

3
InfosysIT | India
Institutional Equity Research
BUYTarget Price: Rs2,120
CMP* (Rs) 1,705
Upside/ (Downside) (%) 24
Bloomberg Ticker INFO IN
Estimate Change & Revision in Target Price
Revised vs. Old EstimatesY/E Mar FY22E FY23E FY24E
(Rs mn) Old Revised Change (%) Old Revised Change (%) Old Revised Change (%)
Revenue (US$mn) 15,949.0 16,139.4 1.2 17,904.0 18,365.8 2.6 19,781.0 20,366.6 3.0
Revenue 11,80,257 12,01,936 1.8 13,42,789 13,77,437 2.6 15,03,340 15,47,858 3.0
EBIT 2,88,008 2,88,673 0.2 3,26,138 3,34,433 2.5 3,69,828 3,82,846 3.5
EBIT Margin (%) 24.4 24.0 (40)bps 24.3 24.3 0bps 24.6 24.7 10bps
Reported Net Profit 2,34,771 2,33,099 (0.7) 2,68,005 2,72,469 1.7 3,02,999 3,12,228 3.0
Net Profit Margin (%) 19.9 19.4 (50)bps 20.0 19.8 (20)bps 20.2 20.2 0bps
EPS 55.3 55.3 (0.1) 63.2 64.7 2.4 71.4 74.2 3.9
Source: RSec Research
ESG Analysis
While analyzing 20 key criteria (10 points each) under ESG Matrix, we have assigned an overall score of 83% to Infosys. Under “Environmental Head”, we have assigned 86% score,as the company has already achieved carbon neutral status. Under “Social Head”, we have assigned 81% score, as the company scores high on customer satisfaction, gender diversity and CSR spend. Under “Governance Head”, we have assigned 81% score in light of high score due to no political contribution and independent audit committee
For detailed report on our ESG analysis of INFY, please click here (please refer to page no.59 for detailed ESG analysis).
We raised our revenue estimates by 1.2-3% over FY22E driven by consistent deal wins. Additionally, we expect slight moderation in FY22E EBIT margin driven by higher attrition and accelerated hiring. We raise our FY22E-FY24E EPS estimates by (0.1)-3.9% driven by improved revenue growth profile, updated fx, reduced share count (compared to our March-21 note) and higher other income. We believe the stock deserves a rerating, considering the industry-leading double-digit revenue growth, rising share of digital business (56% of revenue), elevated EBIT margin levels vs. pre-Covid levels and a consistent capital allocation policy. Thus, we retain the BUY recommendation. We have shifted to a 1-year target price from the earlier 2-year. As we enter 2HFY22, instead of rolling forward our valuation, we maintain it based on FY24E earnings and shift to a 1-year target price of Rs2,120.

4
InfosysIT | India
Institutional Equity Research
BUYTarget Price: Rs2,120
CMP* (Rs) 1,705
Upside/ (Downside) (%) 24
Bloomberg Ticker INFO IN
Key Charts
Exhibit 3: Deal Wins Exhibit 4: LTM Attrition
Source: Company, RSec Research Source: Company, RSec Research
Exhibit 1: US$ Revenue Growth Exhibit 2: EBIT Margin
Source: Company, RSec Research Source: Company, RSec Research
Exhibit 5: Net Employee addition Exhibit 6: Infosys (discount)/premium over TCS
Source: Company, RSec Research Source: Company, RSec Research; Bloomberg
6968
(1,083)
(3,138)
975
9,104 10,307
8,334
11,664
(4,000)
(2,000)
-
2,000
4,000
6,000
8,000
10,000
12,000
14,000
3QFY20 4QFY20 1QFY21 2QFY21 3QFY21 4QFY21 1QFY22 2QFY22
Net Employee Additions
(40)
(30)
(20)
(10)
-
10
20
30
40
50
60
2010 2011 2012 2013 2014 2015 2016 2017 2018 2019 2020 2021
(%)
Infosys (discount)/premium over TCS Average
19.6
15.3 15.6
7.8
1010.9
13.9
20.1
0
5
10
15
20
25
3QFY20 4QFY20 1QFY21 2QFY21 3QFY21 4QFY21 1QFY22 2QFY21
(%)
LTM Attrition
1800 1650 1740
3145
7129
21112570
2150
0
1000
2000
3000
4000
5000
6000
7000
8000
3QFY20 4QFY20 1QFY21 2QFY21 3QFY21 4QFY21 1QFY22 2QFY21
(US$
Mn)
Deal Wins
7.2 7.9 8.3
6.1
19.0
13.8
10.9
0
5
10
15
20
25
FY2018 FY2019 FY2020 FY2021 FY2022E FY2023E FY2024E
(%)
US$ Revenue Growth
24.3
22.8
21.3
24.524.0
24.324.7
19
20
21
22
23
24
25
FY2018 FY2019 FY2020 FY2021 FY2022E FY2023E FY2024E(%
)
EBIT Margin

5
InfosysIT | India
Institutional Equity Research
BUYTarget Price: Rs2,120
CMP* (Rs) 1,705
Upside/ (Downside) (%) 24
Bloomberg Ticker INFO IN
Profit & Loss Statement
Y/E Mar (Rs mn) FY20 FY21 FY22E FY23E FY24E
Net Revenues (US$ mn) 12,781.0 13,562.0 16,139.4 18,365.8 20,366.6
Growth (%) 8.3 6.1 19.0 13.8 10.9
Net Revenues 9,07,910 10,04,730 12,01,936 13,77,437 15,47,858
Growth (%) 9.8 10.7 19.6 14.6 12.4
Employee Costs & Other expenses 5,78,380 6,21,470 7,63,403 8,73,174 9,81,584
SG&A and Other Operating Expenses 47,120 46,270 50,514 54,342 57,977
EBITDA 2,22,680 2,78,900 3,23,085 3,70,029 4,18,522
EBITDA (%) 24.5 27.8 26.9 26.9 27.0
EBITDA Growth (%) 6.6 25.2 15.8 14.5 13.1
D&A 28,940 32,680 34,412 35,596 35,676
EBIT 1,93,740 2,46,220 2,88,673 3,34,433 3,82,846
EBIT (%) 21.3 24.5 24.0 24.3 24.7
EBIT Growth (%) 2.6 27.1 17.2 15.9 14.5
Other Income 26,340 19,960 25,856 29,178 33,777
PBT 2,20,080 2,66,180 3,14,530 3,63,611 4,16,624
Tax (incl deferred) 53,680 72,050 81,181 90,903 1,04,156
Exceptional - - - - -
Minorities 450 720 250 240 240
PAT 1,65,950 1,93,410 2,33,099 2,72,469 3,12,228
PAT Growth (%) 7.7 16.5 20.5 16.9 14.6
EPS 39.0 45.4 55.3 64.7 74.2
EPS Growth (%) 10.0 16.6 21.5 17.1 14.6
Balance Sheet
Y/E Mar (Rs mn) FY20 FY21 FY22E FY23E FY24E
SOURCES OF FUNDS
Share Capital - Equity 21,220 21,240 2,097 2,097 2,097
Reserves & other 6,33,280 7,46,580 7,44,120 8,56,607 9,92,012
Total Shareholders' Funds 6,54,500 7,67,820 7,46,217 8,58,704 9,94,109
Total Current Liabilities 2,08,560 2,29,887 2,75,993 3,16,209 3,55,350
Total Debt 60,680 77,390 78,740 74,740 70,740
Minority Interest 450 720 250 240 240
TOTAL SOURCES OF FUNDS 9,27,680 10,79,757 11,05,861 12,54,802 14,25,588
APPLICATION OF FUNDS
Fixed Assets 2,47,430 3,02,040 2,84,998 2,85,402 2,89,726
Other Long term assets 1,34,490 1,74,490 1,74,490 1,74,490 1,74,490
Total Non Current Assets 3,81,920 4,76,530 4,59,488 4,59,892 4,64,216
Accounts Receivable 1,84,870 1,89,935 2,27,215 2,60,392 2,92,609
Cash & Bank 2,33,040 2,70,560 2,24,087 3,13,652 4,22,652
Other Current Assets 1,27,850 1,42,732 1,95,070 2,20,866 2,46,111
Total Current Assets 5,45,760 6,03,227 6,46,372 7,94,910 9,61,372
TOTAL APPLICATION OF FUNDS 9,27,680 10,79,757 11,05,861 12,54,802 14,25,588
6
InfosysIT | India
Institutional Equity Research
BUYTarget Price: Rs2,120
CMP* (Rs) 1,705
Upside/ (Downside) (%) 24
Bloomberg Ticker INFO IN
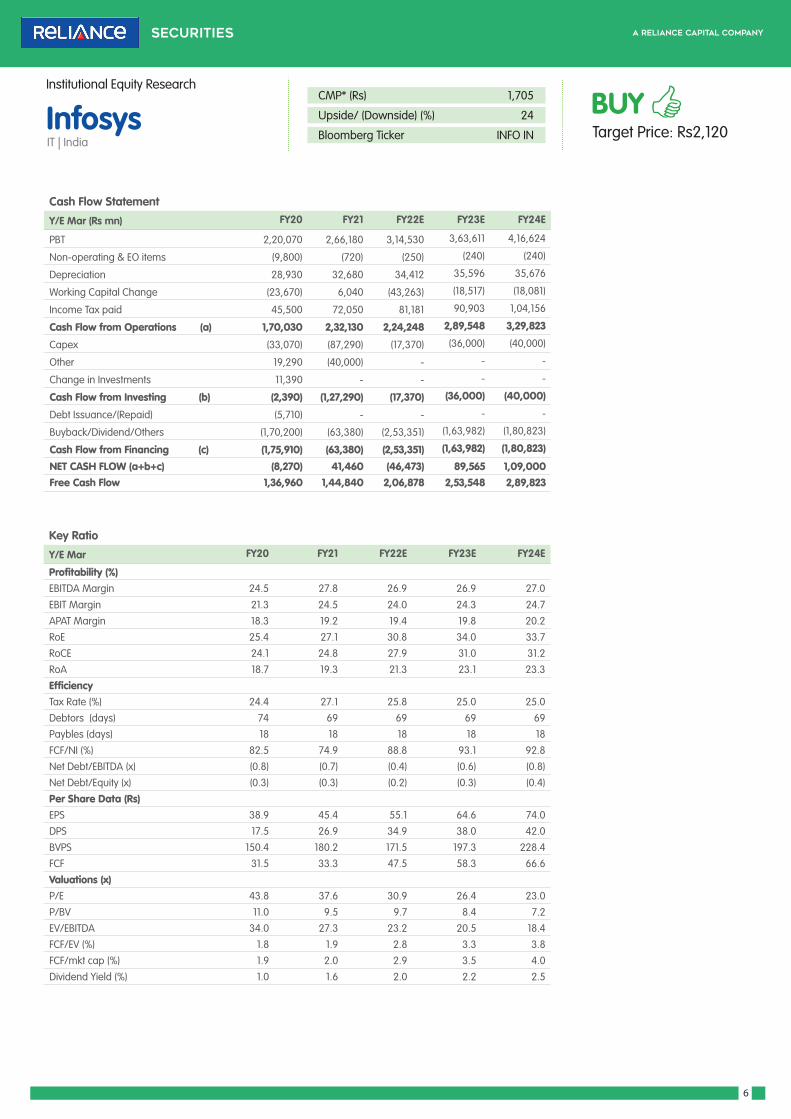
Cash Flow Statement
Y/E Mar (Rs mn) FY20 FY21 FY22E FY23E FY24E
PBT 2,20,070 2,66,180 3,14,530 3,63,611 4,16,624
Non-operating & EO items (9,800) (720) (250) (240) (240)
Depreciation 28,930 32,680 34,412 35,596 35,676
Working Capital Change (23,670) 6,040 (43,263) (18,517) (18,081)
Income Tax paid 45,500 72,050 81,181 90,903 1,04,156
Cash Flow from Operations (a) 1,70,030 2,32,130 2,24,248 2,89,548 3,29,823
Capex (33,070) (87,290) (17,370) (36,000) (40,000)
Other 19,290 (40,000) - - -
Change in Investments 11,390 - - - -
Cash Flow from Investing (b) (2,390) (1,27,290) (17,370) (36,000) (40,000)
Debt Issuance/(Repaid) (5,710) - - - -
Buyback/Dividend/Others (1,70,200) (63,380) (2,53,351) (1,63,982) (1,80,823)
Cash Flow from Financing (c) (1,75,910) (63,380) (2,53,351) (1,63,982) (1,80,823)
NET CASH FLOW (a+b+c) (8,270) 41,460 (46,473) 89,565 1,09,000 Free Cash Flow 1,36,960 1,44,840 2,06,878 2,53,548 2,89,823
Key Ratio
Y/E Mar FY20 FY21 FY22E FY23E FY24E
Profitability (%)EBITDA Margin 24.5 27.8 26.9 26.9 27.0
EBIT Margin 21.3 24.5 24.0 24.3 24.7
APAT Margin 18.3 19.2 19.4 19.8 20.2
RoE 25.4 27.1 30.8 34.0 33.7
RoCE 24.1 24.8 27.9 31.0 31.2
RoA 18.7 19.3 21.3 23.1 23.3
EfficiencyTax Rate (%) 24.4 27.1 25.8 25.0 25.0
Debtors (days) 74 69 69 69 69
Paybles (days) 18 18 18 18 18
FCF/NI (%) 82.5 74.9 88.8 93.1 92.8
Net Debt/EBITDA (x) (0.8) (0.7) (0.4) (0.6) (0.8)
Net Debt/Equity (x) (0.3) (0.3) (0.2) (0.3) (0.4)
Per Share Data (Rs)EPS 38.9 45.4 55.1 64.6 74.0
DPS 17.5 26.9 34.9 38.0 42.0
BVPS 150.4 180.2 171.5 197.3 228.4
FCF 31.5 33.3 47.5 58.3 66.6
Valuations (x)P/E 43.8 37.6 30.9 26.4 23.0
P/BV 11.0 9.5 9.7 8.4 7.2
EV/EBITDA 34.0 27.3 23.2 20.5 18.4
FCF/EV (%) 1.8 1.9 2.8 3.3 3.8
FCF/mkt cap (%) 1.9 2.0 2.9 3.5 4.0
Dividend Yield (%) 1.0 1.6 2.0 2.2 2.5

7
InfosysIT | India
Institutional Equity Research
BUYTarget Price: Rs2,120
CMP* (Rs) 1,705
Upside/ (Downside) (%) 24
Bloomberg Ticker INFO IN
Reliance Securities Limited (RSL), the broking arm of Reliance Capital is one of the India’s leading retail broking houses. Reliance Capital is amongst India’s leading and most valuable financial services companies in the private sector. Reliance Capital has interests in asset management and mutual funds, life and general insurance, commercial finance, equities and commodities broking, wealth management services, distribution of financial products, private equity, asset reconstruction, proprietary investments and other activities in financial services. The list of associates of RSL is available on the website www.reliancecapital.co.in. RSL is registered as a Research Analyst under SEBI (Research Analyst) Regulations, 2014
General Disclaimers: This Research Report (hereinafter called ‘Report’) is prepared and distributed by RSL for information purposes only. The recommendations, if any, made herein are expression of views and/or opinions and should not be deemed or construed to be neither advice for the purpose of purchase or sale of any security, derivatives or any other security through RSL nor any solicitation or offering of any investment /trading opportunity on behalf of the issuer(s) of the respective security(ies) referred to herein. These information / opinions / views are not meant to serve as a professional investment guide for the readers. No action is solicited based upon the information provided herein. Recipients of this Report should rely on information/data arising out of their own investigations. Readers are advised to seek independent professional advice and arrive at an informed trading/investment decision before executing any trades or making any investments. This Report has been prepared on the basis of publicly available information, internally developed data and other sources believed by RSL to be reliable. RSL or its directors, employees, affiliates or representatives do not assume any responsibility for, or warrant the accuracy, completeness, adequacy and reliability of such information / opinions / views. While due care has been taken to ensure that the disclosures and opinions given are fair and reasonable, none of the directors, employees, affiliates or representatives of RSL shall be liable for any direct, indirect, special, incidental, consequential, punitive or exemplary damages, including lost profits arising in any way whatsoever from the information / opinions / views contained in this Report.
Risks: Trading and investment in securities are subject to market risks. There are no assurances or guarantees that the objectives of any of trading / investment in securities will be achieved. The trades/ investments referred to herein may not be suitable to all categories of traders/investors. The names of securities mentioned herein do not in any manner indicate their prospects or returns. The value of securities referred to herein may be adversely affected by the performance or otherwise of the respective issuer companies, changes in the market conditions, micro and macro factors and forces affecting capital markets like interest rate risk, credit risk, liquidity risk and reinvestment risk. Derivative products may also be affected by various risks including but not limited to counter party risk, market risk, valuation risk, liquidity risk and other risks. Besides the price of the underlying asset, volatility, tenor and interest rates may affect the pricing of derivatives.
Disclaimers in respect of jurisdiction: The possession, circulation and/or distribution of this Report may be restricted or regulated in certain jurisdictions by appropriate laws. No action has been or will be taken by RSL in any jurisdiction (other than India), where any action for such purpose(s) is required. Accordingly, this Report shall not be possessed, circulated and/or distributed in any such country or jurisdiction unless such action is in compliance with all applicable laws and regulations of such country or jurisdiction. RSL requires such recipient to inform himself about and to observe any restrictions at his own expense, without any liability to RSL. Any dispute arising out of this Report shall be subject to the exclusive jurisdiction of the Courts in India.
Disclosure of Interest: The research analysts who have prepared this Report hereby certify that the views /opinions expressed in this Report are their personal independent views/opinions in respect of the securities and their respective issuers. None of RSL, research analysts, or their relatives had any known direct /indirect material conflict of interest including any long/short position(s) in any specific security on which views/opinions have been made in this Report, during its preparation. RSL’s Associates may have other potential/material conflict of interest with respect to any recommendation and related information and opinions at the time of publication of research report. RSL, its Associates, the research analysts, or their relatives might have financial interest in the issuer company(ies) of the said securities. RSL or its Associates may have received a compensation from the said issuer company(ies) in last 12 months for the brokerage or non brokerage services.RSL, its Associates, the research analysts or their relatives have not received any compensation or other benefits directly or indirectly from the said issuer company(ies) or any third party in last 12 months in any respect whatsoever for preparation of this report.
The research analysts has served as an officer, director or employee of the said issuer company(ies)?: No
RSL, its Associates, the research analysts or their relatives holds ownership of 1% or more, in respect of the said issuer company(ies).?: No
Copyright: The copyright in this Report belongs exclusively to RSL. This Report shall only be read by those persons to whom it has been delivered. No reprinting, reproduction, copying, distribution of this Report in any manner whatsoever, in whole or in part, is permitted without the prior express written consent of RSL.
RSL’s activities were neither suspended nor have defaulted with any stock exchange with whom RSL is registered. Further, there does not exist any material adverse order/judgments/strictures assessed by any regulatory, government or public authority or agency or any law enforcing agency in last three years. Further, there does not exist any material enquiry of whatsoever nature instituted or pending against RSL as on the date of this Report.
Important These disclaimers, risks and other disclosures must be read in conjunction with the information / opinions / views of which they form part of.
RSL CIN: U65990MH2005PLC154052. SEBI registration no. ( Stock Brokers: NSE - INB / INF / INE 231234833; BSE - INB / INF / INE 011234839, Depository Participants: CDSL IN-DP-257-2016 IN-DP-NSDL-363-2013, Research Analyst: INH000002384); AMFI ARN No.29889.
Rating GuidesRating Expected absolute returns (%) over 12 monthsBUY ≥10%
HOLD 0% to <10%
SELL <0%
Date Reco CMP TP
31-Mar-21 BUY 1,387 1,920 PLEASE CLICK HERE FOR PREVIOUS REPORTS
Rating History
Change in Ratings
We have changed our rating system and included HOLD recommendation. We have BUY, HOLD and SELL recommendation now.
We have also shifted to 1-Year Target Price from 2-Year Target Price.