
Super-resolution mapping of scaffold nucleoporins in...
39
© 2017. Published by The Company of Biologists Ltd. Super-resolution Mapping of Scaffold Nucleoporins in the Nuclear Pore Complex Jiong Ma † , Joseph M. Kelich † , Samuel L. Junod and Weidong Yang* Department of Biology, Temple University, Philadelphia, PA † Equal contributions to this work * Corresponding author: Prof. Weidong Yang, Department of Biology, Temple University Mail: 1900 N. 12 th Street, Philadelphia, PA 19122 Email: [email protected] Tel: 215-2042312 Fax: 215-2046646 Journal of Cell Science • Advance article JCS Advance Online Article. Posted on 15 February 2017
Transcript of Super-resolution mapping of scaffold nucleoporins in...

© 2017. Published by The Company of Biologists Ltd.
Super-resolution Mapping of Scaffold Nucleoporins in the Nuclear Pore Complex
Jiong Ma†, Joseph M. Kelich†, Samuel L. Junod and Weidong Yang*
Department of Biology, Temple University, Philadelphia, PA
† Equal contributions to this work
* Corresponding author: Prof. Weidong Yang, Department of Biology, Temple University
Mail: 1900 N. 12th Street, Philadelphia, PA 19122
Email: [email protected]
Tel: 215-2042312
Fax: 215-2046646
Jour
nal o
f Cel
l Sci
ence
• A
dvan
ce a
rtic
le
JCS Advance Online Article. Posted on 15 February 2017

Abstract
The nuclear pore complex (NPC), composed of ~30 different nucleoporins (Nups), is one of the
largest supramolecular structures in eukaryotic cells. Its octagonal ring-scaffold perforates the
nuclear envelope and features a unique molecular machinery that regulates nucleocytoplasmic
transport. However, the precise copy number and the spatial location of each Nup in the native
NPC remain obscure due to the inherent difficulty of counting and localizing proteins inside the
sub-micrometer supramolecular complex. Here we combined super-resolution SPEED microscopy
and nanobody specific labeling to reveal the spatial distribution of scaffold Nups within three
separate layers in the native NPC with a precision of ~3 nm. Our data reveals both the radial and
axial spatial distributions for Pom121, Nup37 and Nup35 and provides evidence for their copy
numbers of 8, 32, and 16 respectively per NPC. This approach can help pave the path for mapping
the entirety of Nups in native NPCs and also other structural components of macromolecular
complexes.
Summary Statement
Here we combined super-resolution SPEED microscopy and nanobody specific labeling to map
the radial and axial distributions of scaffold proteins in the native nuclear pore complex.
Jour
nal o
f Cel
l Sci
ence
• A
dvan
ce a
rtic
le

Introduction
Nuclear pore complexes (NPCs) play the central role in nucleocytoplasmic transport of
macromolecules between the nucleus and the cytoplasm of eukaryotic cells (Kohler and Hurt,
2007; Grunwald et al., 2012; Hinshaw et al., 1992; Mattaj and Englmeier, 1999). Human NPCs
are composed of ~30 different nucleoporins (Nups) together having a molecular mass of over ~110
MDa (Reichelt et al., 1990; Rabut et al., 2004; Doye and Hurt, 1997). Among these Nups,
approximately one third of them are intrinsically disordered proteins containing multiple
phenylalanine-glycine (FG) repeats and the rest are folded proteins forming the architecture of the
NPC (Terry and Wente, 2009; Yamada et al., 2010; Milles and Lemke, 2011). By electron
microscopy (EM), the cylinder-shaped structure of NPCs was shown as an eight-fold scaffold
geometry with rotational symmetry (Kiseleva et al., 2004; Frenkiel-Krispin et al., 2010; Maimon
et al., 2012; Brohawn et al., 2008; Akey, 1989). Along the axial dimension, the NPC is made up
of cytoplasmic fibrils, a central scaffold region and the nuclear basket all together being
approximately 200 nm in length. In the radial dimension three layers are described: the outermost
transmembrane layer, the outer scaffold ring, and the inner scaffold spoke ring. These layers have
three separate distinct diameters and locations as determined by EM. (Reichelt et al., 1990; Stoffler
et al., 1999; Vasu et al., 2001; Suntharalingam and Wente, 2003). EM data, however, remains
unable to exactly determine the specific location and arrangement of individual species of Nups at
high resolution (von Appen and Beck, 2016). Additionally, the copy number of each Nup remains
imprecisely determined in native NPCs within cells, having thus far only been estimated by
western blot analysis (Cronshaw et al., 2002), EM (Kiseleva et al., 2004, Alber, 2007, von Appen
and Beck, 2016), photobleaching steps of fluorescently labeled Nups (Ries et al., 2012, Ma et al.,
2015 ), and proteomic approaches (Ori et al., 2013). Although the above mentioned methods can
Jour
nal o
f Cel
l Sci
ence
• A
dvan
ce a
rtic
le

provide an approximation of spatial location and copy number for Nups, a new method for directly
imaging specific Nups and counting the copy number of each Nup within native NPCs is still
needed (Hurt and Beck, 2015).
Asides from EM, fluorescence techniques have begun to be employed to probe the structure
of the NPC and continue to provide great advances into understanding the structure and
distribution of NPC components. The spatial orientation of some Nups has been determined
through polarized light microscopy (Kampmann et al., 2011) and the relative position of several
NPC subcomplexes has been shown through 3D structured illumination microscopy (Schermelleh
et al., 2008; Bilokapic and Schwartz, 2012). More recently, single-molecule-localization based
super-resolution imaging techniques have been applied towards the goal of resolving the structure
and positions of individual Nups within the NPC. So far stochastic optical reconstruction
microscopy (STORM) and photo-activated localization microscopy (PALM) have been applied in
this manner (Löschberger et al., 2012; Rust et al., 2006; Xie et al., 2016). These aforementioned
microscopy techniques normally require the application of large antibodies (>100 kDa) and/or
photoswitchable probes in chemically fixed cells. These requirements may perturb the native
NPC’s distribution. As an alternative, nanobodies possessing a molecular weight of ~13 kDa can
be used because they are small enough to enter native NPCs and can specifically bind to Nups. By
combining these nanobodies with fluorescent dyes, a Nup-specific probe is created. In this manner,
the concentration of nanobody can be controlled to ensure optimal single-molecule detection
(Szymborska et al., 2013, Pleiner et al., 2015).
Jour
nal o
f Cel
l Sci
ence
• A
dvan
ce a
rtic
le

In this paper, we have developed a new approach of combining single-point edge-excitation
sub-diffraction (SPEED) microscopy and nanobody techniques to map both the radial and axial
spatial distributions and the copy numbers for scaffold Nups in the native NPCs of mammalian
cells. Prior to this study, only the radial dimension has been provided for several Nups by super-
resolution techniques (Löschberger et al. 2012, Szymborska et al., 2013). In our approach, anti-
GFP nanobodies labeled with Alexa Fluor dyes were used to recognize individual GFP-fused Nups
within native human NPCs. SPEED microscopy was used to provide a spatial distribution for each
tested Nup in both the radial and axial dimension, which was achieved through illumination of
Nups within single NPCs at bottom of nuclear envelope (NE) for the radial view, and at the edge
of the equator of the NE for the axial view ((Ma et al., 2010, 2012, 2013 and 2016). Single-point
laser illuminations were used to illuminate single NPCs in contrast to wide-field setups such as
STORM and PALM in order to reduce background noise and increase single-molecule localization
precision. Here we revealed spatial data and inferred copy number for various scaffold Nups found
within three separate scaffold layers of the NPC, including the transmembrane-layer Nup:
Pom121, an outer-ring Nup: Nup37, and an inner spoke-ring Nup: Nup35.
Jour
nal o
f Cel
l Sci
ence
• A
dvan
ce a
rtic
le

Results
Our epi-fluorescence microscopy imaging experiments have shown that GFP-Nups in
native NPCs can be recognized well by anti-GFP nanobodies at micro-molar concentrations
(Supplementary Fig. S1). Furthermore, to obtain the radial distributions of Nups within a single
NPC, an overlapped laser beam containing 488-nm and 633-nm lasers was directed to the bottom
of the cell nucleus and focused as a diffraction-limited illumination point spread function (iPSF)
on a single NPC at its cross section. Based on the Rayleigh criterion, the vertical and inclined iPSF
in the xy and xz planes respectively is ≈ 210 nm and ≈ 320 nm for the 488-nm laser (Fig. 1A), and
≈ 270 nm and ≈ 360 nm for the 633-nm laser (Fig. 1B). These PSFs are smaller than the average
nearest neighbor distance for NPCs at 400–600 nm in HeLa cells (Ma et al., 2010, Ma et al., 2012,
Kubitscheck et al., 2005). In this way, both single GFP-NPCs and individual Alexa Fluor 647
labeled nanobodies were illuminated. Noteworthy, our localization approach is reliant on GFP
tags being present on each Nup of interest, and it cannot be guaranteed that for every NPC all
copies of that Nup will be tagged with GFP (particularly in transiently transfected cells). Thus,
only individual GFP-NPCs with fluorescence intensity values corresponding to at least 8 copies of
GFP were selected for subsequent single-molecule localization. This pre-selection is to avoid those
NPCs that may be severely under-sampled. To ensure nanobody-Nup binding events were
infrequent, well resolvable and well isolated, nanobody concentrations were reduced down to 0.1
nM. We found that approximately 40% of imaged anti-GFP nanobodies firmly bound within NPCs
to GFP-Nups. These binding events lasted many frames with dwell times ranging from 250 ms to
8 s before photobleaching occurred and signal diminished. The other 60% of imaged nanobodies
diffused quickly through NPCs within 2 ms presumably without binding to a Nup. Given the size
of the used nanobodies, this quick transport time agrees with previously recorded data for passively
Jour
nal o
f Cel
l Sci
ence
• A
dvan
ce a
rtic
le
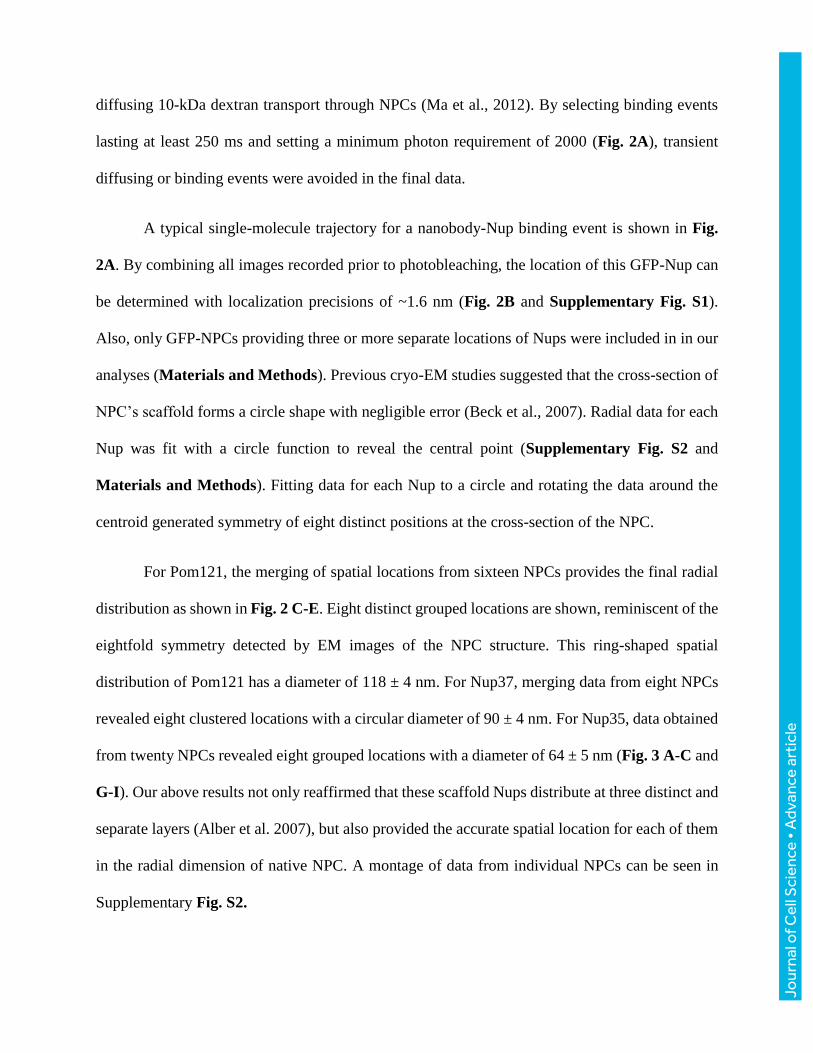
diffusing 10-kDa dextran transport through NPCs (Ma et al., 2012). By selecting binding events
lasting at least 250 ms and setting a minimum photon requirement of 2000 (Fig. 2A), transient
diffusing or binding events were avoided in the final data.
A typical single-molecule trajectory for a nanobody-Nup binding event is shown in Fig.
2A. By combining all images recorded prior to photobleaching, the location of this GFP-Nup can
be determined with localization precisions of ~1.6 nm (Fig. 2B and Supplementary Fig. S1).
Also, only GFP-NPCs providing three or more separate locations of Nups were included in in our
analyses (Materials and Methods). Previous cryo-EM studies suggested that the cross-section of
NPC’s scaffold forms a circle shape with negligible error (Beck et al., 2007). Radial data for each
Nup was fit with a circle function to reveal the central point (Supplementary Fig. S2 and
Materials and Methods). Fitting data for each Nup to a circle and rotating the data around the
centroid generated symmetry of eight distinct positions at the cross-section of the NPC.
For Pom121, the merging of spatial locations from sixteen NPCs provides the final radial
distribution as shown in Fig. 2 C-E. Eight distinct grouped locations are shown, reminiscent of the
eightfold symmetry detected by EM images of the NPC structure. This ring-shaped spatial
distribution of Pom121 has a diameter of 118 ± 4 nm. For Nup37, merging data from eight NPCs
revealed eight clustered locations with a circular diameter of 90 ± 4 nm. For Nup35, data obtained
from twenty NPCs revealed eight grouped locations with a diameter of 64 ± 5 nm (Fig. 3 A-C and
G-I). Our above results not only reaffirmed that these scaffold Nups distribute at three distinct and
separate layers (Alber et al. 2007), but also provided the accurate spatial location for each of them
in the radial dimension of native NPC. A montage of data from individual NPCs can be seen in
Supplementary Fig. S2.
Jour
nal o
f Cel
l Sci
ence
• A
dvan
ce a
rtic
le

Although radial imaging of the NPC allowed us to obtain distributions representing the
radial organization of scaffold Nups, this view is limited and cannot alone reveal the complete
distribution and copy number for each Nup. There may be more than one “layer” of Nups along
the axial direction of the NPC (Supplementary Fig. S3). The predicted copy number for a single
Nup species within the NPC is assumed to be in 8, 16, or 32 due to eightfold symmetry. To account
for these numbers, there may be 1, 2, or even 4 layers of the Nup present along the NPC axis. Data
along the axial dimension would predictably distribute in 1, 2, or 4 isolated lines (axial view in
Supplementary Fig. S3). To obtain a view along the NPC’s axial dimension, we illuminated a
single NPC located on the equator of the nucleus on either left or right side (Fig. 1B). Similar to
radial view imaging, only GFP-NPCs providing three or more separate locations of Nups were
included in in our analyses (Materials and Methods). As shown in Fig. 2 F-H and Table 1, the
spatial locations of Pom121 revealed a single line along the NPC’s axial dimension. While, two
isolated line distributions were found for both Nup37 and Nup35 per NPC, separated by greatly
varying distances of 36 ± 3 nm and 7 ± 3 nm respectively (Fig. 3 E-F and J-L). Thus, Pom121
was determined to have a single layer while Nup 37 and Nup35 were determined to have two layers
along the NPC’s axial dimension.
Due to Pom121 having displayed an eightfold grouping in the radial distribution and a
single layer in the axial dimension, a total copy number of 8 is suggested corresponding to the
model (i) in Supplementary Fig. S3. Furthermore, the GFP intensity distribution of NPCs that
expressed GFP-Pom121 confirmed this number, as shown in Supplementary Fig. S4. In detail,
GFP’s intensity values from twenty four NPCs of twenty four measured cells revealed 8 ± 1 copies
of GFP-Pom121 per NPC. Data for both Nup37 and Nup35 revealed eight groupings in the radial
dimension and two layers in the axial dimension. From the data alone, we cannot fully distinguish
Jour
nal o
f Cel
l Sci
ence
• A
dvan
ce a
rtic
le
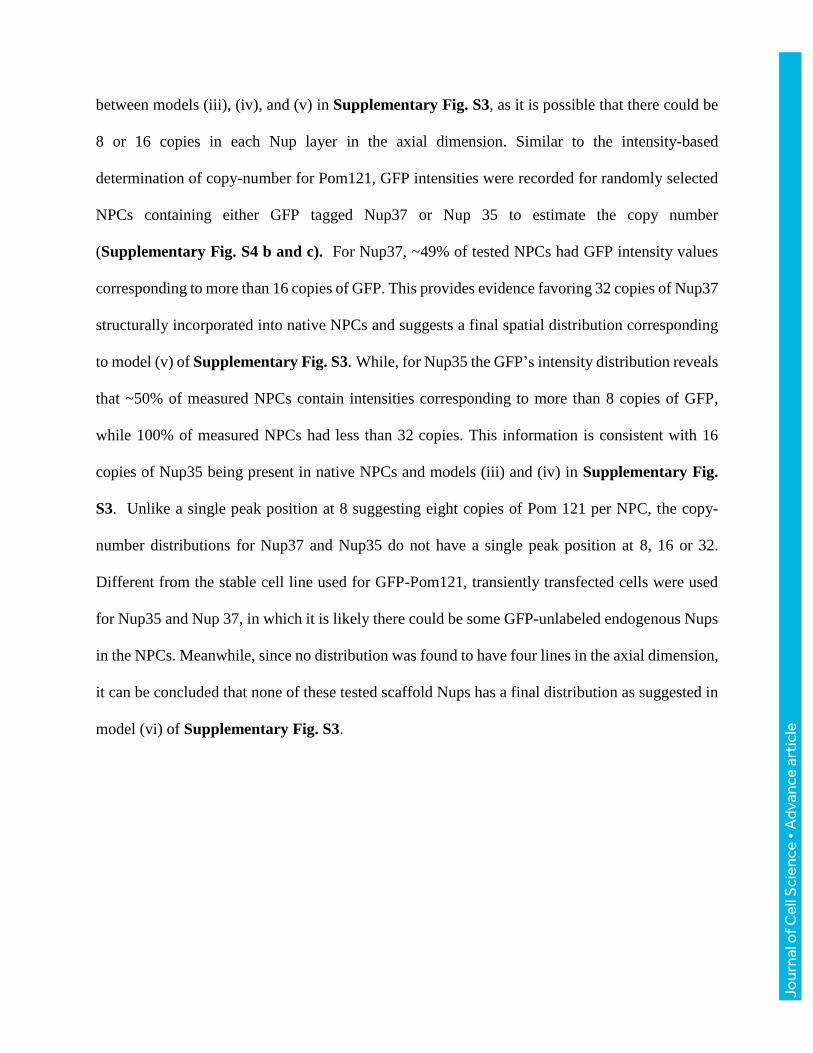
between models (iii), (iv), and (v) in Supplementary Fig. S3, as it is possible that there could be
8 or 16 copies in each Nup layer in the axial dimension. Similar to the intensity-based
determination of copy-number for Pom121, GFP intensities were recorded for randomly selected
NPCs containing either GFP tagged Nup37 or Nup 35 to estimate the copy number
(Supplementary Fig. S4 b and c). For Nup37, ~49% of tested NPCs had GFP intensity values
corresponding to more than 16 copies of GFP. This provides evidence favoring 32 copies of Nup37
structurally incorporated into native NPCs and suggests a final spatial distribution corresponding
to model (v) of Supplementary Fig. S3. While, for Nup35 the GFP’s intensity distribution reveals
that ~50% of measured NPCs contain intensities corresponding to more than 8 copies of GFP,
while 100% of measured NPCs had less than 32 copies. This information is consistent with 16
copies of Nup35 being present in native NPCs and models (iii) and (iv) in Supplementary Fig.
S3. Unlike a single peak position at 8 suggesting eight copies of Pom 121 per NPC, the copy-
number distributions for Nup37 and Nup35 do not have a single peak position at 8, 16 or 32.
Different from the stable cell line used for GFP-Pom121, transiently transfected cells were used
for Nup35 and Nup 37, in which it is likely there could be some GFP-unlabeled endogenous Nups
in the NPCs. Meanwhile, since no distribution was found to have four lines in the axial dimension,
it can be concluded that none of these tested scaffold Nups has a final distribution as suggested in
model (vi) of Supplementary Fig. S3.
Jo
urna
l of C
ell S
cien
ce •
Adv
ance
art
icle

Discussion
The accurate copy number and spatial distribution for Nups within native NPCs are
urgently needed to produce a better 3D architectural map of NPCs. Moreover, precise information
on subunit stoichiometry can further advance our understanding of the function, biogenesis and
compositional dynamics of NPCs. Here we have demonstrated that the combination of SPEED
microscopy and nanobody specific labeling can provide both accurate spatial location and
presumed copy-number for individual scaffold Nups in native NPCs. By testing scaffold Nups
Pom121, Nup37 and Nup35 in native NPCs, we recorded their separate and distinct diameters at
approximately 118 nm, 90 nm, and 64 nm, corresponding to the transmembrane ring, outer ring,
and inner spoke ring respectively. These distributions in the NPC’s radial dimension reveal similar
distributions to that obtained by recent studies (Löschberger et al. 2012, Bui et al. 2013; von
Appen. 2016). For instance, the transmembrane ring diameter of 118 nm for Pom121 agree well
with a diameter of 114 nm determined by cryo-EM (Bui et al. 2013; von Appen. 2016). An earlier
super-resolution paper by Löschberger et al. described a diameter of 161±17 obtained for the radial
dimension of Gp210 (Löschberger et al. 2012). Given the facts that Pom121, Gp210 and Ndc1
together form the transmembrane ring Nup complex and that different diameters were determined
for Pom121 and Gp210, these two Nups may situate on different sites within the transmembrane
ring. Our suggestion is that Pom121 may locate at the inner edge of the ring facing towards the
NPC center and Gp210 could stay around the outer edge of the ring. Some previous work on
Pom121’s location within the NPC supports this suggestion (Hallberg et al. 1993; von Appen.
2016).
Jour
nal o
f Cel
l Sci
ence
• A
dvan
ce a
rtic
le

The outer-ring Nup, Nup37, has previously been studied by super-resolution microscopy
in the radial dimension revealing a diameter of ~91 nm (Szymborska et al. 2013), which is nearly
identical to the 90-nm diameter obtained from our study. Our radial determination also agrees with
the radial diameter of the Nup107 complex (containing Nup37) at ~ 84 nm in the NPC previously
obtained from EM measurements (Bui et al. 2013). Moreover, our axial dimension data reveals
two layers separated by 36 ± 3 nm, being consistent with recent EM data locating Nup107 complex
(containing Nup 37) at both the nuclear and cytoplasmic outer ring structures (Bui et al. 2013; von
Appen, 2016). Finally, our determination of 32 copies with two layers each containing 16 copies
for Nup37 also agrees well with the results obtained from previous EM measurements and
proteomic approaches (von Appen and Beck, 2016; Ori, 2013; Cronshaw et al., 2002; Alber et al.,
2007). Additionally, previous EM data has shown that the inner spoke-ring Nup complex,
consisting of Nup205, Nup188, Nup155 and Nup35, has a radial diameter of ~41 nm (Bui et al.
2013; von Appen and Beck, 2016). This is significantly smaller than our determined diameter of
~64 nm for Nup35. While, given the facts that the EM measurement did not specifically look at
individual Nup35 and that Nup35 is capable of binding nuclear membranes, perhaps Nup35 could
be present predominantly on the outer edge of the inner spoke-ring Nup complex. As a result,
Nup35 could possess a larger diameter than the centroid of the entire inner spoke-ring Nup
complex. Prior to our study here, the copy number of Nup35 has been only estimated by bulk
protein and cell lysate approaches (Cronshaw et al., 2002; Alber et al., 2007). Here, our high-
resolution data provided a more complete distribution for 16 copies of Nup35 distributed as two
layers roughly 7-nm apart.
Jour
nal o
f Cel
l Sci
ence
• A
dvan
ce a
rtic
le

The relative spatial locations of these scaffold Nups in both radial and axial dimensions of
NPC mapped here can provide experimental evidence and implications regarding NPC’s assembly
and nucleocytoplasmic transport. First, the determined single-layer middle position of Pom121
with a radial diameter bigger than Nup35 and Nup37, supports the proposal that the transmembrane
Nup complex (forming by Pom121, Ndc1 and Gp210) could anchor the NPC into the NE during
the early stage of NPC assembly and then subsequently recruit the inner spoke-ring Nup155
complex (containing Nup35) and the outer-ring Nup107-160 complex (containing Nup37) to the
NPC (Talamas and Hetzer, 2011). Second, the double-layer arrangements of Nup35 and Nup37
agree with the geometry that almost all structural Nups are symmetrically distributed on the
cytoplasmic and nuclear sides of NPCs. Meanwhile, the double-layer distributions for the inner-
ring and outer spoke-ring Nups, together with linker Nups (Nup88 and Nup99), could also be
capable of providing attachment sites specifically adaptable for either symmetrically or
asymmetrically located FG-Nups along the NPC transport pathway (Alber et al. 2007).
Conclusively, our high-resolution data firstly reaffirmed the previously estimated copy
numbers for POM121 at 8 copies and of 32 copies for Nup37, and also clarified that the copy
number for Nups 35 is 16 copies (Bui et al. 2013, Cronshaw et al. 2002; Alber et al., 2007). Also,
accurate spatial locations of these scaffold Nups in both axial and radial dimensions were provided
in native NPCs. We believe that this multi-dimensional determination of subunit stoichiometry
approach will enable us to provide a complete map for the entirety of Nups in the native NPCs,
and eventually enhance a refined understanding of NPC’s 3D architecture and function.
Jour
nal o
f Cel
l Sci
ence
• A
dvan
ce a
rtic
le

Materials and Methods
Cell Culture and Transport Conditions. A wild type HeLa cell (American Type Culture
Collection) line was used.Freshly split cells were grown overnight on coverslips in DMEM
supplemented with 10% FBS. N-terminal GFP fused POM121, Nup35 or Nup37 was transfected
into the HeLa cell line separately. In our experiments, a stable GFP-POM121 HeLa cell line and
transiently transfected cells expressing GFP-Nup35 or GFP-Nup37 were utilized. For microscopy
imaging, flow chambers were constructed with a top cover-slip and two lines of silicone grease as
spacers. Cells were washed with transport buffer (20 mMHEPES, 110 mM KOAc, 5 mM NaOAc,
2 mM MgOAc, 1 mM EGTA, pH 7.3), permeabilized for two minutes with 40 μg/mL digitonin in
transport buffer, and washed again with transport buffer supplemented with 1.5%
polyvinylpyrrolidone (PVP; 360 kDa). PVP was included in all transport buffer solutions after
digitonin treatment to prevent osmotic swelling of nuclei.
Nanobodies and Labeling. The Nup plasmids used in this experiment contain N-terminal GFP
fusions. Anti-GFP Nanobodies were purchased from Chromotek. Succinimidyl-esters of Alexa
Fluor 647 (Invitrogen) were dissolved at 10 mg/ml in DMSO, stored at −80 °C and for labeling
added in twenty-fold molar excess to the nanobodies. The mixture was incubated for 2 hours at
room temperature and the products were dialyzed into 0.2 M NaHCO3, pH 8.2 in a mini-dialysis
unit to remove free unbound dyes. The final labeling ratio is approximately two dyes per nanobody.
For single-molecule measurements, 0.1-nM labeled nanobody were added with an oxygen
scavenging system consisting of 5 mM protocatechuic acid (PCA) and 100M protocatechuate
dioxygenase (PCD) in transport buffer with 1.5% PVP.
Jour
nal o
f Cel
l Sci
ence
• A
dvan
ce a
rtic
le

Instrumentation. The SPEED microscope includes an Olympus IX81 equipped with a 1.4 NA
100× oil-immersion apochromatic objective (UPLSAPO 100X, Olympus), a 35-mW 633-nm He-
Ne laser (Melles Griot), a 50-mW solid-state 488-nm laser (Obis), an on-chip multiplication gain
charge-coupled device camera (Cascade 128+, Roper Scientific) and the Slidebook software
package (Intelligent Imaging Innovations) for data acquisition and processing. An optical chopper
(Newport) was used to generate an on-off mode of laser excitation. The two lasers were combined
by an optical filter (FFF555/646 Di01, Semrock), collimated and focused into an overlapped
illumination volume in the focal plane. The green and red fluorescence emissions were collected
by the same objective, filtered by a dichroic filter (Di01- R405/488/561/635-25x36, Semrock) and
an emission filter (NF01- 405/488/561/635-25X5.0, Semrock) and imaged by an identical CCD
camera.
Localization of the NE and the determination of NPC’s orientation. The position of the NE
was determined at super accuracy by fitting the fluorescence of GFP-Nup as follows. The pixel
intensities within a row or a column approximately perpendicular to the NE were fit with a
Gaussian. The peak position of the Gaussian for a particular set of pixel intensities was considered
the NE position for that row and column. The peak positions of a series of such Gaussians were
then fit with a second-degree polynomial, yielding the orientation of the NE within the entire
image. The following rules were then used to select a single NPC and determine its orientation,
which needs to be perpendicular to the NE at the bottom or on the equator of the nucleus and to
the x or y direction of the Cartesian coordinates (x, y) in the CCD camera: first, to find a GFP-
NPC with 8, 16 or 32 copies of GFP-Nup. In detail, individual GFP-NPCs on the NE were selected
when their fluorescence intensity corresponded with at least 8 copies of GFP; second, we chose a
fluorescent NPC at the bottom or on the equator of the nucleus such that the tangent of the NE at
Jour
nal o
f Cel
l Sci
ence
• A
dvan
ce a
rtic
le

the location of this NPC was parallel to the x or y direction of the Cartesian coordinates (x, y) in
the CCD camera; and third, we examined the ratio of Gaussian widths in the long and short axes
of the chosen GFP-NPC fluorescence spot, which needed to be around 1 for a NPC locating at the
bottom or fall between 1.74 and 1.82 for a NPC at the equator (within this range, an illuminated
NPC only has a free angle of 1.4o to the perpendicular direction to the NE) (Ma et al., 2012; Alber
et al., 2007).
Localization Precisions of Isolated Fluorescent Spots. The localization precision for an
immobilized fluorophore is defined as how precisely the central point of its detected fluorescent
diffraction-limited spot was determined. In detail, the fluorescent spot was fitted to a 2D
symmetrical or an elliptical Gaussian function, and the localization precision was determined by
the standard deviation of multiple measurements of the central point. Besides, the localization
precisions (σs) of these immobile molecules were also estimated by an algorithm of
(1), where N is the number of collected photons, a is the effective pixel
size of the detector, b is the standard deviation of the background in photons per pixel, and s is the
standard deviation of the point spread function (Thompson et al., 2002). As shown in
Supplementary Fig. 2, typical single Nups localization precision (σs) is ~1.6 nm. Given the radii
of GFP (rGFP ~ 1.2 nm) and nanobody (rNanobody ~ 1.6 nm), the final registered localization precision
given by 𝜎 = √𝜎𝑠2 + 𝑟𝐺𝐹𝑃2 + 𝑟𝑁𝑎𝑛𝑜𝑏𝑜𝑑𝑦2 (2) 𝑖𝑠 ~ 2.6 nm. If using the diameter of GFP and the
nanobody, the precision is ~ 4.3 nm.
To justify the precision obtained by the standard deviation of multiple measurements and
the algorithm, both methods were used to determine the localizations of immobile fluorescent
molecules (Alexa Fluor 647-labeled-GFP absorbed on the surface of a cover-slip). A total of 220
Jour
nal o
f Cel
l Sci
ence
• A
dvan
ce a
rtic
le

immobile labeled-GFP molecules were measured. The two methods yielded a difference of 0.5 ±
0.1 nm.
Determining a circle center for the radial view of NPCs. Previous studies suggested that the
cross-section of NPC’s scaffold can be viewed as a circle with almost neglected errors (Beck et
al., 2007). In order to obtain a radial distribution of Nup positions within a NPC, a circle fitting is
applied in our analyses. Data was rotated around the centroid and the most precisely determined
Nup location per data set was positioned to the 0 (or 360) degrees position on the circle
(Supplementary Fig. S2). When three or more data points are collected at the scaffold cross-
section of a single NPC, the circle center is calculated from the average positioning of all circle
centers. Each circle center (x0, y0) was determined from each group of at least three spatially
isolated data points (xi, yi) represented along the possible circle. (dx, dy, dr) represents the error of
determining the central position. For example, the positions and precisions of three points are
defined as (x1 ± dx1, y1 ± dy1), (x2 ± dx2, y2 ± dy2), (x3 ± dx3, y3 ± dy3) and the corresponding radius
(ri) of the circle as (ri+dri). Following the equations below, we finally determined the spatial
location of the central point and the standard error in localizing the center.
{
𝑟12 = (𝑥1 − 𝑥0)
2 + (𝑦1 − 𝑦0)2
𝑟22 = (𝑥2 − 𝑥0)
2 + (𝑦2 − 𝑦0)2
𝑟32 = (𝑥3 − 𝑥0)
2 + (𝑦3 − 𝑦0)2 , (3)
Resolve the functions:
{
𝑥0 = 𝑓(𝑥1, 𝑦1, 𝑥2, 𝑦2, 𝑥3, 𝑦3)𝑦0 = 𝑔(𝑥1, 𝑦1, 𝑥2, 𝑦2, 𝑥3, 𝑦3)
𝑟 = ℎ(𝑥1, 𝑦1, 𝑥2, 𝑦2, 𝑥3, 𝑦3), (4)
Estimated error (dx0, dy0, dr):
Jour
nal o
f Cel
l Sci
ence
• A
dvan
ce a
rtic
le

{
𝑑𝑥0 = √(𝜕𝑓
𝜕𝑥1𝑑𝑥1)
2 + (𝜕𝑓
𝜕𝑦1𝑑𝑦1)
2 + (𝜕𝑓
𝜕𝑥2𝑑𝑥2)
2 + (𝜕𝑓
𝜕𝑦2𝑑𝑦2)
2 + (𝜕𝑓
𝜕𝑥3𝑑𝑥3)
2 + (𝜕𝑓
𝜕𝑦3𝑑𝑦3)
2
𝑑𝑦 = √(𝜕𝑔
𝜕𝑥1𝑑𝑥1)
2 + (𝜕𝑔
𝜕𝑦1𝑑𝑦1)
2 + (𝜕𝑔
𝜕𝑥2𝑑𝑥2)
2 + (𝜕𝑔
𝜕𝑦2𝑑𝑦2)
2 + (𝜕𝑔
𝜕𝑥3𝑑𝑥3)
2 + (𝜕𝑔
𝜕𝑦3𝑑𝑦3)
2
𝑑𝑟 = √(𝜕ℎ
𝜕𝑥1𝑑𝑥1)
2
+ (𝜕ℎ
𝜕𝑦1𝑑𝑦1)
2
+ (𝜕ℎ
𝜕𝑥2𝑑𝑥2)
2
+ (𝜕ℎ
𝜕𝑦2𝑑𝑦2)
2
+ (𝜕ℎ
𝜕𝑥3𝑑𝑥3)
2
+ (𝜕ℎ
𝜕𝑦3𝑑𝑦3)
2
, (5)
In detail, a program code in Wolfram Mathmatica 10.0. was utilized to calculate the above
parameters, as below:
Clear [x, y, z, x1, x2, x3, y1, y2, y3, dx, dy, dz, dx1, dy1, dx2, dy2, dx3, dy3, data, datax, datay,
dataz];
data = Solve[(x - x1)^2 + (y - y1)^2 == z^2 && (x - x2)^2 + (y - y2)^2 == z^2 &&
(x - x3)^2 + (y - y3)^2 == z^2, {x, y, z}, Reals];
datax = x /. data[[2]];
datay = y /. data[[2]];
dataz = z /. data[[2]];
dx = Sqrt[(D[datax, x1] dx1)^2 + (D[datax, y1] dy1)^2 + (D[datax, x2] dx2)^2 +
(D[datax, y2] dy2)^2 + (D[datax, x3] dx3)^2 + (D[datax, y3] dy3)^2];
dy = Sqrt[(D[datay, x1] dx1)^2 + (D[datay, y1] dy1)^2 + (D[datay, x2] dx2)^2 +
Jour
nal o
f Cel
l Sci
ence
• A
dvan
ce a
rtic
le

(D[datay, y2] dy2)^2 + (D[datay, x3] dx3)^2 + (D[datay, y3] dy3)^2];
dz = Sqrt[(D[dataz, x1] dx1)^2 + (D[dataz, y1] dy1)^2 + (D[dataz, x2] dx2)^2 +
(D[dataz, y2] dy2)^2 + (D[dataz, x3] dx3)^2 + (D[dataz, y3] dy3)^2];
Finally, all data points along each measured NPC are rotated according to the position of the
reference point that has the highest localization precision, which is positioned to the 0- or 360-
degree position along a circle. The standard error of localization precision for the circle center
(σcircle center) is 0.7-1 nm and for the reference points (σreference) is 0.6-1 nm. Finally, the standard
error of localizing each Nups position was determined to be < 3 nm according to the formula of
√𝜎2 + 𝜎𝑐𝑖𝑟𝑐𝑙𝑒 𝑐𝑒𝑛𝑡𝑒𝑟2 + 𝜎𝑟𝑒𝑓𝑒𝑟𝑒𝑛𝑐𝑒2 (6)
Standard Error. Experimental measurements are reported as standard errors of the mean unless
otherwise noted.
Jour
nal o
f Cel
l Sci
ence
• A
dvan
ce a
rtic
le

Acknowledgements
This work was supported by grants from the National Institutes of Health (NIH GM097037 and
GM116204 to W.Y).
Competing Interests
The authors declare no competing interests.
Author Contributions
J.M., J.K. and W.Y. conceived, designed and performed experiments, J.M. and J.K. analyzed data
and prepare figures, and J.M., J.K., S.J. and W.Y. wrote the manuscript.
Funding
This work was supported by grants from the National Institutes of Health (NIH GM094041,
GM097037 and GM116204).
Jour
nal o
f Cel
l Sci
ence
• A
dvan
ce a
rtic
le

References
Akey, C. W. (1989) Interactions and structure of the nuclear pore complex revealed by cryo-
electron microscopy. J. Cell Biol. 109, 955-970.
Alber, F., Dokudovskaya, S., Veenhoff, L. M., Zhang, W., Kipper, J., Devos, D., Suprapto, A. et
al. (2007) Determining the architectures of macromolecular assemblies. Nature 450, 683-694.
von Appen, A., and Beck, M. (2016) Structure Determination of the Nuclear Pore Complex with
Three-Dimensional Cryo electron Microscopy. Journal of molecular biology 428, no. 10 2001-
2010.
Beck, M., Lucic, V., Forster, F., Baumeister, W., and Medalia, O. (2007). Snapshots of nuclear
pore complexes in action captured by cryo-electron tomography. Nature 449, 611-615.
Belgareh, N. and Doye, V. (1997) Dynamics of nuclear pore distribution in nucleoporin mutant
yeast cells. J. Cell Biol. 136, 747-759.
Bilokapic, S. and Schwartz, T. U. (2012) 3D ultrastructure of the nuclear pore complex. Curr.
Opin. Cell Biol. 24, 86-91.
Brohawn, S. G., Leksa, N. C., Spear, E. D., Rajashankar, K. R., and Schwartz, T. U. (2008)
Structural evidence for common ancestry of the nuclear pore complex and vesicle
coats. Science 322, 1369-1373.
Bui, K. H., von Appen, A., DiGuilio, A. L.; Ori, Lenore Sparks, A., Mackmull, M.T., Bock, T. et
al. (2013) Integrated structural analysis of the human nuclear pore complex scaffold. Cell 155,
no. 6 1233-1243.
Cronshaw, J. M., Krutchinsky, A. N., Zhang, W., Chait, B. T., and Matunis, M. (2002).
J.Proteomic analysis of the mammalian nuclear pore complex. J. Cell Biol. 158, 915–927.
Jour
nal o
f Cel
l Sci
ence
• A
dvan
ce a
rtic
le

Doye, V. and Hurt, E. (1997) From nucleoporins to nuclear pore complexes. Curr. Opin. Cell
Biol. 9, 401-411.
Frenkiel-Krispin, D., Maco, B., Aebi, U., and Medalia, O. (2010) Structural analysis of a metazoan
nuclear pore complex reveals a fused concentric ring architecture. J. Mol. Biol. 395, 578-586.
Grunwald, D., Singer, R. H., and Rout, M. (2011). Nuclear export dynamics of RNA-protein
complexes. Nature 475, 333-341.
Hallberg E, Wozniak RW, and Blobel G. (1993). An integral membrane protein of the pore
membrane domain of the nuclear envelope contains a nucleoporin-like region. J. Cell Biol.
122, 513-521.
Hinshaw, J. E., Carragher, B.O., and Milligan, R. A. (1992) Architecture and design of the nuclear
pore complex. Cell 69, 1133-1141.
Hurt, E. and Beck, M. (2015) Towards understanding nuclear pore complex architecture and
dynamics in the age of integrative structural analysis. Curr. Opin. Cell Biol. 34 31-38.
Kain, S. R., Adams, M., Kondepudi, A., Yang, T. T., Ward, W. W., and Kitts, P. (1995) Green
fluorescent protein as a reporter of gene expression and protein localization. Biotechniques 19,
650-655.
Kampmann, M., Atkinson, C. E., Mattheyses, A. L., and Simon, S. M. (2011). Mapping the
orientation of nuclear pore proteins in living cells with polarized fluorescence microscopy.
Nat. Struct. & Mol. Biol. 18, 643-649.
Kanda, T., Sullivan, K. F., and Wahl, G. M. (1998) Histone–GFP fusion protein enables sensitive
analysis of chromosome dynamics in living mammalian cells. Curr. Biol. 8, 377-385.
Kohler, A. and Hurt, E. (2007). Exporting RNA from the nucleus to the cytoplasm. Nat. Rev. Mol.
Cell Bio. 8, 761-773.
Jour
nal o
f Cel
l Sci
ence
• A
dvan
ce a
rtic
le

Kubitscheck, U., Grunwald, D., Hoekstra, A., Rohleder, D., Kues, T., Siebrasse, J. P., and Peters,
P. (2005). "Nuclear transport of single molecules dwell times at the nuclear pore complex." J.
Cell Biol. 168, 233-243.
Löschberger, A., van de Linde, S., Dabauvalle, M. C., Rieger, B., Heilemann, M., Krohne, G., and
Sauer, M. (2012). Super-resolution imaging visualizes the eightfold symmetry of gp210
proteins around the nuclear pore complex and resolves the central channel with nanometer
resolution. J. Cell Sci. 125, 570-575.
Ma J. and Yang W. (2010) Three-Dimensional Distribution of Transient Interactions in the Nuclear
Pore Obtained by Single-Molecule Snapshots. Proc. Natl. Acad. Sci. USA 107, 7305-7310.
Ma, J., Goryaynov, A., Sarma, A., and Yang, W. (2012). Self-Regulated Viscous Channel in the
Nuclear Pore Complex. Proc. Natl. Acad. Sci. USA 109, 7326-7331.
Ma J., Liu Z., Michelotti N., Pitchiaya S., Veerapaneni R., Androsavich J., Walter N. and Yang
W. (2013) High-resolution three-dimensional mapping of mRNA export through the nuclear
pore. Nature Communications 4:2414 doi:10.1038/ncomms3414.
Ma J., Garyaynov A. and Yang W. (2016) Super-resolution Three-dimensional Tomography of
Interactions and Competitions in the Nuclear Pore Complex. Nature Structral & Molecular
Biology 23, 239-247.
Maimon, T., Elad, N., Dahan, I., and Medalia, O. (2012) The human nuclear pore complex as
revealed by cryo-electron tomography. Struct. 20, 998-1006.
Mattaj, I. W. and Englmeier, L. (1998) Nucleocytoplasmic transport: the soluble phase. Ann. Rev.
Biochem. 67, 265-306.
Mi, L., Goryaynov, A., Lindquist, A., Rexach, M., and Yang, W. (2015) Quantifying Nucleoporin
Stoichiometry inside Single Nuclear Pore Complexes In vivo. Scientific reports 5.
Jour
nal o
f Cel
l Sci
ence
• A
dvan
ce a
rtic
le

Milles, S. and Lemke, E. A. (2011) Single molecule study of the intrinsically disordered FG-repeat
nucleoporin 153. Biophysical J., 101, 1710-1719.
Ori, A., Andres-Pons, A., and Beck, M. (2013) The use of targeted proteomics to determine the
stoichiometry of large macromolecular assemblies. Methods Cell Biol. 122, 117-146.
Ori, A., Banterle, N., Iskar, M., Andrés‐Pons, A., Escher, C., Bui, H.K., Sparks, L., Solis‐
Mezarino, V., Rinner, O., Bork, P. and Lemke, E.A., 2013. Cell type‐specific nuclear pores: a
case in point for context‐dependent stoichiometry of molecular machines. Molecular systems
biology, 9(1), p.648
Patel, S. S., Belmont, B. J., Sante, J. M., and Rexach, M. F. (2007) "Natively unfolded nucleoporins
gate protein diffusion across the nuclear pore complex." Cell 129, 83-96.
Pleiner, Tino, Mark Bates, Sergei Trakhanov, Chung-Tien Lee, Jan Erik Schliep, Hema Chug,
Marc Böhning, Holger Stark, Henning Urlaub, and Dirk Görlich. "Nanobodies: site-specific
labeling for super-resolution imaging, rapid epitope-mapping and native protein complex
isolation." eLife (2015): e11349.
Rabut, G., Doye, V., and Ellenberg, J. (2004) Mapping the dynamic organization of the nuclear
pore complex inside single living cells. Nat. Cell Biol. 6, 1114-1121.
Rabut, G., Valérie D., and Ellenberg, J. (2004). Mapping the dynamic organization of the nuclear
pore complex inside single living cells. Nat. Cell Biol. 6, 1114-1121.
Reichelt, R., Holzenburg, A., Buhle, E. L. Jr., Jarnik M., Engel A., and Aebi, U. (1990). Correlation
between Structure and Mass-Distribution of the Nuclear-Pore Complex and of Distinct Pore
Complex Components. J. Cell Biol. 110, 883-894.
Jour
nal o
f Cel
l Sci
ence
• A
dvan
ce a
rtic
le

Ries, J., Kaplan, C., Platonova, E., Eghlidi, H., and Ewers, H. (2012). A simple, versatile method
for GFP-based super-resolution microscopy via nanobodies. Nat. Methods 9, 582-584.
Rust, M. J., Bates, M., and Zhuang, X. W. (2006). Sub-diffraction-limit imaging by stochastic
optical reconstruction microscopy (STORM). Nat. Methods 3, 793-795.
Schermelleh, L., Carlton, P. M., Haase, S., Shao, L., Winoto, L., Kner, P., Burke, B. et al. (2008)
Subdiffraction multicolor imaging of the nuclear periphery with 3D structured illumination
microscopy. Science 320, 1332-1336.
Stoffler, D., Fahrenkrog, B., and Aebi, U. (1999) The nuclear pore complex: from molecular
architecture to functional dynamics. Curr. Opin. Cell Biol. 11, 391-401.
Suntharalingam, M. and Wente, S. R. (2003) Peering through the pore: nuclear pore complex
structure, assembly, and function. Developmental Cell 4, 775-789.
Szymborska, A., de Marco, A., Daigle, N., Cordes, V. C., Briggs, J. A. G., and Ellenberg, J.
(2013). Nuclear Pore Scaffold Structure Analyzed by Super-Resolution Microscopy and
Particle Averaging. Science 341, 655-658.
Talamas, J. A. and Hetzer, M. W. (2011) POM121 and Sun1 play a role in early steps of interphase
NPC assembly. J. Cell Biol. 194, 27-37.
Tamura, K. and Hara-Nishimura, I. (2012) The molecular architecture of the plant nuclear pore
complex. J. Exp. Bot. 258.
Terry, L. J. and Wente, S. R. (2009) Flexible gates: dynamic topologies and functions for FG
nucleoporins in nucleocytoplasmic transport. Euk. Cell 8, 1814-1827.
Thompson R-E, Larson D-R, Webb W-W (2002) Precise nanometer localization analysis for
individual fluorescent probes. Biophys J 82, 2775–2783.
Jour
nal o
f Cel
l Sci
ence
• A
dvan
ce a
rtic
le

Vasu, S. K., and Forbes, D. J. (2001) Nuclear pores and nuclear assembly. Curr. Opin. Cell
Biol. 13, 363-375.
Vollmer, B., and Antonin, W. (2014). The diverse roles of the Nup93/Nic96 complex proteins–
structural scaffolds of the nuclear pore complex with additional cellular functions. Biological
chemistry, 395(5), 515-528.
Xie, W., Horn, H. F., and Wright, G. D. (2016) Superresolution Microscopy of the Nuclear
Envelope and Associated Proteins. Methods Mol. Biol. 1411, 83-97.
Yamada, J., Phillips, J. L., Patel, S., Goldfien, G., Calestagne-Morelli, A., Huang, H., Reza, R. et
al. (2010) A bimodal distribution of two distinct categories of intrinsically disordered
structures with separate functions in FG nucleoporins. Mol. & Cell. Prot. 9, 2205-2224.
Yang, T., Sinai, P., Green, G., Kitts, P. A., Chen, Y., Lybarger, L., Chervenak, R., Patterson, G.
H., Piston, D. W., and Kain, S. R. (1998) Improved fluorescence and dual color detection with
enhanced blue and green variants of the green fluorescent protein. J. Biol. Chem. 273, 8212-
8216.
Jour
nal o
f Cel
l Sci
ence
• A
dvan
ce a
rtic
le

Table 1. Copy number, radial and axial dimension of POM121, Nup35 and Nup37 in the
native NPC. The axial (xz plane) and radial (xy plane) dimensions of NPC are defined in Figure
1
Name of
Nup
Number of
copies per
NPC
Lanes along axial
dimension (in XZ
plane)
Axial dimension
(distance between
two lanes)
Radial dimension
(diameter in XY plane)
POM 121 8 1 0 nm 118 ± 4 nm
Nup 35 16 2 7 ± 3 nm 64 ± 5 nm
Nup 37 32 2 36 ± 3 nm 90 ± 4 nm
.
Jour
nal o
f Cel
l Sci
ence
• A
dvan
ce a
rtic
le

Figures
Jour
nal o
f Cel
l Sci
ence
• A
dvan
ce a
rtic
le
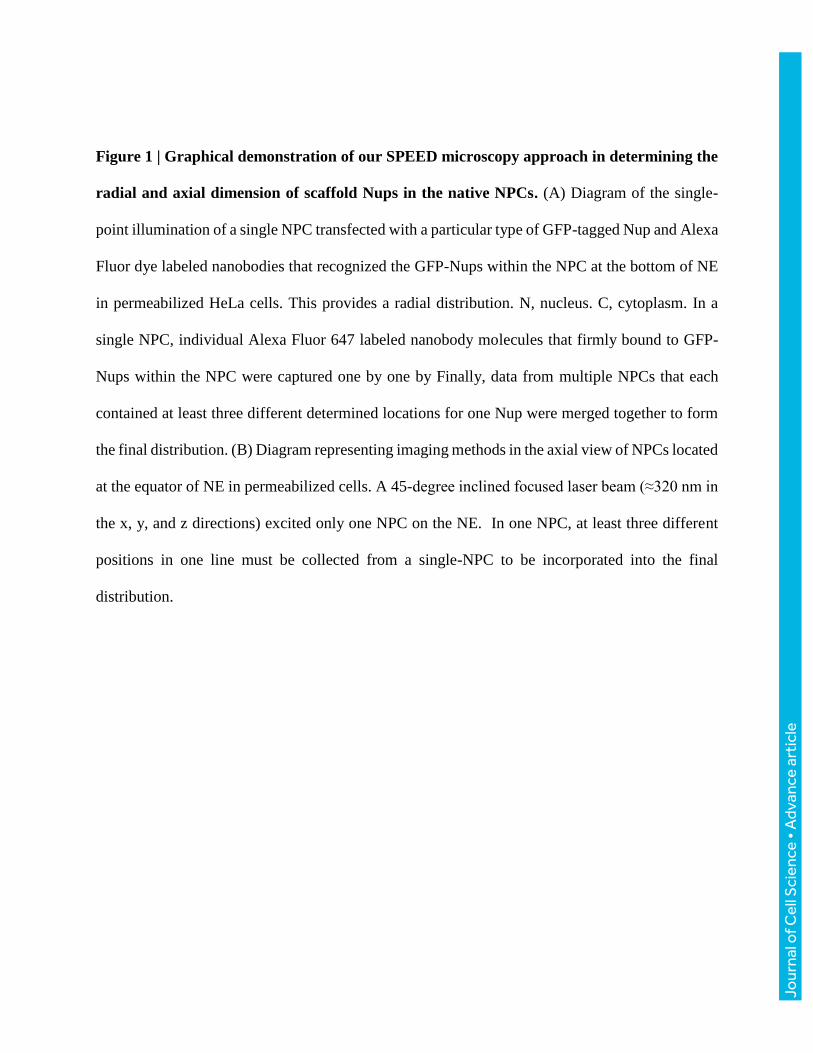
Figure 1 | Graphical demonstration of our SPEED microscopy approach in determining the
radial and axial dimension of scaffold Nups in the native NPCs. (A) Diagram of the single-
point illumination of a single NPC transfected with a particular type of GFP-tagged Nup and Alexa
Fluor dye labeled nanobodies that recognized the GFP-Nups within the NPC at the bottom of NE
in permeabilized HeLa cells. This provides a radial distribution. N, nucleus. C, cytoplasm. In a
single NPC, individual Alexa Fluor 647 labeled nanobody molecules that firmly bound to GFP-
Nups within the NPC were captured one by one by Finally, data from multiple NPCs that each
contained at least three different determined locations for one Nup were merged together to form
the final distribution. (B) Diagram representing imaging methods in the axial view of NPCs located
at the equator of NE in permeabilized cells. A 45-degree inclined focused laser beam (≈320 nm in
the x, y, and z directions) excited only one NPC on the NE. In one NPC, at least three different
positions in one line must be collected from a single-NPC to be incorporated into the final
distribution.
Jour
nal o
f Cel
l Sci
ence
• A
dvan
ce a
rtic
le

Figure 2 | Super-resolution mapping of scaffold nucleoporins in the radial and axial
dimension. (A) Typical single-molecule consecutive fluorescent images for nanobody-NPC
interaction events with 50 ms per frame (above). Scale bar: 500 nm. The recorded photon count
for Alexa Fluor 647 tagged nanobody binding event within the pore (below). (B) Merged image
of frames 1-6 provide a localization precision of ~1.6 nm in determining the centroid of a Nup
with 2D Gaussian fitting. Scale bar: 500 nm. (C-E) The obtained radial view data for GFP-
Jour
nal o
f Cel
l Sci
ence
• A
dvan
ce a
rtic
le

POM121 in the NPC. Fifty-six locations were obtained from sixteen cells. The diameter of
locations was determined as 118 ± 4 nm (C), the angular distribution revealing eightfold geometry
(D) shown eight fold spatial locations, and a cartoon demonstrating the distribution of POM121
(purple ovals) at the cross-section of scaffold region of NPC (E). (F-H) The determined axial view
data for GFP-POM121 in the NPC. Only a single layer was observed for POM121 in the axial
direction (F-G) and a cartoon shown POM121 (purple ovals) locating at the scaffold of NPC (H).
Jour
nal o
f Cel
l Sci
ence
• A
dvan
ce a
rtic
le

Jour
nal o
f Cel
l Sci
ence
• A
dvan
ce a
rtic
le

Figure 3 | Spatial Locations of Nup37 and Nup35 within the NPC. (A) Radial distribution for
Nup37. Twenty-seven locations were obtained from eight cells. The diameter of Nup37 locations
is 90 ± 4 nm. (B) Angular distribution of (A). (C) Diagram of the radial view of Nup37 (red ovals).
(D) The axial spatial locations of Nup37 were fitted well by two lines, suggesting a two-layer
distribution along the axial dimension. (E) Spatial distribution of Nup37 along the axial dimension
shown two peaks with a distance of 36 ± 3 nm. (F) Diagram of Nup37 (red ovals) at the axial view.
(G) Sixty eight locations were obtained from twenty cells. The radial distribution for Nup35 has a
diameter of 64 ± 5 nm. (H) Angular distribution of (G). (I) Diagram of the radial view for Nup35
(purple ovals). (J) Two-line distributions of Nup35 at the axial view. (K) Spatial distribution at the
axial dimension for Nup35 with a distance of 7 ± 3 nm between the peak lines. (L) Diagram of
Nup35 (purple ovals) at the axial view.
Jour
nal o
f Cel
l Sci
ence
• A
dvan
ce a
rtic
le

D
C
J. Cell Sci. 130: doi:10.1242/jcs.193912: Supplementary information
Jour
nal o
f Cel
l Sci
ence
• S
uppl
emen
tary
info
rmat
ion

Figure S1 Epi-fluorescence imaging of GFP-NPCs recognized by Alexa Fluor 647 labeled
anti-GFP nanobodies at micro-molar concentration and single-molecule photon collection
and precision for nanobodies binding GFP-Nups at 0.1 nM by SPEED microscopy. (A) On
the left is a cartoon representation of GFP-Pom121 proteins bound and incorporated into a single
NPC. Pom121 is represented as purple with GFP shown as its beta-barrel structure (green). Anti-
GFP nanobodies (blue) are shown conjugated to Alexa Fluor 647 (red). These nanobodies are
shown binding firmly to GFP-Pom121 or freely diffusing through the NPC. (B) Epi-fluorescence
radial view (bottom-view) imaging of the nucleus is shown in green and red channels
respectively for GFP-Pom121 and 0.5-M Alexa Fluor 647 labeled nanobodies. A merge of
these two channels (yellow) suggests that nanobody nearly saturated the available GFP-Pom121
binding sites in the NPCs at its high micro-molar concentrations. For Epi-fluorescence axial-
view (side-view) imaging at the equator of the nucleus: red and green channels are similarly
shown before and after merging. (C-D) Shown are six consecutive frames captured by SPEED
microscopy. Each frame represents 50 ms of recording time for the fluorescence obtained from
an Alexa Fluor 647- conjugated anti-GFP nanobody bound to a GFP-Nup within a single NPC. N
represents the total photon count for each frame and σ represents the localization precision
obtained for each frame, as shown in Equation (1) of Materials and Methods. The six frames are
merged together reaching a photon count of 23,643 photons and correspondingly 1.6-nm
localization precision.
J. Cell Sci. 130: doi:10.1242/jcs.193912: Supplementary information
Jour
nal o
f Cel
l Sci
ence
• S
uppl
emen
tary
info
rmat
ion

J. Cell Sci. 130: doi:10.1242/jcs.193912: Supplementary information
Jour
nal o
f Cel
l Sci
ence
• S
uppl
emen
tary
info
rmat
ion

Fig. S2. Montage and reconstruction of spatial positions obtained from individual NPCs for
scaffold nups. (A) Data obtained from four randomly selected individual NPCs for Pom121 are
used to demonstrate our analysis process. Above shows the radial distribution, while below
shows the axial distribution. In the radial dimension, the obtained spatial data points are fit along
a circle function (red cycle). As described by Equation (3-5) in the Materials and Methods, the
center of the circle is calculated based on a permutation of all possible centers between each
three or more data points. Once the center is calculated, the data point with the highest precision
is rotated to be located at the 0- or 360-degree position along the circle. In the axial dimension,
the data points are fit to one or more lines (red line). Data along the axial dimension could
distribute as 1, 2, or 4 isolated lines in the Y direction according to models shown in Fig. S3. The
final data for each dimension is seen on the right side. (B) Data obtained from four randomly
selected individual NPCs for Nup 37. Above shows the radial distribution, while below shows
the axial distribution. The final data for each dimension is seen on the right side. (C) Data
obtained from four randomly selected individual NPCs for Nup 35. Above shows the radial
distribution, while below shows the axial distribution. The final data for each dimension is
shown on the right side.
J. Cell Sci. 130: doi:10.1242/jcs.193912: Supplementary information
Jour
nal o
f Cel
l Sci
ence
• S
uppl
emen
tary
info
rmat
ion

J. Cell Sci. 130: doi:10.1242/jcs.193912: Supplementary information
Jour
nal o
f Cel
l Sci
ence
• S
uppl
emen
tary
info
rmat
ion

Fig. S3. Possible models for Nups distributions in the NPC. Model (i) represents a single layer
of 8-fold rotational symmetry yielding a total copy number of 8. Model (ii) represents a single
layer of 16 copies of a Nup grouped in pairs of 8-fold symmetry. This formation could possible
cause three locations for each paired Nup when determined the location experimentally depending
on the distance between the paired Nups. Model (iii) represents two layers of 8 fold symmetry
along the axis of the NPC yielding a final copy number of 16. Model (iv) represents a similar
distribution to (iii) except the two layers of rotational symmetry have some offset in regard to
angular positioning. Model (v) represents a Nup distribution in which the Nup is present as two
layers of 16 nups grouped in pairs yielding a final Nup count of 32. Model (vi) represents another
possible formation for Nups present at 32 copies per NPC with four layers each with 8 Nups.
J. Cell Sci. 130: doi:10.1242/jcs.193912: Supplementary information
Jour
nal o
f Cel
l Sci
ence
• S
uppl
emen
tary
info
rmat
ion

Fig. S4. Copy number of GFP-Nup per NPC The copy number of GFPs present per NPC is
shown for cells expressing each individual tested scaffold GFP-Nup. Copy number is determined
by the intensity recorded for illuminated GFPs within individual NPCs. Data was normalized by
the intensity of a single-GFP for each condition. N represents number of NPCs and cells. (A)
Data is shown for the copy number of GFP for the stable cell line containing GFP-Pom121. Peak
position is 8 ± 1 nm. (B) Data is shown for the copy number of GFP from the transiently
transfected cell line containing Nup37. (C). Data is shown for the copy number of GFP for the
transiently transfected cell line containing Nup35.
J. Cell Sci. 130: doi:10.1242/jcs.193912: Supplementary information
Jour
nal o
f Cel
l Sci
ence
• S
uppl
emen
tary
info
rmat
ion