Sungha Parka.* a IVD R&D Group, IVD Business Team, Health and Medical Equipment Division, Samsung...
13
Supporting Information Research article Supporting information Improvement of biosensor accuracy using an interference index detection system to minimize the interference effects caused by icterus and hemolysis in blood samples Sungha Park a.* a IVD R&D Group, IVD Business Team, Health and Medical Equipment Division, Samsung Electronics Co., Ltd., 129, Samsung-ro, Yeongtong-gu, Suwon-si, Gyeonggi-do, Republic of Korea. E-mail: [email protected] *Corresponding Author Correspondence and requests for materials should be addressed to Sungha Park (email: [email protected], [email protected]) Electronic Supplementary Material (ESI) for Analyst. This journal is © The Royal Society of Chemistry 2019
Transcript of Sungha Parka.* a IVD R&D Group, IVD Business Team, Health and Medical Equipment Division, Samsung...

Supporting Information Research article
Supporting information
Improvement of biosensor accuracy using an interference index detection system to
minimize the interference effects caused by icterus and hemolysis in blood samples
Sungha Parka.*
a IVD R&D Group, IVD Business Team, Health and Medical Equipment Division, Samsung
Electronics Co., Ltd., 129, Samsung-ro, Yeongtong-gu, Suwon-si, Gyeonggi-do, Republic of
Korea. E-mail: [email protected]
*Corresponding Author
Correspondence and requests for materials should be addressed to Sungha Park (email:
[email protected], [email protected])
Electronic Supplementary Material (ESI) for Analyst.This journal is © The Royal Society of Chemistry 2019

Supporting Information Research article
Fig. S1 Configuration of the sensor chip and optical measurements. (a) The parts of sensor chip. (b) Side view of the upper and lower PET films where reagents were applied. (c) Side view of the assembled sensor chip. (d) Side view of the measurement compartment after inserting the sensor chip into the optical device.
Fig. S2 Reactions of the (a) chloride, (b) BUN, and (c) GGT sensors.

Supporting Information Research article
Correlation between the bilirubin and hemoglobin concentrations and the signal
absorbance values of clinical samples
Regression analysis of bilirubin and hemoglobin interference was performed with the bilirubin
and hemoglobin concentrations of the clinical samples measured by the reference device (P-
modular clinical chemistry analyzer, Roche Diagnostics GmbH). The absorbance values of 79
undiluted clinical samples were measured in the sample measurement well (W2 of Fig. 1) using
the sensor chip in the optical device at OD(405–810 nm), OD(450–810 nm), OD(535–810 nm), and OD(630–
810 nm), and each absorbance value was fitted with the bilirubin and hemoglobin concentration
for regression analysis. The regression scores of each absorbance compared with the bilirubin
concentration were 0.9302 for OD(405–810 nm), 0.9625 for OD(450–810 nm), 0.7974 for OD(535–810 nm),
and 0.5002 for OD(630–810 nm) (Fig. S3a–d). These results confirmed that the absorbance values
of the clinical samples were highly correlated with the bilirubin concentrations in the order of
OD(450–810 nm), OD(405–810 nm), OD(535–810 nm), and OD(630–810 nm). In addition, bilirubin- and
hemoglobin-spiked clinical samples were measured to confirm specific reactions with bilirubin
and hemoglobin. The signal response curve between the clinical samples and the spiked
samples was not a good match. The OD(450–810 nm) results showed a better match than those
obtained at the other absorbance values, but a more specific absorbance equation is required
for bilirubin. Additional regression analysis of the absorbance values of the clinical samples
showed that OD[(450–810 nm) − (535–810 nm) − (630–810 nm)] had the highest correlation with the bilirubin
concentration (Fig. 3e), and the signal response curve between the clinical sample and the
spiked sample was also a good match.
The regression score of each absorbance compared with the hemoglobin concentration was
0.9945 for OD(405–810 nm), 0.9810 for OD(450–810 nm), 0.9175 for OD(535–810 nm), and 0.6807 for
OD(630–810 nm) (Fig. S4a–d). The absorbance with the highest regression score for the

Supporting Information Research article
hemoglobin concentration among individual absorbance values was OD(405–810 nm). The signal
response curve between the clinical samples and the spiked samples was also a good match.
Fig. S3 Results of linear regression between the absorbance values and the reference bilirubin concentration. Undiluted clinical samples (n = 79) and clinical samples spiked with bilirubin were measured in W2 using the sensor chips in the optical device. Each spiked sample was analyzed three times. The clinical samples were also measured in the reference device to obtain reference bilirubin concentrations. The absorbance values at (a) OD(405–810 nm), (b) OD(450–810
nm), (c) OD(535–810 nm), and (d) OD(630–810 nm) were fitted with the reference bilirubin concentrations. (e) The calculated OD[(450–810 nm) − (535–810 nm) − (630–810 nm)].

Supporting Information Research article
Fig. S4 Results of linear regression between the absorbance values and the reference hemoglobin concentration. Undiluted clinical samples (n = 79) and clinical samples spiked with bilirubin were measured in W2 using the sensor chips in the optical device. Each spiked sample was analyzed three times. The clinical samples were also measured in the reference device to obtain reference hemoglobin concentrations. The absorbance values at (a) OD(405–810
nm), (b) OD(450–810 nm), and (c) OD(535–810 nm), and (d) OD(630–810 nm) were fitted with the reference hemoglobin concentrations.

Supporting Information Research article
Normalization factor selection for the chloride, BUN, and GGT sensors
The bilirubin- and hemoglobin-spiked clinical samples were measured using the chloride,
BUN, and GGT sensor chips in the optical device. The absorbance values of the chloride, BUN,
and GGT were calculated using Eqs. 1, 2, and 3 in Section 2.3, respectively (chloride in Fig.
S5, BUN in Fig. S6, and GGT in Fig. S7). The absorbance values for bilirubin and hemoglobin
in the samples were measured in W2. The absorbance values were calculated using BID and
HID. The absorbance values obtained by reacting bilirubin- and hemoglobin-spiked clinical
samples in the chloride, BUN, and GGT sensors were calculated using (BID + HID)/C. The
chloride sensor did not require normalization because there was no difference in absorbance
scale between (BID + HID) and chloride (Fig. S5a). The normalization factor (Nf) calculated
by (BID + HID)/C was low at about 1 (Fig. S5b). Therefore, the Nf value of chloride was set
at 1.
However, the BUN and GGT sensors were needed to apply the Nf value because of differences
in the absorbance scale between (BID+HID) and C (Fig. S6,7). The blue areas in Figs. S6b and
S7b show the zones for Nf values for the BUN and GGT sensors that can be applied to the
calculation. The Nf values of the BUN and GGT sensors were set at 15 and 150, respectively.
The absorbance values obtained with the IID system using the selected Nf values for the BUN
and GGT sensors confirmed that the absorbance scale difference between C (BUN and GGT)
and IID was offset (Figs. S6c and S7c).
Supporting Information Research article
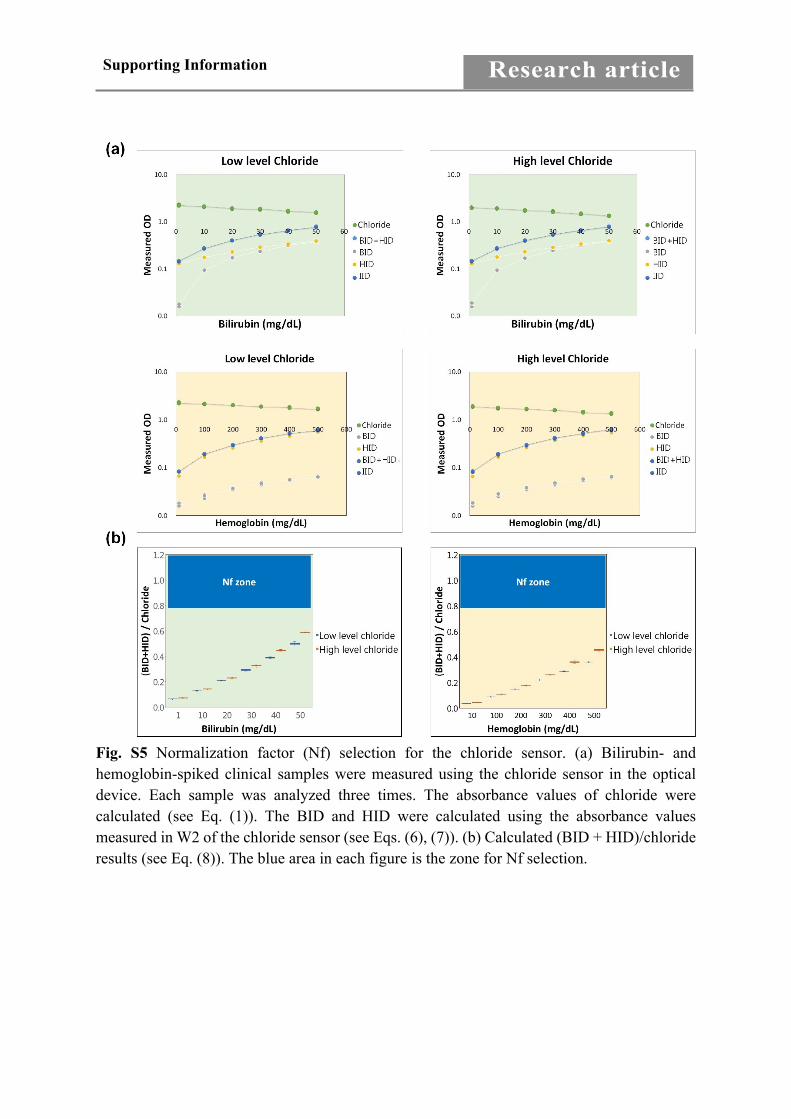
Fig. S5 Normalization factor (Nf) selection for the chloride sensor. (a) Bilirubin- and hemoglobin-spiked clinical samples were measured using the chloride sensor in the optical device. Each sample was analyzed three times. The absorbance values of chloride were calculated (see Eq. (1)). The BID and HID were calculated using the absorbance values measured in W2 of the chloride sensor (see Eqs. (6), (7)). (b) Calculated (BID + HID)/chloride results (see Eq. (8)). The blue area in each figure is the zone for Nf selection.
Supporting Information Research article
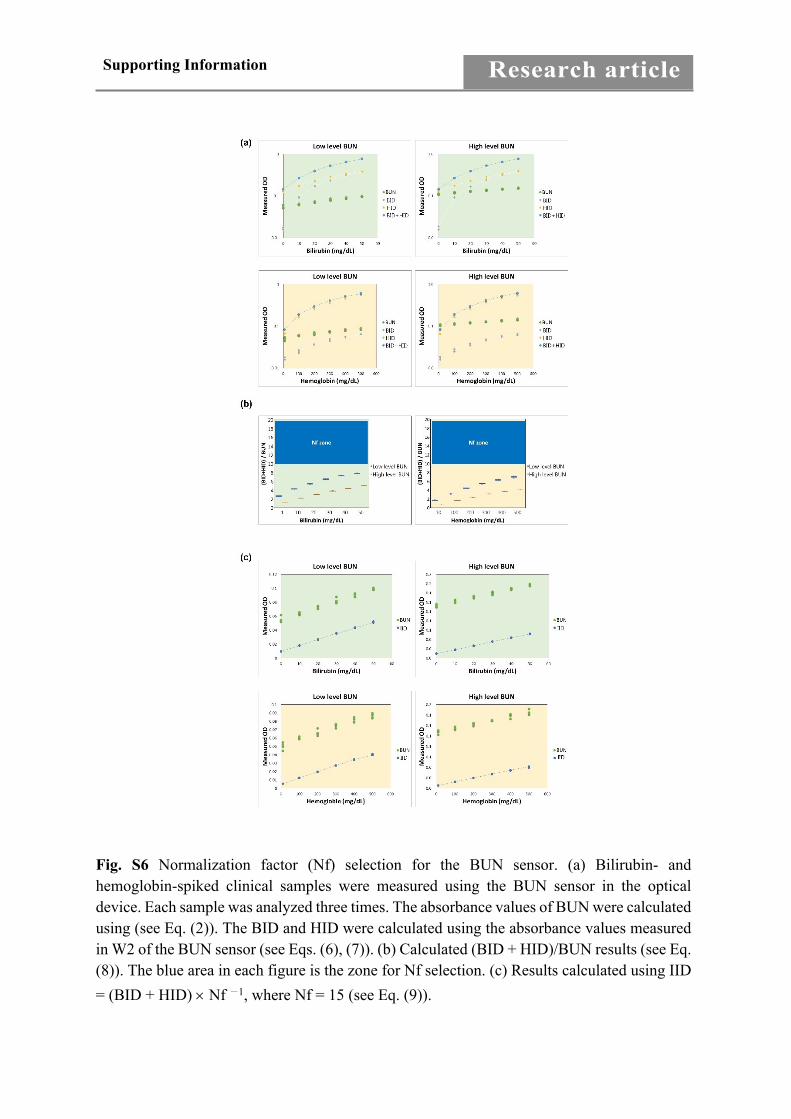
Fig. S6 Normalization factor (Nf) selection for the BUN sensor. (a) Bilirubin- and hemoglobin-spiked clinical samples were measured using the BUN sensor in the optical device. Each sample was analyzed three times. The absorbance values of BUN were calculated using (see Eq. (2)). The BID and HID were calculated using the absorbance values measured in W2 of the BUN sensor (see Eqs. (6), (7)). (b) Calculated (BID + HID)/BUN results (see Eq. (8)). The blue area in each figure is the zone for Nf selection. (c) Results calculated using IID = (BID + HID) Nf −1, where Nf = 15 (see Eq. (9)).

Supporting Information Research article
Fig. S7 Normalization factor (Nf) selection for the GGT sensor. (a) Bilirubin- and hemoglobin-spiked clinical samples were measured using the GGT sensor in the optical device. Each sample was analyzed three times. The absorbance values of GGT were calculated (see Eq. (3)). The BID and HID were calculated using the absorbance values measured in W2 of the GGT sensor (see Eqs. (6), (7)). (b) Calculated (BID + HID)/GGT results (see Eq. (8)). The blue area in each figure is the zone for Nf selection. (c) Results calculated using IID = (BID + HID) Nf −1, where Nf = 15 (see Eq. (9)).

Supporting Information Research article
Fig. S8 Interference test of the chloride sensor with and without the IID system. Clinical samples with bilirubin spiking, hemoglobin spiking, and no spiking (low and high chloride concentrations) were measured using the chloride sensor chip in the optical device. Each sample was analyzed three times. The concentrations of chloride with (see Eq. (10)) and without (see Eq. (1)) the IID system were compared.

Supporting Information Research article
Fig. S9 Interference test of the BUN sensor with and without the IID system. Clinical samples with bilirubin spiking, hemoglobin spiking, and no spiking (low and high chloride concentrations) were measured using the BUN sensor chip in the optical device. Each sample was analyzed three times. The concentrations of BUN with (see Eq. (10)) and without (see Eq. (2)) the IID system were compared.

Supporting Information Research article
Fig. S10 Interference test of the GGT sensor with and without the IID system. Clinical samples with bilirubin spiking, hemoglobin spiking, and no spiking (low and high chloride concentrations) were measured using the GGT sensor chip in the optical device. Each sample was analyzed three times. The concentrations of GGT with (see Eq. (10)) and without (see Eq. (3)) the IID system were compared.

Supporting Information Research article
Fig. S11 Scatter plot to confirm the bias (%) trends for the chloride, BUN, and GGT sensors, with (see Eq. (10)) and without (see Eqs. (1), (2) and (3)) the IID system, with increasing bilirubin and hemoglobin concentrations. Undiluted clinical samples (n = 49 for chloride, n = 41 for BUN, and n = 54 for GGT) were measured using the chloride, BUN, and GGT sensor chips in the optical device. The clinical samples were also measured in the reference device to obtain reference concentrations of chloride, GGT, BUN, bilirubin, and hemoglobin. The bias (%) between the concentrations measured in the optical device and the reference concentrations was analyzed for the bilirubin (a) and hemoglobin (b) concentrations (see Eq. (4)).