Summer 2010 Wrap Up ClimateCenter #4. The climatological summer of 2010 – which runs from June to...
12
Summer 2010 Wrap Up ClimateCenter #4
-
date post
20-Dec-2015 -
Category
Documents
-
view
214 -
download
0
Transcript of Summer 2010 Wrap Up ClimateCenter #4. The climatological summer of 2010 – which runs from June to...
Summer 2010 Wrap Up
ClimateCenter #4
The climatological summer of 2010 – which runs from June to August - is officially over…and the numbers are in…
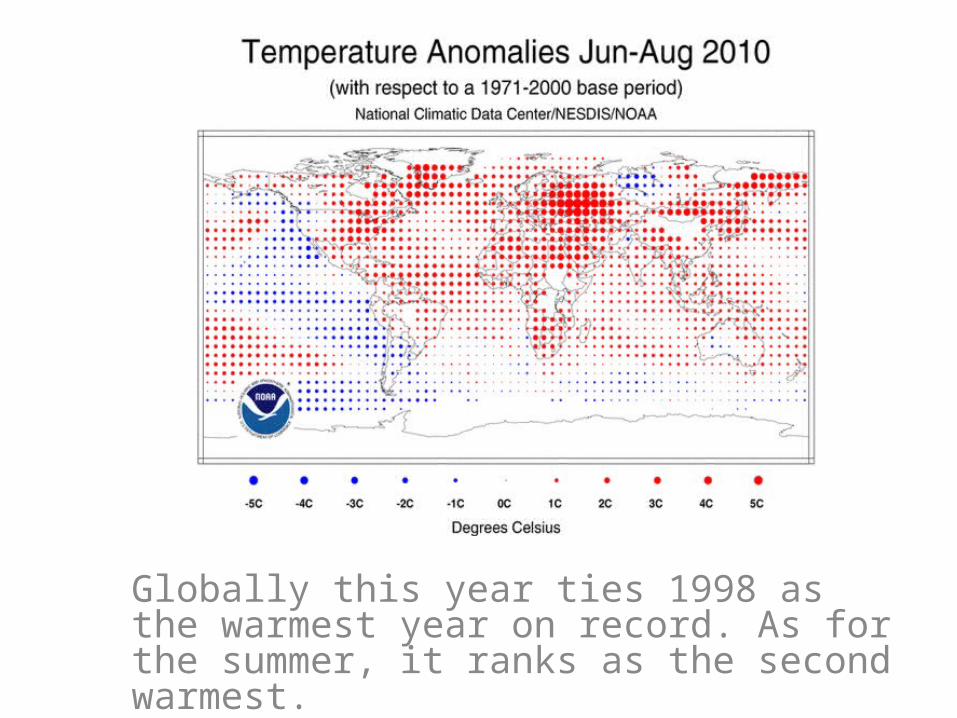
Globally this year ties 1998 as the warmest year on record. As for the summer, it ranks as the second warmest.

Here in the United States it was the 4th warmest summer. But it was definitely a “tale of two coasts”. The East Coast cooked under a persistent ridge of high-pressure while the West Coast was relatively cool. The emerging La Nina may have helped with that. But still, temperature-related energy demand for summer 2010 was the highest of the 116-year record for the lower 48.

Moving on to hurricanes‚ Sept. 10th marked the mid- way point of the 2010 hurricane season. As you can see here, we typically
expect to see relatively little activity until around mid-August. And this year was no different.
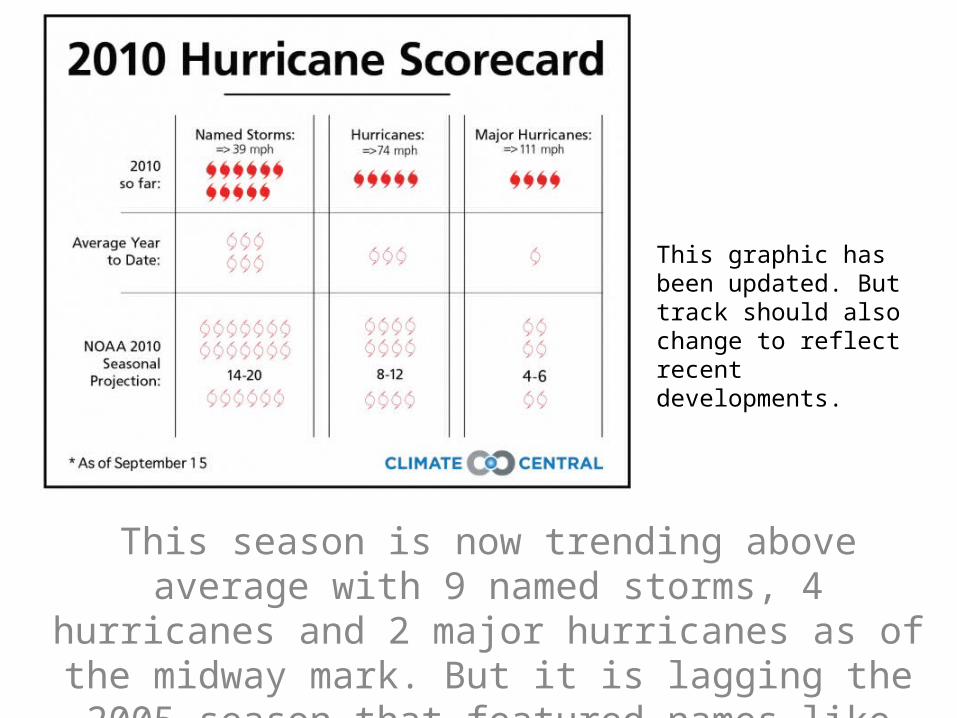
This season is now trending above average with 9 named storms, 4 hurricanes and 2 major hurricanes as of the midway mark. But it is lagging the 2005 season that
featured names like Katrina, Rita and Wilma.
This graphic has been updated. But track should also change to reflect recent developments.

Climate conditions continue to be ideal for hurricane formation‚ with La Nina keeping wind shear down and warm ocean temperatures in the Atlantic providing plenty of fuel. But climate is just half the story.

Local weather conditions are the other half…patches of wind shear and/or dry air can prevent hurricane formation even when large-scale climate factors are favorable for storms to develop. This water vapor image shows Gaston struggling against the dry air that it's embedded in. That said, the 2010 hurricane season is far from over.
Gaston

And finally, a quick check in on La Nina. Sea surface temperatures across much of the Pacific are now running 2 to 3.5 F cooler than average and forecasters say La Nina is
likely to continue through early 2011. What does that mean for our weather?

Typically, La Nina pushes the jet stream and its associated storm tracks farther north.

As a result, the NOAA outlook for fall calls for a warmer southern tier of the US...

…as well as a wetter than average PNW.