Summary of Results from the Telescope Array Experiment
14
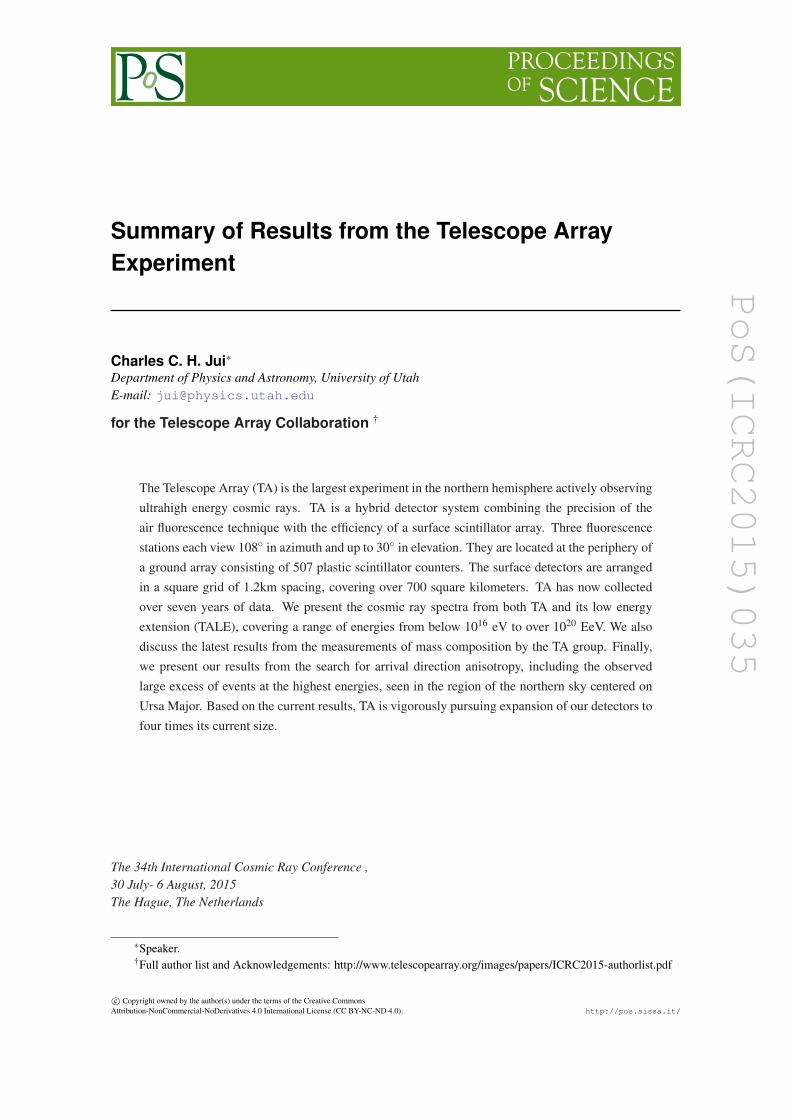
PoS(ICRC2015)035 Summary of Results from the Telescope Array Experiment Charles C. H. Jui * Department of Physics and Astronomy, University of Utah E-mail: [email protected] for the Telescope Array Collaboration † The Telescope Array (TA) is the largest experiment in the northern hemisphere actively observing ultrahigh energy cosmic rays. TA is a hybrid detector system combining the precision of the air fluorescence technique with the efficiency of a surface scintillator array. Three fluorescence stations each view 108 ◦ in azimuth and up to 30 ◦ in elevation. They are located at the periphery of a ground array consisting of 507 plastic scintillator counters. The surface detectors are arranged in a square grid of 1.2km spacing, covering over 700 square kilometers. TA has now collected over seven years of data. We present the cosmic ray spectra from both TA and its low energy extension (TALE), covering a range of energies from below 10 16 eV to over 10 20 EeV. We also discuss the latest results from the measurements of mass composition by the TA group. Finally, we present our results from the search for arrival direction anisotropy, including the observed large excess of events at the highest energies, seen in the region of the northern sky centered on Ursa Major. Based on the current results, TA is vigorously pursuing expansion of our detectors to four times its current size. The 34th International Cosmic Ray Conference , 30 July- 6 August, 2015 The Hague, The Netherlands * Speaker. † Full author list and Acknowledgements: http://www.telescopearray.org/images/papers/ICRC2015-authorlist.pdf c Copyright owned by the author(s) under the terms of the Creative Commons Attribution-NonCommercial-NoDerivatives 4.0 International License (CC BY-NC-ND 4.0). http://pos.sissa.it/
Transcript of Summary of Results from the Telescope Array Experiment
PoS(ICRC2015)035
Summary of Results from the Telescope ArrayExperiment
Charles C. H. Jui∗Department of Physics and Astronomy, University of UtahE-mail: [email protected]
for the Telescope Array Collaboration †
The Telescope Array (TA) is the largest experiment in the northern hemisphere actively observingultrahigh energy cosmic rays. TA is a hybrid detector system combining the precision of theair fluorescence technique with the efficiency of a surface scintillator array. Three fluorescencestations each view 108◦ in azimuth and up to 30◦ in elevation. They are located at the periphery ofa ground array consisting of 507 plastic scintillator counters. The surface detectors are arrangedin a square grid of 1.2km spacing, covering over 700 square kilometers. TA has now collectedover seven years of data. We present the cosmic ray spectra from both TA and its low energyextension (TALE), covering a range of energies from below 1016 eV to over 1020 EeV. We alsodiscuss the latest results from the measurements of mass composition by the TA group. Finally,we present our results from the search for arrival direction anisotropy, including the observedlarge excess of events at the highest energies, seen in the region of the northern sky centered onUrsa Major. Based on the current results, TA is vigorously pursuing expansion of our detectors tofour times its current size.
The 34th International Cosmic Ray Conference ,30 July- 6 August, 2015The Hague, The Netherlands
∗Speaker.†Full author list and Acknowledgements: http://www.telescopearray.org/images/papers/ICRC2015-authorlist.pdf
c© Copyright owned by the author(s) under the terms of the Creative CommonsAttribution-NonCommercial-NoDerivatives 4.0 International License (CC BY-NC-ND 4.0). http://pos.sissa.it/
PoS(ICRC2015)035
Telescope Array Highlight Charles C. H. Jui
1. introduction
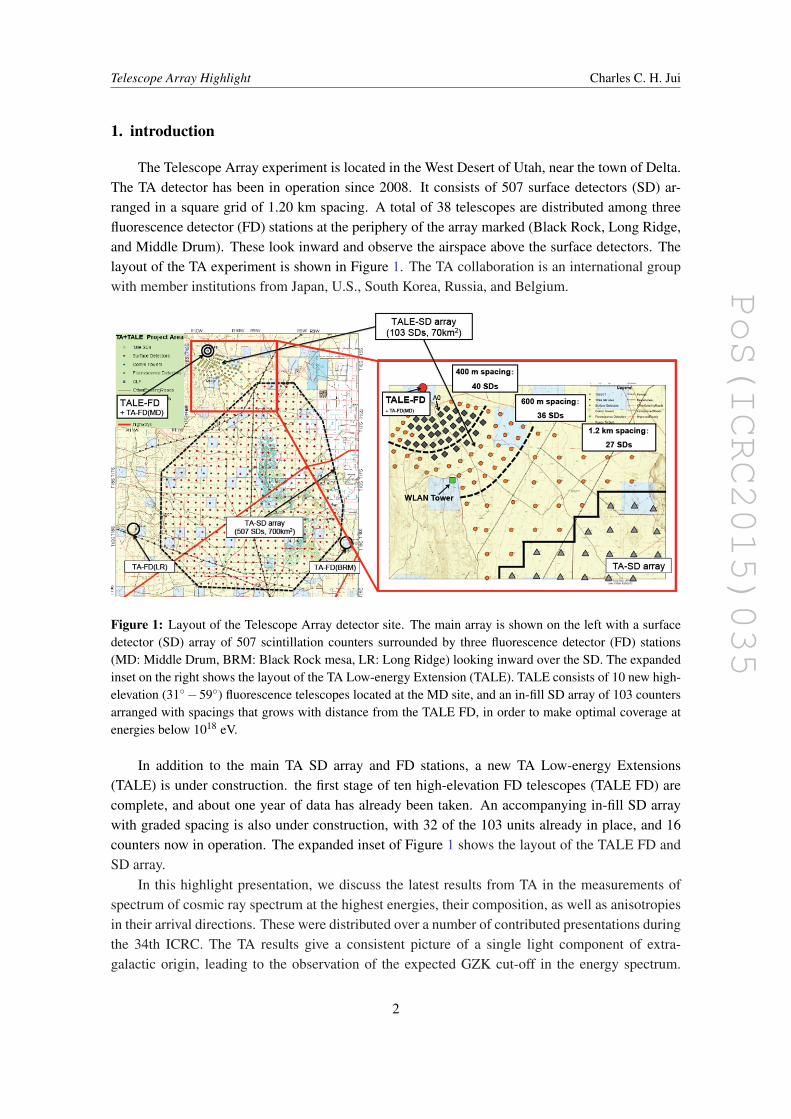
The Telescope Array experiment is located in the West Desert of Utah, near the town of Delta.The TA detector has been in operation since 2008. It consists of 507 surface detectors (SD) ar-ranged in a square grid of 1.20 km spacing. A total of 38 telescopes are distributed among threefluorescence detector (FD) stations at the periphery of the array marked (Black Rock, Long Ridge,and Middle Drum). These look inward and observe the airspace above the surface detectors. Thelayout of the TA experiment is shown in Figure 1. The TA collaboration is an international groupwith member institutions from Japan, U.S., South Korea, Russia, and Belgium.
Figure 1: Layout of the Telescope Array detector site. The main array is shown on the left with a surfacedetector (SD) array of 507 scintillation counters surrounded by three fluorescence detector (FD) stations(MD: Middle Drum, BRM: Black Rock mesa, LR: Long Ridge) looking inward over the SD. The expandedinset on the right shows the layout of the TA Low-energy Extension (TALE). TALE consists of 10 new high-elevation (31◦−59◦) fluorescence telescopes located at the MD site, and an in-fill SD array of 103 countersarranged with spacings that grows with distance from the TALE FD, in order to make optimal coverage atenergies below 1018 eV.
In addition to the main TA SD array and FD stations, a new TA Low-energy Extensions(TALE) is under construction. the first stage of ten high-elevation FD telescopes (TALE FD) arecomplete, and about one year of data has already been taken. An accompanying in-fill SD arraywith graded spacing is also under construction, with 32 of the 103 units already in place, and 16counters now in operation. The expanded inset of Figure 1 shows the layout of the TALE FD andSD array.
In this highlight presentation, we discuss the latest results from TA in the measurements ofspectrum of cosmic ray spectrum at the highest energies, their composition, as well as anisotropiesin their arrival directions. These were distributed over a number of contributed presentations duringthe 34th ICRC. The TA results give a consistent picture of a single light component of extra-galactic origin, leading to the observation of the expected GZK cut-off in the energy spectrum.
2

PoS(ICRC2015)035
Telescope Array Highlight Charles C. H. Jui
The observation of a hotspot in the arrival directions suggests the possibility of a local source orsources.
2. Energy Spectrum
TA had previously published an energy spectrum from the first four years of SD operation[1]. At the 2015 ICRC, TA presented a new combined spectrum that spans in energy from below1016 eV to just above 1020 eV, shown in Figure 2. This plot combines the SD spectrum (uprighttriangles) from seven years of operation [2], the monocular FD spectrum (inverted triangles) [3],and the TALE fluorescence spectrum (open circles) [4]. In addition, the spectrum obtained by anewly developed technique of monocular reconstruction of events dominated by Cerenkov light isalso included [5].
Figure 2: Combined spectrum from the Telescope Array Collaboration, including the 7 year surface de-tector spectrum (upright triangles), the 7 year monocular spectrum from the Black Rock and Long Ridgefluorescence detectors (inverted triangles), the TALE fluorescence spectrum (open circles), and the TALECerenkov spectrum (open squares). The averaged spectrum combining these four measurements is shownby the black circles.
The SD spectrum shows a GZK cut-off [6, 7] at 6σ significance with a break in the spectrum atlog(E/eV) = 19.78±0.06. A dip or ankle structure is also seen at log(E/eV) = 18.70±0.02. Thesimplest explanation for the combination of spectral features is that of interaction between extra-galactic cosmic ray protons and the cosmic microwave background radiation (CMBR) attenuatingthe flux via photo-pion production above the cut-off, and by e+e− pair production above the ankle[8]. The TA spectrum shows an apparent break at just above 1017 eV consistent with the "SecondKnee" feature [9]. Another dip feature is seen just above the 1016 eV, which has been reported byother experiments [10, 11].
3

PoS(ICRC2015)035
Telescope Array Highlight Charles C. H. Jui
The part of the TA SD spectrum above 1018.2 eV has also been fitted to an extra-galacticsource distance distribution parameterized by the function (1+ z)m, where z is the red-shift, and mthe evolution parameter. A pure flux of protons is assumed with a power-law injection spectrum ofthe form E−p. The results are summarized in Figure 3 [12], where plot (a) shows the best-fit curveoverlaid on the measured flux, and plot (b) shows the confidence contours. The best fit values arep = 2.18+0.08
−0.14, and m = 6.8+1.6−1.1 (uncertainties include both statistical and systematic contributions).
While the evolution parameter is relatively large, there is considerable (anti-)correlation betweenthe two parameters. In any case, Figure 3(b) shows good agreement between the fit and data in theregion of the GZK cut-off from purely protons. As was suggested during the contributed sessions,we plan to make this fit for compositions other than proton, as a completely orthogonal measure ofcomposition of the highest energy cosmic rays, to that given by XMAX measurements.
Figure 3: Results of a fit of the TA cosmic ray energy spectrum above 1018.2 eV to a source distributionparameterized by the function (1+ z)m, where z is the red-shift, and m the evolution parameter. A pureprotonic flux is assumed with a power-law injection spectrum of the form E−p.
3. Composition Results using XMAX
The standard measurement of ultrahigh energy cosmic ray composition has been that of theshower maximum depth, XMAX . TA has already published the result from four years of hybridevents collected from the TA Middle Drum FD in coincidence with the surface array [13]. Whencompared to QGSJET-II.3, the results showed a predominately light composition consistent withprotons. Figure 4 shows the updated plot of mean XMAX vs logE from this measurement with nowseven years of data [14]. A measurement of mean XMAX vs. logE from hybrid events from theBlack Rock and Long Ridge FD is also shown in Figure 5 [15].
As a complement to the hybrid measurements, TA also made a measurement of XMAX usingstereoscopic events seen in coincidence between the Long Ridge and Black Rock FD stations [16].The average XMAX vs. logE plot from this study is shown in Figure 5. The summary of TA XMAX
measurements is shown in Figure 7(a), where we plot the position of the measured points from
4

PoS(ICRC2015)035
Telescope Array Highlight Charles C. H. Jui
Figure 4: Average XMAX vs. energy for hybrid events collected between 2008 and 2015 from the MiddleDrum FD station, in coincidence with the TA surface array.
Figure 5: Average XMAX vs. energy for hybrid events collected from the Black rock and Long Ridge FDstations, in coincidence with the TA surface array.
5

PoS(ICRC2015)035
Telescope Array Highlight Charles C. H. Jui
the three studies relative to the simulated proton (1.0) and iron (0.0) rails obtained from showerssimulated using the QGSJET-II.3 hadronic model [17].
Figure 6: Average XMAX vs energy for stereo events observed in coincidence between the Black Rock andLong Ridge FD stations.
The three sets of data points are in good agreement with one another as well as a predomi-nately light composition. While the rails used to make Figure 7(a) are based on QGSJET-II.3, theinterpretation of light composition is fairly robust, as illustrated by the scales shown in Figure 7(b).To leading order, the departure of the data points from the proton line is roughly proportional tolnA where A is the nuclear mass number. Even if the scale were set to a hypothetical model that hasa proton rail that is 33% deeper, the data points shown in the plot would only reach that expectedfor helium in this scenario.
TA has recently published a measurement of the inelastic proton-air cross section [18], usingthe hybrid FD data set from the Middle Drum station. The results are summarized in Figure 8 [19].The deep tail of the measured XMAX distribution is fitted to an exponential function in Figure 8(a),yielding a best-fit (negative) exponent of Λ = 50.47±6.26 [stat.] g/cm2, which translates to a resultof σp−air(inelastic) = 567.0± 70.5 [Stat.] (+25,−29) [Sys.] mb. The dominant contributions tothe systematic uncertainty come from model dependence of the Λ exponent in relation to the crosssection, and from the possible presence of ultrahigh energy photons and helium affecting the tail ofthe XMAX distribution. This TA value for the proton-air cross-section appears to be consistent withthe trend seen from previous results, as illustrated in Figure 8(b)
4. Anisotropy
After five years of operations, a hotspot was seen in the arrival direction of TA SD events ofenergies above 5.7× 10¹⁹ eV. This was described in a publication in 2014 [20]. Of the 72 eventsabove this threshold, shown by the blue points in Figure 9, 19 were found within 20◦ of rightascension(α)= 146.7◦ and declination(δ )= 43.2◦, in the vicinity of Ursa Major. The red pointsin the figure show the events collected in the two additional years of data [21]. Four more events
6

PoS(ICRC2015)035
Telescope Array Highlight Charles C. H. Jui
Figure 7: (a) Summary of average XMAX from Telescope Array fractional as the fractional position betweenthe expectations of pure iron (lower lines at zero) and pure proton (upper line at 1.0) using the QGSJET-II.3hadronic model. (b) Illustrative interpretation, in terms of lnA of the summary plot against QGSJET-II.3 anda hypothetical alternative model where the proton rail is about 33% deeper in XMAX .
(three in the sixth, and one in the seventh) were seen inside the original 20◦ circle. With the fullseven years of data, the maximum moved slightly to RA= 148.5◦ and dec= 44.6◦, but now with atotal of 24 events (still 3 and 1 from years 6 and 7, respectively) within 20◦ of this location.
The maximum Li-Ma significance corresponding to excess after seven years is 5.1σ , as shownin Figure 10 [21]. To assess the global significance of this hotspot, one million simulated sets ofexactly 109 events were generated assuming an isotropic source distribution. We searched for anexcess anywhere in the FOV with five radii, 15◦, 20◦, 25◦, 30◦, and 35◦. From these, the chanceprobability of seeing a maximum local excess somewhere in the TA field-of-view was calculatedto be 3.7×10⁻⁴, corresponding to a global significance of 3.4σ .
It has been noted that the number of events in the signal circle occurred at a lower rate inthe sixth and seventh year. The chance probability of observing four or fewer events in the signalcircle over two years given the original 19 over five years is about 20%. Moreover, the histogramshown in Figure 11(a) indicates that the observed distribution of number of signal events per yearis completely consistent with that of a Poisson distribution with a mean of 3.43. The comparisonof the cumulative distribution in Figure 11(b) [21] also shows the observed distribution to be in-compatible with an isotropic background distribution (blue dotted curve: mean = 0.9) at the 2.6σ
level.It is important to note that the hotspot is only found for events in the energy range at and
above the GZK cut-off, but not with lower energy thresholds of 1.0× 10¹⁹ eV or 4.0× 10¹⁹ eV.The hotspot also appears with an angular size of the order of 10◦. Our observations are consistentwith the hypothesis of an extra-galactic flux of protons coming from a single source, or a compactgroup of sources within the GZK horizon of about 100 Mpc. In this picture the CMBR interactions
7

PoS(ICRC2015)035
Telescope Array Highlight Charles C. H. Jui
Figure 8: Plot (a) shows the fit of the tail of the XMAX distribution from the TA Middle Drum hybridFD events data to an exponential function. The resulting slope is used to calculate the inelastic proton-aircollision cross-section. The TA result is shown in plot (b) along with those of previous experiments [19].
8

PoS(ICRC2015)035
Telescope Array Highlight Charles C. H. Jui
Figure 9: Arrival directions, plotted in equatorial coordinates, of TA events with energies above 5.7 ×10¹⁹ eV. The blue points represent the 72 events collected in the first five years of operation [20]. The redpoints represent 37 additional events collected over two additional years [21]. The solid curves indicate thegalactic plane (GP) and Super-Galactic Plane (SGP), and the closed and open stars indicate the Galacticcenter (GC) and the anti-Galactic center (Anti-GC), respectively
Figure 10: Li-Ma excess significance (number of σ ) of local excess in number of events above expectedisotropic background within 20◦ of each spot in the field-of-view of TA for data collected between 2008 and2015. The solid curves indicate the galactic plane (GP) and Super-Galactic Plane (SGP).
9

PoS(ICRC2015)035
Telescope Array Highlight Charles C. H. Jui
Figure 11: (a) Distribution of number of events within 20◦ of (RA, dec) = (148.5◦,44.6◦). The solid lineshows the expectation of a Poisson distribution with a mean of 3.43. (b) A comparison of the cumulativedistribution of number of signal events per year with the prediction (black line) with the expectations for aPoisson distribution (red dashed curve) and an isotropic background distribution with a mean of 0.9. Fromthe maximum deviations the Kolmogorov-Smirnov probabilities for the source model is 1.0, and that for theisotropic model is 5.26×10⁻³ [21]. The latter corresponds to a 2.6σ deviation.
would filter out the background events from more distant sources for energies at or above the GZKcut-off, leaving the image of a local source distribution smeared by magnetic fields.
There are additional indications of departure from isotropy in the highest energy data set (>5.7× 10¹⁹ eV) [22, 23]. Figure 12 shows the result of a search for autocorrelation in the arrivaldirection of events with thresholds of 1.0×, 4.0×, and 5.7× 10¹⁹ eV [23]. The probability ofrandom excesses from isotropic distributions for different separation angles between pairs of eventsare calculated for the actual data. It is clear that a significant excess is seen only for the highestenergy threshold, with a minimum p value of less than 10−3 at an angular scale of about 25◦.
Significant departures from isotropy are also seen in the histogram of events in plotted inright-ascension(RA)/declination(dec) or in supergalactic longitude/latitude [23]. Figure 13 showsexcesses at about the 2σ level in all four variable. The data in blue are compared with a simulationof isotropic source distributions in red, using the Kolmogorov-Smirnov test for compatibility. Theresulting p values again depart from isotropy at about the 2σ level. Similar comparisons at lowerenergy thresholds showed no significant departures from isotropy.
It is interesting to note that the bin excesses in Figure 13 appear most significant in the super-galactic latitude. This observation suggests the possibility that the excess may be correlated withthe local large-scale structure (LSS) of galaxies, which are concentrated around the Super-GalacticPlane (SGP). The hotspot shown in Figure 10 also lies close to the SG plane.
A more direct test of this hypothesis was made using the TA SD data [22, 23]. Using the2MASS Red Shift Catalog, we simulated the arrival directions of cosmic ray protons with E >
5.7× 10¹⁹ eV, accounting for flux attenuation from propagation through the cosmic microwavebackground radiation, and where stochastic effects of magnetic deflection is simulated using angu-
10

PoS(ICRC2015)035
Telescope Array Highlight Charles C. H. Jui
Figure 12: Probability of random excess of pairs of TA events (seven years) vs. separation angle δ atenergies above 1.0×, 4.0×, and 5.7×10¹⁹ eV.
Figure 13: Histograms of TA SD events recorded from 2008 to 2014 in Right-Ascension (top-left), dec-lination (top-right), supergalactic longitude (bottom-left) and latitude (bottom-right). The data are shownin blue points overlaid with isotropic simulations. The Kolmogorov-Smirnov probabilities comparing datawith simulation are shown with each plot.
11

PoS(ICRC2015)035
Telescope Array Highlight Charles C. H. Jui
lar smearing. The final distribution is also convolved with detector exposure over the data collectionperiod. An example of such a density distribution generated using a smearing angular scale of 6◦ isshown in Figure 14, where the white dots show the arrival directions of the TA SD events collectedfrom 2008 to 2015 previously shown in Figure 9.
Figure 14: (a) Density of expected arrival distribution for events above 5.7 × 10¹⁹ eV. The simulationassumed cosmic ray protons that originate uniformly from the local distribution of matter (2MASS GalaxyRed Shift Catalog). A smearing angle of 6◦ is used in this map. UM–Ursa Major; Co–Coma; V–Virgo;PP–Perseus-Pisces.
Density distribution were generated from both the LSS model and an isotropic model forthreshold energies of 1.0×, 4.0×, and 5.7× 10¹⁹ eV, each repeated for smearing angles between2◦ and 31◦ in 1◦ increment. Using the Kolmogorov-Smirnov test, the distribution of density valuesfrom arrival directions of data events is compared to those obtained from these simulations. For thetwo lower energy thresholds, the data cannot distinguish between the LSS structure and isotropy.However, at above 5.7× 10¹⁹ eV, the LSS model is clearly preferred for smearing angles greaterthan 5◦, as shown in Figure 15.
5. Summary
TA has measured the energy spectrum, composition and arrival direction of UHE cosmic rayssince 2008. The energy spectrum and composition of UHE cosmic rays measured by TA are com-patible with a single light component at above the ankle (6× 10¹⁸ eV). The new TA Low EnergyExtension (TALE) is now coming on line, and has already extended the TA energy spectrum tobelow 1016 eV. We have reported a hot spot seen in the direction of Ursa Major with 3.4σ signifi-cance, but much more data is needed. This find has prompted TA to propose a major upgrade thatwill expand the coverage area of TA to four times that of the existing array (TA×4) [24]. Fundingfor the additional surface detectors has already been funded by the government of Japan, and theU.S. part of the TA collaboration has submitted a proposal to augment the fluorescence detectors
12

PoS(ICRC2015)035
Telescope Array Highlight Charles C. H. Jui
Figure 15: Kolmogorov-Smirnov p-values plotted against smearing angle for TA data 5.7× 10¹⁹ eV col-lected from 2008 to 2015 compared against the density distributions generated from LSS source model(green "X" marks) vs. that for an isotropic source model (blue asterisks). The LSS model is preferred overthat of the isotropic for smearing angles larger than about 5◦
to cover all of the new surface array. By 2020, we will have collected the equivalent of about 20years of TA data.
Acknowledgments
The Telescope Array experiment is supported by the Japan Society for the Promotion of Sci-ence through Grants-in-Aids for Scientific Research on Specially Promoted Research (21000002)"Extreme Phenomena in the Universe Explored by Highest Energy Cosmic Rays" and for Scien-tific Research (19104006), and the Inter-University Research Program of the Institute for CosmicRay Research; by the U.S. National Science Foundation awards PHY-0307098, PHY-0601915,PHY-0649681, PHY-0703893, PHY-0758342, PHY-0848320, PHY-1069280, PHY-1069286, PHY-1404495 and PHY-1404502; by the National Research Foundation of Korea (2007-0093860, R32-10130, 2012R1A1A2008381, 2013004883); by the Russian Academy of Sciences, RFBR grants11-02-01528a and 13-02-01311a (INR), IISN project No. 4.4502.13 and Belgian Science Policyunder IUAP VII/37 (ULB). The foundations of Dr. Ezekiel R. and Edna Wattis Dumke, WillardL. Eccles and the George S. and Dolores Dore Eccles all helped with generous donations. TheState of Utah supported the project through its Economic Development Board, and the Univer-sity of Utah through the Office of the Vice President for Research. The experimental site becameavailable through the cooperation of the Utah School and Institutional Trust Lands Administra-tion (SITLA), U.S. Bureau of Land Management, and the U.S. Air Force. We also wish to thankthe people and the officials of Millard County, Utah for their steadfast and warm support. Wegratefully acknowledge the contributions from the technical staffs of our home institutions. Anallocation of computer time from the Center for High Performance Computing at the University ofUtah is gratefully acknowledged.
13
PoS(ICRC2015)035
Telescope Array Highlight Charles C. H. Jui
References
[1] T. Abu-Zayyad et al. (TA Collaboration), Astrophys. Journal Letters 768, L1 (2013).
[2] D. Ivanov for the TA Collaboration, in proceedings of the 34th ICRC, Pos(ICRC2015)349 (2015).
[3] T. Fujii for the TA Collaboration, in proceedings of the 34th ICRC, Pos(ICRC2015)320 (2015).
[4] Z. Zundel for the TA Collaboration, in proceedings of the 34th ICRC, Pos(ICRC2015)445 (2015).
[5] T. Abu-Zayyad for the TA Collaboration, in proceedings of the 34th ICRC, Pos(ICRC2015)422(2015).
[6] K. Greisen, Phys. Rev. Lett. 16, 222 (1966).
[7] G.T. Zatsepin and V.A. Kuz’min, JETPL 4, 78 (1966).
[8] V. Berezinsky, A.Z. Gazizov, and S.I. Grigorieva, Physics Letters B 612, 147 (2005).
[9] D.R. Bergman and J.W. Belz, J.Phys. G34, R359 (2007).
[10] W.D. Apel et al. (KASCADE-Grande Collaboration) Astropart. Phys. 36, 183 (2012).
[11] M.G. Aartsen et al. (IceCube Collaboration) Phys. Rev. D 88, 042004 (2013).
[12] E. kido for the TA Collaboration, in proceedings of the 34th ICRC, Pos(ICRC2015)258 (2015).
[13] R.U. Abbasi et al. (TA Collaboration), Astropart. Phys. 64, 49 (2015).
[14] J.P. Lundquist for the TA Collaboration, in proceedings of the 34th ICRC, Pos(ICRC2015)441(2015).
[15] D. Ikeda, W. Hanlon for the TA Collaboration, in proceedings of the 34th ICRC,Pos(ICRC2015)362 (2015).
[16] T. Strohman and Y. Tameda for the TA Collaboration, in proceedings of the 34th ICRC,Pos(ICRC2015)361 (2015)
[17] J.W. Belz for the TA Collaboration, in proceedings of the 34th ICRC, Pos(ICRC2015)351 (2015).
[18] R.U. Abbasi et al. (TA Collaboration), Phys. Rev. D 92, 032007 (2015).
[19] R.U. Abbasi and J.W. Belz for the TA Collaboration, in proceedings of the 34th ICRC,Pos(ICRC2015)402 (2015).
[20] R.U. Abbasi et al. (TA Collaboration), Astrophysical Journal Letters 790, L21 (2014).
[21] K. Kawata for the TA Collaboration, in proceedings of the 34th ICRC, Pos(ICRC2015)276(2015).
[22] T. Abu-Zayyad et al. (TA Collaboration), Astrophysical Journal 777, 88 (2013).
[23] P. Tinyakov, H. Sagawa, and I. Tkachev for the TA Collaboration, in proceedings of the 34th ICRC,Pos(ICRC2015)326 (2015).
[24] H. Sagawa for the TA Collaboration, in proceedings of the 34th ICRC, Pos(ICRC2015)657(2015).
14